Article

Long Term Effects of Ploughing and Conservation Tillage Methods on Earthworm Abundance and Crumb Ratio

1
Institute of Crop Production Sciences, Szent István University, H-2100 Gödöllő, Hungary
2
Institute of Environmental Sciences, Szent István University, H-2100 Gödöllő, Hungary
3
Department of General Agronomy, Faculty of Agriculture, University of Zagreb, 10000 Zagreb, Croatia
*
Author to whom correspondence should be addressed.
Submission received: 10 September 2020 / Revised: 7 October 2020 / Accepted: 9 October 2020 / Published: 12 October 2020

Abstract

:
In addition to the dry (D) and rainy (R) seasons, a combination of the two i.e., rainy-dry (RD) and dry-rainy (DR), can also be observed in one year. The effects of the dry (D) and rainy (R) on soil are known, hence we hypothesized that the effects of the rainy-dry (RD) and dry-rainy (DR) periods on soil may differ from the former assessments. The aim of the study is to investigate the effect of six tillage treatments (ploughing—P, disk tillage—DT, loosening—L, tine tillage (a deeper—T and a shallower—ST) and no-till—NT) on earthworm abundance and crumb ratio during a long-term research (16 years) on Chernozems. The results related to the four year-groups (D, R, RD, and DR) with different residue cover. Seven degrees of cover ratio (between 12.5% and 62.5%) were selected on stubbles. Higher cover ratio (≥52.5%) improved water conservation, increased earthworm abundance (31 and 41 ind m–2) and crumb (78 and 82%) ratio (p < 0.01). R year came first in the rank of water content and earthworm abundance and DR proved to be more favorable for crumb formation. Considering the rank of soil tillage treatments, ST takes first place in evaluation of soil water content (SWC) and crumb ratio, and NT for earthworm abundance.

1. Introduction

The soil quality is a fundamental factor in sustainable land management [1]. However, the environmental condition of the soil is directly or indirectly affected by soil tillage [2,3]. The adverse effect of ploughing on soil condition is known from the literature [4,5], where authors frequently report negative impacts on deteriorated soil [6,7]. In spite of this, extreme weather modifies the soil tillage objectives [8]. Present experiences reveal that at extreme weather conditions the planned depth of the loose layer may fulfil, but the size and distribution of the soil crumbs influenced by tillage induced biological activity, fall behind the optimum [9] and earthworm abundance decreases [10]. Relevant publications stated the most important findings in the role of the earthworms and outlined their importance in soil biological activity and the ecosystem services [4,11,12]. Authors referred to the quality of habitat, e.g., soil looseness or structure, temperature, water content, shading of surface, and supplying with food material [13,14]. Evaluation of the relationships among tillage, soil condition, and earthworm abundance has been widely published [4,10,11,14,15], but it is needed to highlight that year weather effects in long-term experiments on their habitat required more knowledge. Pelosi et al. [14] suggested long-term measurements (≥15 years) of the earthworm abundance, including site, climate, soil tillage, and other important factors. The effect of D and R weather on the soil is mostly known [16], however, the effect of a combination of these two—RD and DR in the same year—was less studied in soil tillage research. The D period, which quickly replaces the R period, and the R period, which replaces the D period without transition can have unpredictable effects on the soil environment because of the different effects of the two phenomena [13,17]. Monitoring the impact of rapidly changing climate phenomena on soil is a new research challenge. For this reason, management solutions that increase the level of soil protection even in difficult situations deserve special attention [18]. Covering the soil surface and maintaining the favorable soil environment can be considered as a primary method of soil protection [19]. Knowledge about the protective effect of soil cover at the events of rapid weather changes within a given year is somewhat incomplete. Therefore, to extend the investigation to specific, two-phase years (DR and RD) was considered to be essential.
Although soil conservation tillage systems have been widely investigated on different environments, relatively fewer trials were conducted to study the earthworm abundance and crumb formation in the event of rapid changes of the climate phenomena. Therefore, this study can be classified as novel. The aim of the present study is to investigate the earthworm abundance and the ratio of crumbs in four year-groups (D, R, RD, and DR) at different soil water contents (SWC) and surface protection degrees.

2. Materials and Methods
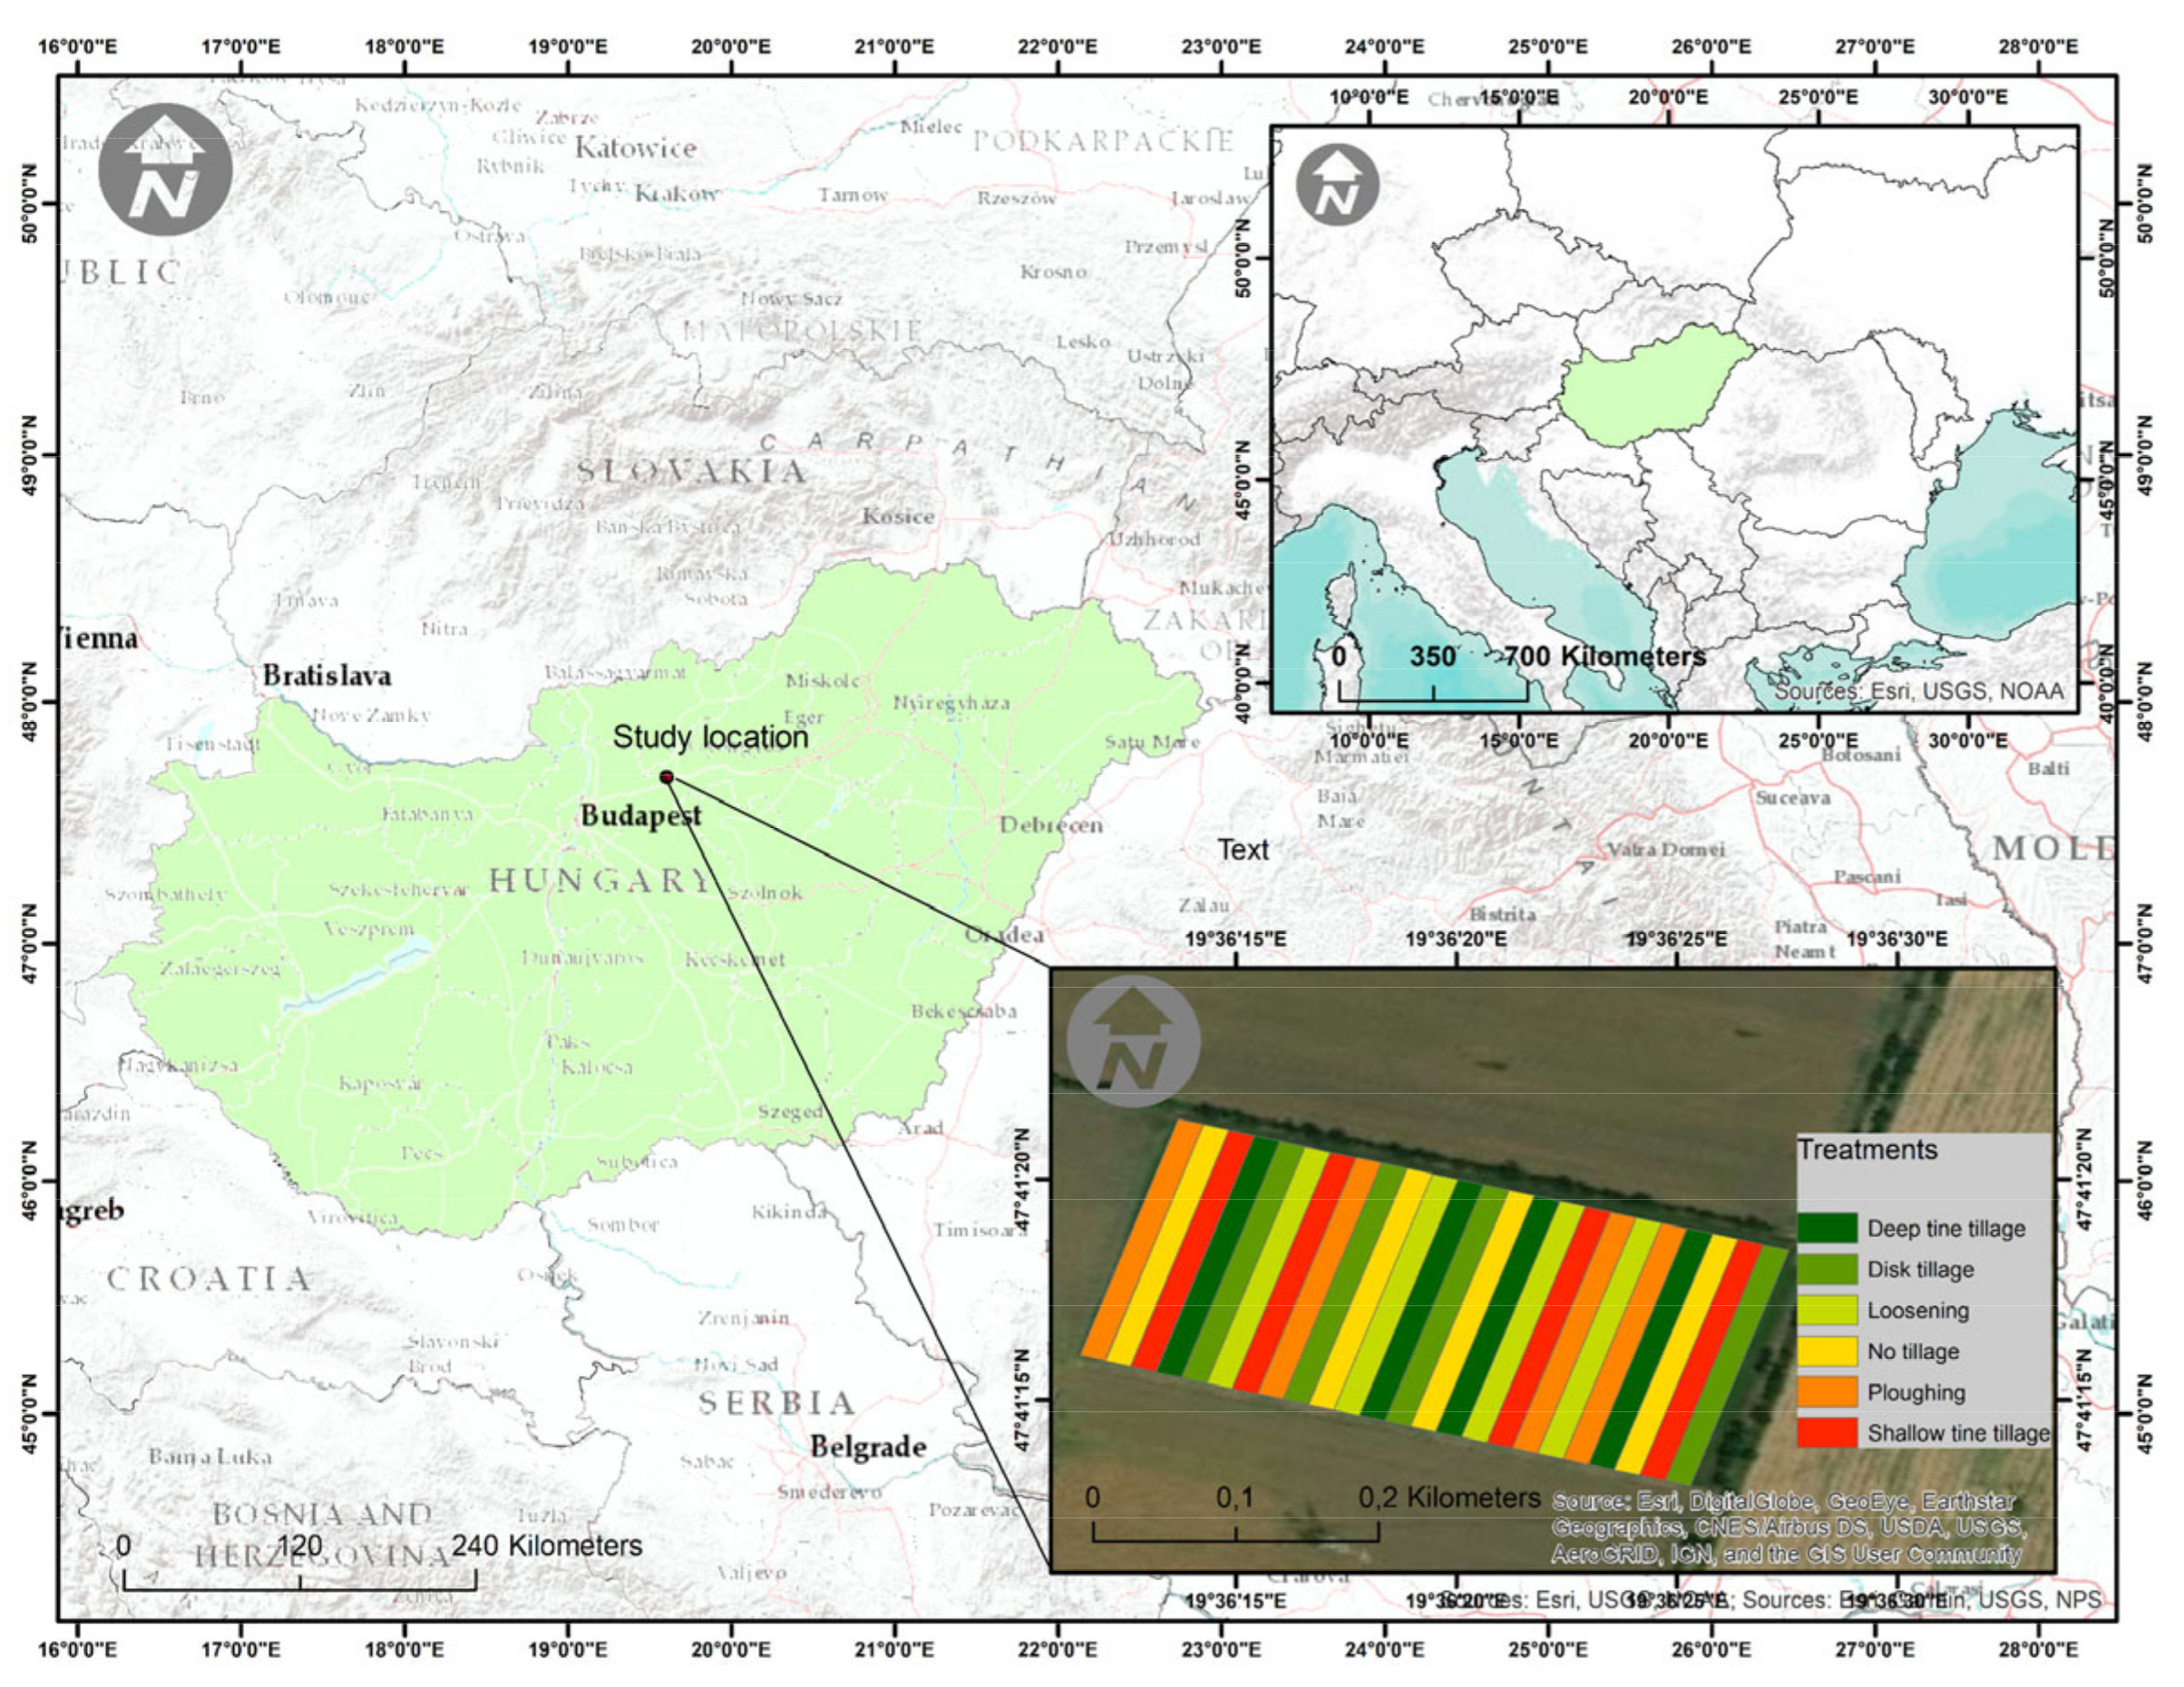
2.1. Study Site

The study site is located at Józsefmajor Experimental and Training Farm of Szent István University (47°41′30.6″ N and 19°36′46.1″ E; 110 m a.s.l.), nearby the town, Hatvan, NE from Budapest, established in 2002. The research area covers 5.5 ha. The terrain is flat, with a soil of a clay-loam texture, Endocalcic Chernozems, loamic [20], a humus content of 3.12%; the sand, silt, and clay contents of the top 20 cm layer are 10%, 54%, and 36%, respectively [21]. The soil has a slightly acidic reaction pH (H2O) of 6.2 and pH (KCl) of 5.1 when all treatments and depths are considered. The one-factorial experiment was arranged in a randomized block design with four replicates. Plot size was 13 m × 180 m (Figure 1).

2.2. Evaluation of Seasons

The climate conditions were measured at the weather station of the Training Farm. There is no local data from the first half year of 2002. The multi-year precipitation average (1965–2005) of the precipitation is 560 mm. According to this, 2007 was considered as average (545 mm). The total rainfall in 2015 was 560 mm, but 458 mm fell in the second part of the year, hence that was classified as DR year. The year 2019 was also left out of the assessment as it could be divided into four different weather periods. Regarding the amount of precipitation, four seasons were D, five seasons were R, and three were RD and DR (Figure 2). In addition to multiyear average, the precipitation deficit varied between 81 and 266 mm in the D seasons (in average 182 mm). However, in R seasons, the surplus ranged from 145 to 402 mm (in average 234 mm). Precipitation shortage and surplus in the RD and DR seasons were between −35 and +81 mm in RD and 0–107 in DR years. Extreme rainfall distribution was observed in all types of seasons, including rainy winters and spring, summer and autumn but also vice versa.

2.3. Soil Water Content Determination

Soil water content (SWC) was measured at increment of 5 cm to a depth of 40 cm in four repetitions in each plot. Measurements were taken in 30-day intervals between March and November. Soil water content was determined by PT-I type gauge (Kapacitiv Kft, Budapest, Hungary), based on a time domain reflectometry (TDR) principle. The LCD display of the instrument shows the moisture content in terms of water by weight, w/w−1. The given soil is categorized as dry, humid, or wet when its water content ranges between 14.8–18.9, 19.0–23.9, and >24.0 SWC, respectively [22].

2.4. Tillage Treatments

Six tillage treatments were applied, i.e., loosening (L, 40–45 cm), ploughing (P, 28–32 cm), tine tillage (a deeper T, 22–25 cm, and a shallower, ST, 18–22 cm), disk tillage (DT, 12–16 cm), and no-till (NT). Vogel&Noot TerraDig (300), Kverneland LM 100 + Packomat, CLCpro 300, and Väderstad Carrier 500 were used for subsoiling, ploughing, tine tillage, and disk tillage, respectively. Sowing machines were Väderstad Rapid 300 C or Kuhn Maxima 6. Primary tillage was applied in accordance with the soil workability, except for two autumnal wet seasons (in 2015 and 2016). Primary and secondary tillage was carried out in a single pass for cereals and for soybean, and seedbed preparation was applied for maize and sunflower respectively.

2.5. Crop Sequence

Crop sequence was planned for soil quality improvement and suppression of weeds [23]. Crops sown from the start of the experiment were: white mustard (2002), winter wheat (2002/03), rye (2003/04), pea (2004), winter wheat (2004/05), white mustard (2005), winter wheat (2005/06), phacelia (2006), maize (2007), sunflower (2008), winter wheat (2008/09), white mustard (2009), maize (2010), spring oat (2011), winter wheat (2011/12), spring barley (2013), sunflower (2014), winter wheat (2014/15), maize (2016), winter oat (2016/17), soybean (2018) and winter wheat (2019), thus, narrow-row crops dominated in the crop sequence.
Nitrogen was applied for crops at a rate of 100 kg N ha−1 in two doses, while phosphorus and potassium at 100 P2O5 kg ha−1 and 50 K2O kg ha−1, respectively.
Crop residues were chopped and spread in a single pass during the harvest. Soils after harvest remained undisturbed until primary tillage in order to conserve water. Post-emergence herbicide was used during April, while a direct chemical treatment was applied in cereal stubbles at the end of August.

2.6. Surface Cover Ratio

Surface cover was evaluated after sowing and on their stubbles, as well as after sowing of wide-row crops and on their stubbles in four (D, R, RD, DR) seasons, using a quadrate device (0.25 × 0.25 m), for additional image processing in GIS software (area delineation and calculation of covered area ratio). Cover ratio of stubble residues after harvest and sowing is presented in Table 1. Selecting cover ratios from low (12.5%) to favorable (52.5% and 62.5%) levels was possible both in cereals and wide-row crop stubbles, and it gave a chance to study earthworm abundance and crumb ratio.

2.7. Earthworm Abundance

Time of the assessment corresponded to the time of further measurements (SWC, crumb). The temperature was found to be adequate (in March, July, August, October, and November) and optimal (14–24) in April, May, June, and September for earthworm activity. The number of earthworms was calculated to a unit area (1 m2) to the depth of 0–20 cm after excavating and screening a certain volume of soil (20 × 20 × 20 cm) by hand-sorting in situ in all plots in four replicates according to the ISO Standards [24]. The duration of hand sorting lasted about 20–30 min, depending on the physical status of the soil. The locations among replicates were chosen randomly and the distance between soil blocks was about 5–10 m. The earthworm abundance at 0–20 cm depth was expressed in individual per square meter (ind m–2).

2.8. Soil Crumb Ratio

Crumbs in the Hungarian soil physics categorization system [25] are defined as soil aggregates ranging from 0.25 to 10 mm in diameter, of which those falling in the range of 0.25–2.5 mm qualify as small crumbs and <0.25 mm as dusts. Sampling was carried out to the depth of 0–20 cm (harmonizing with the earthworm abundance). The soil samples were air-dried and then they were gently sieved manually (60 shakes/min). The mass distribution between the crumb sizes was also established.

2.9. Statistical Analyses

A one-way between subjects, ANOVA was conducted to compare the effect of tillage treatments in different years (D, R, RD, and DR) and at crop sites (under cereal and wide row crops and their stubbles) on earthworm abundance (ind m−2) and crumb ratio (%). ANOVA was performed at p = 0.05 level of significance to determine whether the treatments were different. Post-hoc comparisons using the least significant difference (LSD) test were made at p < 0.05 and p < 0.01, respectively. Analyzing the parallel effect of the SWC, earthworm abundance, and crumb ratio at different surface cover a linear regression analysis was used to determine the correlation coefficient (using Microsoft Excel 365 for education, Szent István University, Gödöllő, Hungary). The significance of the correlation coefficients was checked based on the empirical significance levels (p-values). The significance levels used in the statistical studies were 5% and 1%, respectively. For the statistical evaluation of our results we used the Explore and ANOVA modules of the IBM SPSS Statistics for Windows, version XX (IBM Corp., Armonk, NY, USA).

3. Results

3.1. Soil Water Content

The SWC was 21.5 w/w−1 in an average year (2007), harmonizing with the water content optimum. Rank of the tillage in 2007 was as follows: ST = L > T > NT > DT > P, indicating a significantly lower SWC at P than other treatments.
Data of SWC for four type of seasons are presented in Table 2. Significant differences among tillage treatments (p < 0.01) in SWC was determined at each type of seasons. However, no significant differences were assessed between P and DT plots, with exception of RD seasons. Rank of the tillage was as follows: ST = T > L > NT > P > DT. SWC values were significantly higher at moderated soil disturbance (ST, T, and NT) by 6% compared to the inverted soil (P). The main SWC mean for the whole multi-year average different year-groups was 25.0 w/w−1, with an average of 26.0 w/w−1 in the R and DR seasons, 25.0 w/w−1 in the RD seasons, and 21 w/w−1 in the D seasons. In ranking of treatments, tine tillage (ST and T) was ranked first in 9 years and loosening (L) in 6 years. SWC in the D seasons measured at NT treatment was similar to the P and DT treatments.
Data of SWC at four type of seasons and different crop sites are presented in Table 3. The average SWC reached 24.4 and 25.7 w/w−1 under cereals and wide crops, respectively. There were significant differences (p < 0.01) between SWC values measured under crops and crop stubbles between ST, T, L and other treatments. The SWC at P and DT treatments remained significantly lower.
Cereal and wide row crop stubbles (25.9 and 26.1 w/w−1) showed significantly higher SWC, than at other crop sites. The decreasing trend of SWC between tillage treatments under stubble of the cereals and the wide row crop stubbles was similar, ST > NT > T > L > DT > P, indicating that the moderately disturbed soil (ST, T, L, and NT) had a permanently better state for water retention.
The surface cover values measured on stubbles over the years are shown in Figure 3. The proportion of cover ratio on the stubbles significantly (p < 0.01) affected the SWC values. An incomplete cover (≤22.5%) promoted lower and an optimal cover (≥32.5%) induced higher SWC retention in soils. Lower residue mass formed at poorer crop growth (at P, DT), and higher at favorable crop development at NT, ST, T and L treatments. The correlation coefficient (R2 = 0.9531) shows a significantly positive relationship between surface cover and SWC, from which the significance of stubble surface cover can be stressed. Achieving at least 30% surface cover after sowing was an important goal, and it was influenced by several factors i.e., amount of straw, straw, and stalk and due to mixing effect of tillage tools.

3.2. Earthworm Abundance at Different Soil Condition and Seasons

High earthworm abundance (29 and 35 ind m−2) was assessed at T, ST, L, and NT treatments in an average year (2007) to a depth of 0−20 cm soil layer. Rank of tillage in 2007 was as follows: T > ST > L > NT > P = DT. Earthworm abundance at four year-groups is presented in Table 4 which does not include data of average year.
Rank of the type of seasons was in decreasing tendency: R > DR > D > RD indicating low abundance of earthworms was in D and RD seasons (20 and 18 ind m−2). When the D, R, and RD seasons were evaluated separately, weak significant differences were found in the earthworm abundance between tillage treatments. In contrast, significant differences (p < 0.01) were found between tillage treatments in DR seasons. There was a higher difference found between NT (50 ind m−2) and other treatments (between 7 and 39), which confirms again the suitability of the preserved soil state for earthworm habitat. At the same time, a moderated soil disturbance (at ST and T) may also create an appropriate habitat for earthworms (39 and 25 ind m−2). Ploughed soil (P) proved to be the worst habitat in D and DR years (12 and 7 ind m−2). Rank of the tillage treatments was in decreasing tendency: NT > ST > T > L > DT > P that is differed from the rank that was found in average year. Different crops also affected the earthworm abundance (Table 5).
The earthworm abundance was higher (28) under cereals because of better cover, and slightly lower (24) under wide row crops. There was significantly higher abundance (27−37 ind m−2) at NT, ST, and T treatments under crops in any seasons, compared to the DT and P treatments (13 and 21 ind m−2). The earthworm abundance varied between 13 and 34 ind m−2 and that was higher at the NT, ST, and T treatments, moderate at L, and low at the P and DT treatments. In wide row crop stubbles higher abundance (30 and 28) was found at NT and ST treatment and lower (10 and 15) in P and DT soils. Based on the earthworm abundance, the suitability of the stubble habitat could also be proved. More favorable habitats were found in the minimally disturbed soil (NT) and the well covered cereal fields (NT, ST, and T).
The earthworm abundance was positively affected by both the increase in surface cover and the SWC (Figure 4). Less abundance (≤21 ind m−2) was assessed at poorer surface cover (≤22.5%) and lower SWC (<21 w/w−1). These conditions were found in soils at short of stubble residues and when clean surface (e.g., at P) was exposed to the weather phenomena.
Earthworm abundance showed upward tendency when soil surface cover changed from the poor (12.5%) to the optimal (≥42.5%) ratio and parallel when the SWC values were also increased. The correlation coefficients (R2 = 0.9559 for earthworms and 0.9914 for SWC) proved strong significant relationships between evaluated factors.

3.3. Crumb Formation at Different Soil Condition and Four Seasons

Ratio of crumbs (0.25−10 mm) reached 77% in an average year, and corresponded to the quality classification of domestic soils [24]. Rank of the tillage treatments in average year was in decreasing tendency: ST > T > NT > L > DT > P. Similar rank was found by assessing the seasons impact on soil crumb formation (Table 6), with significant differences (p < 0.01) between ST and T and other treatments. Evaluating the seasons DR and RD proved to be more beneficial on crumb formation compared to R and D seasons. These findings indicate the effectual crumb preservation by ST, T, NT, and L treatments at two types of seasons. A new question was which tillage treatment may preserve an adequate crumb ratio (65%) at two weather extremes i.e., in the D and R seasons. Results of the observations and measurement proved the advantage of the ST, T, L, and NT and poorer suitability of the P and DT treatments. Rank of the season groups was: DR = RD > R > D, demonstrating the crumb preservation in DR and RD and crumb deterioration in R and D seasons.
Different agronomical conditions were peculiarly affected the crumb formation (Table 7).
A crumb ratio of 63−79% was measured under cereals and 73–81% under cereal stubbles depending on the treatments. However, that was 61−75% under wide row crops and 69−78% under their stubbles. The advantage of ST, T, L, and NT treatments were observed under cereals and wide row crops, where ratio of crumbs reached 74% or higher. The high crumb ratio measured in the stubble soils (73 and 81% at cereals and 69 and 75% at wide row crops) confirms the importance of the stubble phase in the remediation of the soil structure. Evaluating the treatments considering to the agronomical conditions, weaker (p < 0.05) significant differences were found under cereals and wide row crops and stronger (p < 0.01) under cereal stubbles; however, the examination of wide row crop stubbles did not indicate significant differences.
Figure 5 presents the relation of crumb ratio, the SWC and earthworm abundance under different surface cover.
SWC, crumb ratio and earthworm abundance proved close correlation (p < 0.01) with the ratio of surface cover, and that was confirmed by correlation coefficients (≥0.96, Figure 5). It may be noted that the SWC varied between 19 and 27 w/w−1, i.e., it ranged from humid through favorable to the wet state. A better surface cover (≥42.5%) preserved higher SWC (≥21 w/w−1) and crumb ratio (≥70%), and at the same time it provided a better habitat for earthworms (≥28 ind m−2).

4. Discussion

4.1. Soil Water Content at Different Soil Tillage Treatments and Type of Seasons

According to the classic theory, the optimum water content means a soil state that produces the slightest damage during soil physical disturbance and promotes optimal crumb formation. This statement is recited in some papers [7,26]. Rank of the tillage treatments stated that moderated soil disturbance by NT, ST, and T coupled with surface cover may increase SWC. Among others Palm et al. [12] reported favorable water retention and overall soil state, both in reduced tillage and NT. No-till treatment showed acceptable SWC during the years, however values were lower, compared to the ST and T treatments. In this context, Powlson et al. [27] pointed out that NT had a positive effect on soil quality and climate change adaptation while its role in water conservation is overestimated. This may be due to the specific soil structure formation in NT soils [2]. However, most of the authors found higher SWC in no-till soils [2,4,28,29]. Water content, measured in stubble soils were higher than soil under crops, confirming the fact, that stubble phase plays important role in water preservation. Moreover, Kalmár et al. [30] observed an effective water retention in soil under 55% and 75% cover ratios. Reviewing the literature concerned, the ratio of surface cover was found to be a key factor in reduction water loss from soil [31,32,33,34]. It was found, that an incomplete cover (≤22.5%) promoted lower meanwhile optimal cover (≥32.5%) induced higher SWC retention in soils. This finding corresponds to assessments by Gyuricza et al. [6] who outlined that optimal surface cover significantly decreased the soil vulnerability. Considering the weather phenomena, soil and water conserving surface cover might have increasing importance in the future.

4.2. Earthworm Abundance at Different Soil Condition and Year-Groups

Favorable earthworm abundance (28 ind m−2) was assessed in an average year (2007) to a depth of 0‒20 cm, because of favorable soil condition and harmonized water content. NT soil showed a poorer habitat in the 6th year (2007) of the experiment in contrast to latter years, when soil condition became more favorable. Condition of NT soils has usually improved in the fields where this management has had long-term adaption [35,36]. This issue has become a task to be examined from the beginning [37] to nowadays [14,38]. In the short-term NT experiments, the more favorable water content coupled with surface cover provides a good habitat [13], however, in the long-term, the more favorable soil condition contributes to the improvement of the habitat [4,11]. Presence of food material is found to be an indispensable factor of the earthworm habitat [11] which may confirm values of the stubble residues in variable site conditions [14]. Johnston et al. [15] called attention to the adverse effect of some tillage managements by destroying burrows and habitats.
Evaluation of the seasons helped to establish new insights. Earthworm abundance declined in D seasons, because of deterioration of habitat. Briones and Schmidt [11] found similar, reviewing papers in number and stated population dynamics at different seasonal variations. Dry periods and dry soils were usually proved to be unfavorable considering the low SWC [39,40]. However, new insights show that RD period also deteriorates the habitat. With the help of the meta-analysis, Briones and Schmidt [11] stated positive responses of earthworms to reduced tillage either in rainy areas or sites with low precipitation. The optimal water content in R years usually generates favorable habitat [11], however the abundance barely lagged behind this in the DR years, when dry conditions are replaced by wetter conditions. From the point of tillage managements, NT provided the best habitat, ST and T showed good, L provided medium, DT and P gave poorer habitat for earthworms. This finding is in harmony with data published by many authors [4,14,15]. Johnston et al. [15] suggested that foreseeing strategies to mitigate climate extremes impacts on soil health in agroecosystems should focus on rationalizing tillage intensity and retaining stubble residues at the soil surface. Assessing the earthworm abundance under crops and crop stubbles, a more suitable habitat was proved in stubble soils. This finding is related to the higher SWC and optimal habitat [10,41]. More favorable habitats were found in the minimally disturbed soil (NT) and moderately disturbed soils (ST, T) with favorable (≥32.5%) surface cover. As Chan [13] stated, the effect of tillage on earthworm abundance depends on several human induced factors, like tillage equipment, depth, intensity, tillage time and further environmental factors, including SWC, weather conditions during tillage treatments, soil types, texture etc. It may be noted that weather conditions may influence the quality of habitat during the growing season and stubble phase.

4.3. Crumb Formation at Different Soil Condition and Type of Seasons

Ratio of crumbs reached 77% in an average year (2007), and corresponded to the quality classification of domestic soils [24]. Similar favorable crumb ratio can be achieved by soil conservation tillage [7,19,33,38,42] and at adequate surface cover, since it is known that proportion of the surface cover has become a key factor for soil conservation [37]. This is proven by present results where an insufficient surface cover (≤22.5) was found to be unsuitable for soil and crumb protection (Figure 5). Kalmár et al. [30] found high crumb ratio in soil, where cover ratio reached higher (≥55%) values and very poor crumb formation in bare surface. A specific question was which tillage treatment may preserve an adequate crumb ratio (65%) at two weather extremes i.e., in the D and R years. The observations proved the advantage of the ST, T, L, and NT and poorer suitability of the P and DT treatments. Gyuricza et al. [6] found that soil state defects that are formed in dry period result in even more serious deterioration in the next rainy season. In our case, the opposite also occurred, that is crumb formation after stopping the dry period. According to Gyuricza et al. [6] structure degradation that tends to occur during wet season will result in increased crumb reduction if it is followed by a dry year. This finding is in harmony with our assessments concerned to the RD years. The high crumb ratio measured in the stubble soils (73 and 81% at cereals and 69 and 75% at wide row crops) confirmed the importance of the stubble phase in the remediation of the soil structure. We may stress the importance of the stubble phase for soil regeneration including crumb formation. In this context Kalmár et al. [30] outlined that the period after summer harvest is growing increasingly critical from the aspect of the soil preservation. In our study a better surface cover (≥42.5%) in stubbles provided optimal SWC (≥21%) and crumb ratio (≥70%), and due to these, a good habitat for earthworms (≥28 ind m−2).

5. Conclusions

The preliminary hypothesis that the effects of the DR and RD on the soil may differ from the assessments considered for the D and R was proved.
SWC highly influenced the two examined factors and was in harmony with the years. Rank of the year-groups, that is R = DR > RD > D indicates that DR and RD play important roles in soil condition evaluation in the future and needs to be deeply evaluated in different environments. In evaluation of SWC, results indicate that moderately disturbed soil had permanently better state for water retention.
Abundance of earthworms showed sensitivity to the SWC and soil condition. Rank of the year-groups, that are R > DR > D > RD demonstrated that DR period may provide similarly favorable habitat as in the R years, while RD periods unfavorably deteriorate the habitat. NT provided the best, ST and T showed good, L provided medium, DT and P gave poorer habitat for earthworms.
Evaluating the crumb ratio, DR and RD periods preserved, while R and D years deteriorated crumbs. Tillage treatments showed advantage of the ST, T, L, and NT and the poorer suitability of the P and DT in crumb preservation.
It can be concluded that recognizing the effects of weather phenomena on soils can facilitate the implementation of protection.

Author Contributions

The authors have contributed equally to the field assessment. Conceptualization, I.D., I.B., K.K., Z.K. and M.B.; Data curation, I.K.; Formal analysis, I.B., I.K. and K.K.; Funding acquisition, M.B.; Investigation, I.D., B.S., I.K. and M.B.; Methodology, I.D., I.B., I.K., K.K. and Z.K.; Resources, I.D., B.S., I.K., Z.K. and M.B.; Software, I.D. and I.B.; Supervision, I.K.; Validation, I.D., K.K. and M.B.; Visualization, I.B., K.K. and Z.K.; Writing—original draft, I.D., B.S., I.B., Z.K. and M.B.; Writing—review & editing, B.S., I.K., K.K., Z.K. and M.B. All authors have read and agreed to the published version of the manuscript.

Funding

This research received by external funding, see the Acknowledgements.

Acknowledgments

This research was supported by the Higher Education Institutional Excellence Program (1783-3/2018/FEKUTSTRAT) awarded by the Ministry of Human Capacities within the framework of water related researches of Szent István University. This research was also supported by the Higher Education Institutional Excellence Program (NKFIH-1159-6/2019) awarded by the Ministry for Innovation and Technology within the framework of water-related research of Szent István University. The publication is supported by the EFOP 3.6.3-VEKOP-16-2017-00008 project. The authors would like to thank the valuable help with field works for GAK Kft. Gödöllő.

Conflicts of Interest

The authors declare no conflict of interest.

References

  1. Doran, J.W.; Zeiss, M.R. Soil health and sustainability: Managing the biotic component of soil quality. Appl. Soil Ecol. 2020, 15, 3–11. [Google Scholar] [CrossRef] [Green Version]
  2. Mielke, L.N.; Doran, J.W.; Richards, K.A. Physical environment near the surface of plowed and no-till soils. Soil Tillage Res. 1986, 7, 355–366. [Google Scholar] [CrossRef]
  3. Kader, M.A.; Senge, M.; Majid, M.A.; Ito, K. Recent advances in mulching materials and methods for modifying soil environment. Soil Tillage Res. 2017, 168, 155–166. [Google Scholar] [CrossRef]
  4. Dekemati, I.; Simon, B.; Vinogradov, S.; Birkás, M. The effects of various tillage treatments on soil physical properties, earthworm abundance and crop yield in Hungary. Soil Tillage Res. 2019, 194. [Google Scholar] [CrossRef]
  5. Pires, L.F.; Borges, J.A.R.; Rosa, J.A.; Cooper, M.; Heck, R.J.; Passoni, S.; Roque, W.L. Soil structure changes induced by tillage systems. Soil Tillage Res. 2017, 165, 66–79. [Google Scholar] [CrossRef] [Green Version]
  6. Gyuricza, C.; Smutný, V.; Percze, A.; Pósa, B.; Birkás, M. Soil condition threats in two seasons of extreme weather conditions. Plant Soil Environ. 2015, 61, 151–157. [Google Scholar] [CrossRef] [Green Version]
  7. Jug, D.; Jug, I.; Brozović, B.; Vukadinović, V.; Stipešević, B.; Đurđević, B. The role of conservation agriculture in mitigation and adaptation to climate change. Poljopr. Agric. 2018, 24, 35–44. [Google Scholar] [CrossRef]
  8. Birkás, M.; Jug, D.; Kende, Z.; Kisić, I.; Szemők, A. Soil tillage response to the climate threats–Revaluation of the classic theories. Agric. Conspec. Sci. 2018, 83, 1–9. [Google Scholar]
  9. Obour, P.B.; Lamandé, M.; Edwards, G.; Sørensen, S.G.; Munkholm, N.J. Predicting soil workability and fragmentation in tillage: A review. Soil Use Manag. 2017, 33. [Google Scholar] [CrossRef]
  10. Smeaton, T.C.; Daly, A.N.; Cranwell, J.M. Earthworm population responses to cultivation and irrigation in a South Australian soil. Pedobiologia 2003, 47, 379–385. [Google Scholar] [CrossRef]
  11. Briones, M.J.I.; Schmidt, O. Conventional tillage decreases the abundance and biomass of earthworm and alters their community structure in a global meta-analysis. Glob. Chang. Biol. 2017, 23, 4396–4419. [Google Scholar] [CrossRef] [Green Version]
  12. Palm, C.; Blanco-Canqui, H.; Declerck, F.; Gatere, L.; Grace, P. Conservation agriculture and ecosystem services: An overview. Agric. Ecosyst. Environ. 2014, 187, 87–105. [Google Scholar] [CrossRef] [Green Version]
  13. Chan, K.Y. An overview of some tillage impacts on earthworm population abundance and diversity–Implications for functioning in soils. Soil Tillage Res. 2001, 57, 179–191. [Google Scholar] [CrossRef]
  14. Pelosi, C.; Bertrand, M.; Thénard, J.; Mougin, C. Earthworms in a 15 years agricultural trial. Appl. Soil Ecol. 2015, 88, 1–8. [Google Scholar] [CrossRef]
  15. Johnston, A.S.A.; Sibly, R.M.; Thorbek, P. Forecasting tillage and soil warming effects on earthworm populations. J. Applied Ecol. 2018, 55, 1498–1509. [Google Scholar] [CrossRef]
  16. Soares, M.B.; Alexander, M.; Dessai, S. Sectoral use of climate information in Europe: A synoptic overview. Climate Services. 2017, 9, 5–20. [Google Scholar] [CrossRef]
  17. Passioura, J. The drought environment: Physical, biological and agricultural perspectives. J. Exp. Bot. 2007, 58, 113–117. [Google Scholar] [CrossRef] [PubMed] [Green Version]
  18. Birkás, M.; Dekemati, I.; Kende, Z.; Pósa, B. Review of soil tillage history and new challenges in Hungary. Hung. Geogr. Bull. 2017, 66, 55–64. [Google Scholar] [CrossRef] [Green Version]
  19. Cook, H.F.; Valdes, G.S.B.; Lee, H.C. Mulch effects on rainfall interception, soil physical characteristics and temperature under Zea mays L. Soil Tillage Res. 2006, 91, 227–235. [Google Scholar] [CrossRef]
  20. IUSS Working Group WRB. World Reference Base for Soil Resources 2014, update 2015. International Soil Classification System for Naming Soils and Creating Legends for Soil Maps; World Soil Resources Reports No. 106; FAO: Rome, Italy, 2015. [Google Scholar]
  21. Tóth, E.; Gelybó, G.; Dencső, M.; Kása, I.; Birkás, M.; Horel, Á. Soil CO2 emissions in a long-term tillage treatment experiment. In Soil Management and Climate Change: Effects on Organic Carbon, Nitrogen Dynamics, and Greenhouse Gas Emissions; Munoz, M., Zornoza, R., Eds.; Elsevier: Amsterdam, The Netherlands, 2017; pp. 293–307. [Google Scholar]
  22. Csorba, S.; Farkas, C.; Birkás, M. Dual porosity water reten tion curves for characterizing the effect of tillage. Agrokémia és Talajt. 2011, 60, 335–342. [Google Scholar] [CrossRef]
  23. Kende, Z.; Sallai, A.; Kassai, K.; Mikó, P.; Percze, A.; Birkás, M. The effects of tillage induced soil disturbance on weed infestation of winter wheat. Pol. J. Environ. Stud. 2017, 26, 1131–1138. [Google Scholar] [CrossRef]
  24. ISO. International Standard ISO23611-1:2006, Soil Quality–Sampling of Soil Invertebrates–Part 1: Hand-Sorting and Formalin Extraction of Earthworms. 2006. Available online: https://www.iso.org/standard/36914.html (accessed on 10 October 2020).
  25. Filep, G. Physical characters of soil. In Soil Science; Stefanovits, P., Filep, G., Füleky, G., Eds.; Mezőgazda Kiadó: Budapest, Hungary, 1999; pp. 131–190. [Google Scholar]
  26. Acar, M.; Celik, I.; Günal, H. Effects of long-term tillage systems on aggregate-associated organic carbon in the eastern Mediterranean region of Turkey. Eurasian J. Soil Sci. 2008, 7, 51–58. [Google Scholar] [CrossRef]
  27. Powlson, D.S.; Stirling, C.M.; Jat, M.L.; Gerard, B.G.; Palm, C.A.; Sanchez, P.A.; Cassman, K.G. Limited potential of no-till agriculture for climate change mitigation. Nat. Clim. Chang. 2014, 4, 678–683. [Google Scholar] [CrossRef]
  28. Soane, B.D.; Ball, B.C.; Arvidsson, J.; Basc, G.; Moeno, F.; Roger-Estrade, J. No-till in northern, western and south-western Europe: A review of problems and opportunities for crop production and the environment. Soil Tillage Res. 2012, 118, 66–87. [Google Scholar] [CrossRef] [Green Version]
  29. Chalise, D.; Kumar, L.; Sharma, R.; Kristiansen, P. Assessing the impacts of tillage and mulch on soil erosion and corn yield. Agronomy 2020, 10, 63. [Google Scholar] [CrossRef] [Green Version]
  30. Kalmár, T.; Bottlik, L.; Kisic, I.; Gyuricza, C.; Birkás, M. Soil protecting effect of the surface cover in extreme summer periods. Plant Soil Environ. 2013, 59, 404–409. [Google Scholar] [CrossRef] [Green Version]
  31. Akhtar, K.; Wang, W.Y.; Khan, A.; Ren, G.X.; Afridi, M.Z.; Feng, Y.Z.; Yang, G.H. Wheat straw mulching with fertilizer nitrogen: An approach for improving soil water storage and maize crop productivity. Plant Soil Environ. 2018, 64, 330–337. [Google Scholar]
  32. Bogunović, I.; Kovács, P.G.; Ðekemati, I.; Kisić, I.; Balla, I.; Birkás, M. Long-term effect of soil conservation tillage on soil water content, penetration resistance, crumb ratio and crusted area. Plant Soil Environ. 2019, 65, 442–448. [Google Scholar] [CrossRef]
  33. Shen, J.Y.; Zhao, D.D.; Han, H.F.; Zhou, X.B.; Li, Q.Q. Effects of straw mulching on water consumption characteristics and yield of different types of summer maize plants. Plant Soil Environ. 2012, 58, 161–166. [Google Scholar] [CrossRef] [Green Version]
  34. Wang, W.; Akhtar, K.; Ren, G.; Yang, G.; Feng, Y.; Yuan, L. Impact of straw management on seasonal soil carbon dioxide emissions, soil water content, and temperature in a semi-arid region of China. Sci. Total Environ. 2019, 652, 471–482. [Google Scholar] [CrossRef]
  35. Bogunovic, I.; Pereira, P.; Kisic, I.; Sajko, K.; Sraka, M. Tillage management impacts on soil compaction, erosion and crop yield in Stagnosols (Croatia). Catena 2018, 160, 376–384. [Google Scholar] [CrossRef]
  36. Nouri, A.; Lee, J.; Yin, X.; Tyler, D.D.; Saxton, A.M. Thirty-four years of no-tillage and cover crops improve soil quality and increase cotton yield in Alfisols, Southeastern USA. Geoderma 2019, 337, 998–1008. [Google Scholar] [CrossRef]
  37. Allen, R.R.; Fenster, C.R. Stubble-mulch equipment for soil and water conservation in the Great Plains. J. Soil Water Conserv. 1986, 41, 11–16. [Google Scholar]
  38. Karlen, D.; Wollenhaupt, N.C.; Erbach, D.; Berry, E.; Swan, J.; Eash, N.S.; Jordahl, J. Crop residue effects on soil quality following 10-years of no-till corn. Soil Tillage Res. 1994, 31, 149–167. [Google Scholar] [CrossRef]
  39. Halwatura, D.; McIntyre, N.; Lechner, A.M.; Arnold, S. Capability of meteorological drought indices for detecting soil moisture droughts. J. Hydrol. Reg. Stud. 2017, 12, 396–412. [Google Scholar] [CrossRef]
  40. Johnson-Maynard, J.L.; Umiker, K.J.; Guy, S.O. Earthworm dynamics and soil physical properties in the first three years of no-till management. Soil Tillage Res. 2007, 94, 338–345. [Google Scholar] [CrossRef]
  41. Abail, Z.; Whalen, J.K. Corn residue inputs influence earthworm population dynamics in a no-till corn-soybean rotation. Appl. Soil Ecol. 2018, 127, 120–128. [Google Scholar] [CrossRef]
  42. Pagliai, M.; Vignozzi, N.; Pellegrini, S. Soil structure and the effect of management practices. Soil Tillage Res. 2004, 79, 131–143. [Google Scholar] [CrossRef]
Figure 1. Location of experiment and treatments in Hungarian and Central European relation.
Agronomy 10 01552 g001
Figure 2. Total annual precipitation in the investigated periods (2003–2018).
Agronomy 10 01552 g002
Figure 3. Soil water content (w/w−1) at different soil surface cover of the cereal and wide row crop stubbles.
Agronomy 10 01552 g003
Figure 4. Relations between soil surface cover (%) and soil water content (SWC w/w−1) on earthworm abundance (ind m−2) to a depth of 0–20 cm soil layer.
Agronomy 10 01552 g004
Figure 5. Surface cover impact on soil SWC, earthworm abundance and crumb ratio in Chernozem soil.
Agronomy 10 01552 g005
Table 1. Cover ratio in soil surface after crop harvest and sowing.
SeasonsCerealsWide Row Crops
After HarvestAfter SowingAfter HarvestAfter Sowing
D51.0–56.03.5–46.32.0–40.0
R52.5–65.51.5–30.571.7–77.71.0–29.0
RD58.5–62.51.5–21.067.0–75.02.0–35.0
DR76.0–82.03.0–40.536.0–40.01.0–47.5
Seasons: D: dry, R: rainy, RD: rainy-dry, DR: dry-rainy.
Table 2. Average soil water content (SWC w/w−1) at 0–40 cm depth in four different type of seasons and at six soil tillage treatments.
SeasonsLPTSTDTNTMean
D21.2 aC20.4 bC21.5 aC21.4 aC20.4 bD20.7 bD21.0
R26.5 aA25.1 cA26.4 aA26.5 aA25.1 cA26.0 bA26.0
RD25.3 bB24.9 bA26.0 aB26.0 aB24.2 cC25.1 bC25.0
DR26.3 aA24.5 cB26.4 aA26.2 aB24.7 cB25.7 bB26.0
Mean24.823.725.125.123.624.425.0
The different lowercase letters (a, b, c) in rows indicate significant difference among tillage treatments and different uppercase letters in columns (A, B, C) among type of seasons at p < 0.05; tillage treatments: L: loosening, P: ploughing, T, ST: tine tillage deeper and shallower, DT: disk tillage, NT: no-till.
Table 3. Soil water content (SWC, w/w−1) at four different type of seasons and different crop sites.
SiteLPTSTDTNTMean
Cereals25.0 a23.3 c25.0 a25.0 a23.2 c24.1 b24.4
Wide row crops25.6 b25.3 b26.3 a26.4 a25.2 b25.6 b25.7
Cereal stubbles25.9 ab24.4 d26.4 a26.8 a25.0 c26.6 a25.9
Wide crop stubbles25.9 b25.0 c26.6 a27.0 a25.2 c26.8 a26.1
Mean 25.624.526.126.324.725.825.5
The different lowercase letters (a, b, c) in rows indicate significant difference between treatments at p < 0.05: indicates significant difference at p < 0.01; tillage treatments: L: loosening, P: ploughing, T, ST: tine tillage deeper and shallower, DT: disk tillage, NT: no-till; n: cereals and stubbles: 120, wide row crops and stubbles: 144.
Table 4. Earthworm abundance (ind m−2) at different soil tillage and four type of seasons.
SeasonsLPTSTDTNTMean
D19 a12 bc23 a24 a15 b24 a20
R30 a17 bc34 a35 a23 ab35 a29
RD20 a8 b20 a23 a10 b29 a18
DR19 c7 d25 c39 b20 c50 a27
Mean22112630173524
The different lowercase letters (a, b, c) in rows indicate significant difference among tillage treatments at p < 0.05; tillage treatments: L: loosening, P: ploughing, T, ST: tine tillage deeper and shallower, DT: disk tillage, NT: no-till; cereals and stubbles: 120, wide row crops and stubbles: 144.
Table 5. Earthworm abundance (ind m−2) at different agronomic sites.
SiteLPTSTDTNTMean
Cereals28 d14 f31 c35 b21 e37 a28
Wide row crops20 c13 d27 b32 a20 c32 a24
Cereal stubbles22 d13 f27 c32 b18 e34 a24
Wide row crop stubbles20 d10 f25 c28 b15 e30 a21
Mean 23132832193324
The different lowercase letters (a, b, c, d, e, f) in rows indicate significant difference between tillage treatments at p < 0.05; tillage treatments; L: loosening, P: ploughing, T, ST: tine tillage deeper and shallower, DT: disk tillage, NT: no-till; n: cereals and stubbles: 120, wide row crops and stubbles: 144.
Table 6. Crumb formation (%) at different soil tillage and seasons.
SeasonsLPTSTDTNTMean
D66 b56 c66 b70 a55 c65 b63
R73 c62 e75 b78 a64 d73 c71
RD77 b67 d78 b81 a63 e75 c74
DR76 c65 d79 b84 a64 d76 e74
Mean73637578627271
The different lowercase letters (a, b, c, d, e) in rows indicate significant difference among tillage treatments at p < 0.05; tillage treatments: L: loosening, P: ploughing, T, ST: tine tillage deeper and shallower, DT: disk tillage, NT: no-till; n: cereals and stubbles: 120, wide row crops and stubbles: 144.
Table 7. Crumb formation% at different soil and site conditions.
SiteLPTSTDTNTMean
Cereals74 b65 c77 a79 a63 c74 b72
Wide row crops73 a61 c72 ab75 a61 c73 a69
Cereal stubbles77 b73 c80 a81 a74 c80 a78
Wide crop stubbles74 ab69 c76 a78 a69 c75 ab74
Mean75677678677673
The different lowercase letters (a, b, c) in rows indicate significant difference among tillage treatments at p < 0.05; tillage treatments: L: loosening, P: ploughing, T, ST: tine tillage deeper and shallower, DT: disk tillage, NT: no-till; n: cereals and stubbles: 60, wide row crops and stubbles: 30.

