Article

Seasonal Variation in Canopy Size, Light Penetration and Photosynthesis of Three Cassava Genotypes with Different Canopy Architectures

1
Department of Agronomy, Faculty of Agriculture, Khon Kaen University, Khon Kaen 40002, Thailand
2
Peanut, Jerusalem Artichoke and Cassava Improvement Research Group, Department of Agronomy, Faculty of Agriculture, Khon Kaen University, Khon Kaen 40002, Thailand
3
Department of Biology, Faculty of Science, Khon Kaen University, Khon Kaen 40002, Thailand
4
USDA-ARS, Crop Genetics and Breeding Research Unit, Coastal Plain Experimental Station, Tifton, GA 31793, USA
5
Crop & Soil Sciences, The University of Georgia, Tifton, GA 31793, USA
*
Author to whom correspondence should be addressed.
Submission received: 2 September 2020 / Revised: 7 October 2020 / Accepted: 9 October 2020 / Published: 13 October 2020

Abstract

:
The objective of this study was to investigate the effect of canopy size (CS) on light penetration and leaf photosynthesis of three cassava genotypes (Kasetsart 50 (KU50), Rayong 11 and CMR38-125-77) under two planting dates in two years. Data were recorded for CS, leaf area index (LAI), leaf photosynthesis, biomass (BM), storage root yield (SRY), starch content (SC) and harvest index (HI). The variation of CS depended on temperature, solar radiation (SR), relative humidity (RH) and day length (DL). In early growth stages, the crops planted in May had higher CS than the crops planted in November, because they were subjected to higher temperature, more SR, higher RH and longer DL. In contrast, the storage root accumulation of the crops planted in November was under better climatic factors than the crops planted in May. Therefore, the crops planted in November had higher BM and SRY than the crops planted in May for KU50 and CMR38-125-77. However, Rayong 11 in the May planting date maintained higher CS during storage root accumulation than the other genotypes, and BM and SRY of Rayong 11 were not different for the two planting dates in both years. KU50 and CMR38-125-77 had higher BM and SRY in the November planting, whereas in the May planting, the SRY and BM of the three genotypes were not significantly different. Genotypes that maintained high CS at the storage root accumulation stage could be indirectly selected for high BM and SRY in cassava breeding programs.

1. Introduction

Cassava (Manihot esculenta (L.) Crantz) is an important source of food in the tropics; its starchy roots are consumed fresh (for low toxic varieties) and as a processed starch. Cassava is also used for animal feed [1]. Cassava is grown in tropical and sub-tropical areas (30° N to 30° S) including Brazil, South Africa and Southeast Asia countries [1]. This crop is consumed by more than a billion people in 105 countries [2]. Asia (29.4%) is the second largest cassava production area in the world after Africa (60.9%) [3]. Under optimum conditions, cassava yield in Asia can reach 90 t ha−1 [1]. Yet, cassava average yields in Asia (23.6 t ha−1) [4] are usually less than the world average yield for many reasons, including biotic stress—such as insect and disease—and abiotic stress—such as lower soil fertility, drought, water flooding and extreme temperatures [5,6,7].
Although cassava has a long crop cycle, ranging from 12 to 24 months, the planting date will determine the climatic conditions the crop will experience during critical growth stages including canopy establishment, root initiation and storage root accumulation [8]. In Asia, the early growth stages of cassava planted during the early rainy season will be subjected to higher rainfall, temperature, RH and SR than those planted in the late rainy season. However, drought will often hit early rainy season plantings when they are in the later growth stages, reducing canopy size (CS) and yield [9,10,11].
The size of the plant canopy is important for light interception and photosynthesis and plays a major role in photosynthesis capacity. Canopy size determined light interception and photosynthesis capacity [12,13]. Different varieties have different canopy architectures, which change light availability to the lower leaves in the canopy [14,15]. Cassava leaf photosynthesis, total biomass (BM) and root yield are known to be positively and significantly correlated with each other [16,17]. In addition, plant height is often found to have strong and positive correlations with leaf area, fresh root and dry matter yield [18], as has leaf area index (LAI) [1,19,20,21,22,23]. Yet the highest yielding genotypes of cassava do not always have the highest LAI [24], as leaf arrangement and appropriate leaf size may help increase photosynthetic efficiency and, thus, compensate for lower leaf area [25]. Good canopy architecture, therefore, may help increase photosynthetic rates in the lower leaves of the canopy and increase cassava yield.
Cock et al. [20] suggested that high yielding cassava should have late forking and branching and possess large leaves and long leaf life. However, the effects of the canopy components on light penetration in cassava genotypes have not been clearly defined because cassava has a long-life cycle. Throughout the life cycle of cassava, the crop encounters seasonal variations in climatic factors such as light intensity, temperature and humidity. These factors affect the change in canopy of cassava and cassava genotypes respond differently to environmental changes. While the responses of CS on seasonal variation under different water regimes had been reported, they generally use only one genotype [11]. Therefore, the objective of this study was to determine canopy architecture, light penetration and photosynthesis of three cassava genotypes under different seasonal variations. The information obtained in this study will be useful for selection of cassava genotypes with good plant architecture, which will lead to improved photosynthesis and root yield.

2. Materials and Methods

2.1. Experimental Design and Study Sites

Three cassava genotypes (Kasetsart 50 (KU50), Rayong 11 and CMR38-125-77) with different branching patterns and starch bulking periods were used in this experiment. A randomized complete block design (RCBD) was conducted. Each tested genotype had four replications and was evaluated over two planting dates and two years. The early rainy season planting occurred in May and the November plantings are considered to be in the late rainy season. The experiment was conducted for two years during 2015/2016 and 2016/2017 at Field Crop Research Station of Khon Kaen University, Thailand (lat. 16°28′ N, long. 102°48′ E, 200 m above sea level).
During the pre-planting preparation period, the site’s soil hardpan was broken using a sub-soiler followed by conventional tillage and a cover crop of sunn hemp (Crotalaria juncea L.). The sunn hemp was then tilled into the soil at flowering, along with cattle manure (6250 kg ha−1). The soil was ridged at 1 m distances between ridges. The plots of 6 × 7 m were then prepared for planting. Cassava stem sections from the multiplication field were selected for health and uniformity at 10 months after planting (MAP). Stems were cut in 20 cm lengths and soaked in thiamethoxam (3–(2–chloro-thiazol–5–ylmethyl)–5–methyl–(1,3,5)–oxadiazinan–4–ylidene–N–nitroamine, 25% water dispersible granules) at a rate of 4 g 20 L−1 water, for 20 min, to prevent losses from the pink mealy bug (Phenacoccus manihoti Matile-Ferrero). After incubation in a gunnysack for three days, the stalks were selected for uniform germination and inserted vertically on soil ridges with a spacing of 1 × 1 m. Each plot was 6 m in length and seven rows wide. Each plot had 42 plants. An overhead mini sprinkler irrigation system was installed in the field to supply water to the cassava plants from planting until harvest. Tensiometers (model 2725ARL jet fill tensiometers, Soilmoisture Equipment Corp., Santa Barbara, CA, USA) were installed in the first replication at 20 and 40 cm soil depth to monitor soil moisture. Water was applied when soil suction at 40 cm soil depth was lower than −30 kPa and stopped when the level of soil suctions at 20 cm soil depth was above −10 kPa.
Weeds were controlled manually at 1 and 2 MAP and fertilizer was applied based on soil analysis and the minimum requirements for cassava at 1 MAP [26]. The fertilizer formula 15-7-18 of N‒P2O5‒K2O at the rate of 321.5 kg ha−1 was applied at 2 MAP as per recommendations of the Thailand Ministry of Agriculture and Cooperatives [27]. Disease and insect pests were scouted at weekly intervals, and chemical control was used when necessary.

2.2. Data Collection

2.2.1. Soil Physical and Chemical Properties

Soil samples (0–30 and 30–60 cm depths) were taken to determine soil texture, pH and nutrient content. The hydrometer was used to determine texture. Chemical properties measured included soil pH, organic matter (Walkley–Black), total nitrogen (Kjeldahl), available phosphorus (Bray II), exchangeable potassium (1 M ammonium acetate extraction at pH 7), exchangeable calcium (1 M ammonium acetate), electrical conductivity (EC) and cation exchange capacity (CEC) (1:5 H2O and 1 M ammonium acetate extraction at pH 7, respectively).

2.2.2. Weather Condition

A weather station WD-2700 (Watchdog, PCE group, PCE Germany, Meschede, Germany) was used for recording climatic data. The weather parameters read with WD-SPEC software (Watchdog, SpecWare 9 pro software, Charter Communications, Stamford, CT, USA) were air temperature, relative humidity (RH), photosynthetic active radiation (PAR) and precipitation logged at 5 min intervals during the entire observation period. Daily solar radiation (SR) (MJ m−2 day−1) was converted from PAR light, whereas the ratios of PAR to total SR was 0.5 [28]. Data for day length (DL) were obtained from the Meteorological Department of Thailand [29].

2.2.3. Canopy Traits

Canopy height (CH) was measured from the top of canopy to the lowest stem node with a green leaf. Canopy width (CW) was measured in the same plant as the diameter of the canopy. Canopy area (CA), which referred to ground cover of the plant was calculated based on canopy width. Canopy volume (CV) had three dimensions of canopy. The CV was calculated by multiplying CA by CH. Data on canopy traits were measured from one plant in each plot at monthly interval starting at 1 MAP until harvest.

2.2.4. LAI

LAI was measured in a representative 6 × 7 m2 area by using the LAI-2000 Plant Canopy Analyzer (LI-Cor, Lincoln, NE, USA) under overcast and/or clear sky conditions three times in each plot, and the average recorded as described in the LAI-2000 user manual [30].

2.2.5. Light Penetrations

PAR light was measured using a line quantum sensor (Licor 191, Lincoln, NE, USA). A set of data were recorded above the canopy, below the canopy and between the rows under the canopy, three times per plot at midday (11.30–13.00). Light penetration was transformed into a percentage of PAR that penetrated through the canopy at monthly intervals beginning 1 MAP and continuing until harvest.

2.2.6. Leaf Photosynthesis

Leaf photosynthesis was measured on one leaf in each canopy layer (upper, middle and lower layer) on the same plant of each plot in each replication at 3, 6, 9 and 12 MAP. Measurements were taken at the central lobe of the leaf on sunny days (08.00–12.00 am) by using a leaf gas exchange portable photosynthesis meter (Licor 6400xt; LI-Cor, Lincoln, NE, USA). The conditions for photosynthesis included light intensity (1500 µmol m−2 s−1), CO2 concentration (400 µmol mol−1) and a block temperature of 30 °C.

2.2.7. Biomass, Storage Root Yield, Starch Content and Harvest Index

Plants were harvested and recorded for total BM and final yield of cassava at 12 MAP; 18 plants in the middle rows of each plot from the harvest area (18 m2) were separated into storage roots and shoots (leaf, petioles, stems). Fresh weight of each plant part was recorded immediately after harvest. Stems were chopped into small pieces and mixed well before sub-sampling. The fresh sub-samples of 10% [31] for each part (leaf, petiole, stem and storage root) were oven-dried at 80 °C for 72 h or until the weights were constant to determine dry weight (DW). Storage root and total shoot DW were calculated by converting from fresh weight. Total BM was calculated based on shoot DW and storage root DW. The harvest index (HI) was computed as the ratio of total storage root DW to total BM at the final harvest. The samples of 5 kg of fresh storage roots were used to measure starch content by Reinmann Balance (GENIX SM model, Genius design and Engineering Co., LTD, Samutprakarn, Thailand) [32]. Storage root yield was calculated from storage root fresh weight per area.

2.3. Statistical Analysis

Data for each year were subjected to individual analysis of variance. Error variances were tested for homogeneity, and the data of two seasons for two years with variance homogeneity were combined. Mean comparisons based on the least significant difference (LSD) were conducted for all genotypes and planting dates by using Statistix 10 [33]. All statistical analyses were carried out following the procedure described by Moore and Dixon [34]. A stepwise regression analysis was used to investigate the effect of weather data (including the SR, RH, DL and maximum, minimum and average temperatures) on CS.

3. Results

3.1. Soil Physical and Chemical Properties

The soil at the experimental site is Yasothon soil series (Typic Paleustult) with loamy sand texture (Table 1). Most soil pH values for most planting dates at 0–30 and 30–60 cm soil depths were neutral to slightly alkaline, ranging from 7.0 to 7.5 except for the planting date in November 2015/2016 (6.3 and 6.1). The soil organic matter and total nitrogen of both planting dates for the two years ranged from 0.2–0.5% and 0.013–0.037%, respectively. Exchangeable potassium (23.9–54.6 mg kg−1) was not sufficient, whereas the critical level for exchangeable potassium was 58.5–66.3 mg kg−1. However, available phosphorus (27.9–88.5 mg kg−1) and exchangeable calcium (232.5–481.5 mg kg−1) in this experiment was sufficient. The critical level of available phosphorus in the soil is about 4.0–6.0 mg kg−1 (Bray II-extractable phosphorus) and the critical level of exchangeable calcium was 50.0–200.0 mg kg−1) [26].

3.2. Weather Condition

For the crops planted in May 2015, maximum and minimum temperatures ranged from 16.8 to 43.9 °C and 8.9 to 29.5 °C, respectively. Average temperatures ranged from 12.3 to 35.6 °C (Figure 1a). RH ranged from 22.9 to 92.8% and averaged 62.0%. The values of SR ranged from 6.4 to 25.4 MJ m−2d−1 and total SR of crop duration was 6246.1 MJ m−2.
For planting November 2015, maximum (16.8 to 43.9 °C), minimum (8.9 to 29.5 °C) and averaged (12.3 to 35.6 °C) temperatures were slightly different compared to planting in May 2015 (Figure 1b). RH values ranged from 22.9 to 92.3% with an average of 63.3%. SR values during the crop cycle ranged from 5.4 to 24.5 MJ m−2 d−1 with the total value of 6093.2 MJ m−2. The maximum temperature (43.9 °C) was recorded on 11 April 2016, when the crop planted in May 2015 was 11 months old and the crop planted in November 2015 was 5 months old. The minimum temperature (8.9 °C) was recorded on 8 February 2016 when May planting date was 9 months old, and November planting date was 3 months old.
The maximum temperatures for cassava planted in May 2016 ranged from 24.5 to 39.8 °C, and minimum temperatures ranged from 14.0 to 27.3 °C (Figure 1c). The average temperatures ranged from 20.3 to 33.0 °C. RH values during the crop cycle ranging from 33.0 to 92.3% with an average value of 67.0%. SR values ranged from 5.4 to 24.5 MJ m−2 d−1 and the total value was 6120.0 MJ m−2.
The maximum and minimum temperatures for the crops planted in November 2016 ranged from 24.5 to 39.8 °C and 14.0 to 27.3 °C, respectively (Figure 1d). The average temperatures ranged from 20.3 to 33.0 °C. RH values ranged from 33.0 to 99.6% with an average value of 70.7%. SR values from planting to harvest ranged from 7.7 to 24.8 MJ m−2 d−1 and the total value was 5959.5 MJ m−2.
The maximum temperature (39.8 °C) was recorded on 22 April 17, when the crop planted in May 2016 was 11 MAP and the crop planted in November 2016 was 5 MAP. The minimum temperature (14.0 °C) was recorded on 29 December 2016 when May 2016 planting date was 7 MAP, and November planting date was 2 MAP.
The DL in this study ranged from 11.16–13.09 h. The longest DL was recorded in June, when the crop planted in May was 1 MAP, and 7 MAP for the crop planted in November. The shortest DL was found in December when the May crop was 7 MAP and the November crop was 1 MAP.

3.3. Biomass (BM), Storage Root Yield (SRY), Starch Content (SC) and Harvest Index (HI)

At final harvest, years were significantly different for most traits except for SRY (Table 2). Planting dates were significantly different (p ≤ 0.01) for all traits. The interactions between years and planting dates were not significant for most traits except for SC and HI. Significant differences among cassava genotypes were observed for all traits.
The interactions between year and genotype were not significant for most traits except shoot DW and SC. The interactions between planting date and genotype were significant for most traits except for shoot DW. The interactions among year, planting date and genotype were not significant for most traits, except SC (Table 2).
Year contributed to the largest portions of total variations in shoot DW (66.5%) and HI (52.0%), but it had small contributions to BM (11.4%), storage root DW (10.7%), SC (11.4%) and SRY (2.4%). Planting date contributed to the largest portions of total variations in BM (51.5%), storage root DW (36.0%) and SRY (42.2%), but it had low contributions to shoot DW (12.7%), HI (4.7%) and SC (11.0%) (Table 2). Genotype contributed the largest portion of the total variation in SC (26.4%), but it had a small contribution to BM (4.7%), storage root DW (11.5%), shoot DW (2.3%), HI (11.6%) and SRY (6.8%). The interaction between genotype and planting date had moderate contribution to storage root DW (16.0%) and SRY (19.6%). The interaction between years, planting dates and genotype contributed to variability.
In general, BM and shoot DW in 2015 were higher than in 2016, but storage root DW, HI and SC in 2016 were higher than 2015. Planting in the same month, SRY between 2015 and 2016 was not significant difference (Figure 2). The interaction between planting date and years were not significant for BM, storage root DW, shoot DW and SRY. The results showed that the crop planted in November had higher BM, shoot DW, storage root DW and SRY than the crop planted in May for both years.
Genotype × planting date interactions were significant for most traits except shoot DW. KU50 and CMR38-125-77 planted in November had higher BM, storage root DW and SRY than the crop in May for both years, whereas Rayong 11 was not significantly different for storage root DW and SRY for the May and November planting dates of both years (Figure 2).
Three cassava genotypes planted in each planting date were not significantly different for BM, except for November 2016, when Rayong 11 had lower BM than others. In May 2015 and 2016, KU50 had the lowest storage root DW. For November plantings in 2015 and 2016, KU50 and CMR38-125-77 had the highest storage root DW and SRY.
In this study, the crops planted in 2015 had higher shoot DW than the crops planted in 2016 for both planting dates. Rayong 11 had higher shoot DW in 2015, whereas KU50 had the highest shoot DW in 2016 for both planting dates. The HI in this study ranged from 0.36–0.66 and with the highest HI in CMR38-125-77 (0.57) and Rayong 11 (0.56). KU50 (0.50) had the lowest HI across planting dates and years. Genotype had the largest contribution to variation for SC (Table 2). The average SC were 29.1%, 28.3% and 24.7% for CMR38-125-77, Rayong 11 and KU50, respectively.

3.4. Canopy Traits

The crops planted in May 2015 showed the highest CH at 3 MAP for CMR38-125-77 (177 cm) and at 4 MAP for KU50 (190 cm) and Rayong 11 (142 cm) (Figure 3(1a)). After reaching the peak at 3 or 4 MAP, all cassava genotypes exhibited reduced CH until harvest. However, at harvest, Rayong 11 had a higher CH than the others. The highest CW at 4 MAP for KU50 was recorded as 200 cm followed by CMR38-125-77 (162 cm) and Rayong 11 (160 cm) at 5 MAP (Figure 3(1b)). After the crop reached the highest CW, all genotypes exhibited reductions in CW. CA and CV exhibited similar patterns of that for CW (Figure 3(1c,d)).
For the crop planted in November 2015, all cassava genotypes increased CH over time until they reached peaks at 7 MAP (Figure 3(2a)). The highest CH were recorded for KU50 (133 cm), followed by CMR38-125-77 (115 cm) and Rayong 11 (105 cm). Rayong 11 had the highest CW, CA and CV, follow by KU50 and CMR 38-125-77 (Figure 3(2b–d)).
For the crop planted in May 2016, KU50 (137 cm) and CMR38-125-77 (130 cm) had the highest CH at 5 MAP. Rayong 11′s CH peaked at 110 cm at 7 MAP (Figure 3(3a)). After reaching peak CH, all genotypes recorded sharp declines in height. Likewise, all cassava genotypes increased CW from planting to 6 MAP. Rayong 11 had the greatest CW follow by CMR38-125-77 and KU50 (Figure 3(3b)), and the pattern of CA and CV were similar to CW. Rayong 11 had the lowest CA and CV from planting until 7 MAP; after that, it was higher than the others (Figure 3(3c,d)).
For the crop planted in November 2016, the pattern of CH was similar to that of the crop planted in November 2015, but the genotypes had different peak times. KU50 had the highest CH of 150 cm at 5 MAP, whereas Rayong 11 and CMR38-125-77 had the highest CH of 149 cm and 117 cm, respectively, at 6 MAP (Figure 3(4a)). However, the CW of the three cassava genotypes could be maintained at the range from 80 to 160 cm for 2–8 MAP and the peak was at 9 MAP for KU50 and Rayong 11. KU50, Rayong 11 and CMR38-125-77 had a sharp reduction in CW from 9 MAP until harvest (Figure 3(4b)).
The patterns of CA for all genotypes were similarly to those of CW (Figure 3(4c)). However, KU50 had the highest CV at 5 MAP, and Rayong 11 had the highest CV at 6 MAP, whereas CMR38-125-77 had the highest CV at 9 MAP. Most cassava genotypes tended to exhibit reduced CV after 9 MAP (Figure 3(4d)).

3.5. LAI

All cassava genotypes planted in May 2015, increased LAI sharply and had the highest LAI at 3 MAP for Rayong 11, 4 MAP for KU50 and 5 MAP for CMR38-125-88 (Figure 4a). The highest LAI for Rayong 11, KU50 and CMR38-125-77 were 5.8, 5.9 and 5.3, respectively. After peaking, these genotypes exhibited sharply reduced LAI, and the LAI was near zero at 11 MAP.
All cassava genotypes planted in November 2015 increased LAI slowly during 1–3 MAP (Figure 4b). However, cassava genotypes reached maximum LAI at 4 MAP, showed slightly reduced LAI at 5 MAP, and then LAI increased again at 6 MAP. CMR38-125-77 had the lowest LAI from 6 MAP until harvest, whereas Rayong 11 had the highest LAI from 9 to 12 MAP.
In the May 2016 planting, CMR38-125-77 increased LAI more rapidly than other genotypes during the early growth stages (1–4 MAP) (Figure 4c). Cassava genotypes had the highest LAI at 4 MAP, after which they exhibited reduced LAI until harvest. KU50 had the highest LAI (3.9) followed by CMR38-125-77 (3.8) and Rayong 11 (3.5), respectively. At the final growth stage, Rayong 11 had the highest LAI.
Cassava genotypes planted in November 2016 slowly increased LAI at 1–5 MAP, after which they maintained LAI at least 2 months until harvest (Figure 4f). Rayong 11 had the highest LAI (4.6) at 9 MAP, whereas KU50 had the highest LAI (3.9) at 8 MAP. CMR38-125-77 had the lowest LAI from planting to harvest.

3.6. Light Penetration

When planted in May 2015, canopy development in all genotypes exhibited sharply reduced light penetration until reaching near zero at 3–6 MAP (Figure 5a). After reaching the lowest point, light penetration increased until harvest. At 7 MAP, KU50 had the highest light penetration, whereas Rayong 11 had the lowest light penetration. The pattern of light penetration of the crop planted in May 2016 was similar to that planted in May 2015. Cassava planted in May 2016 had the lowest light penetration at 4–7 MAP (Figure 5c), but it had a higher percentage of light penetration at the same time compared to the crop planted in May 2015. Rayong 11 had the lowest light penetration, whereas KU50 and CMR38-125-77 tended to have a higher light penetration percentage at late growth stages.
For the crop planted in November in both years, cassava genotypes showed slightly reduced light penetration from planting to 7 MAP. For the crop planted in November 2015, KU50, Rayong 11 and CMR38-125-77 had light penetration lower than 10% at 6–8 MAP (Figure 5b). For the crop planted in November 2016, most genotypes had light penetration near zero at 9 MAP (Figure 5d). Rayong 11 had lower light penetration than KU50 and CMR38-125-77.

3.7. Leaf Photosynthesis

The photosynthetic rates of the three cassava genotypes at the top, middle and lower positions of the canopy at 3, 6, 9 and 12 MAP in November 2015 and May and November 2016 are shown in Figure 6. For the planting in November 2015, cassava genotypes were not significantly different in photosynthetic rate at the top of the canopy at 3, 6 and 9 MAP (Figure 6(1a)). However, the leaf photosynthesis rate of the three cassava genotypes were highest at 3 MAP. At the middle position of the canopy, KU50 tended to have higher leaf photosynthesis than the others (Figure 6(1b)). All cassava genotypes had a pattern of photosynthesis at the low position similar to that at the middle position, but the photosynthesis at the low position was lower than at the middle position (Figure 6(1c)). At 12 MAP, KU50 had a higher photosynthetic rate than Rayong 11 and CMR38-125-77 in all canopy positions.
For the crop planted in May 2016, all cassava genotypes had lower photosynthesis at the top position of the canopy at 9 MAP. However, CMR38-125-77 had higher leaf photosynthesis than Rayong 11 and KU50 at all positions of the canopy and for all dates of measurement (Figure 6(2a–c)).
At the top position of canopy, all cassava genotypes planted in November 2016 had the highest photosynthesis at 6 MAP. CMR38-125-77 had the highest leaf photosynthesis in top and middle leaf positions (Figure 6(3a–c)), whereas Rayong 11 had the lowest leaf photosynthesis at middle and lower leaf positions of the canopy for all measurement dates.

3.8. Stepwise Regression Analysis

Stepwise regression analysis of climatic factors on CS of the three cassava genotypes grown in different planting dates were presented in Table 3, Table 4, Table 5 and Table 6. For the crops planted in May 2015, SR and RH were important factors for the variation of the CS in the three cassava genotypes (Table 3). However, CW and CA of Rayong 11 and CMR38-125-77 could be explained by a combination of SR and temperature. SR, RH and DL were identified as factors affecting the LAI of the three cassava genotypes with the determination coefficient of 0.91–0.92 (p ≤ 0.05) (Table 3).
RH and DL both strongly contributed to CS for the crop planted in November 2015 (Table 4). RH, DL and minimum temperature described CH and DL were important factors for CW of KU50 and CMR38-125-77 (R2 = 0.60, 0.68 respectively), while RH, minimum and maximum temperature and DL explained CW (R2 = 0.88) and LAI (R2 = 0.82–0.84, p ≤ 0.05) for Rayong 11.
For the May 2016 planting date, RH, DL and minimum and average temperature were important factors contributing to CS for KU50. RH was not as important in explaining CS variation for Rayong 11 (Table 5). Most of the climatic factors, except SR, were identified as factors affecting the CS for CMR38-125-77 in planting date May 2016. When the crop was planted in November 2016, DL, RH and temperature were important factors influencing CH and CW of KU50, whereas the CH of Rayong 11 could be explained by a combination of SR and DL. RH, minimum temperature and DL were important factors for CS of CMR38-125-77 (Table 6).

4. Discussion

In this study, the research was focused on examining the effects of climatic factors on CS and yield of cassava genotypes. Planting dates (31.0–51.5%) contributed to a larger portion of variation in BM, storage root DW and SRY than other sources of variation. Similar results were reported by Mahakosee et al. [11], who observed that planting date contributed the largest portion of variation in BM, storage root DW and storage root fresh weight (46.1–60.9%) compared to the effects of year and water regime. In this study, the interaction between genotype and planting date showed a much higher magnitude than genotype by year. This indicates that test of cassava genotypes for growth and yield should be evaluated under multiple seasons instead of years.
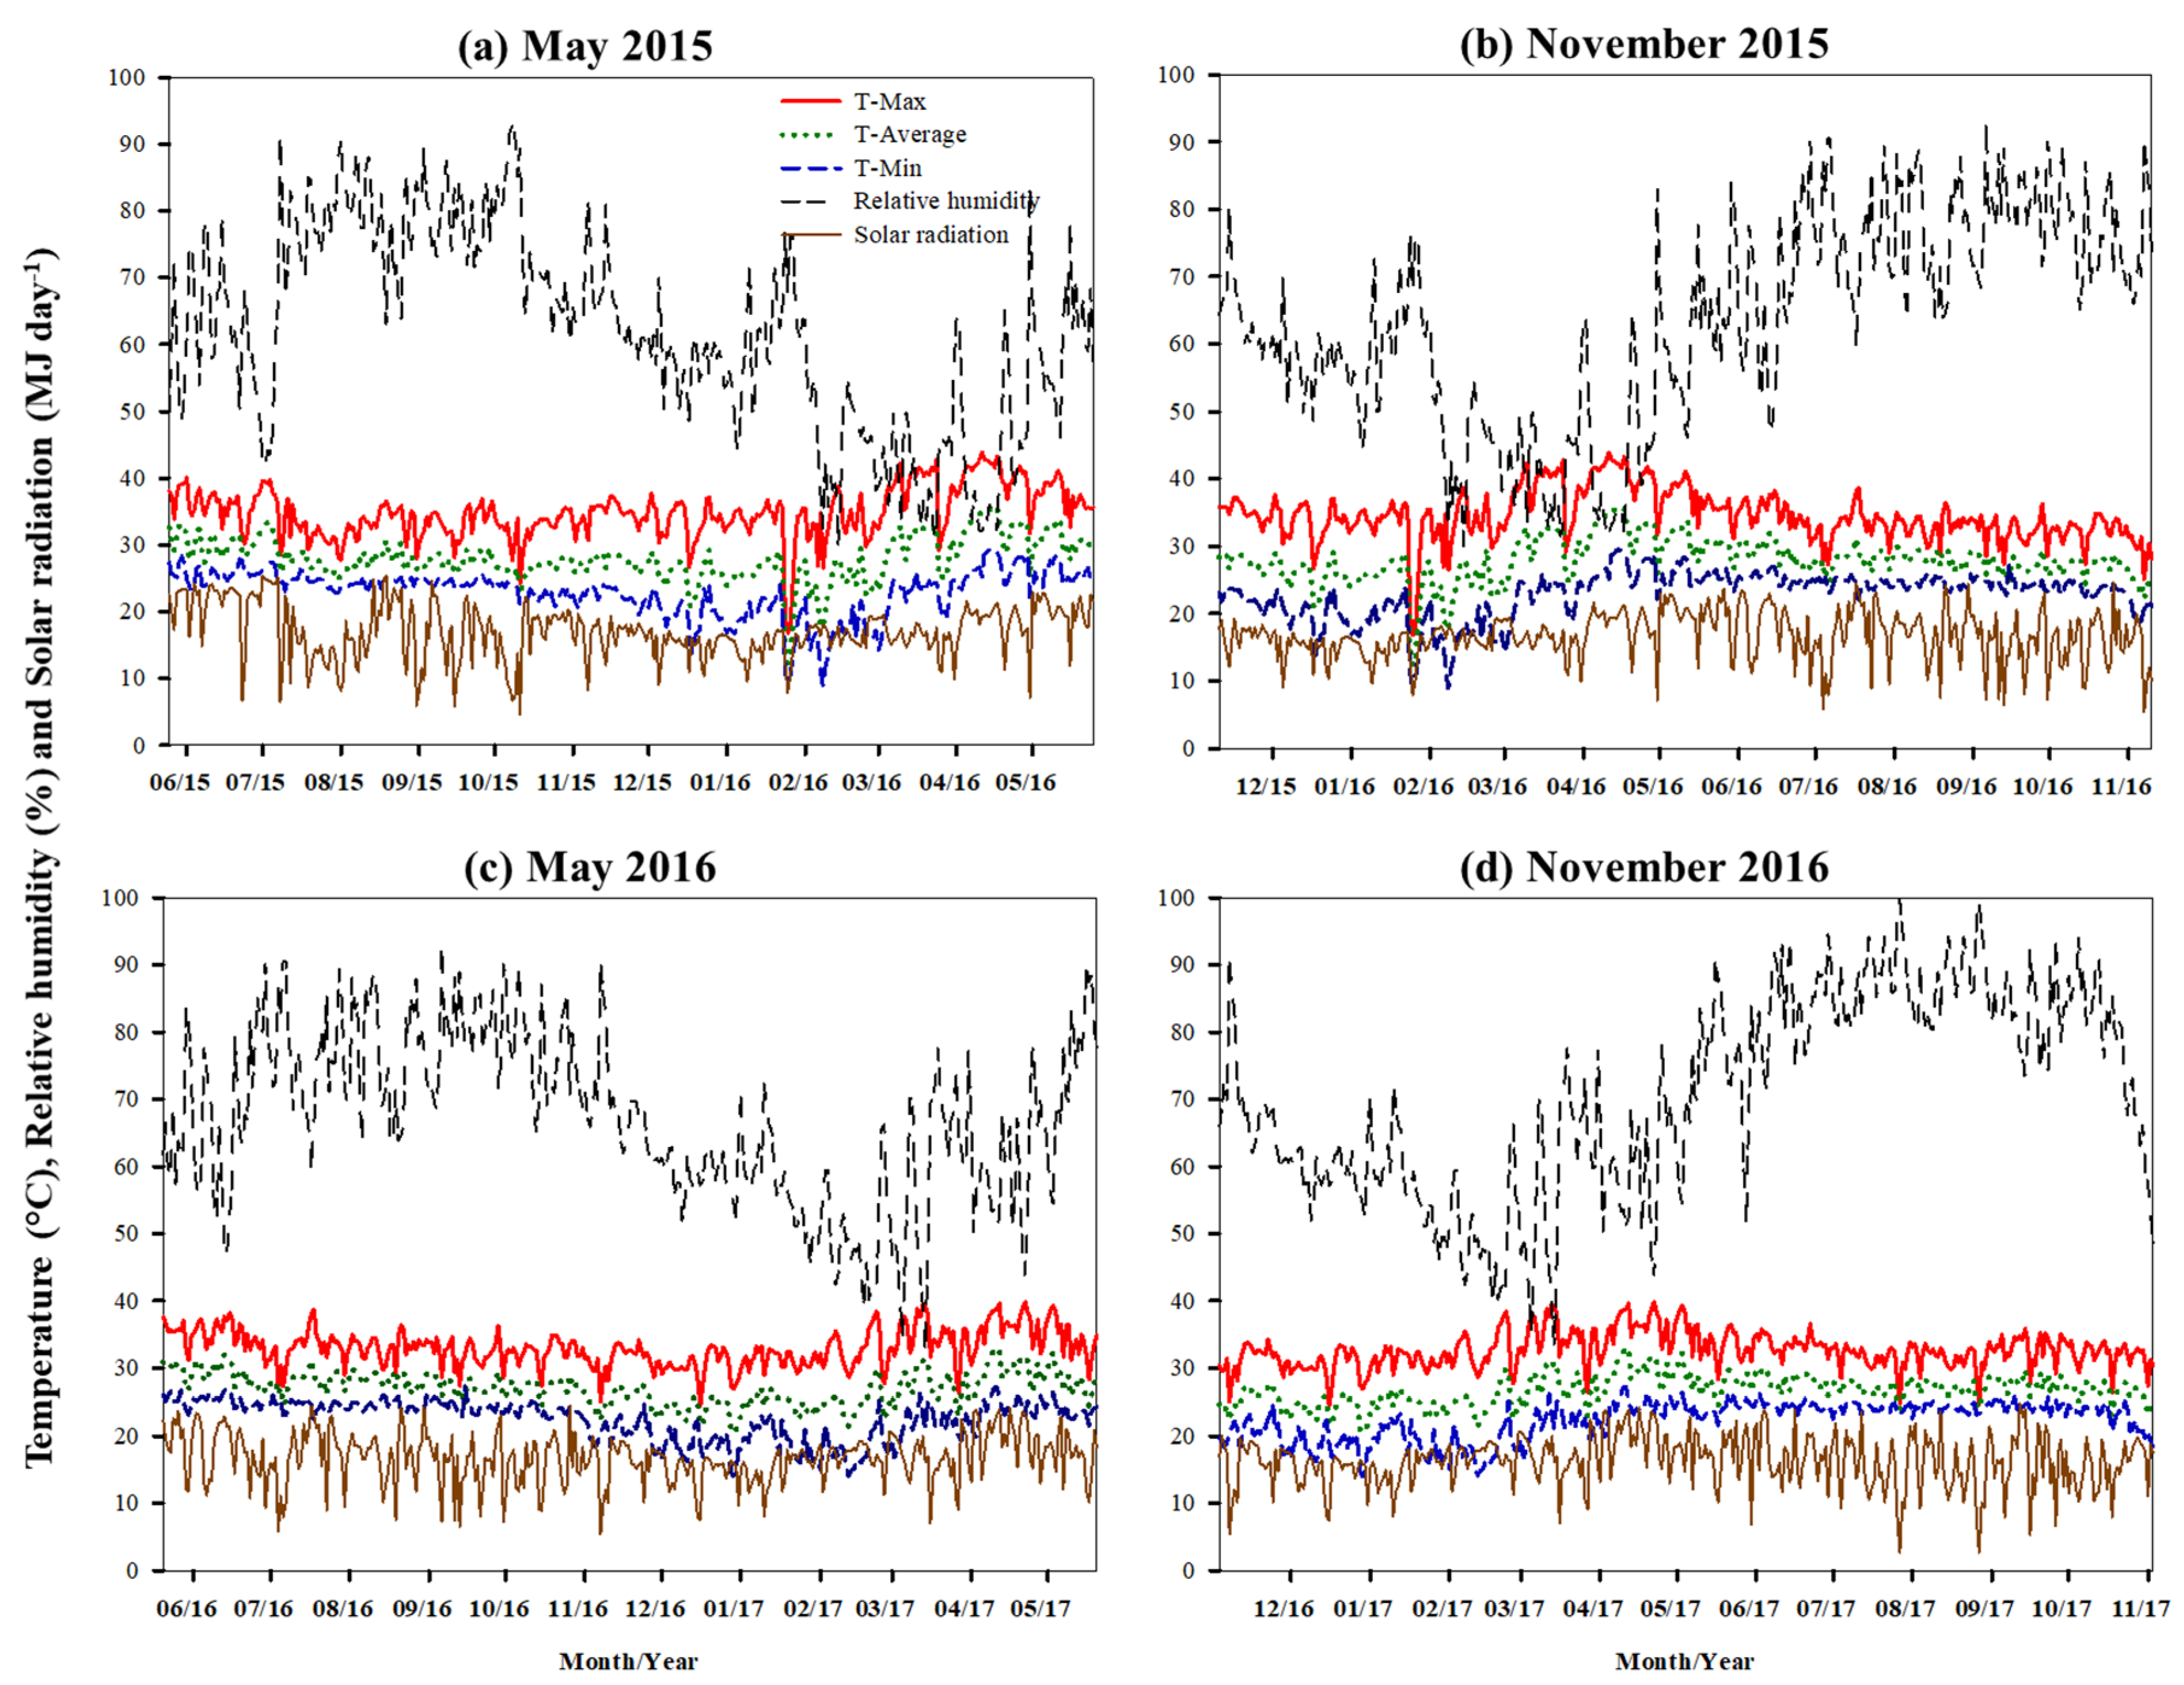
Differences in climatic factors during the growing seasons, including RH, maximum and minimum temperatures, SR and DL impacted CS. When planted in May in the early rainy season with high RH (63.6–79.0%), temperature (32.6–38.2 °C), SR (5.8–25.4 MJ m−2 day−1, average 17.6 MJ m−2 day−1) and long DL (12.08–13.10 h), CS rapidly increased in the early growth stages (1–4 MAP). Low temperature (16.3–22.6 °C), RH (40.0–61.1%), SR (4.6–24.5 MJ m−2 day−1, average 15.4 MJ m−2 day−1) and short DL (11.18–11.97 h) decreased CS in the mid and late growth stages for all cassava genotypes. However, at the mid and late growth stages, Rayong 11 maintained higher CS than KU50 and CMR38–125-77. For November plantings, the cassava genotypes were subjected to low temperatures (17.7–21.8 °C), low RH (42.9–68.1%), SR (5.4–27.6 MJ m−2 day−1, average 15.8 MJ m−2 day−1) and short DL (11.16–11.74 h), in the early growth stage (1–4 MAP), and therefore, canopy development was slower than the May plantings. These findings were supported by stepwise regression analysis. The analysis with high coefficient of determination (R2) indicated that climatic factors explained a large part of the variation of CS in the three cassava genotypes. In May 2015, SR and RH both strongly contributed to CH and LAI for all three cassava genotypes, while SR and minimum temperature were important factors for CW. However, RH and DL explained a large part of the variation for CS of the three genotypes planted in November 2015. For the crop planted in May 2016, RH and DL were identified as the main factors affecting CS of KU50. SR and DL were important factors for CS of Rayong 11. However, SR, DL, maximum temperature and minimum temperature described CS of CMR38-125-77. For the November 2016 planting date, SR, RH and DL were the main factors determining CS of Rayong 11 and CMR38-125-77, whereas the CS of KU50 could be explained by minimum and maximum temperature, RH and DL.
The effect of temperature on growth and development of cassava such as root initiation, leaf formation, leaf size and storage root formation had been reported [7]. Cassava can be grown under 16–38 °C [8,20] and the most favorable temperature has been reported to be between 25–29 °C by Alves [8]. In this study, the crops planted in May of both years were subjected to minimum temperatures > 25 °C from planting to 5 MAP, but in the crops planted in November, the minimum temperatures were lower than 25 °C from planting until 4 MAP. Therefore, early season canopy growth of crops planted in May was larger than the planting in November. In contrast, the crops planted in November had a more optimum temperatures (>25 °C) during mid and late growth stages. The crops planted in November also maintained CS until harvest; however, the KU50 and CMR38-125-77 maintained higher CS than Rayong 11. These results were supported by Lahai et al. [24], who observed that cassava genotypes with better maintenance of canopy parameters during a mid-season drought could produce higher SRY. Lenis et al. [35] also reported that cassava genotypes with leaf retention traits gave higher BM and yield than the genotypes without those traits; additionally, Lenis et al. [35] mentioned that cassava yields were positively correlated with leaf longevity, leaf retention and LAI. However, leaf longevity, leaf retention and LAI of cassava depends on genotypes, shade level and environmental factors such as temperature. Irikura et al. [36] found that cassava grown under cool conditions (20 °C) had longer leaf life than warm conditions (24 °C and 28 °C). Phosaengsri et al. [37] found that KU50 had the longest leaf life and leaf area duration during 3–6 and 6–9 MAP in all dates studied, and CMR38-125-77 had the highest LAI at 3, 6 and 9 MAP; therefore, both of KU50 and CMR38-125-77 gave a higher biomass and yield in all planting dates. However, the optimum LAI for storage root bulking in cassava was 3–3.5 [20]. In this study, the crop planted in November maintained LAI greater than 3 at the storage root bulking stage (6–9 MAP), whereas the crop planted in May had an LAI lower than 3. The lower LAI for the crop planted in May was caused mainly by low temperature and low RH at mid and late growth stages, resulting in falling of old leaves and delaying the formation of new leaves. However, Rayong 11 in the May planting date seemed to maintain higher LAI and lower light transmission than CMR38-125-77 and KU50 during 6–9 MAP. Lower light availability in the lower leaves in the canopy resulted in low leaf photosynthesis in the lower leaves in the canopy of Rayong 11.
Increasing SR may also increase the net photosynthesis and is correlated to yield of cassava [1,38,39]. DL, along with increasing the photosynthetically active period, is known to affect assimilates partitioning, flowering and tuberization [8]. In this study, crops planted in May of both years were subjected to long days in early growth, while a November planting date resulted in short days in early growth stages. The effect of the photoperiod on storage root initiation in early growth stages was reported by Lowe et al. [40]. Short days (8 h) induced storage root initiation earlier than long days (14 and 20 h), and storage root dry weight of shorts day was greater than long days. A study by Veltkamp [41] indicated that long days induce shoot growth and also increase the amount of forking with the first fork occurring earlier, while short days increase storage root growth and reduce shoot growth, without influencing total BM. A current report pointed out that low temperature and low SR reduced BM accumulation rates in both early growth and late growth stages of cassava, whereas high temperature and high SR often resulted in higher BM accumulation rates in both early and late growth stages [29].
In this paper’s study most, genotypes planted in November had higher BM and storage root DW than the crops planted in May, except for Rayong 11. In May plantings, BM and yield were not significant different among cassava genotypes. Rayong 11 had the lowest BM and yield in November plantings for both years. Rayong 11 seemed to have smaller CS than the others, although it was an early forking type [42]. The forking of cassava affects the canopy development and increases LAI and yield [1,36]. Forking in cassava produced more apex and more leaves than non-forking types [36,43]. However, the new leaves in forking branches are often smaller than the main stem leaves [36]. More leaf formation, short petioles and short internode length produced a dense canopy. In this study, Rayong 11 had higher LAI, lower light penetration and lower leaf photosynthesis in all leaf layers, resulting in lower yields. According to Lahai et al. [24], TMS 4 (2)1425 forks early, about 2 MAP and continued branching until harvest. Due to this branching habit, it produced the highest number of leaves compared to other cultivars. Our report found that Rayong 11 produced higher shoot DW, but it had lower storage root DW. This might be due to competition between shoots and storage roots for photo assimilate in cassava [44].
Although KU50 and CMR38-125-77 were forking type genotypes similar to Rayong 11, the KU50 and CMR38-125-77 had higher storage root DW and yield than Rayong 11 in the November plantings. In this study, the first forking of KU50 and CMR38-125-77 were higher than Rayong 11. Moreover, the KU50 and CMR38-125-77 had a wider angle of forking than Rayong 11. It was due to greater light penetration in canopy of KU50 and CMR38-125-77. However, the variation of forking in cassava was depended on genotypes and strongly correlated with climatic factors. Irikura et al. [35] reported that increasing temperature from 20 to 24 °C resulted in early branching and increased leaf formation and size. Phoncharean et al. [41] reported that Rayong 11 had earlier first forking (57 days after planting) than KU50 and CMR38-125-77. SR, minimum temperature and DL were the main factors inducing first forking of Rayong 11 and CMR38-125-77. The results of our study supported Cock et al. [20], who suggested that high yielding cassava genotypes should have late forking and branching and possess large leaves with long leaf life. In conclusion, KU50 and CMR38-125-77 had a better canopy architecture and could maintain CS under cool temperatures and low RH conditions. Moreover, both KU50 and CMR38-125-77 had higher leaf photosynthetic capacity and better leaf spatial arrangement for a higher light interception at mid and late growth stages.

5. Conclusions

Genotypes were different in the CS due to climatic factors. Climatic factors including SR, RH, temperature and DL were important factors for CS. In early growth stages, the crops planted in May had higher CS than the crops planted in November because of higher temperature, SR, RH and longer DL. In contrast, in the mid to late growth stages, the crops planted in May had a smaller canopy size than November crops. Therefore, the crops planted in November had higher BM and SRY than the crops planted in May, especially in KU50 and CMR38-125-77. However, Rayong 11 in May plantings could maintain higher CS during mid and late growth stage than other genotypes, and BM and SRY of Rayong 11 were not significantly different for the two planting dates for the two years. KU50 and CMR38-125-77 had higher BM and SRY in November plantings, whereas in May plantings, yield and BM of the three genotypes were not significantly different. Genotypes that maintained high CS at the storage root accumulation stage could be used to indirectly select for high BM and SRY in cassava breeding programs.

Author Contributions

Conceptualization, P.B., S.J., P.T., C.C.H., C.K.K. and N.V.; methodology, S.J., P.B. and N.V.; formal analysis, S.M.; investigation, S.M.; resources, P.B.; data curation, S.M.; writing—original draft preparation, S.M.; writing—review and editing, S.M., S.J., P.B., P.T., C.C.H. and C.K.K.; supervision, P.B. All authors have read and agreed to the published version of the manuscript.

Funding

This research was funded by the Thai Royal Golden Jubilee Ph.D. Program (Grant no. PHD/0031/2559) and the National Science and Technology Development Agency (NSTDA) Thailand.

Acknowledgments

Assistance in conducting the work was received from the Plant Breeding Research Center for Sustainable Agriculture, Khon Kaen University, Thailand and Peanut, Jerusalem Artichoke and Cassava improvement Research Groups.

Conflicts of Interest

The authors declare no conflict of interest.

References

  1. El-Sharkawy, M.A. Cassava biology and physiology. Plant Mol. Biol. 2004, 56, 481–501. [Google Scholar] [CrossRef]
  2. Chetty, C.; Rossin, C.; Gruissem, W.; Vanderschuren, H.; Rey, M. Empowering biotechnology in southern Africa: Establishment of a robust transformation platform for the production of transgenic industry-preferred cassava. New Biotechnol. 2013, 30, 136–143. [Google Scholar] [CrossRef]
  3. Food and Agriculture Organization of the United Nations. Cassava, Production Quantity (Tons)-for all Countries; Food and Agriculture Organization of the United Nations: Rome, Italy, 2017. [Google Scholar]
  4. Malik, A.I.; Kongsil, P.; Nguyễn, V.A.; Ou, W.; Sholihin-Srean, P.; Sheela, M.N.; López-Lavalle, L.A.B.; Utsumi, Y.; Lu, C.; Kittipadakul, P.; et al. Cassava breeding and agronomy in Asia: 50 years of history and future directions. Breed. Sci. 2020, 70, 145–166. [Google Scholar] [CrossRef] [Green Version]
  5. Fermont, A.; van Asten, P.; Tittonell, P.; van Wijk, M.; Giller, K. Closing the cassava yield gap: An analysis from smallholder farms in East Africa. Field Crop. Res. 2009, 112, 24–36. [Google Scholar] [CrossRef]
  6. El-Sharkawy, M.A. Stress-Tolerant Cassava: The role of integrative ecophysiology-breeding research in crop improvement. Open J. Soil Sci. 2012, 2, 162–186. [Google Scholar] [CrossRef] [Green Version]
  7. Okogbenin, E.; Setter, T.L.; Ferguson, M.; Mutegi, R.; Ceballos, H.; Olasanmi, B.; Fregene, M. Phenotypic approaches to drought in cassava: Review. Front. Physiol. 2013, 4, 93. [Google Scholar] [CrossRef] [Green Version]
  8. Alves, A.A.C. Cassava botany and physiology. In Cassava: Biology, Production and Utilization; CABI Publishing: Wallingford, UK, 2009; pp. 67–89. [Google Scholar]
  9. Food and Agriculture Organization of the United Nations. Save and Grow a Guide to Sustainable Production Intensification; Food and Agriculture Organization of the United Nations: Rome, Italy, 2013. [Google Scholar]
  10. Keating, B.A.; Evenson, J.P.; Fukai, S. Environmental effects on growth and development of cassava (Manihot esculenta Crantz.). I. crop development. Field Crop. Res. 1982, 5, 271–281. [Google Scholar] [CrossRef]
  11. Mahakosee, S.; Jogloy, S.; Vorasoot, N.; Theerakulpisut, P.; Banterng, P.; Kesmala, T.; Holbrook, C.C.; Kvien, C.K. Seasonal variations in canopy size and yield of Rayong 9 cassava genotype under rainfed and irrigated conditions. Agronomy 2019, 9, 362. [Google Scholar] [CrossRef] [Green Version]
  12. Niinemets, U. Photosynthesis and resource distribution through plant canopies. Plant Cell Environ. 2007, 30, 1052–1071. [Google Scholar] [CrossRef]
  13. Kim, S.-H.; Yang, Y.; Timlin, D.J.; Fleisher, D.H.; Dathe, A.; Reddy, V.R.; Staver, K. Modeling temperature responses of leaf growth, development, and biomass in maize with MAIZSIM. Agron. J. 2012, 104, 1523–1537. [Google Scholar] [CrossRef] [Green Version]
  14. Zhang, Z.; Zhou, X.B.; Chen, Y.H. Effects of irrigation and precision planting patterns on photosynthetic product of wheat. Agron. J. 2016, 108, 2322–2328. [Google Scholar] [CrossRef]
  15. de Souza, A.P.; Massenburg, L.N.; Jaiswal, D.; Cheng, S.; Shekar, R.; Long, S.P. Rooting for cassava: Insights into photosynthesis and associated physiology as a route to improve yield potential. New Phytol. 2016, 213, 50–65. [Google Scholar] [CrossRef] [PubMed]
  16. El-Sharkawy, M.A.; Cock, J.H.; Lynam, J.K.; Hernàndez, A.D.P.; Cadavid, L.F.L. Relationships between biomass, root-yield and single-leaf photosynthesis in field-grown cassava. Field Crop. Res. 1990, 25, 183–201. [Google Scholar] [CrossRef]
  17. de Tafur, S.; El-Sharkawy, M.; Calle, F. Photosynthesis and yield performance of cassava in seasonally dry and semiarid environments. Photosynthetica 1998, 33, 249–257. [Google Scholar] [CrossRef]
  18. Tewodros, M.; Ayenew, B. Cassava (Manihot esculenta Crantz) varieties and harvesting stages influenced by yield and yield related components. J. Nat. Sci. Res. 2012, 2, 122–128. [Google Scholar]
  19. Ekanayake, I.J. Procedures for Growth Analysis of Cassava, 1st ed.; International Institute of Tropical Agriculture (IITA): Ibadan, Nigeria, 1996; p. 28. [Google Scholar]
  20. Cock, J.H.; Franklin, D.; Sandoval, G.; Juri, P. The ideal cassava plant for maximum yield. Crop. Sci. 1979, 19, 271–279. [Google Scholar] [CrossRef]
  21. Cock, J.H. Strategies of cassava plant for resistant drought. Cassava Newsl. 1984, 8, 4–10. [Google Scholar]
  22. Cock, J.H.; El-Sharkawy, M.A. Physiological characteristics for cassava selection. Exp. Agric. 1988, 24, 443–448. [Google Scholar] [CrossRef]
  23. El-Sharkawy, M.A. Drought-tolerant cassava for Africa, Asia, and Latin America. Bioscience 1993, 43, 441–451. [Google Scholar] [CrossRef]
  24. Lahai, T.; Ekanayake, I.J.; Koroma, J.P.C. Influence of canopy structure on yield of cassava cultivars at various toposequences of an inland valley agro ecosystem. J. Agric. Biotechnol. Sustain. Dev. 2013, 5, 36–47. [Google Scholar] [CrossRef]
  25. Werner, C.; Ryel, R.J.; Correia, O.; Beyschlag, W. Structural and functional variability within the canopy and its relevance for carbon gain and stress avoidance. Acta Oecologica 2001, 22, 129–138. [Google Scholar] [CrossRef]
  26. Howeler, R.H. Cassava agronomy research in Asia: Has it benefited cassava farmers? In Cassava’s Potential in Asia in the 21st Century: Present Situation and Future Research and Development Needs, Proceedings 6th Regional Workshop, Ho Chi Ming City, Vietnam, 21–25 February 2000; Howeler, R.H., Tan, S.L., Eds.; Centro Internacional de Agricultura Tropical (CIAT), Cassava Office for Asia: Bangkok, Thailand, 2001; pp. 345–382. [Google Scholar]
  27. Good Agricultural Practices for Cassava. Available online: http://www.acfs.go.th/standard/download/eng/GAP_cassava.pdf (accessed on 20 August 2019).
  28. Monteith, J.L. Solar radiation and productivity in tropical ecosystems. J. Appl. Ecol. 1972, 9, 747. [Google Scholar] [CrossRef] [Green Version]
  29. The Meteorological Department of Thailand. Available online: https://www.tmd.go.th/thailand_suntime.php (accessed on 3 January 2018).
  30. LI-COR Inc. LAI-2000 Plant Canopy Analyzer Instruction/Operating Manual; LI-COR Inc.: Lincoln, NE, USA, 1992. [Google Scholar]
  31. Phoncharoen, P.; Banterng, P.; Vorasoot, N.; Jogloy, S.; Theerakulpisut, P.; Hoogenboom, G. Growth rates and yields of cassava at different planting dates in a tropical savanna climate. Sci. Agric. 2019, 76, 376–388. [Google Scholar] [CrossRef] [Green Version]
  32. Wholey, D.W.; Booth, R.H. A comparison of simple methods for estimating starch content of cassava roots. J. Sci. Food Agric. 1979, 30, 158–164. [Google Scholar] [CrossRef]
  33. Statistix 10, Version 10: Analytical Software User’s Manual; Analytical Software: Tallahassee, FL, USA, 2013.
  34. Moore, K.J.; Dixon, P. Analysis of combined experiments revisited. Agron. J. 2015, 107, 763–771. [Google Scholar] [CrossRef]
  35. Lenis, J.; Calle, F.; Jaramillo, G.; Perez, J.; Ceballos, H.; Cock, J. Leaf retention and cassava productivity. Field Crop. Res. 2006, 95, 126–134. [Google Scholar] [CrossRef]
  36. Irikura, Y.; Cock, J.H.; Kawano, K. The physiological basis of genotype—Temperature interactions in cassava. Field Crop. Res. 1979, 2, 227–239. [Google Scholar] [CrossRef]
  37. Phosaengsri, W.; Banterng, P.; Vorasoot, N.; Jogloy, S.; Theerakulpisut, P. Leaf performances of cassava genotypes in different seasons and its relationship with biomass. Turk. J. Field Crop. 2019, 24, 54–64. [Google Scholar] [CrossRef]
  38. El-Sharkawy, M.A.; de Tafur, S.; Cadavid, L.F. Potential Photosynthesis of Cassava as Affected by Growth Conditions. Crop. Sci. 1992, 32, 1336–1342. [Google Scholar] [CrossRef]
  39. Vongcharoen, K.; Santanoo, S.; Banterng, P.; Jogloy, S.; Vorasoot, N.; Theerakulpisut, P. Seasonal variation in photosynthesis performance of cassava at two different growth stages under irrigated and rain-fed conditions in a tropical savanna climate. Photosynthetica 2018, 56, 1398–1413. [Google Scholar] [CrossRef]
  40. Lowe, S.B.; Mahon, J.D.; Hunt, L.A. The effect of daylength on shoot growth and formation of root tubers in young plants of cassava (Manihot esculenta Crantz). Plant Sci. Lett. 1976, 6, 57–62. [Google Scholar] [CrossRef]
  41. Veltkamp, H.J. Partitioning of Dry Matter in Cassava. Ph.D. Thesis, Agricultural University, Wageningen, The Netherlands, 18 September 1985. [Google Scholar]
  42. Xu, L.; Li, X.; Wang, X.; Xiong, D.; Wang, F. Comparing the grain yields of direct-seeded and transplanted rice: A Meta-Analysis. Agronomy 2019, 9, 767. [Google Scholar] [CrossRef] [Green Version]
  43. Okogbenin, E.; Ekanayake, I.J.; Porto, M.C.M. Effect of planting materials and soil moisture on cassava performance in the semi-arid Sudan Savannah belt of Nigeria. Afr. Crop Sci. J. 1999, 1, 21–33. [Google Scholar]
  44. Lian, T.S.; Cock, J.H. Branching habit as a yield determinant in cassava. Field Crop. Res. 1979, 2, 281–289. [Google Scholar] [CrossRef]
Figure 1. Minimum (-----), maximum () and average (·····) temperatures, relative humidity (− − −) and solar radiation (−−−) in May (a) and November (b) 2015, and May (c) and November (d) 2016.
Agronomy 10 01554 g001
Figure 2. Biomass (a), dry weight (DW) for storage root (b) and shoot (c), harvest index (HI) (d), storage root yield (e) and starch content (f) of three cassava genotypes at harvest (12 months after planting) when planted in May and November in 2015 and 2016. The same letters in each genotype are not significantly different by least significant difference (p < 0.05).
Agronomy 10 01554 g002
Figure 3. Canopy height (a), canopy width (b), canopy area (c) and canopy volume (d) of three cassava genotypes when planted in May (1,2) and November (3,4) of 2015 and 2016. The bars indicate standard deviation of means.
Agronomy 10 01554 g003
Figure 4. Leaf area index of three cassava genotypes when planted in May (a) and November (b) 2015 and May (c) and November (d) 2016. The bars indicate standard deviation of means.
Agronomy 10 01554 g004
Figure 5. Light penetration of three cassava genotypes at planting dates May (a) and November (b) 2015 and May (c) and November (d) 2016. The bars indicate standard deviation of means.
Agronomy 10 01554 g005
Figure 6. Photosynthesis of the cassava leaves of top (a), middle (b) and lower (c) canopy at 3, 6, 9 and 12 months after planting (MAP) when planted in November 2015 (1) and May (2) and November (3) 2016. The bars indicate the standard deviation of means.
Agronomy 10 01554 g006
Table 1. Chemical and physical properties of the soil in the experimental fields at the depth 0–30 and 30–60 cm at planting date May and November 2015 and 2016.
Planting DateMay 2015/2016November 2015/2016May 2016/2017November 2016/2017
Depth (cm)0–3030–600–3030–600–3030–600–3030–60
Soil Chemical
pH 1:1 H2O7.27.06.36.17.37.27.17.5
Organic matter (%)0.40.40.50.30.50.40.50.2
Total N (%)0.0210.0180.0200.0130.0240.0220.0370.030
Available P (mg kg−1)61.256.551.642.177.676.188.527.9
Exchangeable K (mg kg−1)54.635.639.433.434.225.630.823.9
Exchangeable Ca (mg kg−1)338.8386.8232.5277.5359.0364.5481.5460.5
EC 1:5 H2O (ds m−1)0.0430.0690.0620.0310.060.0540.0730.035
CEC (c mol kg−1)3.003.443.748.262.973.723.746.69
Soil Physical
Texture ClassLoamy-sandLoamy-sandSandy-loamSandy-loamSandSandLoamy-sandSandy-loam
EC; Electrical conductivity, CEC; Cation exchange capacity.
Table 2. Mean squares for biomass (BM), dry weight (DW) for storage root and shoot, harvest index (HI), starch content (SC) and storage root yield (SRY) of three cassava genotypes with May and November planting dates in 2015 and 2016.
SourceDegrees of FreedomBMStorage Root DWShoot DWHISCSRY
Years (Y)11,801,181 * (11.4)1,020,201 ** (10.7)5,327,288 ** (66.5)0.217 ** (52.0)75.1 ** (11.4)103.2 ns (2.4)
Planting date (D)18,133,010 ** (51.5)3,428,545 ** (36.0)1,018,801 ** (12.7)0.020 ** (4.7)72.3 ** (11.0)1798.2 ** (42.2)
Y *D190,813 ns (0.6)71,469 ns (0.7)1862 ns (0.0)0.021 ** (5.1)58.3 ** (8.9)4.2 ns (0.1)
Error Y *D *R12120,180 (9.1)72,044 (9.1)32,822 (4.9)0.001 (3.6)2.8 (5.2)47.9 (13.2)
Genotypes (G)2371,345 * (4.7)548,750 ** (11.5)92,956 ** (2.3)0.024 ** (11.6)86.9 ** (26.4)146.7 * (6.8)
Y *G2171,245 ns (2.2)35,909 ns (0.8)289,226 ** (7.2)0.003 ns (1.3)18.1 ** (5.5)21.2 ns (1.0)
D *G2355,615 * (4.5)764,608 ** (16.0)45,212 ns (1.1)0.024 ** (11.6)23.0 ** (7.0)418.4 ** (19.6)
Y *D *G255,382 ns (0.7)42,008 ns (0.9)4853 ns (0.1)0.000 ns (0.1)60.0 ** (18.2)51.8 ns (2.4)
Error Y *D *R *G24100,453 (15.3)56,893 (14.3)16,752 (5.0)0.002 (10.0)1.7 (6.3)22.9 (12.3)
Total47
CV (Y *D *R) 10.615.611.96.66.214.6
CV (Y *D *R *G) 9.713.98.57.74.810.0
ns, *, ** = non-significant and significant at p ≤ 0.05 and p ≤ 0.01 probability levels, respectively, Values in parentheses are percentages of sum squares. CV; coefficient of variation (%).
Table 3. Stepwise regression analysis for canopy traits and climatic factors for three cassava genotypes planted in May 2015.
Traits/GenotypesKU50Rayong 11CMR38-125-77
VariableCoefficientpR2p-Value for RegressionVariableCoefficientpR2p-Value for RegressionVariableCoefficientpR2p-Value for Regression
CHConstant59.540.490.810.05Constant157.560.020.850.05Constant58.650.500.770.05
SR−0.370.02 SR−0.40<0.01 SR−0.310.05
RH3.52<0.01 RH2.19<0.01 RH3.10<0.01
CWConstant48.570.460.910.05Constant462.18<0.010.920.05Constant532.35<0.010.910.05
SR−0.63<0.01 SR−0.39<0.01 SR−0.51<0.01
RH2.91<0.01 Taver−23.45<0.01 Tmax−15.23<0.01
Tmin8.970.02 Tmin21.520.01 Tmin15.63<0.01
CAConstant0.040.980.810.05Constant6.28<0.010.890.05Constant8.01<0.010.910.05
SR−0.010.04 SR−0.010.01 SR−0.01<0.01
RH0.07<0.01 Taver−0.36<0.01 Tmax−0.25<0.01
Tmin0.35<0.01 Tmin0.26<0.01
CVConstant−6.990.010.640.05Constant0.500.760.810.05Constant−4.490.010.650.05
RH0.14<0.01 SR−0.010.02 RH0.09<0.01
RH0.07<0.01
LAIConstant−10.420.030.910.05Constant−12.210.010.920.05Constant−9.010.040.910.05
SR−0.03<0.01 SR−0.03<0.01 SR−0.02<0.01
RH0.10<0.01 RH0.10<0.01 RH0.10<0.01
DL1.710.01 DL1.840.01 DL1.340.03
CH; canopy height, CW; canopy width, CA; canopy area, CV; canopy volume, LAI; leaf area index, RH; relative humidity, Tmin; minimum temperature, Tmax; maximum temperature, Taver; average temperature, DL; day length, SR; solar radiation.
Table 4. Stepwise regression analysis for canopy traits and climatic factors for three cassava genotypes planted in November 2015.
Traits/GenotypesKU50Rayong11CMR38-125-77
VariableCoefficientpR2p-Value for RegressionVariableCoefficientpR2p-Value for RegressionVariableCoefficientpR2p-Value for Regression
CHConstant−385.530.010.820.05Constant−250.990.010.850.05Constant−440.22<0.010.930.05
RH−1.470.01 RH−1.82<0.01 RH−1.05<0.01
DL45.950.01 DL35.97<0.01 Tmin−6.230.01
DL59.54<0.01
CWConstant−267.590.020.600.05Constant758.030.120.880.05Constant−294.590.010.680.05
DL31.60<0.01 RH−6.160.04 DL34.46<0.01
Tmax−34.380.03
Tmin22.730.05
DL35.000.02
CAConstant2.930.420.900.05Constant7.650.180.950.05Constant−6.25<0.010.770.05
RH−0.060.03 RH−0.080.02 DL0.62<0.01
Taver−0.630.02 Tmax−0.470.01
Tmin0.470.04 Tmin0.320.02
DL0.75<0.01 DL0.630.01
CVConstant−9.18<0.010.710.05Constant3.510.400.970.05Constant−8.93<0.010.880.05
DL0.84<0.01 SR0.010.03 RH−0.010.05
RH−0.100.01 DL0.89<0.01
Taver−0.860.01
Tmin0.700.02
DL0.77<0.01
LAIConstant55.700.020.840.05Constant52.570.020.830.05Constant−6.560.120.820.05
RH−0.420.01 RH−0.410.01 RH−0.10<0.01
Tmax−1.680.02 Tmax−1.630.03 DL1.26<0.01
Tmin1.380.01 Tmin1.390.01
CH; canopy height, CW; canopy width, CA; canopy area, CV; canopy volume, LAI; leaf area index, RH; relative humidity, Tmin; minimum temperature, Tmax; maximum temperature, Taver; average temperature, DL; day length, SR; solar radiation.
Table 5. Stepwise regression analysis for canopy traits and climatic factors for three cassava genotypes planted in May 2016.
Traits/GenotypesKU50Rayong 11CMR38-125-77
VariableCoefficientpR2p-Value for RegressionVariableCoefficientpR2p-Value for RegressionVariableCoefficientpR2p-Value for Regression
CHConstant193.130.190.690.05Constant343.94<0.010.810.05Constant246.050.020.770.05
RH3.80<0.01 SR−0.330.01 RH2.95<0.01
DL−31.270.03 Taver10.820.05 DL−30.16<0.01
DL−33.150.02
CWConstant789.260.010.620.05Constant555.46<0.010.810.05Constant562.840.010.600.05
Taver−65.230.01 SR−0.290.04 Taver−42.460.01
Tmin47.41<0.01 DL−25.440.02 Tmin30.500.01
CAConstant7.690.050.720.05Constant10.13<0.010.770.05Constant8.790.020.560.05
RH0.10<0.01 Tmin0.170.02 Taver−0.710.01
DL−1.100.01 DL−1.090.01 Tmin0.510.01
CVConstant9.370.040.730.05Constant10.22<0.010.760.05Constant11.760.020.560.05
RH0.12<0.01 Tmin0.170.03 Taver−0.950.01
DL−1.340.01 DL−1.11<0.01 Tmin0.670.01
LAIConstant−2.400.130.460.05Constant2.128.330.000.05Constant−2.870.060.550.05
RH0.060.01 RH0.070.01
CH; canopy height, CW; canopy width, CA; canopy area, CV; canopy volume, LAI; leaf area index, RH; relative humidity, Tmin; minimum temperature, Tmax; maximum temperature, Taver; average temperature, DL; day length, SR; solar radiation.
Table 6. Stepwise regression analysis for canopy traits and climatic factors for three cassava genotypes planted in November 2016.
Traits/GenotypesKU50Rayong 11CMR38-125-77
VariableCoefficientpR2p-Value for RegressionVariableCoefficientpR2p-Value for RegressionVariableCoefficientpR2p-Value for Regression
CHConstant−585.320.010.700.05Constant−448.12<0.010.910.05Constant−289.820.030.650.05
Taver−38.250.02 SR0.360.04 RH−2.030.01
Tmax34.47<0.01 RH−2.76<0.01 DL41.82<0.01
DL46.030.04 DL44.480.01
CWConstant320.880.370.790.05Constant97.780.000.000.05Constant−583.66<0.010.680.05
RH−10.240.02 Tmin−15.240.03
Taver−99.890.03 DL84.20<0.01
Tmin80.250.05
DL115.13<0.01
CAConstant−6.930.070.350.05Constant−8.840.040.410.05Constant−5.900.020.780.05
DL0.660.04 DL0.810.03 RH−0.040.01
Tmax−0.230.03
DL1.44<0.01
CVConstant1.02<0.010.000.05Constant−12.19<0.010.910.05Constant−9.29<0.010.720.05
SR0.020.01 RH−0.030.02
RH−0.030.04 DL1.01<0.01
Taver−0.370.03
DL1.40<0.01
LAIConstant−20.13<0.010.890.05Constant−21.84<0.010.920.05Constant−18.92<0.010.920.05
SR−0.020.03 SR−0.020.02 SR−0.02<0.01
Tmax0.420.02 Tmax0.360.04 Tmax0.57<0.01
DL1.41<0.01 DL1.80<0.01 DL1.12<0.01
CH; canopy height, CW; canopy width, CA; canopy area, CV; canopy volume, LAI; leaf area index, RH; relative humidity, Tmin; minimum temperature, Tmax; maximum temperature, Taver; average temperature, DL; day length, SR; solar radiation.

