Article

The Comparison of Constant and Dynamic Red and Blue Light Irradiation Effects on Red and Green Leaf Lettuce

by
Akvilė Viršilė
*,
Jurga Miliauskienė
,
Perttu Juhani Haimi
,
Kristina Laužikė
and
Giedrė Samuolienė
Lithuanian Research Centre for Agriculture and Forestry, Institute of Horticulture, Kaunas str. 30, 54333 Babtai, Lithuania
*
Author to whom correspondence should be addressed.
Submission received: 29 October 2020 / Revised: 12 November 2020 / Accepted: 13 November 2020 / Published: 17 November 2020

Abstract

:
In this study, we sought to evaluate and compare the effects of constant and dynamic lighting on red and green leaf lettuce (Lactuca sativa L. Red Cos and Lobjoits Green cos) cultivated in a controlled environment. Plants were illuminated with the combination of red 662 and 638 nm, blue 452 nm, and far-red 737 nm at 16 h photoperiod and constant daily light integral (DLI) of each component. Five constant or dynamic lighting treatments were performed: (BR) constant flux of both B452 and R662; (B*R) constant flux of R662, but the DLI of B452 condensed in 8 h in the middle of photoperiod doubling the PPFD of blue light; (BR*) constant flux of B452, but the DLI of R662 light condensed in the middle of photoperiod; (BdynR) constant flux of R662, but the flux of B452 varies in the sinusoidal profile during 16 h photoperiod, imitating diurnal increase and decrease in lighting intensity; and (BRdyn) constant flux of B452, but the flux of R662 varies in sinusoidal profile. The lettuce’s response to dynamic lighting strategies was cultivar specific. Dynamic lighting strategies, mimicking natural lighting fluctuations, did not have a remarkable effect on photosynthesis and antioxidative parameters, but the dynamic flux of blue light component had a pronounced effect on higher macro and microelement contents in lettuce leaves.

1. Introduction

Fluctuating light is the norm for photosynthetic organisms in the natural environment. It has a wide range of frequencies (0.00001 to 10 Hz) owing to diurnal cycles, cloud cover, canopy shifting, and mixing, with broad implications for climate change, agriculture, and bioproduct production [1,2]. Therefore, leaves are subjected to spatial and temporal gradients in incident light, which is the key resource for photosynthesis, and plants acclimate to the light environment under which they are grown to maintain performance and fitness. They have mechanisms to enhance the capture of light energy when light intensity is low. However, they can also slow down photosynthetic electron transport to prevent reactive oxygen species’ production and consequent damage to the photosynthetic machinery under excess light. Plants have a highly responsive regulatory system to balance the photosynthetic light reactions with downstream metabolism [1,3,4,5]. Acclimation involves altering metabolic processes (including light-harvesting and CO2 capture) brought about by various mechanisms, from adjustments to leaf morphology to changes in photosynthetic apparatus stoichiometry [1,5,6], all of which impact photosynthesis and plant performance.
Irradiance from sunlight changes in a sinusoidal manner during the day. Gradual light-dark shifts characterize it at dawn and dusk [7]. In contrast, in a controlled environment, horticulture plants are typically exposed to a constant irradiance during the day and abrupt transitions between light and dark at dawn and dusk (square-wave irradiance) [5,7,8]. Moreover, in the natural environment, higher plants sense and respond to a range of the light spectrum, from UV-B (295 nm) to the far red (720–780 nm), and exposure to each light spectrum triggers certain responses by plants [9]. When in a closed, controlled environment, agricultural systems combinations of red (R) and blue (B) light-emitting diodes (LEDs) are sufficient for normal plant growth and productivity of various crops [10,11] because they are the major energy sources for photosynthetic CO2 assimilation in plants [12]. It was widely analyzed and revealed that LEDs with different RB ratios significantly impact growth, metabolite content, and resource use efficiency in various leafy vegetables [8,13,14,15,16]. Nevertheless, the spectra’s great variability in currently available literature does not allow for identifying the optimal RB ratio in the light spectrum for lettuce cultivation [17].
This suggests that plants in controlled environments (plant factories) are exposed only to a restricted number of lighting parameters and do not employ their natural potential to adapt to changing natural environments. This is important for seeking high productivity and quality of vegetables, cultivated in closed, controlled environment agricultural systems, both interpreting the research results when various biotic and abiotic stresses are tested in a constant environment. Therefore, the approach taken here aimed to mimic natural fluctuations in the light intensity of red and blue light spectral components in a controlled manner. We sought to evaluate and compare the effects of constant and dynamic lighting on red and green leaf lettuce, one of the most popular crops in controlled environment agriculture.

2. Materials and Methods

2.1. Growing Conditions

Experiments were performed in the controlled environment walk-in growth chambers (4 × 6 m, h = 3.2 m) of the LAMMC Institute of Horticulture. Day/night temperatures of 21 ± 2/17 ± 2 °C were within 16 h photoperiod, and relative humidity of 50–60% was maintained. Green and red leaf lettuce, similar in morphology and growth (Lactuca sativa L. cv. Lobjoits Green Cos and cv. Red Cos, CN Seeds, UK) were grown in 120 mL vessels (3 plants per vessel; 28 vessels per treatment) in peat substrate, pH 6 (Profi 1, JSC Durpeta, Lithuania). The average amounts of primary nutrients (mg L−1) in the substrate were N, 110; P2O5, 50; K2O, 160 with microelements Fe, Mn, Cu, B, Mo, and Zn; electrical conductivity (EC) varied between 1.0 and 2.5 m S/cm. Plants were watered as needed, seeking to maintain equal humidity.

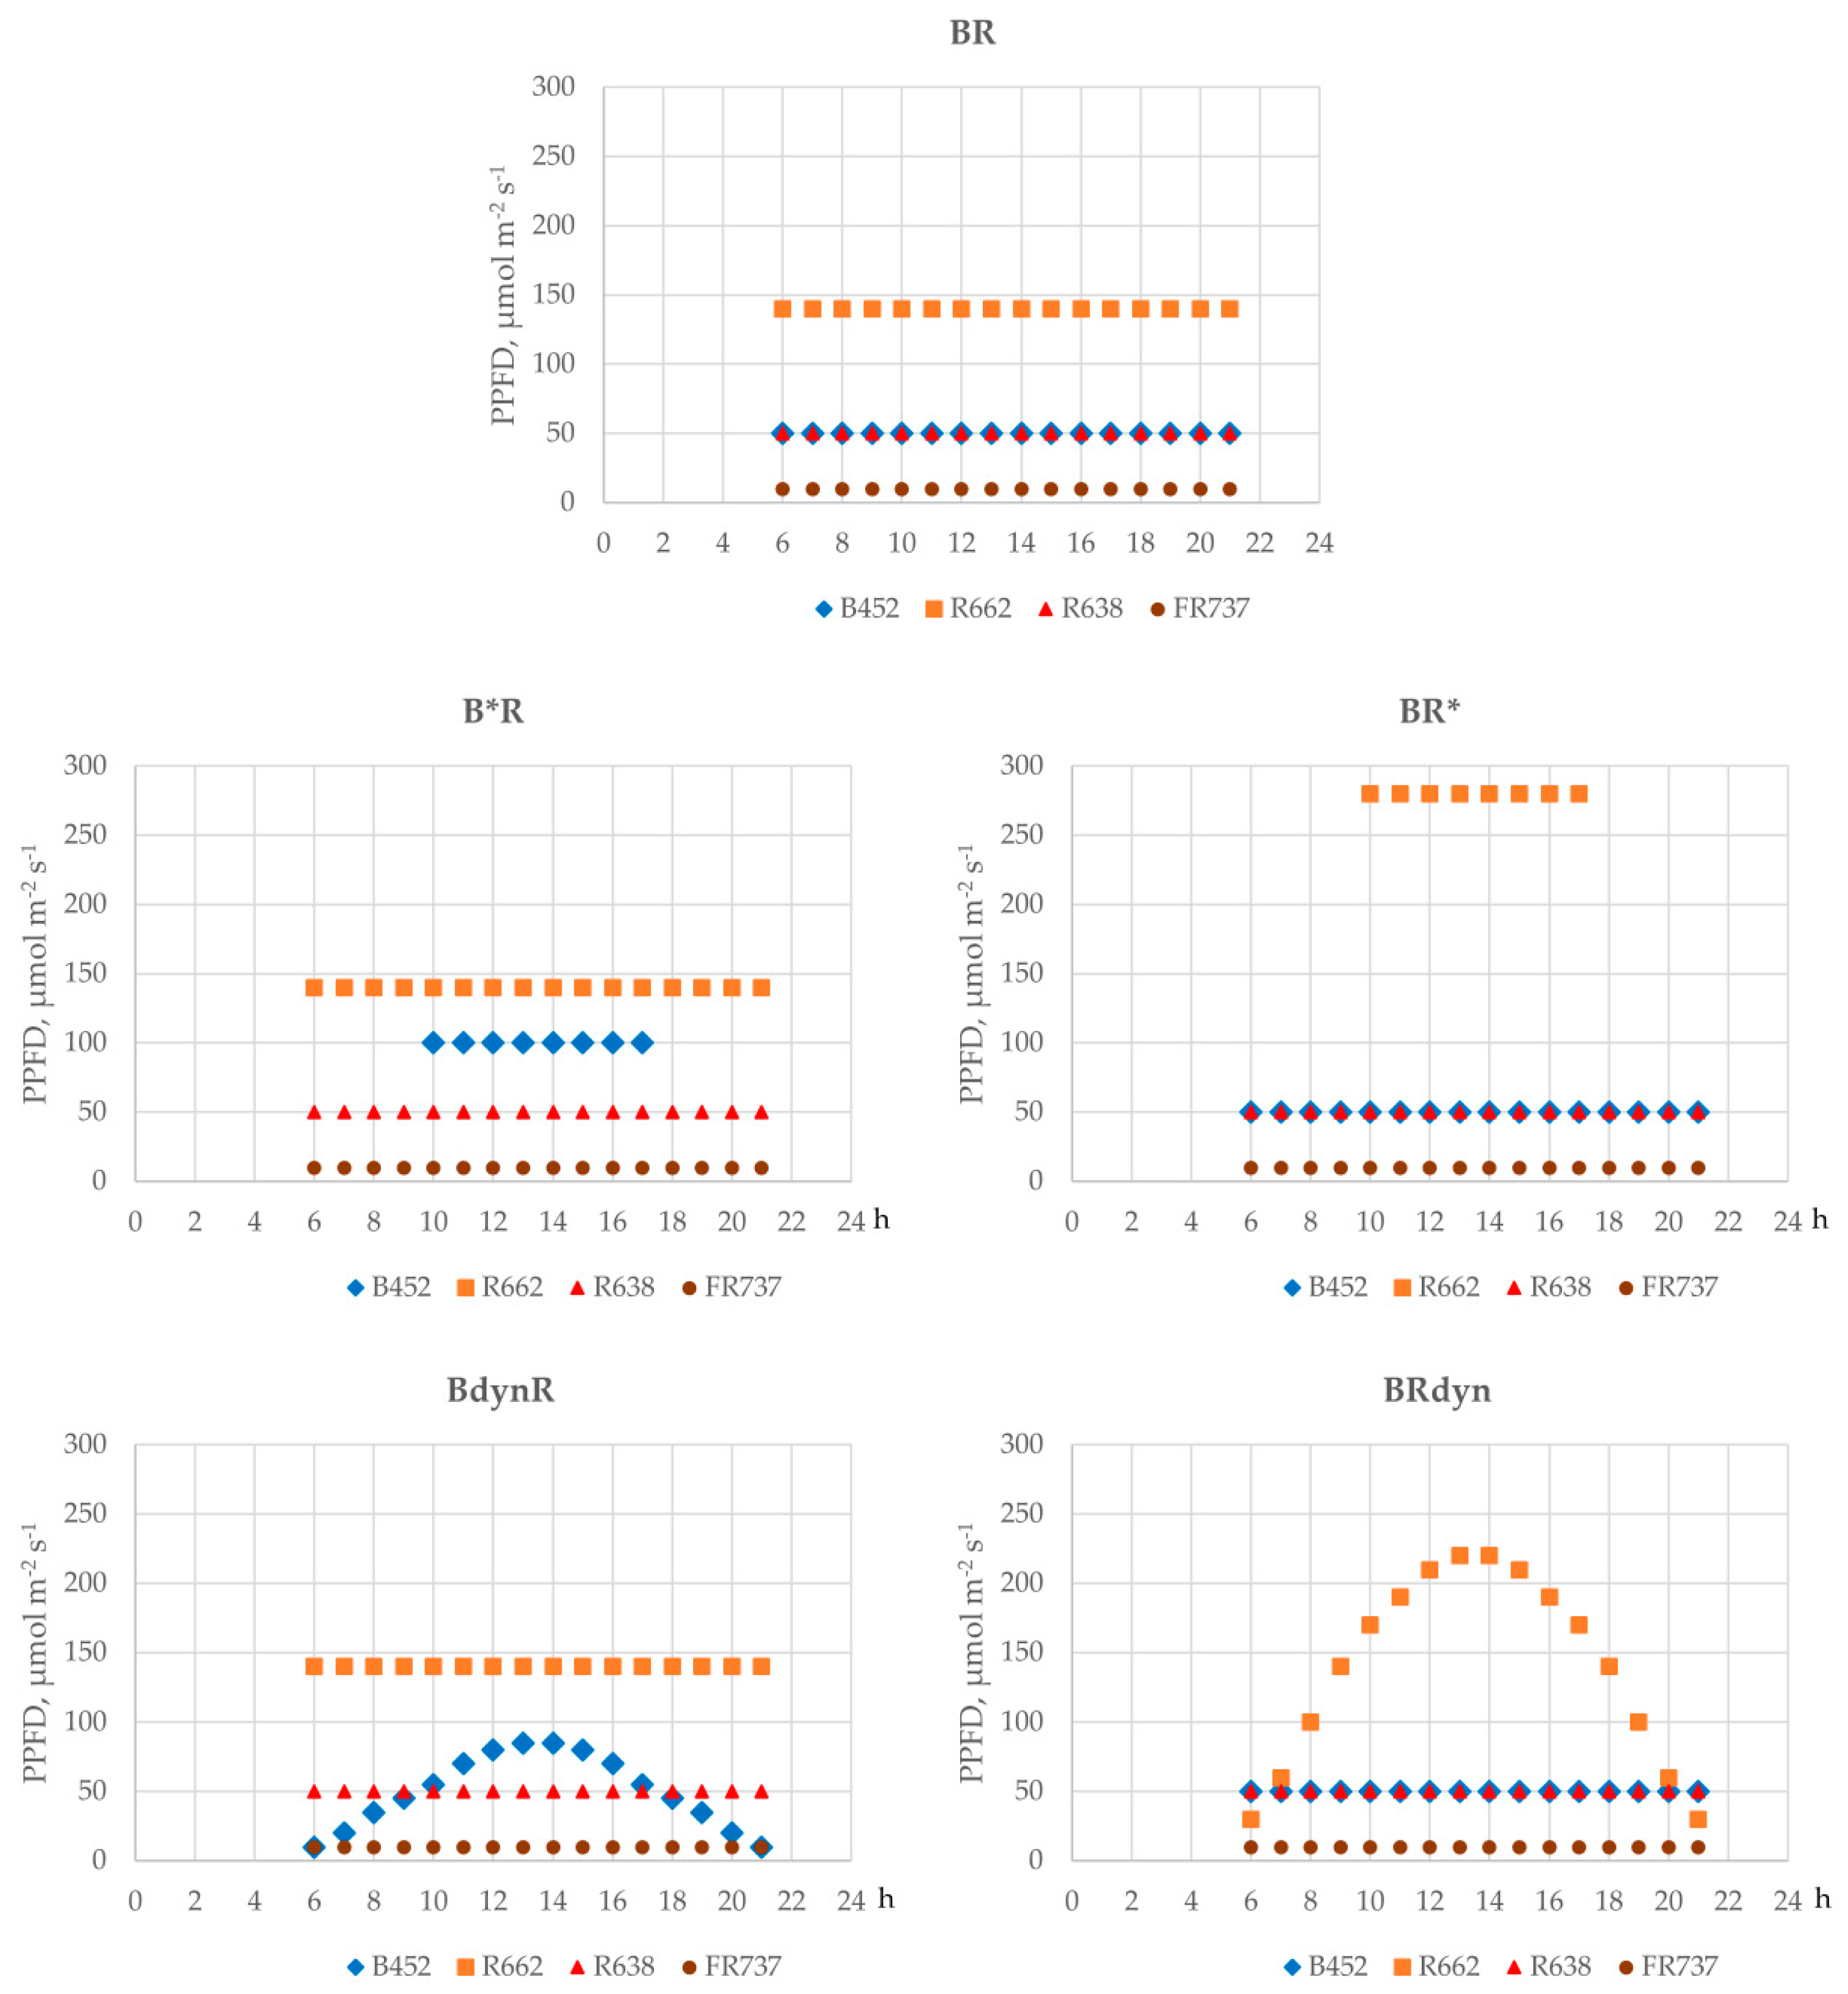
2.2. Lighting Treatments

Custom-made light-emitting diode (LED) lighting systems were used for illumination [18]. Lighting spectrum consisted of blue (B, λ = 452 nm, LedEngin LZ1-00B200, Osram Sylvania, Wilmington, MA, USA), red (R, λ = 638 nm, Luxeon LXHL-LD3C and λ = 662 nm Luxeon Rebel LXM3-PD01-0300, Lumileds, San Jose, CA, USA) and far red (FR, λ = 737 nm Cree Xlamp XP-E series XPEFAR-L1-0000-00501, Cree Inc., Durham, NC, USA) components. Selected LED wavelengths represented the peak absorbance of the main photoreceptors phytochrome and cryptochrome, chlorophyll, carotenoids. The experiments were designed to compare the constant and fluctuating lighting intensity effects of blue 452 nm and red 662 nm lighting components, maintaining total diurnal integral light quantity (daily light integral, DLI) constant (Table 1) during 16 h photoperiod. The intensities of R638 and FR737 components did not change during the photoperiod in all treatments.
Five lighting treatments were designed (Figure 1): (BR) Constant flux of both B452 and R662; (B*R) constant flux of R662, but the DLI of B452 condensed in 8 h in the middle of photoperiod doubling the photosynthetic photon flux density (PPFD) of blue light; (BR*) constant flux of B452, but the DLI of R662 light condensed in the middle of photoperiod doubling the PPFD; (BdynR) constant flux of R662, but the flux of B452 fluctuates in the sinusoid profile during 16 h photoperiod, imitating diurnal increase and decrease in lighting intensity, though DLI of blue component is not affected and (BRdyn) constant flux of B452, but the flux of R662 fluctuates in the sinusoid profile during 16 h photoperiod, imitating diurnal increase and decrease in lighting intensity. However, the DLI of this component is not affected (Figure 1).
Red leaf lettuce was cultivated for four weeks after germination under lighting conditions presented in Figure 1. At the end of the growing period, biometric, non-destructive, and biochemical analyses were performed. All biochemical analysis was performed in 3 biological and 3 analytical replications.

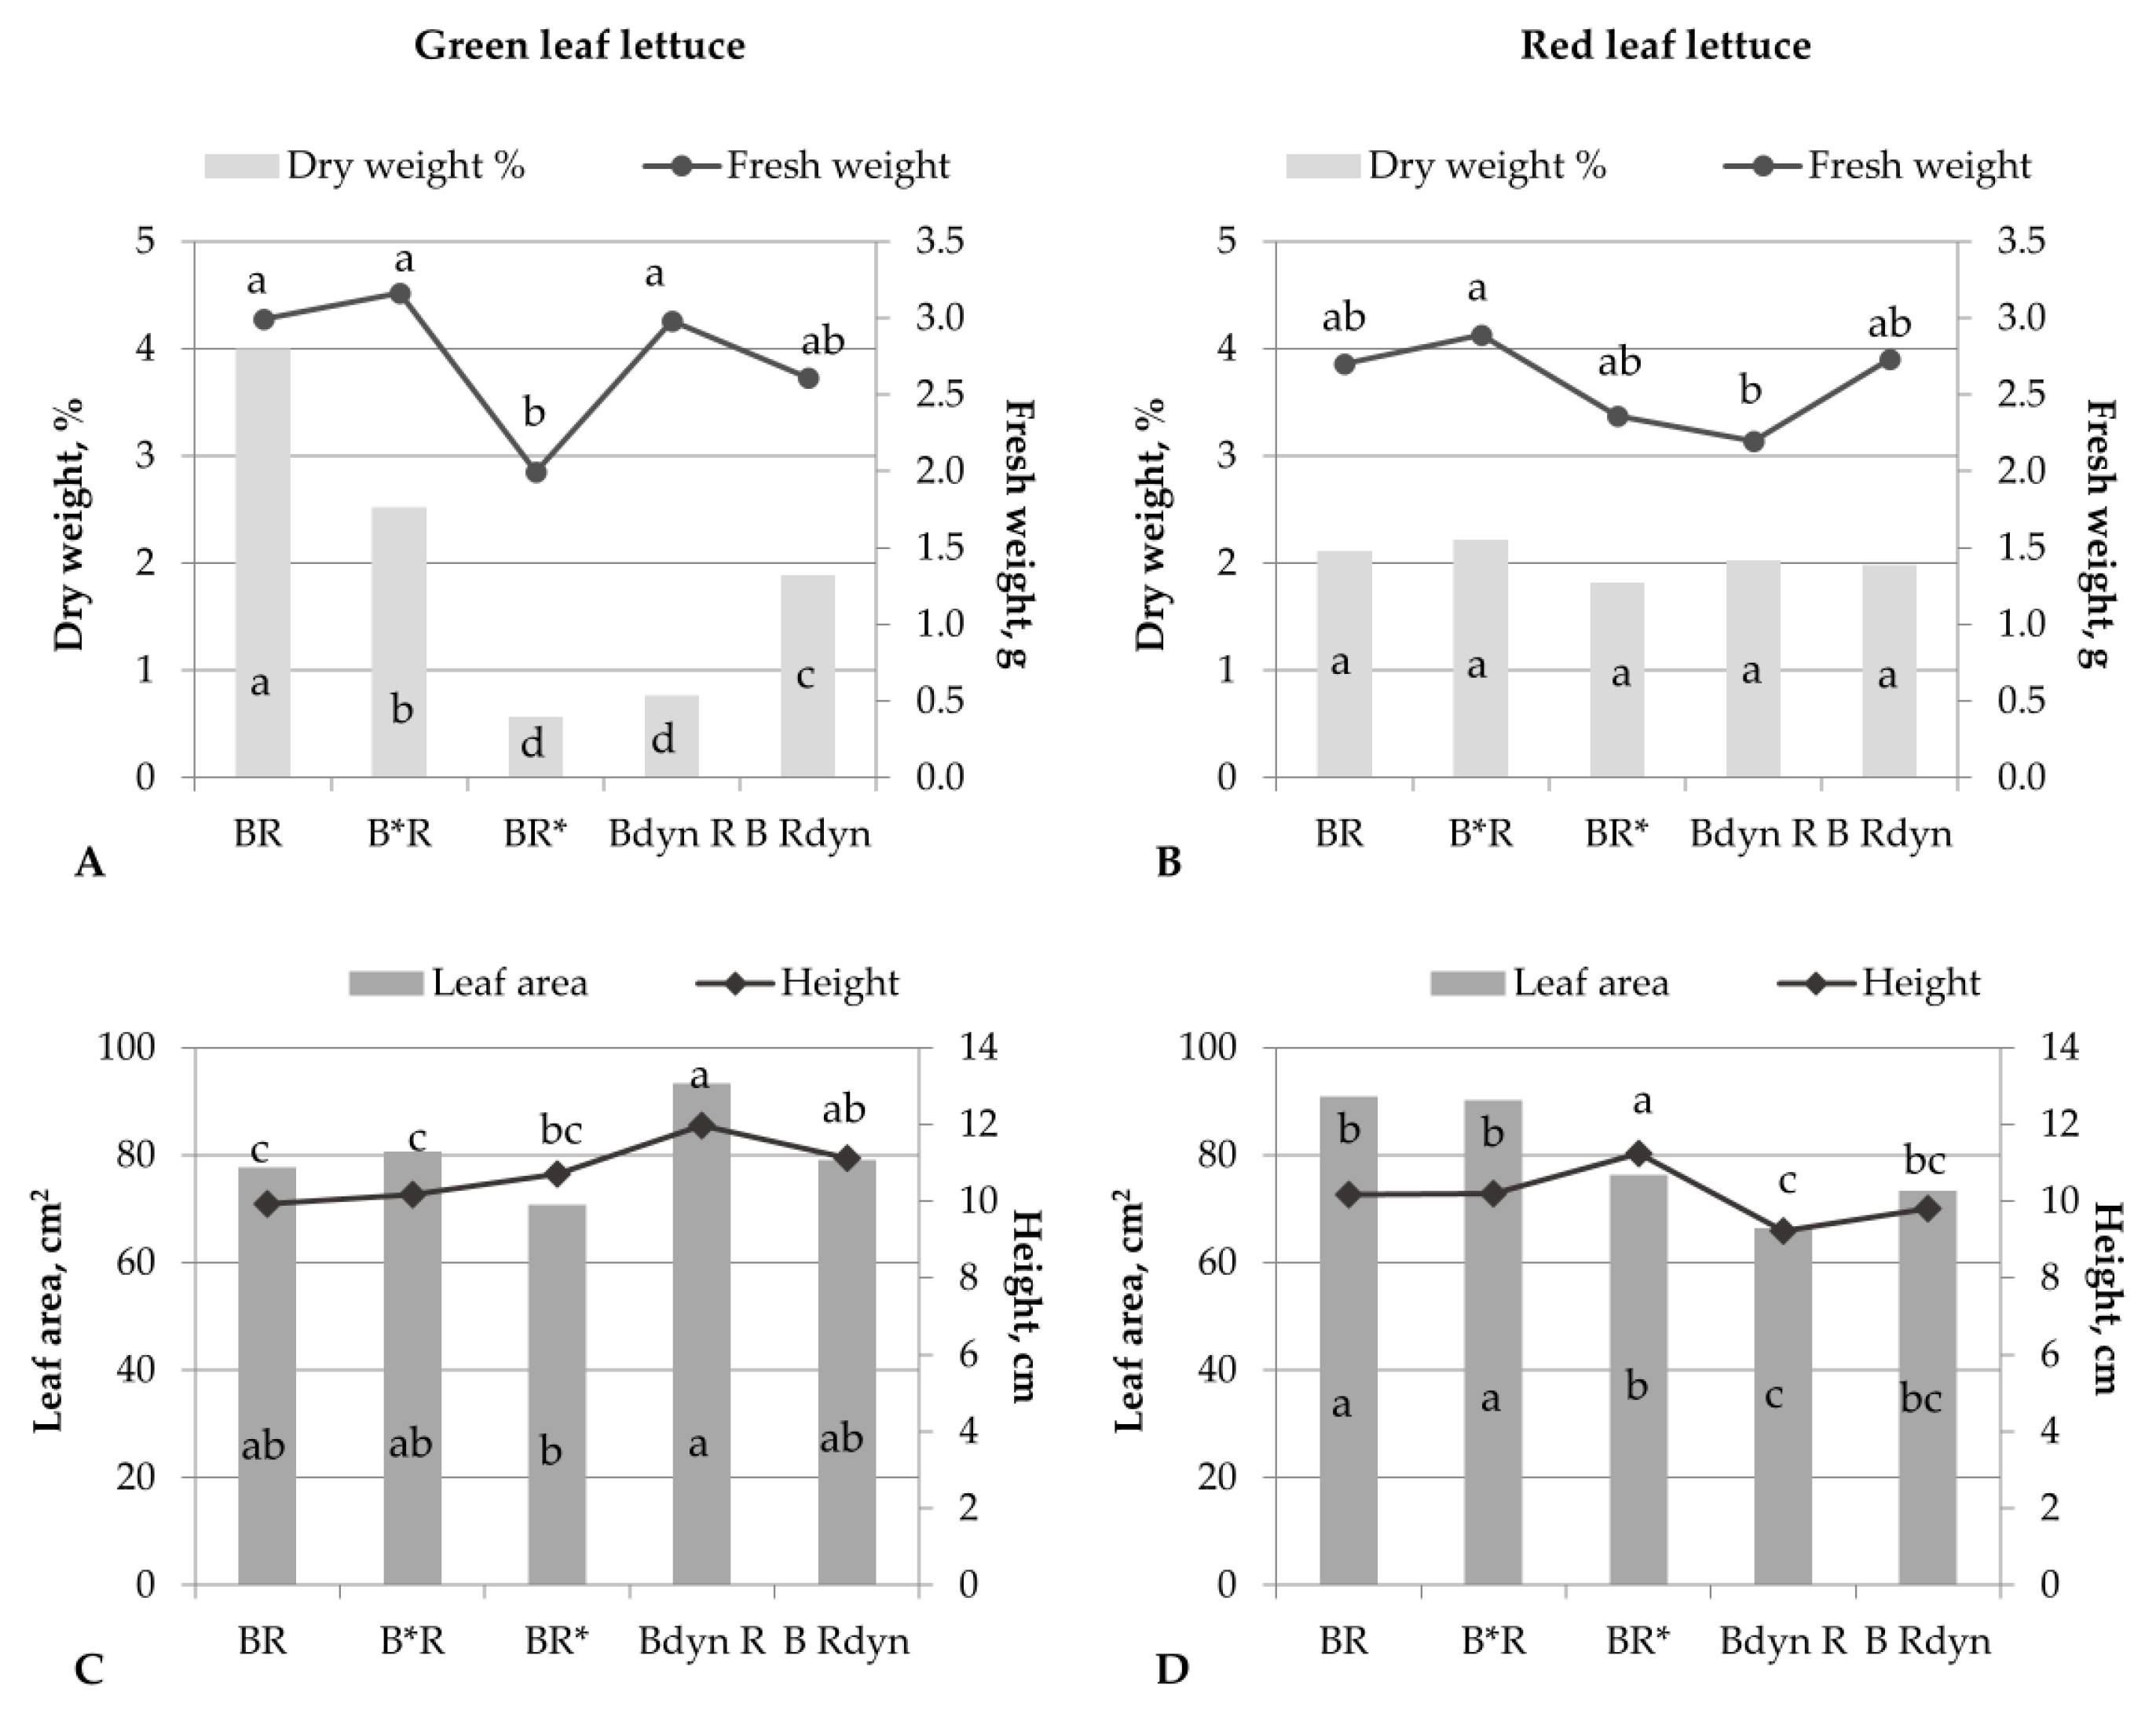
2.3. Biometric and Non-Destructive Measurements
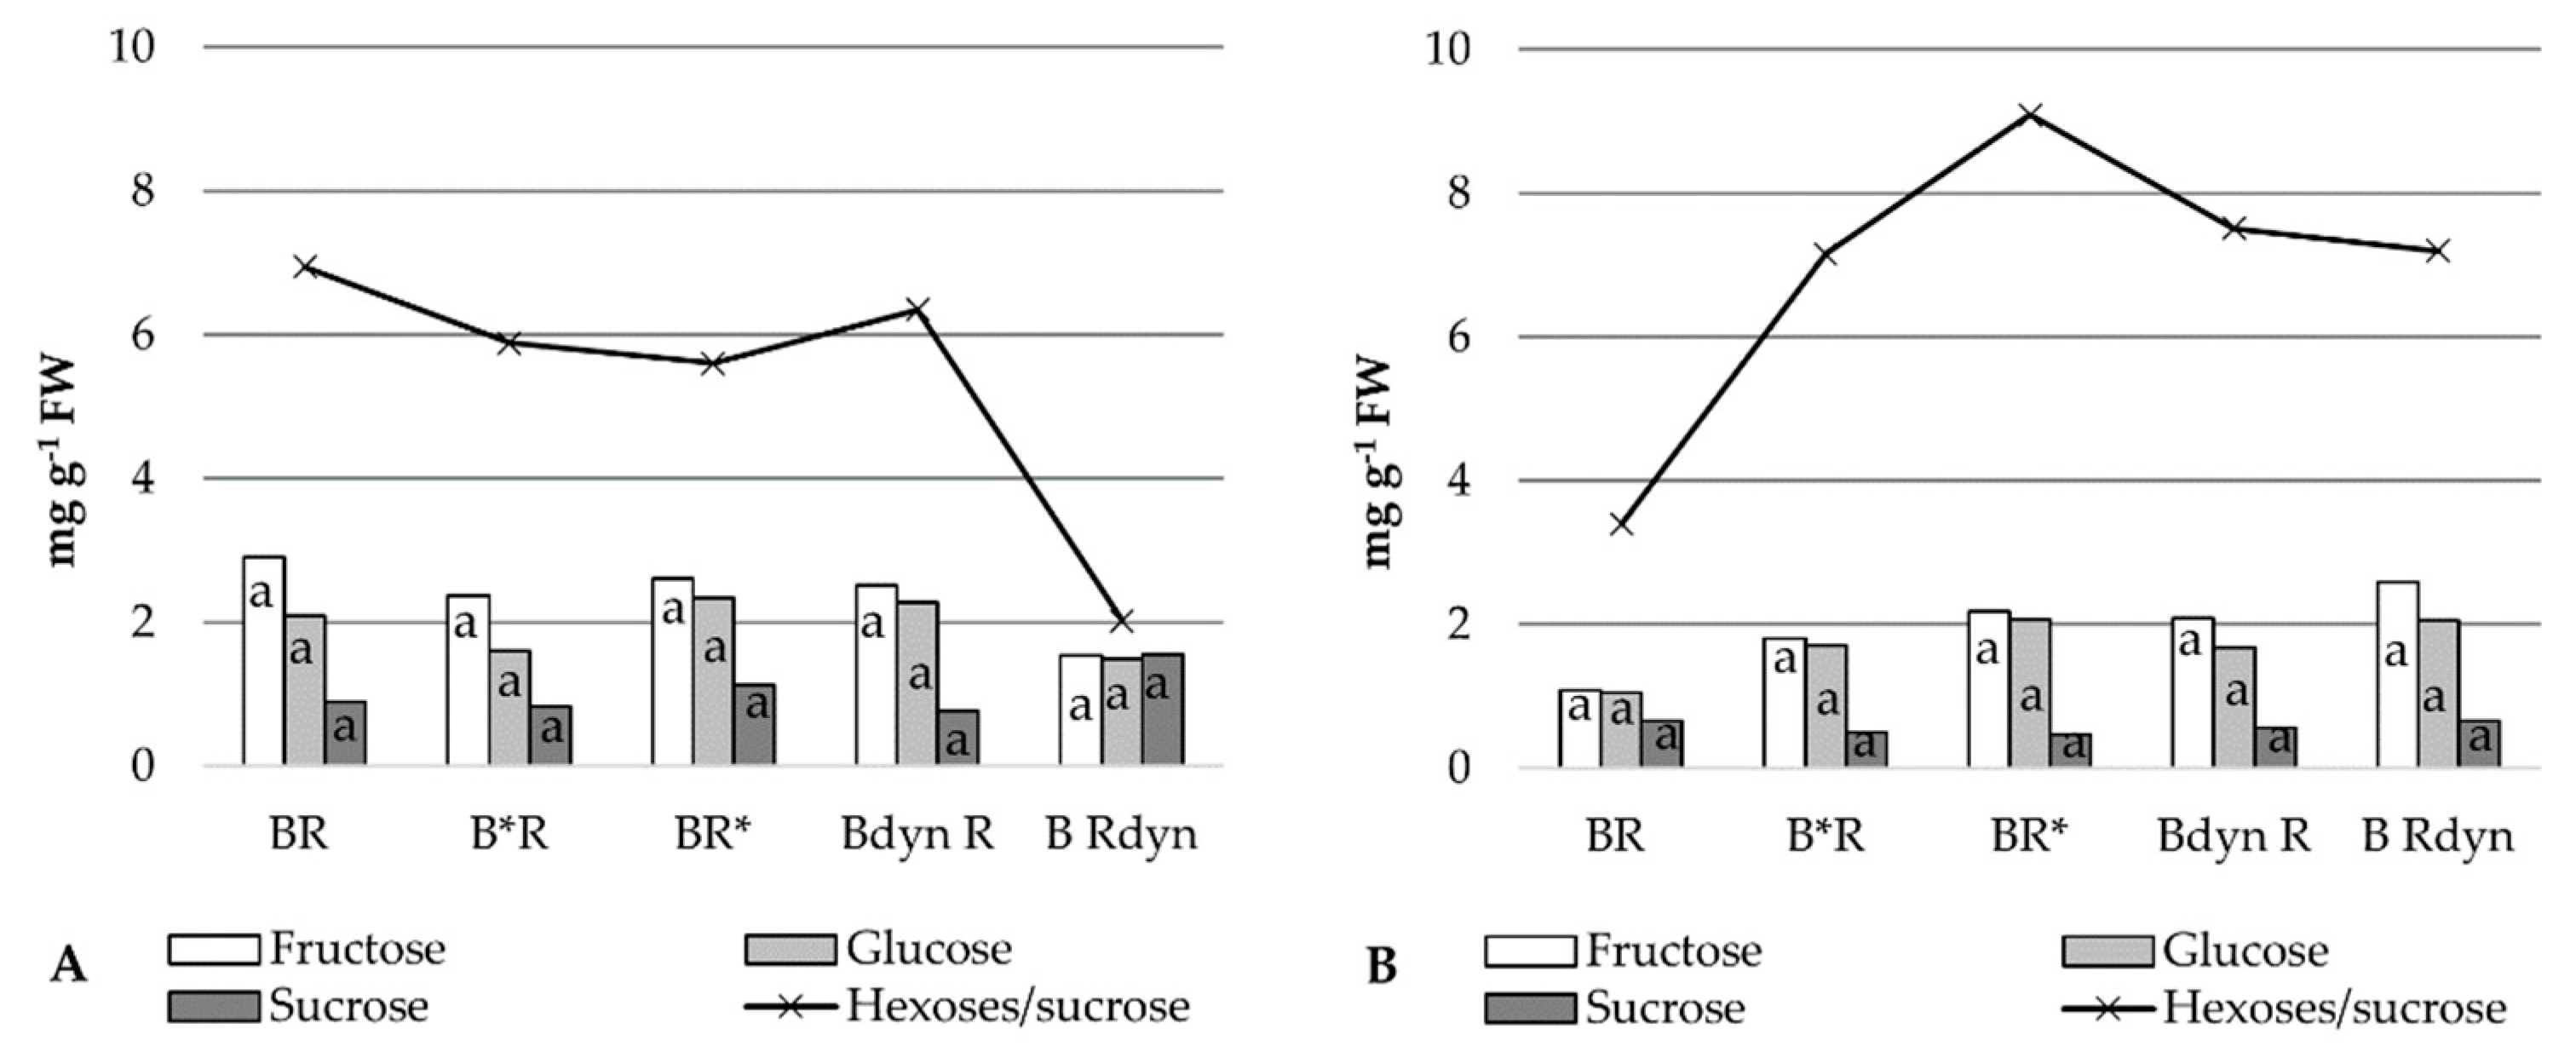
For biometric measurements, the leaf area was measured using an automatic leaf area meter (AT Delta-T Devices, Wallingford, UK), and fresh plant weight was determined for 10 plants per treatment (n = 10). Non-destructive measurements of leaf chlorophyll and nitrogen balance (NBI) indexes in the youngest fully developed leaves (10 plants per treatment, n = 10) were performed using a chlorophyll and flavonoid meter (Force-A Dualex® 4 Scientific, Ocala, FL, USA).
Chlorophyll fluorescence was measured using red (660 nm) and blue (450 nm) excitation wavelengths as measuring light using a multi-mode chlorophyll fluorometer acquisition system (OS5p, Opti-Sciences, Hudson, NH, USA). Dark-adapted (40 min) F0 and Fm measurement allowed the calculation of the maximum quantum efficiency of PSII (Fv/m).

2.4. Soluble Sugars

Soluble sugar (fructose, glucose, sucrose) contents were evaluated using the HPLC method [19] and evaporative scattering detection (ELSD). About 0.5 g of fresh plant tissue was ground and diluted with deionized H2O. The extraction was carried out for 4 h at room temperature, centrifuged at 14,000× g for 15 min. A clean-up step was performed before the chromatographic analysis [20]. 1 mL of the supernatant was mixed with 1 mL 0.01% (w:v) ammonium acetate in acetonitrile and incubated for 30 min at +4. After incubation, samples were centrifuged at 14,000× g for 15 min and filtered through 0.22 µm PTPE syringe filter (VWR International, Radnor, PA, USA). The analysis was performed on a Shimadzu Nexera HPLC (Japan) system. The separation was performed on a Supelcosil 250 × 4 mm NH2 HPLC column (Supelco, Bellefonte, PA, USA) using 77% acetonitrile as the mobile phase at 1 mL min−1 flow rate. A calibration method was used for sugar quantification.

2.5. Antioxidant Properties

Antioxidant properties of lettuce leaves were evaluated as the DPPH (2-diphenyl-1-picrylhydrazyl), ABTS (2,2′-azino-bis (3-ethylbenzothiazoline-6-sulphonic acid) diammonium salt, radical scavenging activities, and Fe2+ reducing antioxidant power assay (FRAP) [21]. Extracts were prepared by grinding plant material with liquid nitrogen and diluting with 80% methanol 1:10 (w:v). After 24 h, extracts were filtered through cellulose filters.
The DPPH free radical scavenging activity was determined by mixing the diluted extract with 0.06 M methanolic DPPH solution, and radical quenching, monitored every minute for 16 min measuring absorbance at 515 nm (M501, Camspec, Leeds, UK). The results are presented as DPPH free radical scavenging activity, µmol g−1 of fresh plant weight.
The ABTS radical solution was prepared by mixing 50 mL of 2 mM ABTS with 200 µL 70 mM K2S2O8 allowing the mixture to stand in the dark at room temperature for 16 h before use. The working solution was diluted to obtain initial absorbance of AU 0.700 at 734 nm (M501, Camspec, UK). 100 µL of the sample was mixed with 2 mL ABTS solution, and absorbance was monitored for 11 min. The results are presented as ABTS free radical scavenging activity, µmol g−1 of fresh plant weight.
FRAP method was based on reducing ferric ion (Fe3+) to ferrous ion (Fe2+). Briefly, the working reagent was prepared by mixing acetate buffer (300 mM, pH 3.6), a solution of 10 mM TPTZ (2,4,6-tripyridyl-s-triazine) in 40 mM HCl, and 20 mM FeCl3 × 6H2O at 10:1:1 (v/v/v). 20 µL of the sample was mixed with 3 mL of working solution and incubated in the dark for 30 min. Then, absorbance at 593 was read. The antioxidant power was expressed as the Trolox equivalent antioxidant capacity (TEAC, µmol Trolox per g−1 of fresh plant weight) and Fe2+ antioxidant capacity (Fe2+ µmol g−1 of fresh plant weight).

2.6. Determination of Macro- and Microelements

The macro- and micro-elements contents in lettuce were determined using the microwave digestion technique combined with inductively coupled plasma optical emission spectrometry. Complete digestion of dry microgreen material (0.5 g) was achieved with 65% HNO3 and 30% H2O2 (5:3) using a microwave digestion system Multiwave GO (Anton Paar GmbH, Graz, Austria). The digestion program was as follows: (1) 150 °C reached within 3 min, digested for 10 min; (2) 180 °C reached within 10 min, digested for 10 min. The mineralized samples were diluted to 50 mL with deionized water. The elemental profile was analyzed by an ICP–OES spectrometer (Spectro Genesis, SPECTRO Analytical Instruments, Kleve, Germany). The operating conditions employed for ICP-OES determination were 1300 W RF power, 12 L min−1 plasma flow, 1 L min−1 auxiliary flow, 0.8 L min−1 nebulizer flow, 1 mL min−1 sample uptake rate. The analytical wavelengths (nm) chosen were: P I 213.618 nm, K I 766.491 nm, S I 182.034 nm, Ca II 445.478 nm, Mg II 279.079 nm, Fe II 259.941 nm, Zn I 213.856 nm, Mn II 259.373 nm, Cu I 324.754 nm. The calibration standards were prepared by diluting a stock multi-elemental standard solution (1000 mg L−1) in 6.5% (v/v) nitric acid and by diluting stock phosphorus and standard sulfur solutions (1000 mg L−1) in deionized water. The calibration curves for all the studied elements were in the range of 0.01–400 mg L−1. The contents of macro and microelements in the dry weight of lettuce are presented.

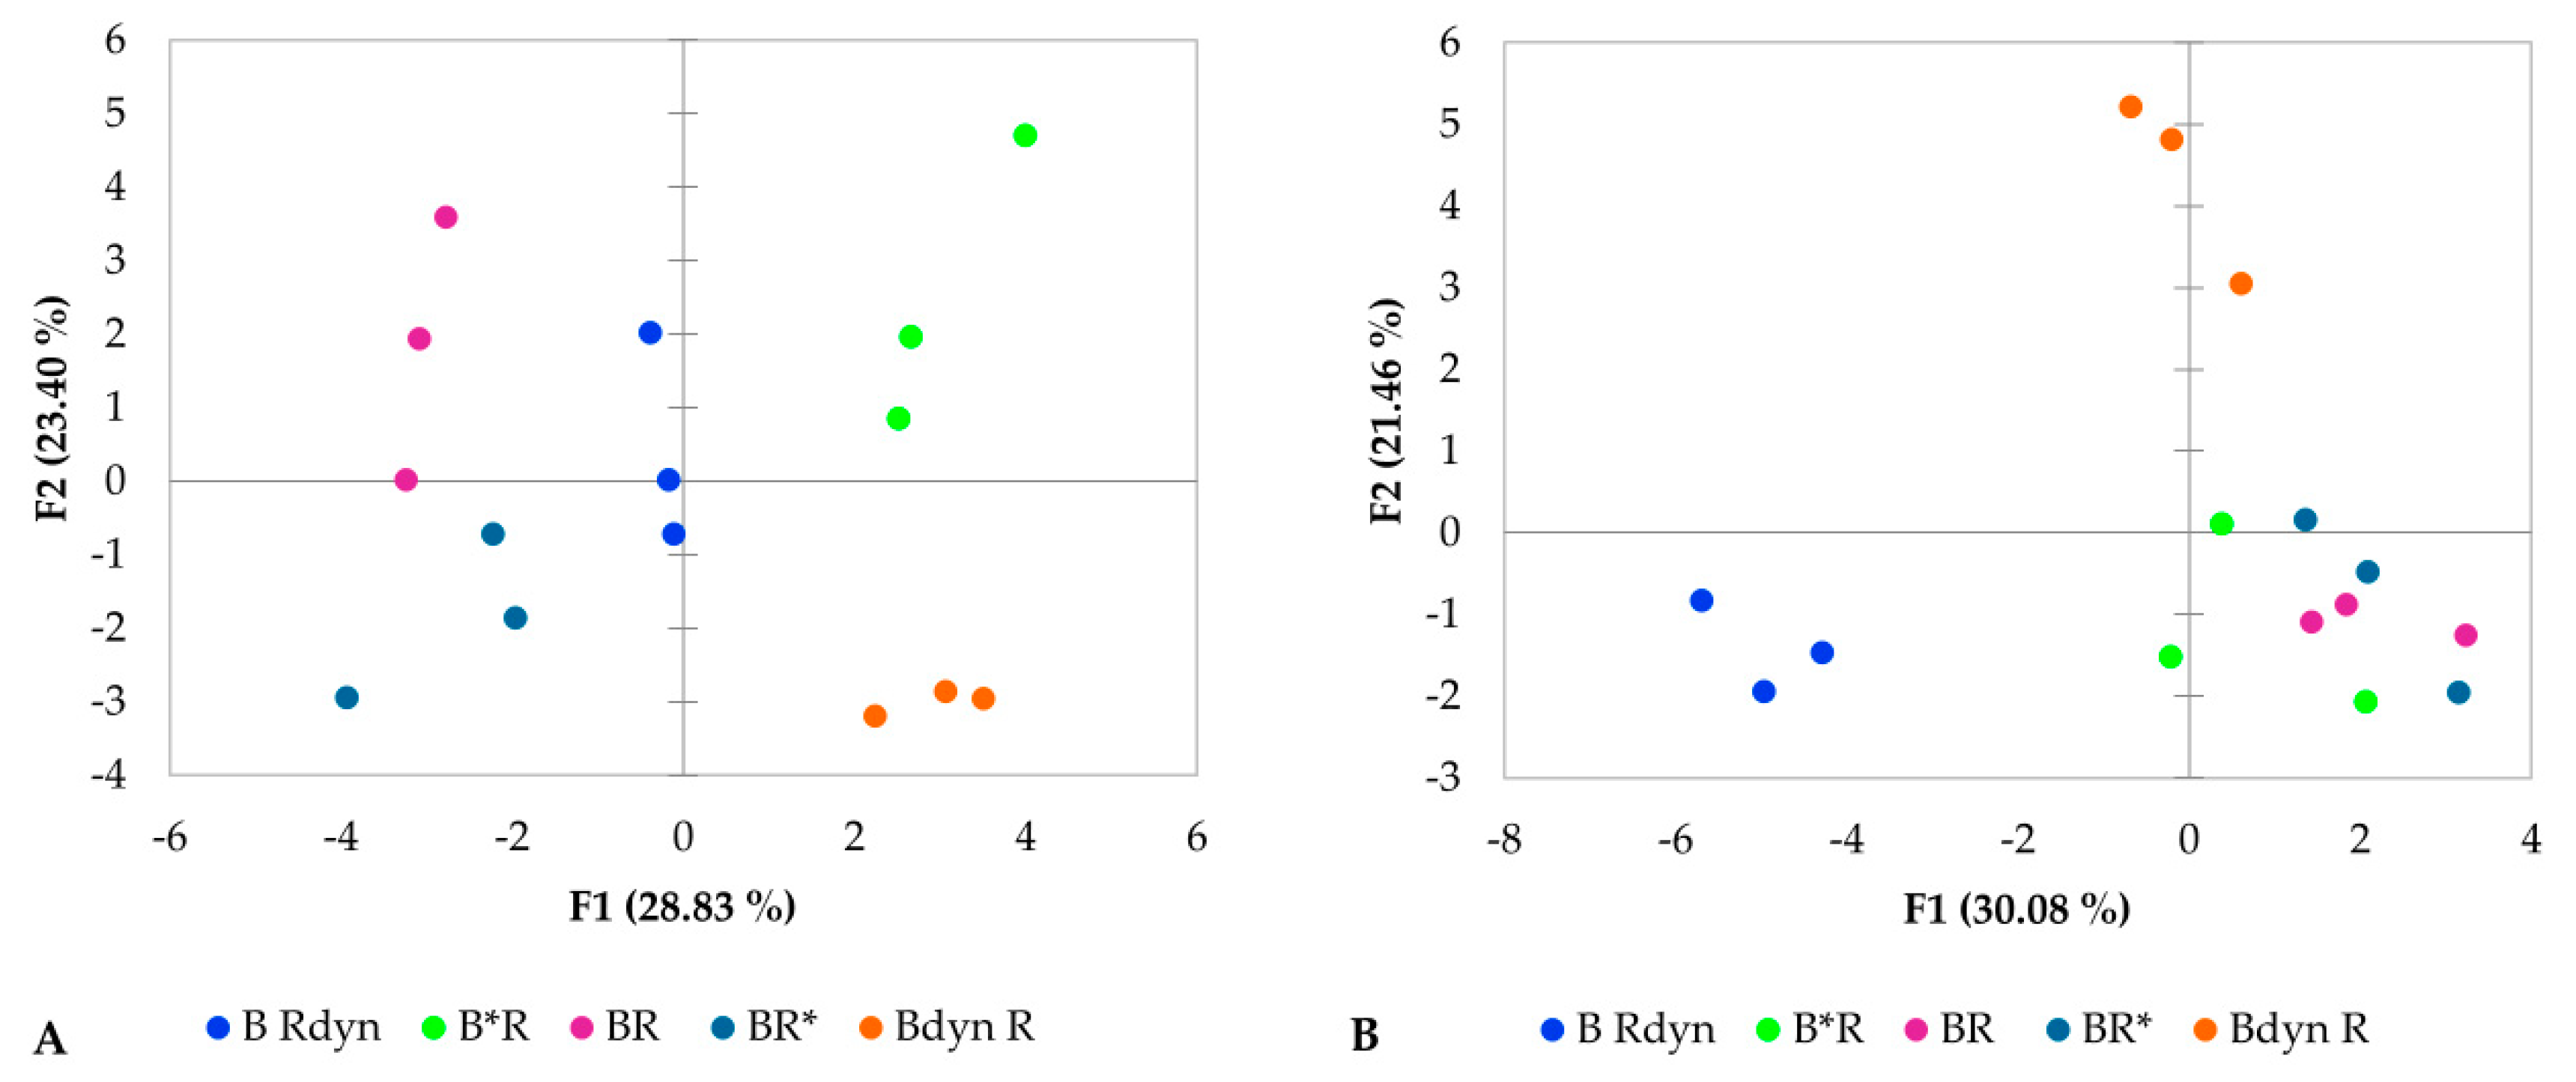
2.7. Statistical Analysis

Data were processed using XLStat software, using a one-way analysis of variance (ANOVA), Duncan’s multiple range test at a confidence level p = 0.05, and principal component analysis (PCA) (Xlstat, Addinsoft, Paris, France, 2019).

3. Results

Experiments and results confirmed that constant vs. dynamic light intensities even at equal DLI had pronounced effects on green and red leaf lettuce growth, photosynthesis, and mineral uptake.
In green leaf lettuce (Figure 2A,C), all dynamic lighting strategies tend to decrease dry weight percentage, compared to constant BR (the most pronounced effect of BR* and Bdyn R—7.0 5.7 times lowe DW%, compared to BR, respectively), while dynamic blue Bdyn B also tend to increase lettuce height and leaf area. In red leaf lettuce (Figure 2B,D) dry weight percentage did not differ significantly in the plant, illuminated with different lighting strategies, but dynamic BdynR tended to decrease fresh weight, while BdynR and BRdyn resulted in a slight decrease in leaf area.
Dark-adapted chlorophyll fluorescence measurements of Fv/m (quantum efficiency parameters of PSII) (Table 2), as well as chlorophyll index measures, resulted in insignificant differences both in green and red leaf lettuce, treated with constant and dynamic light component flux. In green leaf lettuce, the significantly higher flavanol index was determined in the plant, illuminated with condensed blue component flux B*R. In contrast, in red leaf lettuce, a slight increase in the flavanol index (1.3 times higher compared to BR) and consequent decrease in the NBI index was determined in dynamic blue component lighting treatment BdynR, while BR* lighting resulted in 1.4 times lower flavanol index, compared to BR.
Soluble sugar (Figure 3) contents statistically significantly differ in red and green leaf lettuce. However, the hexoses/sucrose ratio was determined 3.3 times lower in green lettuce, cultivated under dynamic red component BRdyn. In red leaf lettuce, constant BR lighting resulted in the lowest hexoses/sucrose ratio.
No significant differences in measured antioxidant properties in red leaf lettuce were observed (Table 3). However, in green leaf lettuce, the ABTS free radical scavenging activity differentiated between BR* and Bdyn R treated plants. FRAP antioxidant power was determined significantly different between B*R and BR* illuminated lettuces. When blue light flux was condensed in the middle of the photoperiod (B*R), Fe2+ reduction power and TEAC were determined 1.7 and 2 times higher compared to BR* illuminated green lettuces.
The contents of macro- and micro-elements differed between lighting treatment significantly (Table 4). In red leaf lettuce, the BR lighting strategy resulted in the lowest contents of all measured macroelements (P, K, S, Ca, and Mg) in green leaf lettuce. However, in red leaf lettuce, different trends were observed. Here, the BR* lighting strategy, when the doubled intensity of red 662 nm light was condensed to 8 h in the middle of the photoperiod, resulted in slightly increased P, K, and S contents. However, dynamic blue lighting (Bdyn R) in green leaf lettuce resulted in 1.3, 1.2, 1.1, and 1.2 times higher contents of Fe, Zn, Mn, and Cu contents. In red leaf lettuce, Bdyn R lighting affected only higher Fe and Zn contents, but BRdyn lighting resulted in slightly reduced Fe, Zn, Mn.
Summarizing all effects in the PCA scatter plot (Figure 4), the differential reaction of green and red lettuce to constant and dynamic lighting intensity was observed. In green leaf lettuce, the lighting strategies with dynamic red 662 nm component (BRdyn, BR*) were not remarkably different from BR treatment, while dynamic blue treatments (B*R, Bdyn R) had a distinct effect on lettuce growth, antioxidant properties, and mineral elements. In red leaf lettuce, the treatments with blue or red light condensed in the middle of photoperiod (B*R, BR* were not significantly different from BR, while dynamic strategies were significantly different from BR and each other.

4. Discussion

Series of experimental lighting treatments, creating dynamic red and blue irradiance conditions, but maintaining equal DLI of each spectral component resulted in relatively low differences in accumulated lettuce fresh weight and leaf area. However, a significant decrease in fresh weight and dry weight % in green leaf lettuce cultivated under BR* indicates that green leaf lettuce was sensitive to higher red light PPFD. However, at a shorter photoperiod, both higher red light level exposure (lower B/R ratio) and shorter duration of the main photosynthetic flux (8 h compared to 16 h of red in other treatments). However, the similar chlorophyll index and chlorophyll fluorescence parameters in all treatments, when measured at the same time of the day, suggest that dynamic light fluctuations in BdynR and BRdyn treatments did not have a remarkable effect on photosynthetic lettuce performance. Kaiser et al. (2017) [22], analyzing the response to natural lighting, concluded that dynamic irradiance negatively impacted time-integrated photosynthesis, growth rates, and fitness compared to a constant irradiance of arabidopsis. This decrease was partly caused by decreasing photosynthetic quantum yield with increasing irradiance (as high irradiance is a part of the dynamic light regime) and dynamic regulation of electron transport, enzyme activation, and CO2 diffusion [22]. In another study, it was shown that a gradual increase in irradiance in the sinusoidal regime led to sequential activation of photosynthetic enzymes, resulting in a more efficient carbon flow through the Calvin–Benson cycle into starch and sucrose in arabidopsis [7]. However, these latter experiments were performed comparing broad-spectrum natural lighting in greenhouse and fluorescent in the growth chambers. Therefore, the type (spectrum) of a light source and the dynamic spectral component’s intensity affect the final results.
Several other experiments with red and blue LED lighting reported that alternating red and blue LED light exposure (intermittent lighting in 1 to several light/dark cycles per 24 h at the same DLI) had a significant impact on lettuce growth and leaf sugar, ascorbic acid, and anthocyanin contents [23,24,25]. This indicated that photosynthetic and antioxidative systems react to light/dark regimes changes, not only to total photoperiod of light. However, our approach detected no significant differences in the DPPH and ABTS free radical scavenging activities ad FRAP antioxidant power in red leaf lettuce, which naturally has higher contents of antioxidant anthocyanins compared to green leaf lettuce. In green leaf lettuce, no significant impacts of dynamic blue or red light were observed. However, the condensed flux of blue light in B*R treatment resulted in remarkably higher FRAP antioxidant power, compared to condensed red (BR*), suggesting that the contrasting intensity—PPFD of the individual spectral component has a more pronounced effect on the antioxidant system compared to the gradual change in the intensity [26]. Analysis of mineral contents in lettuce leaves showed that all dynamic lighting treatments in green leaf lettuce increased the main macro elements, P, K, S, Ca, Mg, compared to constant BR lighting. However, in red cultivar, only BR* treatment with higher PPFD of red light at shorter photoperiod resulted in increased P, K, and S. In green leaf lettuce, dynamic blue component (Bdyn R) treatment, in which B/R ratio changes closest to the natural lighting fluctuations, resulted in higher contents of all investigated micro elements—Fe, Zn, Mn, Cu. While in red cultivar, only the contents of Fe and Zn increased in BdynR treatment but decreased in BRdyn.
Differential growth, antioxidant and photosynthetic response of red and green lettuce [27,28] and basil [9] cultivars to different LED lighting parameters were reported, showing that red (purple) cultivars are less sensitive to environmental impacts. According to the PCA analysis, red and green leaf lettuce showed distinct response to the same lighting conditions in our study. Green lettuce cultivar was more sensitive for the applied lighting conditions, as according to PCA analysis, all applied treatments resulted in different plant reactions. In red leaf lettuce, only dynamic lighting BdynR and BRdyn were significantly different from constant BR treatment.

5. Conclusions

The lettuce response to dynamic lighting strategies was cultivar specific. Red leaf lettuce was less sensitive for different lighting strategies, but in green leaf lettuce, it had a pronounced effect on fresh and dry weight accumulation and mineral accumulation. Though dynamic lighting strategies, mimicking natural lighting fluctuations, did not have a remarkable effect on photosynthesis parameters and did not evoke antioxidative system response, the blue light component’s dynamic flux had a pronounced effect on higher macro and micronutrient contents in lettuce leaves. The trends obtained suggest that the impacts of fluctuating lighting parameters on plants are worth further investigations. Moreover, it should be taken into consideration when analyzing the effects of various abiotic factors in controlled environment chambers.

Author Contributions

Conceptualization, A.V. and G.S.; Data curation, J.M. and K.L.; Formal analysis, P.J.H. and K.L.; Investigation, J.M.; Methodology, A.V. and P.J.H.; Supervision, G.S.; Writing—original draft, A.V.; Writing—review & editing, G.S. All authors have read and agreed to the published version of the manuscript.

Funding

This research was funded by a grant (No. S-MIP-17-23) from the Research Council of Lithuania.

Conflicts of Interest

The authors declare no conflict of interest. The funders had no role in the design of the study; in the collection, analyses, or interpretation of data; in the writing of the manuscript, or in the decision to publish the results.

References

  1. Yamori, W. Photosynthetic response to fluctuating environments and photoprotective strategies under abiotic stress. J. Plant. Res. 2016, 129, 379–395. [Google Scholar] [CrossRef]
  2. Graham, P.J.; Nguyen, B.; Burdyny, T.; Sinton, D. A penalty on photosynthetic growth in fluctuating light. Sci. Rep. 2017, 7, 12513. [Google Scholar] [CrossRef] [Green Version]
  3. Yamori, W.; Makino, A.; Shikanai, T. A physiological role of cyclic electron transport around photosystem I in sustaining photosynthesis under fluctuating light in rice. Sci. Rep. 2016, 6, 20147. [Google Scholar] [CrossRef] [Green Version]
  4. Slattery, R.A.; Walker, B.J.; Weber, A.P.M.; Ort, D.R. The Impacts of Fluctuating Light on Crop Performance. Plant Physiol. 2018, 176, 990–1003. [Google Scholar] [CrossRef] [Green Version]
  5. Vialet-Chabrand, S.; Matthews, J.S.A.; Simkin, A.J.; Raines, C.A.; Lawson, T. Importance of Fluctuations in Light on Plant Photosynthetic Acclimation. Plant Physiol. 2017, 173, 2163–2179. [Google Scholar] [CrossRef] [PubMed] [Green Version]
  6. Kono, M.; Terashima, I. Long-term and short-term responses of the photosynthetic electron transport to fluctuating light. J. Photochem. Photobiol. B Biol. 2014, 137, 89–99. [Google Scholar] [CrossRef] [PubMed]
  7. Annunziata, M.G.; Apelt, F.; Carillo, P.; Krause, U.; Feil, R.; Mengin, V.; Lauxmann, M.A.; Köhl, K.; Nikoloski, Z.; Stitt, M.; et al. Getting back to nature: A reality check for experiments in controlled environments. J. Exp. Bot. 2017, 68, 4463–4477. [Google Scholar] [CrossRef] [PubMed]
  8. Chen, X.; Wang, L.; Li, T.; Yang, Q.; Guo, W. Sugar accumulation and growth of lettuce exposed to different lighting modes of red and blue LED light. Sci. Rep. 2019, 9, 6926. [Google Scholar] [CrossRef] [Green Version]
  9. Hosseini, A.; Zare Mehrjerdi, M.; Aliniaeifard, S.; Seif, M. Photosynthetic and growth responses of green and purple basil plants under different spectral compositions. Physiol. Mol. Biol. Plants 2019, 25, 741–752. [Google Scholar] [CrossRef] [PubMed]
  10. Mitchell, C.A.; Dzakovich, M.P.; Gomez, C.; Lopez, R.; Burr, J.F.; Hernández, R.; Kubota, C.; Currey, C.J.; Meng, Q.; Runkle, E.S.; et al. Light-Emitting Diodes in Horticulture. In Horticultural Reviews: Volume 43; John Wiley & Sons, Ltd.: Hoboken, NJ, USA, 2015; pp. 1–88. ISBN 9781119107781. [Google Scholar]
  11. Viršilė, A.; Olle, M.; Duchovskis, P. LED Lighting in Horticulture. In Light Emitting Diodes for Agriculture: Smart Lighting; Dutta Gupta, S., Ed.; Springer: Singapore, 2017; pp. 113–147. ISBN 9789811058073. [Google Scholar]
  12. Lin, K.-H.; Huang, M.-Y.; Huang, W.-D.; Hsu, M.-H.; Yang, Z.-W.; Yang, C.-M. The effects of red, blue, and white light-emitting diodes on the growth, development, and edible quality of hydroponically grown lettuce (Lactuca sativa L. var. capitata). Sci. Hortic. 2013, 150, 86–91. [Google Scholar] [CrossRef]
  13. Naznin, M.; Lefsrud, M.; Gravel, V.; Azad, M. Blue Light added with Red LEDs Enhance Growth Characteristics, Pigments Content, and Antioxidant Capacity in Lettuce, Spinach, Kale, Basil, and Sweet Pepper in a Controlled Environment. Plants 2019, 8, 93. [Google Scholar] [CrossRef] [PubMed] [Green Version]
  14. Pennisi, G.; Blasioli, S.; Cellini, A.; Maia, L.; Crepaldi, A.; Braschi, I.; Spinelli, F.; Nicola, S.; Fernandez, J.A.; Stanghellini, C.; et al. Unraveling the Role of Red:Blue LED Lights on Resource Use Efficiency and Nutritional Properties of Indoor Grown Sweet Basil. Front. Plant Sci. 2019, 10, 305. [Google Scholar] [CrossRef] [PubMed] [Green Version]
  15. Gao, W.; He, D.; Ji, F.; Zhang, S.; Zheng, J. Effects of Daily Light Integral and LED Spectrum on Growth and Nutritional Quality of Hydroponic Spinach. Agronomy 2020, 10, 1082. [Google Scholar] [CrossRef]
  16. Chiang, C.; Bånkestad, D.; Hoch, G. Reaching Natural Growth: Light Quality Effects on Plant Performance in Indoor Growth Facilities. Plants 2020, 9, 1273. [Google Scholar] [CrossRef] [PubMed]
  17. Pennisi, G.; Orsini, F.; Blasioli, S.; Cellini, A.; Crepaldi, A.; Braschi, I.; Spinelli, F.; Nicola, S.; Fernandez, J.A.; Stanghellini, C.; et al. Resource use efficiency of indoor lettuce (Lactuca sativa L.) cultivation as affected by red:blue ratio provided by LED lighting. Sci. Rep. 2019, 9, 14127. [Google Scholar] [CrossRef] [PubMed]
  18. Tamulaitis, G.; Duchovskis, P.; Bliznikas, Z.; Breive, K.; Ulinskaite, R.; Brazaityte, A.; Novičkovas, A.; Žukauskas, A. High-power light-emitting diode based facility for plant cultivation. J. Phys. D Appl. Phys. 2005, 38, 3182–3187. [Google Scholar] [CrossRef]
  19. Ma, C.; Sun, Z.; Chen, C.; Zhang, L.; Zhu, S. Simultaneous separation and determination of fructose, sorbitol, glucose and sucrose in fruits by HPLC–ELSD. Food Chem. 2014, 145, 784–788. [Google Scholar] [CrossRef]
  20. Brons, C.; Olieman, C. Study of the high-performance liquid chromatographic separation of reducing sugars, applied to the determination of lactose in milk. J. Chromatogr. A 1983, 259, 79–86. [Google Scholar] [CrossRef]
  21. Kraujalytė, V.; Venskutonis, P.R.; Pukalskas, A.; Česonienė, L.; Daubaras, R. Antioxidant properties and polyphenolic compositions of fruits from different European cranberrybush (Viburnum opulus L.) genotypes. Food Chem. 2013, 141, 3695–3702. [Google Scholar] [CrossRef]
  22. Kaiser, E.; Morales, A.; Harbinson, J. Fluctuating Light Takes Crop Photosynthesis on a Rollercoaster Ride. Plant. Physiol. 2018, 176, 977–989. [Google Scholar] [CrossRef] [Green Version]
  23. Chen, X.; Yang, Q.; Song, W.; Wang, L.; Guo, W.; Xue, X. Growth and nutritional properties of lettuce affected by different alternating intervals of red and blue LED irradiation. Sci. Hortic. 2017, 223, 44–52. [Google Scholar] [CrossRef]
  24. Chen, X.; Yang, Q. Effects of intermittent light exposure with red and blue light emitting diodes on growth and carbohydrate accumulation of lettuce. Sci. Hortic. 2018, 234, 220–226. [Google Scholar] [CrossRef]
  25. Ohtake, N.; Ishikura, M.; Suzuki, H.; Yamori, W.; Goto, E. Continuous Irradiation with Alternating Red and Blue Light Enhances Plant Growth While Keeping Nutritional Quality in Lettuce. Horts 2018, 53, 1804–1809. [Google Scholar] [CrossRef] [Green Version]
  26. Colonna, E.; Rouphael, Y.; Barbieri, G.; De Pascale, S. Nutritional quality of ten leafy vegetables harvested at two light intensities. Food Chem. 2016, 199, 702–710. [Google Scholar] [CrossRef]
  27. Samuolienė, G.; Sirtautas, R.; Brazaitytė, A.; Duchovskis, P. LED lighting and seasonality effects antioxidant properties of baby leaf lettuce. Food Chem. 2012, 134, 1494–1499. [Google Scholar] [CrossRef] [PubMed]
  28. Son, K.-H.; Oh, M.-M. Growth, photosynthetic and antioxidant parameters of two lettuce cultivars as affected by red, green, and blue light-emitting diodes. Hortic. Environ. Biotechnol. 2015, 56, 639–653. [Google Scholar] [CrossRef]
Figure 1. Distribution of the photosynthetic photon flux density (PPFD) of individual LED wavelengths during the photoperiod with each component’s equal DLI in different treatments.
Agronomy 10 01802 g001
Figure 2. Biometric measurement results of red and green lettuce leaves, illuminated with constant and dynamic fluxes of red 662 nm and blue 452 nm light. (A,B)—fresh weight and dry weight %, (C,D)—lettuce height and leaf area. (A,C)—green leaf lettuce. (B,D)—red leaf lettuce. Different letters indicate statistically significant differences between means according to the Duncan’s multiple range test at the confidence level p = 0.05.
Agronomy 10 01802 g002
Figure 3. Soluble sugar contents in green (A) and red (B) lettuce leaves, illuminated with constant and dynamic intensities of red 662 nm and blue 452 nm light. Different letters indicate statistically significant differences between means according to the Duncan’s multiple range test at the confidence level p = 0.05.
Agronomy 10 01802 g003
Figure 4. The PCA scatterplot, indicating distinct differences in green (A) and red (B) leaf lettuce, cultivated under dynamic lighting strategies.
Agronomy 10 01802 g004
Table 1. The wavelengths and daily light integrals (DLI’s) of the applied LED spectra. * LED wavelengths selected to create dynamic lighting intensities, maintaining constant DLI.
% from Total DLIDLI, mol/m2 day
Total100%14.4
B452 *20%2.88
R63820%2.88
R662 *56%8.06
FR7374%0.58
Table 2. Non-destructive measurement parameters in red and green lettuce leaves, illuminated with constant and dynamic fluxes of red 662 nm and blue 452 nm light. Fv/m—quantum efficiency of PSII; NBI—nitrogen balance index. Different letters indicate statistically significant differences between means according to the Duncan’s multiple range test at the confidence level p = 0.05.
TreatmentFv/mChlorophyll IndexFlavanol IndexNBI Index
Green leaf lettuce
BR0.815a15.67a0.754b19.81a
B*R0.815a16.24a0.906a15.68b
BR*0.815a15.68a0.662b22.76a
Bdyn R0.815a15.68a0.734b20.97a
B Rdyn0.800a15.08a0.712b19.84a
Red leaf lettuce
BR0.817ab23.99a0.404abc63.97ab
B*R0.820ab23.39a0.331bc78.09a
BR*0.829a23.27a0.296c77.65a
Bdyn R0.826a22.80a0.525a46.06b
B Rdyn0.812b25.36a0.469ab64.48ab
Table 3. The antioxidant properties of red and green lettuce leaves, illuminated with constant and dynamic intensities of red 662 nm and blue 452 nm light. Different letters indicate statistically significant differences between means according to the Duncan’s multiple range test at the confidence level p = 0.05.
TreatmentDPPH µmol g−1 FWABTS µmol g−1 FWFRAP
Fe, µmol g−1 FWTEAC, µmol Trolox g−1 FW
Green leaf lettuce
BR13.30a50.35ab257.13ab0.062ab
B*R16.11a43.61ab329.02a0.080a
BR*11.06a42.92b195.19b0.041b
Bdyn R10.90a62.6a141.72b0.034b
B Rdyn13.98a53.57ab224.07ab0.053ab
Red leaf lettuce
BR21.22a98.82a847.78a0.21a
B*R21.18a100.79a831.24a0.21a
BR*21.94a113.15a682.81a0.17a
Bdyn R21.51a109.33a674.96a0.17a
B Rdyn21.92a126.44a506.41a0.13a
Table 4. The contents of micro-and macroelements in red and green lettuce leaves, illuminated with constant and dynamic intensities of red 662 nm and blue 452 nm light. Different letters indicate statistically significant differences between means according to the Duncan’s multiple range test at the confidence level p = 0.05.
TreatmentMacroelements, mg g−1 DWMicroelements mg g−1 DW
PKSCaMgFeZnMnCu
Green leaf lettuce
BR 6.35c24.89d5.09d16.67d5.19d0.071e0.055b0.086c0.0066e
B*R6.81a25.36c5.39b18.48a5.52a0.084b0.062d0.089b0.0078b
BR*6.48b26.19a5.08d16.94c5.37c0.078d0.053e0.087c0.0067d
Bdyn R6.88a25.38c5.27c18.08b5.45ab0.089a0.066a0.092a0.0081a
B Rdyn6.85a25.91b6.19a16.71d5.42bc0.080c0.057c0.086c0.0073c
Red leaf lettuce
BR 7.38ab26.86b5.36b16.14a5.64a0.077d0.064b0.094a0.0089b
B*R7.22b27.02b5.17c15.23c5.59a0.084b0.060c0.089c0.0080c
BR*7.48a28.49a5.47a15.47b5.64a0.082c0.064b0.095a0.0080c
Bdyn R7.40a25.98c4.96d14.00d5.62a0.092a0.070a0.092b0.0094a
B Rdyn6.31c24.51d4.60e15.19c4.97b0.073e0.059d0.087d0.0076d
Publisher’s Note: MDPI stays neutral with regard to jurisdictional claims in published maps and institutional affiliations.

