Article

Comparison of Water- and Nitrogen-Use Efficiency over Drip Irrigation with Border Irrigation Based on a Model Approach

1
Center for Agricultural Water Research in China, China Agricultural University, Beijing 100083, China
2
College of Agricultural Science and Engineering, Hohai University, Nanjing 210098, China
3
College of Resources and Environmental Science, China Agricultural University, Key Laboratory of Arable Land Conservation (North China), Ministry of Agriculture, Beijing 100193, China
*
Author to whom correspondence should be addressed.
Submission received: 21 October 2020 / Revised: 17 November 2020 / Accepted: 24 November 2020 / Published: 29 November 2020

Abstract

:
Drip irrigation under film mulching is widely promoted to replace traditional border irrigation in order to meet water saving demand in arid and semiarid regions. Our study aims to investigate quantitatively the change in crop yield, water-use efficiency (WUE) and nitrogen-use efficiency (NUE) under film mulching drip irrigation. We conducted a 4-year contrastive experiment containing two treatments on flux measurement: (1) border irrigation (BI) under film mulching; (2) drip irrigation (DI) under film mulching. Soil water and nitrate transport and utilization in the Soil–Plants–Atmosphere Continuum system, and crop dry matter were all simulated based on an integrated model of a soil-crop system: water, heat, carbon and nitrogen simulator (WHCNS). Results showed soil water content (SWC), soil N O 3 -N content, evapotranspiration (ET), and crop dry matter (Wtotal) produced by the model were in agreement with those measured. Our study showed the irrigation and nitrogen input and output were significantly changed after BI was replaced by DI. Compared with BI treatment, DI treatment decreased ET consumption by 9% annually over four years, while it increased WUE and NUE on the farmland on average by about 28% and 39% yearly. The increase of WUE and NUE were mainly due to a significant decrease of about 56% and 68% in water and nitrogen leakage loss in DI treatment, respectively, during 2014–2017. Our study confirmed the economic and environmental benefits of the DI technology and showed its improvement prospect in the research field. Meanwhile, the results contributed to the improvement and more effective application of DI in a larger region, and provided a data basis for further study on water and fertilizer saving characteristics of DI technology.

1. Introduction

Growth in world population has aggravated the water crisis. Agriculture contributes about 92% of total freshwater worldwide [1], and the 20% of cultivation land under irrigation guarantees 40% of world food supplies [2]. The input of water and nutrients is crucial in agricultural production. The goals of agronomy have always been high yield, high efficiency and low negative impact (mainly in terms of waste of resources and damage to the environment) [3,4]. Hence great interest has been aroused among scholars in how to enhance water- and fertilizer-use efficiency and reduce water consumption and fertilizer loss in agriculture, particularly in irrigated agriculture.
The film mulching drip irrigation (DI) technology places the drip irrigation belt under the plastic film, so that irrigation water and fertilizer can pass through the drip head and enter the soil surface. Irrigation events and fertilization events both occur under the film. This technology is widely used in arid areas around the world due to its advantages of promoting crop growth [5], increasing yield [6,7], reducing evaporation and saving water [8,9,10]. Different from the traditional irrigation, film mulching drip irrigation has significantly changed the infiltration and fertilization mode and boundary conditions. Along with the change of the irrigation mode, the water and nitrogen cycle on farmland has been changed greatly, which in turn affects the overall water and nitrogen cycle in the region [9,11,12]. Many scholars have carried out a lot of research about the effect of drip irrigation on WUE (water-use efficiency) and NUE (nitrogen-use efficiency) compared with traditional irrigation.
Freddie and Todd (2003) [13] summarized 10-year drip irrigation on crop production and found that irrigation water of corn could be reduced by 35–55% while WUE and NUE enhanced irrigation compared with traditional irrigation. Li et al. (2018) [14] found that grain yield, WUE and NUE of winter wheat under drip irrigation rose by 9.79%, 12.3% and 9.77%, respectively in comparison to traditional flooding irrigation in a 3-year experiment. Fawibe et al. (2019) [15] found that drip irrigation under film mulching lowered the irrigation amount and fertilization amount but decreased the yield in a 2-year experiment in comparison to continuous flooded in a rice field. Sandhu et al. (2019) [16] in a maize-wheat system found that drip irrigation raised yield by 13.7% and 23.1%, increased water productivity (WP) by 66% and 259%, and improved NUE by 16.5% and 29% in wheat and maize, respectively against furrow irrigation. Faisal et al. (2019) [17] conducted a winter wheat experiment that showed drip irrigation reduced N2O emission by more than 15%, increased grain yield by more than 6% and improved WUE from 1 to 8%, compared with flood irrigation. Yao et al. (2019) [11] reported that drip irrigation could reduce irrigation to half and fertilization rates by 1/3 without compromising yields in a cucumber field against flood irrigation.
In conclusion, previous studies have mostly confirmed the effect of drip irrigation on improving yield, WUE and NUE through field plot experiments, but the effect of DI on a large farmland scale is still relatively poorly studied. In our research area, the irrigation method is switched from traditional film mulching border irrigation (BI) to film mulching drip irrigation (DI). Extensive irrigation methods of BI still account for a large proportion, but DI has combined advantages of drip irrigation and the plastic mulch technology and thus has been widely promoted in the experimental area to achieve efficient irrigation.
To answer how and how much the WUE, NUE, and water and nitrogen balance on the farmland change under drip irrigation, we conducted long-term observation experiments on water balance processes in the field (covering aspects of ET, rainfall, irrigation, field moisture capacity, soil available nitrogen content, dry matter and crop yield). The water, heat, carbon and nitrogen simulator (WHCNS) model was chosen as a tool to help answer these questions. The WHCNS is an integrated model of a soil-crop system more suitable for complex conditions of the intensive cropping system [18,19]. Studies have, however, shown that the model can simulate soil moisture dynamics, soil N transport, and crop biomass accumulation under multiple field management in multiple areas [20,21,22]. In this study, we conducted long-term observations to verify the accuracy of this model.
The aims of our study were: (i) to validate and apply the WHCNS model to evaluate water consumption, N transport and crop yield under both BI and DI treatments, and (ii) to evaluate WUEs and NUEs after the irrigation method switched from BI to DI. The results help us to explore a reference point and future directions for optimization of film mulching drip irrigation management in arid areas.

2. Materials and Methods

2.1. Experimental Site and Description

We conducted field experiments at the Shiyanghe Experimental Station for Water-saving in Agriculture and Ecology of China Agricultural University (CAU) (N 37°52′, E 102°50′, elevation 1581 m), in Wuwei City, Gansu Province, in northwest China, during 2014–2017. The region has a typical temperate continental arid climate, with an annual mean temperature of 8 °C, an annual accumulated temperature (>0 °C) of about 3550 °C, a mean annual pan evaporation of nearly 2000 mm, an annual precipitation of 164 mm and an average annual duration of sunshine of 3000 h. The groundwater table at the station is 40–50 m below the ground surface [23]. The experimental soil is sandy loam. Precipitation in the region is unevenly distributed during the year, with most of the precipitation happening from July to September in summer.

2.2. Experimental Design

Seeding maize under plastic mulch is the most commonly practiced cropping system. This study focuses on the irrigation shift from border irrigation (BI) to drip irrigation (DI). During the four-year study, the treatment followed the local farmers’ traditional planting mode. The irrigation regime was shown in Table 1. The plastic mulches were 1.2 m wide, holding 4 seed rows. The interval between neighboring mulches was 0.4 m, and between seed rows under the same mulch was 0.23 m. Seeds were sown 0.4 m apart in each row. Overall planting density is 97,500 plants ha−1. These have been illustrated by Qin et al. (2018) [24]. In DI treatment, two drip lines were laid on each layer of mulch, drip heads were located 0.3 m interval of the drip line, and the discharge rate was 3.2 L h−1.
The fertilization method of BI is mainly that of spreading fertilizer over the fields, which results in uneven distribution of fertilization, difficulty in management and high labor cost when applying in large areas. The fertilization event of DI happens under the film. The fertilizer is dissolved in the fertilizer tank and then penetrates into the surrounding soil through the drip head along with the irrigation water. Previously, the field management (irrigation and N fertilizer) mode adopted by local farmers was based on their experience and the change of local government administrators, thus resulting in different irrigation amounts over the years. Our study is based on the local field management.

2.3. Measurements in the Maize Field

The experimental site is often faced with changes due to the application of different irrigation methods. The location of the experiment sites (Site A, B and C) are shown in Wang et al. (2020) [25]. BI treatment during 2014–2015 and DI treatment during 2016–2017 were performed on Site A with an area of 400 m × 200 m. The BI treatment was then moved to a new field (Site C) with an area of 500 m × 250 m in 2016 and 2017, while the DI treatment during 2014–2015 (Site B) covered an area of 2000 m × 1000 m.
Field observation items and measurements are listed in Table 2. The three experimental fields all can provide adequate scale for an open-path eddy covariance system. We measured evapotranspiration with one eddy covariance (EC) system in each treatment. The details are as follows:
(1). The eddy covariance (EC) system in Site A (BI treatment from 2014 to 2015 and DI treatment from 2016 to 2017).
An EC system was installed in Site A during 2014. The EC system consisted of a Krypton hygrometer (model KH20), a temperature and humidity sensor (model HMP45C), a 3-D sonic anemometer/thermometer (model CSAT3), a net radiometer (model NR-LITE) and two soil heat flux plates (model HFP01). These have been described in Qin et al. (2016) [26]. In 2015, the old EC system was replaced by a new one. During 2015–2017, the system consisted of a Kipp and Zonen radiometer (model CNR4), two temperature and RH probes (model HMP155A), a CO2/H2O open path gas analyzer (model EC150), two soil heat flux plates (model HFP01), a set of soil thermocouple probes (model TCAV), a set of water content reflectometer (model CS616), and an infrared radiometer (model SI-111).
(2). EC system in Site B (the DI treatment from 2014 to 2015) and EC system in Site C (the BI treatment from 2016 to 2017).
In Site B, the EC system consisted of the same instruments as those in the EC system of Site A during 2015 to 2017. With the change in the experiment site, the EC system of Site B was moved to Site C for data collection during 2016–2017.
The EC150 and CNR4 sensors were set at height of 4.0 m above the ground surface, and the HMP155A sensors were installed 2 m, 4 m and 6 m above the ground surface, respectively. Additionally, the HFP01 plates were installed under 5 cm below the mulched soil and bare soil respectively. Five CS616 sensors were set at 20-cm intervals along soil profiles ranging from 0 to 100 cm.
The CR3000 data logger was used to collect the EC flux data, and then the data were converted into 30-min data by Loggernet software. Due to influence from weather (rain, snow, wind, sand, etc.) and weak turbulence at night, a lot of anomalous flux values may occur in certain time periods. In this study, EddyPro software was used for data quality control, and data beyond the threshold need to be eliminated and interpolated. When fewer than 4 observations were missed, the linear interpolation method was used for data gap filling; when five or more observations were missing, the mean diurnal variation method was adopted alternatively [27].
Soil volumetric water contents were measured by CS616 sensors every 30 min, and calibrated with the oven-drying method. The soil moisture content was also measured by the oven drying method at 20-cm intervals at selected points in the field about every 7 days. Under the BI treatment, soil samples were taken from three different points: the point at the middle of the mulch, the point at the middle of the bare soil and the point at the edge of the mulch, while under the DI treatment, soil samples were taken from four different points: the point at the middle of the mulch, the point at the middle of the bare soil, the point under the drip head and the point at the middle of the drip head. Each point had three replications. Meanwhile, fresh soil samples were collected at the same point and depth and extracted with 1 mol L−1 KCl to measure the soil N O 3 -N content by the Auto Analyzer3 (AA3, Bran + Luebbe, SEAL Analytical GmbH, Norderstedt, Germany).
Bulk density of soil samples from three sites was measured with the oven drying method with cutting rings (103 mm3) [28]. The air-dried soil samples were sieved through a 2 mm mesh for particle-size analysis with a MasterSizer 2000 laser particle size analyzer (Malvern Instruments Ltd., Worcestershire, UK) [29].
The precipitation and wind speed at a height of 2 m were recorded by an automatic weather station (H21001, Onset Computer Crop., Cape Cod, MA, USA). The data were sampled every 5 s, and calculations made every 15 min by a data logger. The maize dry matter was measured about every 7–10 days with three replications, and yield dry matter in this study contained the whole cob weight. The irrigation amount was controlled by water meters.

2.4. Numerical Modeling

2.4.1. Model Description

The WHCNS model includes such modules as meteorology, soil water movement, soil heat conduction, nitrogen transport and transformation, organic matter turnover, crop growth and field management [18]. It is an integrated model of a soil-crop system. It is more suitable for the complex condition of intensive cropping system. Studies have shown that the model can simulate multi-regional water balance processes [19]. Meanwhile, the model can be used for scenario analysis under various irrigation methods.
The model incorporates the main processes to control these modules. It assumes that the surface soil is homogeneous. When there is a rainfall event, a curve number method (SCS curve) [30] is used to estimate the surface runoff. The infiltration from rainfall or irrigation is computed by a modified Green-Ampt approach [31]. Water redistribution is simulated by the Richards equation in a soil profile in which surface evaporation and plant uptake are considered to be sinks [32]. Evapotranspiration is calculated with the Penman–Monteith model recommended by the United Nations Food and Agriculture Organization (FAO) [33] for calculating the reference crop evapotranspiration. Through combining LAI (leaf area index), potential crop transpiration T p and potential soil evaporation E p are separated [34]. Meanwhile, a ground covering coefficient C f i l m which represents the ratio of covering area to total area, is introduced. The evaporation under the film mulching condition can be calculated as follows:
E f i l m = ( 1 C f i l m ) × E p
where E f i l m is the potential evaporation under the film mulching condition (cm d−1), and E p the potential evaporation (cm d−1).
Meanwhile, the soil heat transport module of HYDRUS-1D (software for simulating water, heat and solute transport in variably saturated porous media) is introduced to the model [32,35], and modified by the film mulch condition in Liang et al. (2016a) [19]. The soil C and N cycling methods are imported from the DAISY model (an open soil-crop-atmosphere system model) [36]. The main processes are simulated as follows: the first-order kinetic equation is used to describe the urea hydrolysis process. The equation suggested by Freney et al. (1985) [37] is used to calculate the ammonia volatilization process. The nitrification process is simulated by the Michaelis equation corrected by moisture and temperature [36]. Denitrification is assumed in proportion to the rate of CO2 emission [38].
The improved version of the PS123 model is used in simulation of the crop growth module originated from Netherlands [39]. When simulating different irrigation methods, the model introduced the FAO-56 method of coefficient f e w (this coefficient is the proportion of soil surface wetted by irrigation or rainfall). Further information can be found in Allen et al. (1998) [33].

2.4.2. Model Parameters

In the model, the value of C f i l m was set to be 0.75, according to the specific plastic film mulching condition. The soil hydraulic parameters of the simulation inputs are given in Table 3. The soil hydraulic properties were modeled using the van Genuchten–Mualem model. The parameters ( θ s , θ r , K s , α and n ) of different soil layers were obtained using the neural network prediction program with the Rosetta software package based on data of soil texture in Table 4. The WHCNS model refers directly to the soil carbon and N cycling parameter from Hansen et al. (1990) [36] and Mueller et al. (1997) [40], which has proved to be reliable in previous studies on the model [20]. Crop coefficient is calculated and adjusted according to the ratio of the measured evapotranspiration to reference evapotranspiration. The calibrated crop parameters used in the model are listed in Table 5.

2.4.3. Calibration and Validation

We used the “trial and error” method to select parameters in the model: For every parameter in Table 5, firstly, the default parameter were adjusted and then used to run the model. The simulated values (mainly including soil water content, maize evapotranspiration, soil N O 3 - -N content and the total dry matter) of the model were compared with the measured ones, and the process was repeated until the simulated values were sufficiently similar to those measured. The calibration process usually ended when the R2 of simulated values and measured values >0.80. Then the parameters were selected to be the calibrated parameters of our study [41]. The sequence of model calibration is as follows: from soil water to soil nitrogen and finally to crop growth. Considering the observation site and data integrity (the measured soil N O 3 - -N content values were missing in 2014), in Site A, we used the data in 2015 under BI treatment for calibration and the data in 2014 under BI treatment and during 2016–2017 under DI treatment for validation. As for Site B, the data in 2015 under DI treatment were used for calibration and data in 2014 under DI treatment for validation. As for Site C, the data in 2016 under BI treatment were used for calibration and data in 2017 under BI treatment for validation.
Three statistical indices were used to evaluate the model performance: root mean square error (RMSE), index of agreement (IA) and the mean bias error (MBE):
(1) Root mean square error, RMSE:
R M S E = i = 1 n ( S i O i ) 2 n
(2) Index of agreement, IA:
I A = 1 i = 1 n ( O i S i ) 2 i = 1 n ( | O i O | + | S i O | ) 2
(3) The mean bias error, MBE:
M B E = i = 1 n ( S i O i ) n
where n is the sample number. S i and O i are the simulated and measured values, respectively. O is the mean of measured values. When RMSE is closer to 0, the mean difference between the measured values and the simulated values will be smaller. The index of agreement (0 < IA < 1) is intended to be a descriptive measure and also a relative and bounded measure [42]. The closer the IA value is to 1, the better the model performance will be.

3. Results

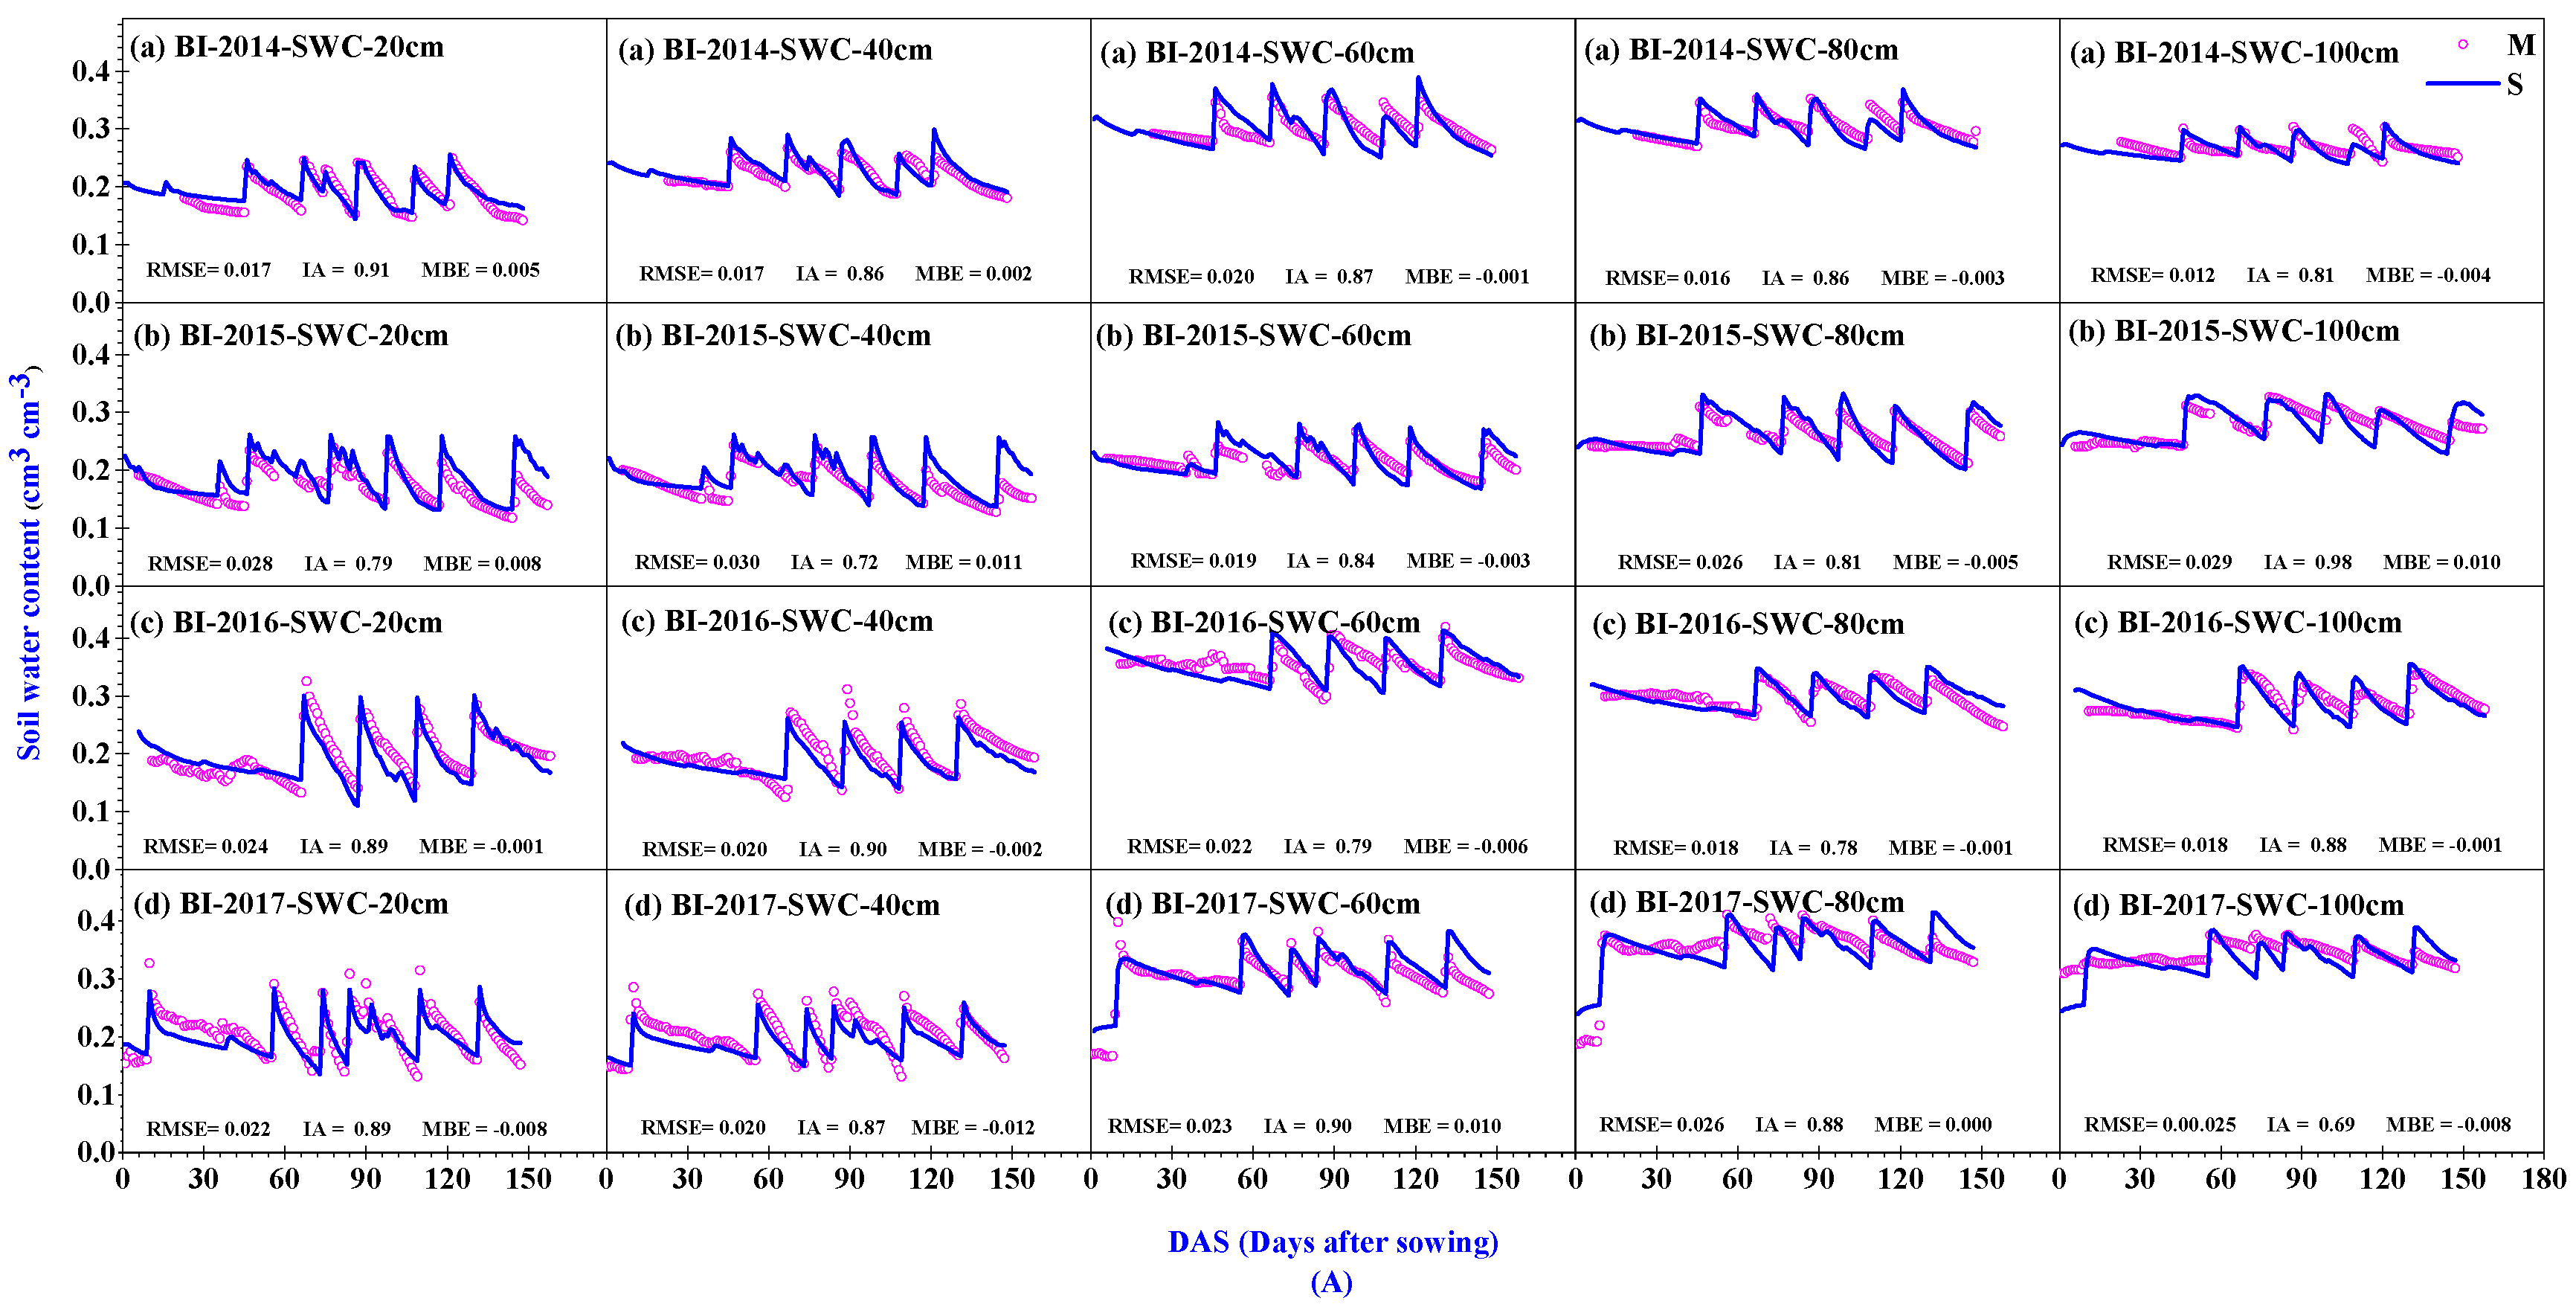
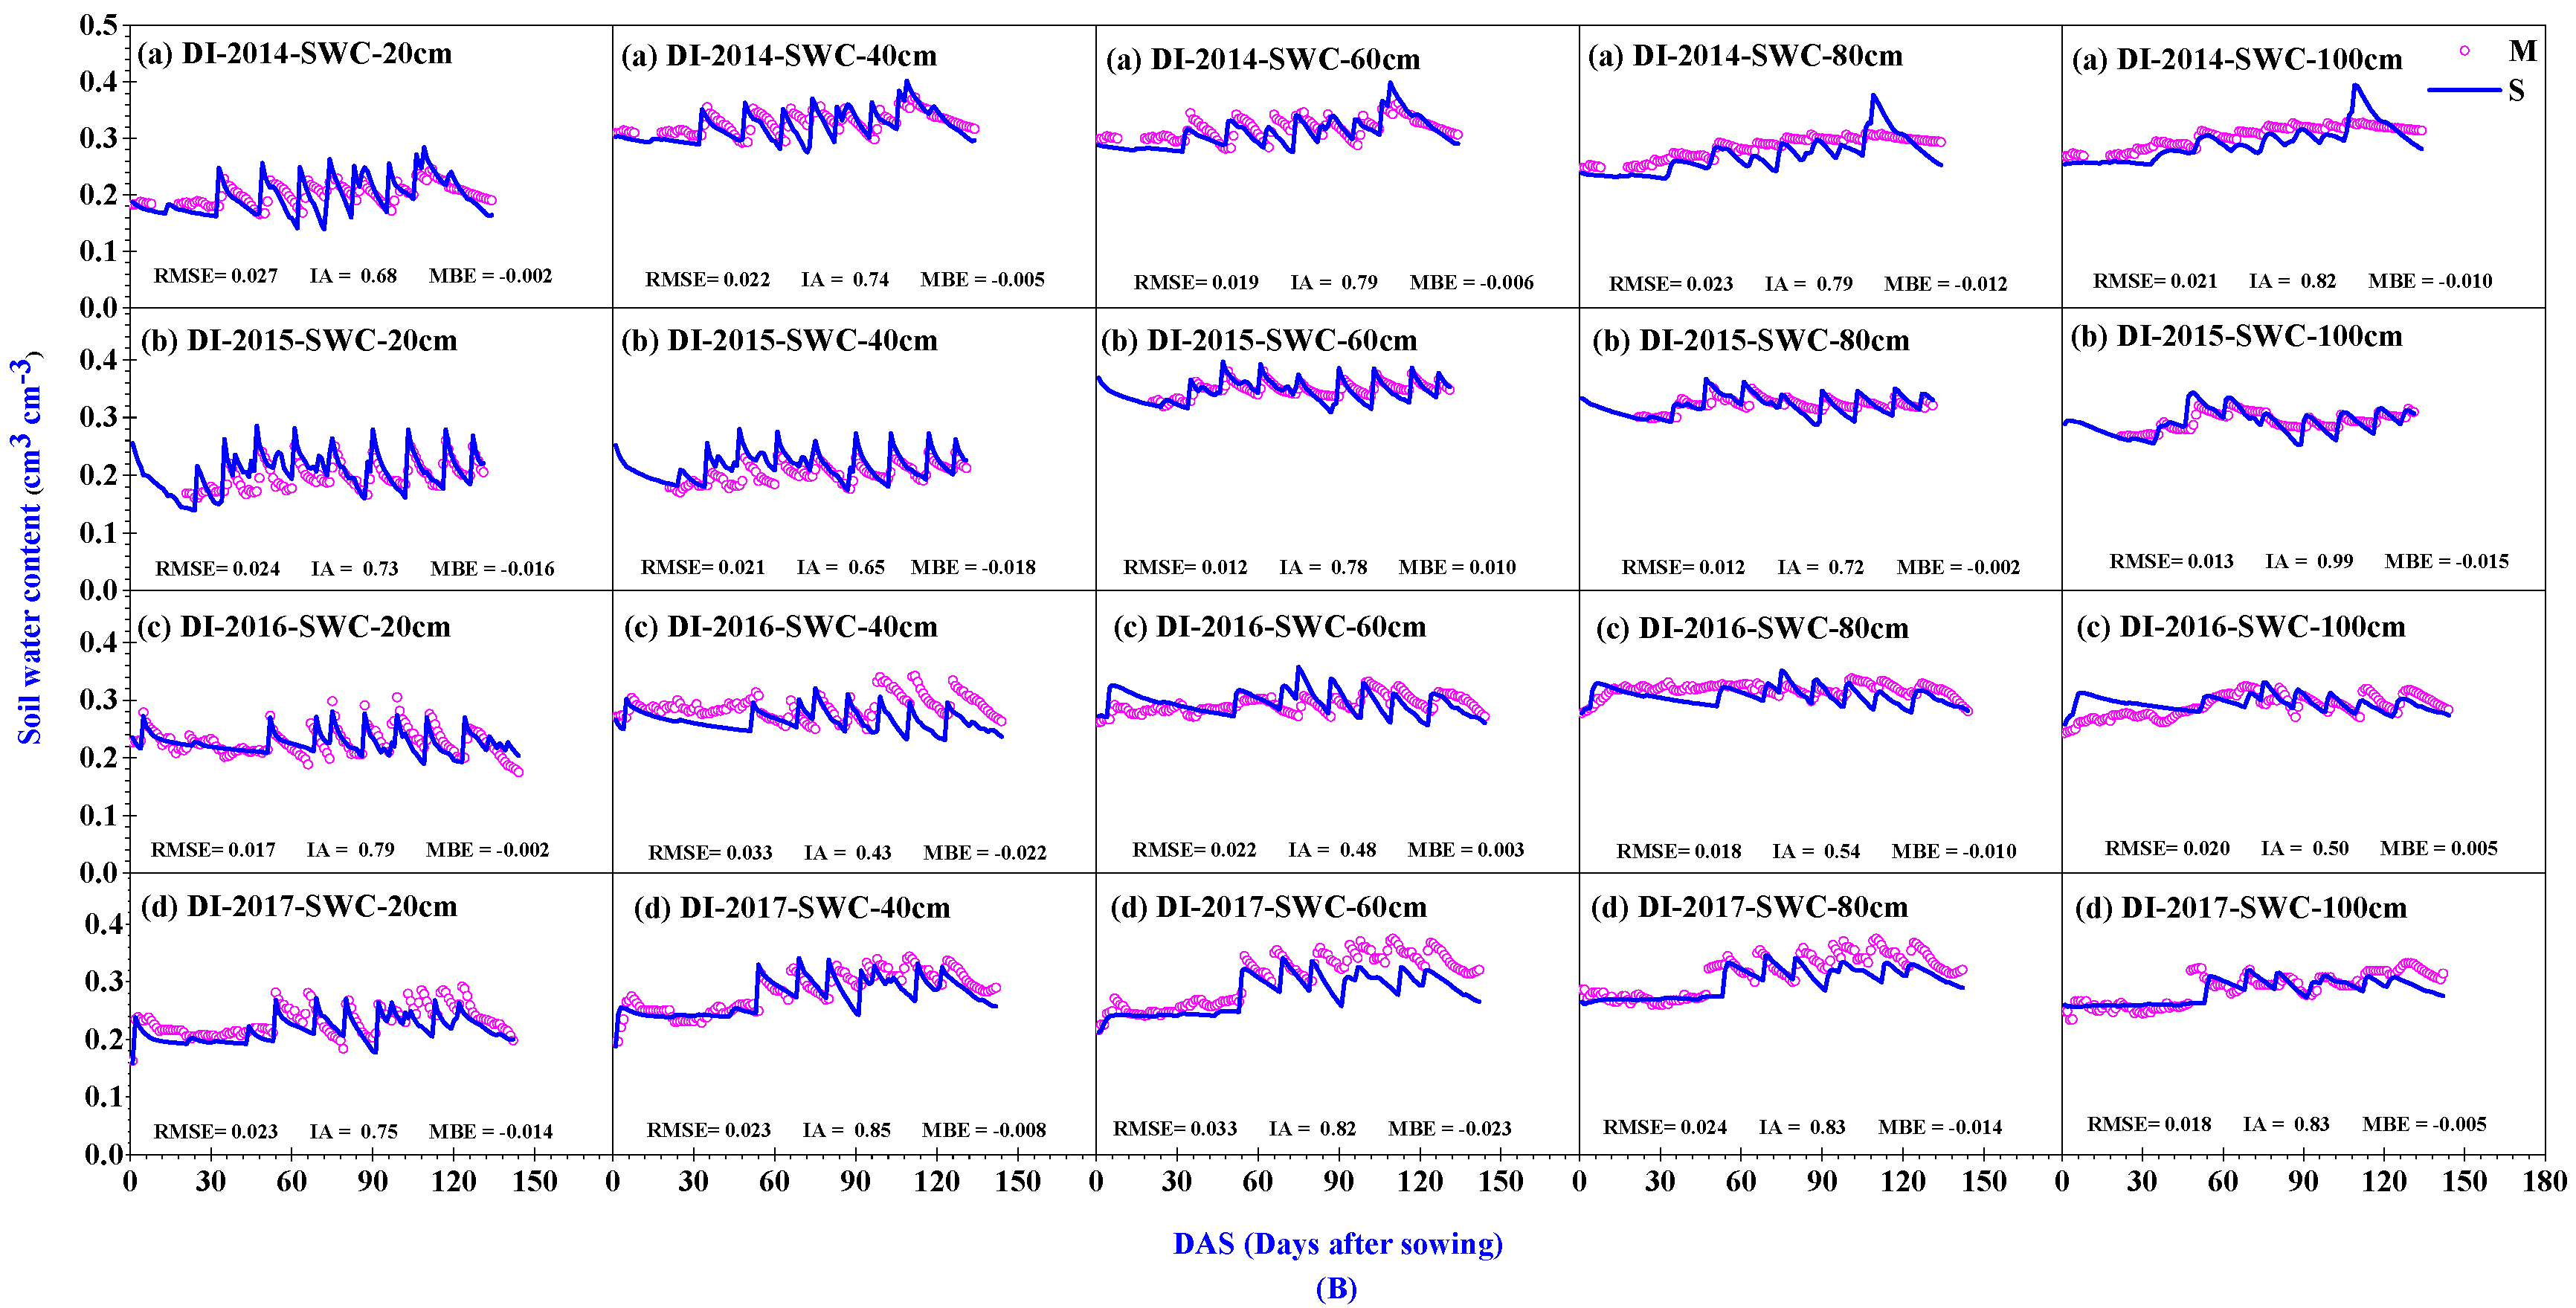
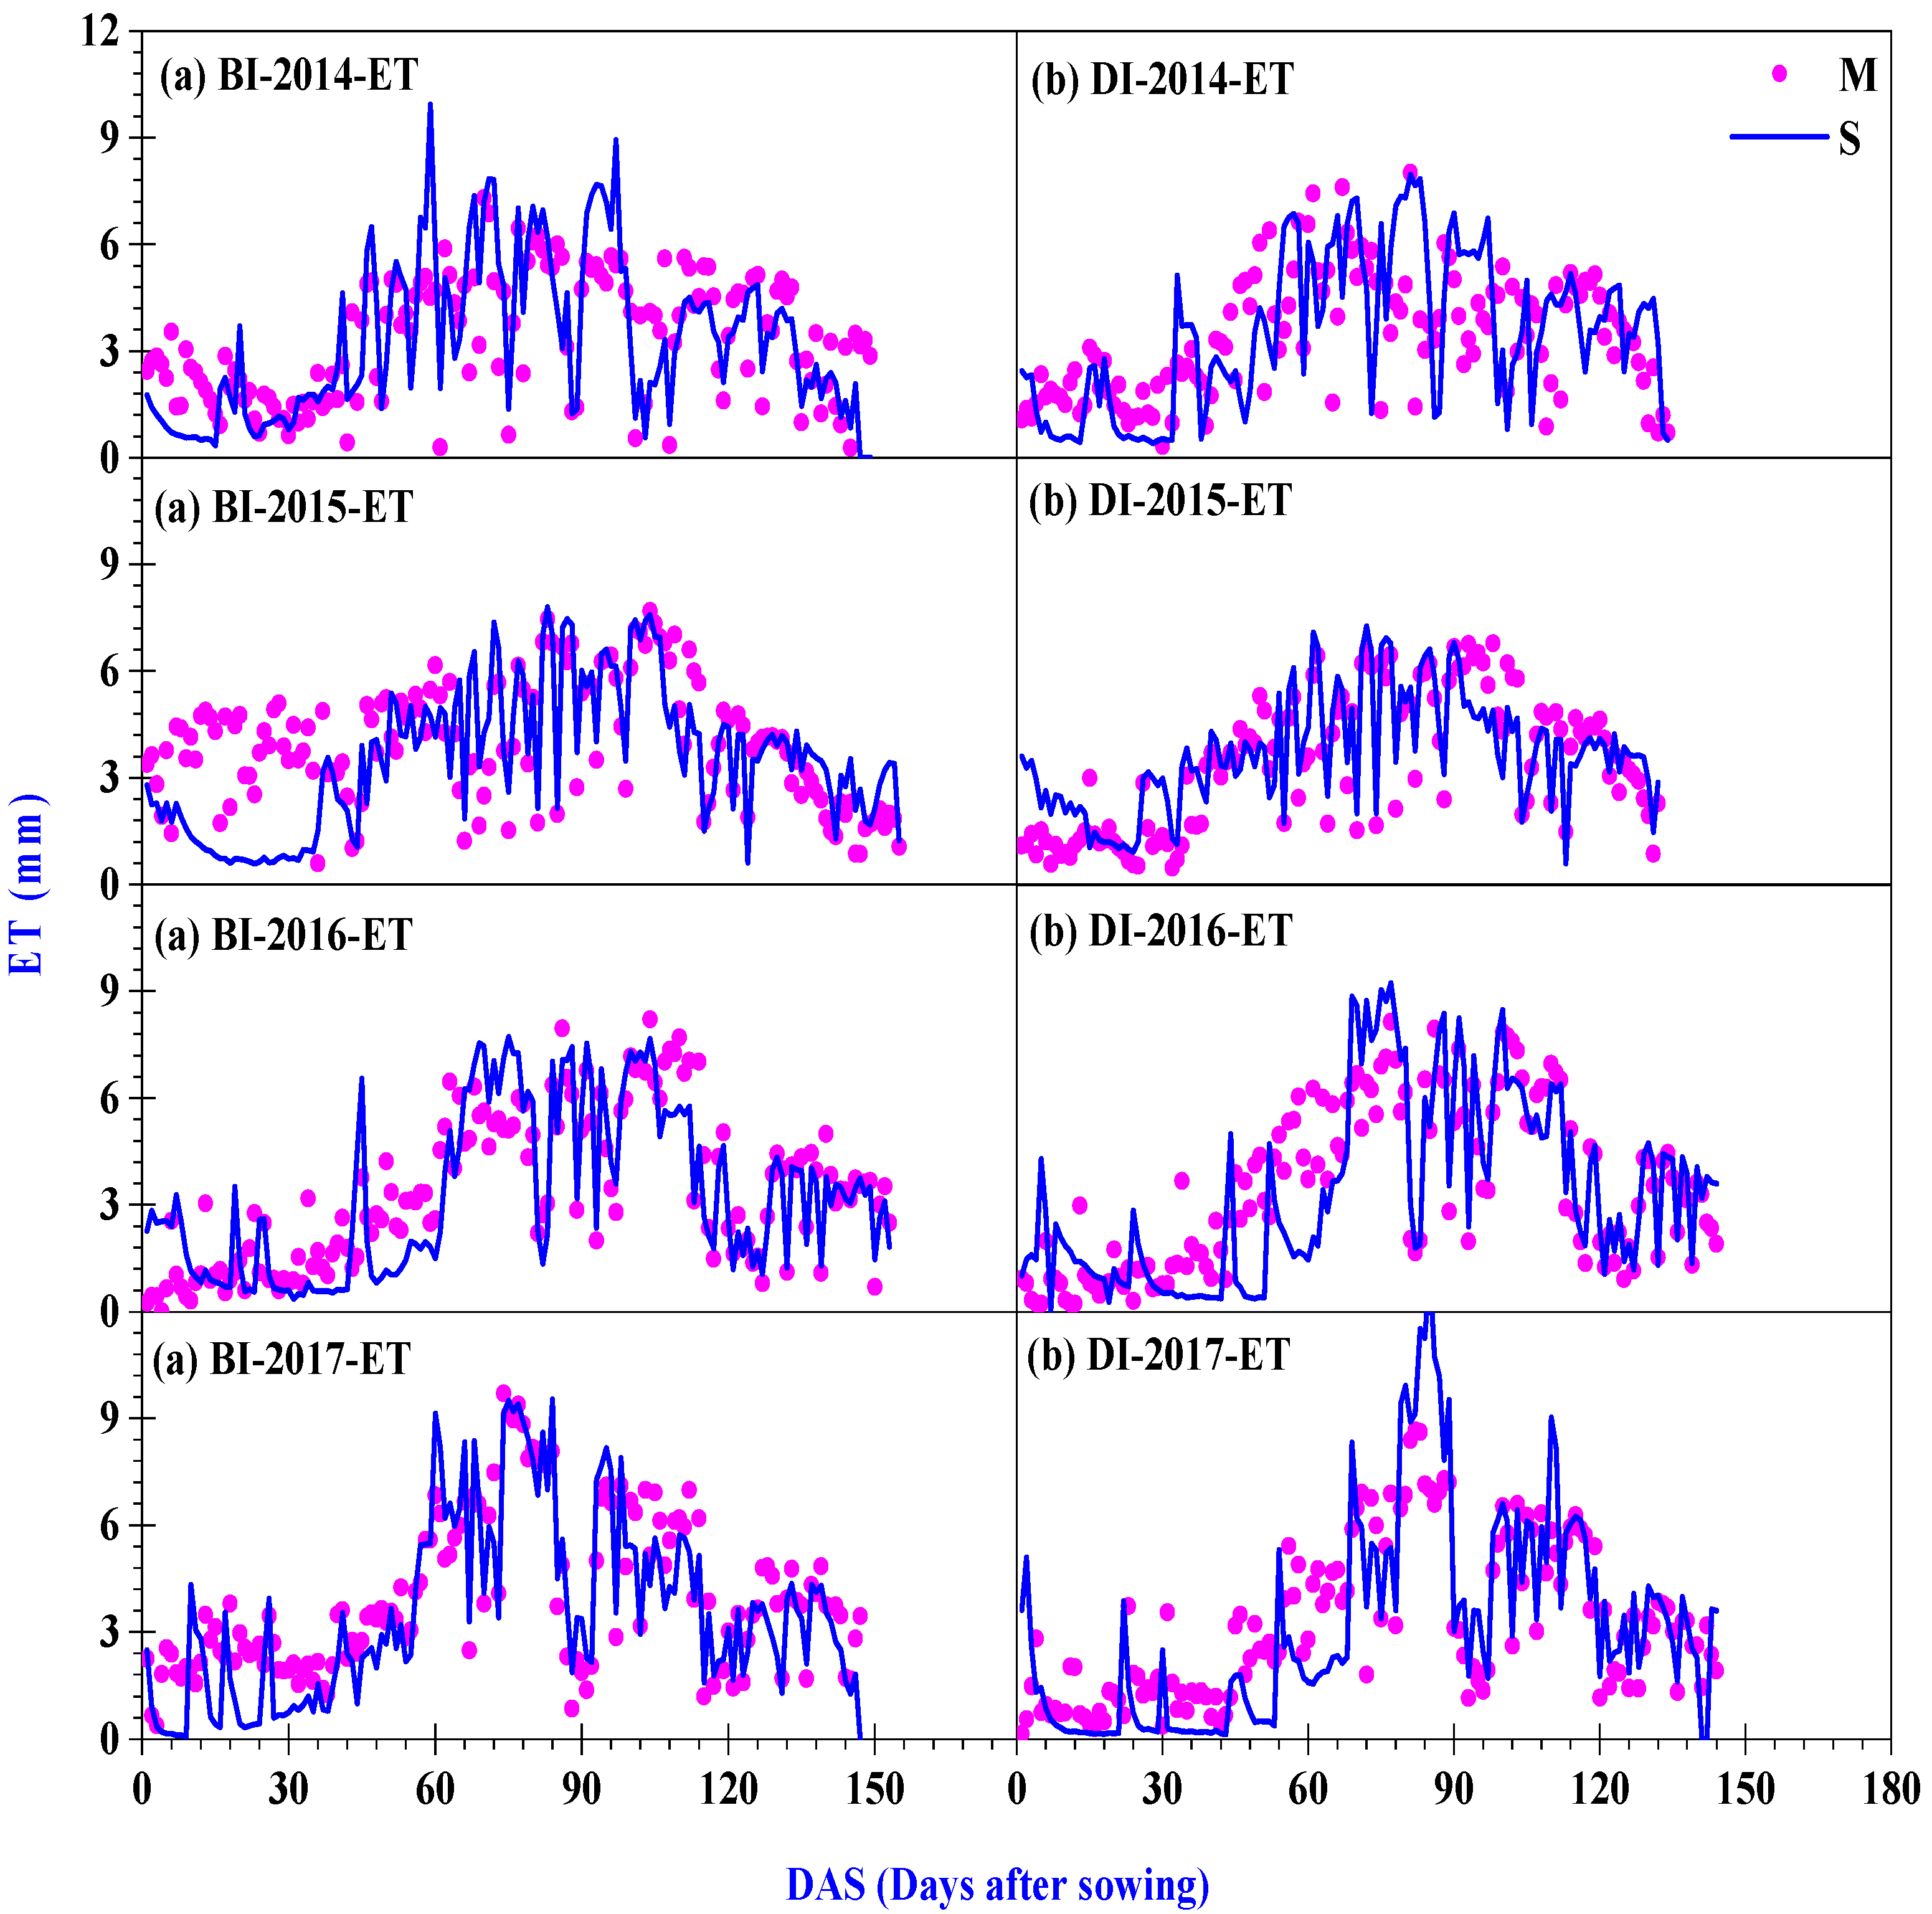
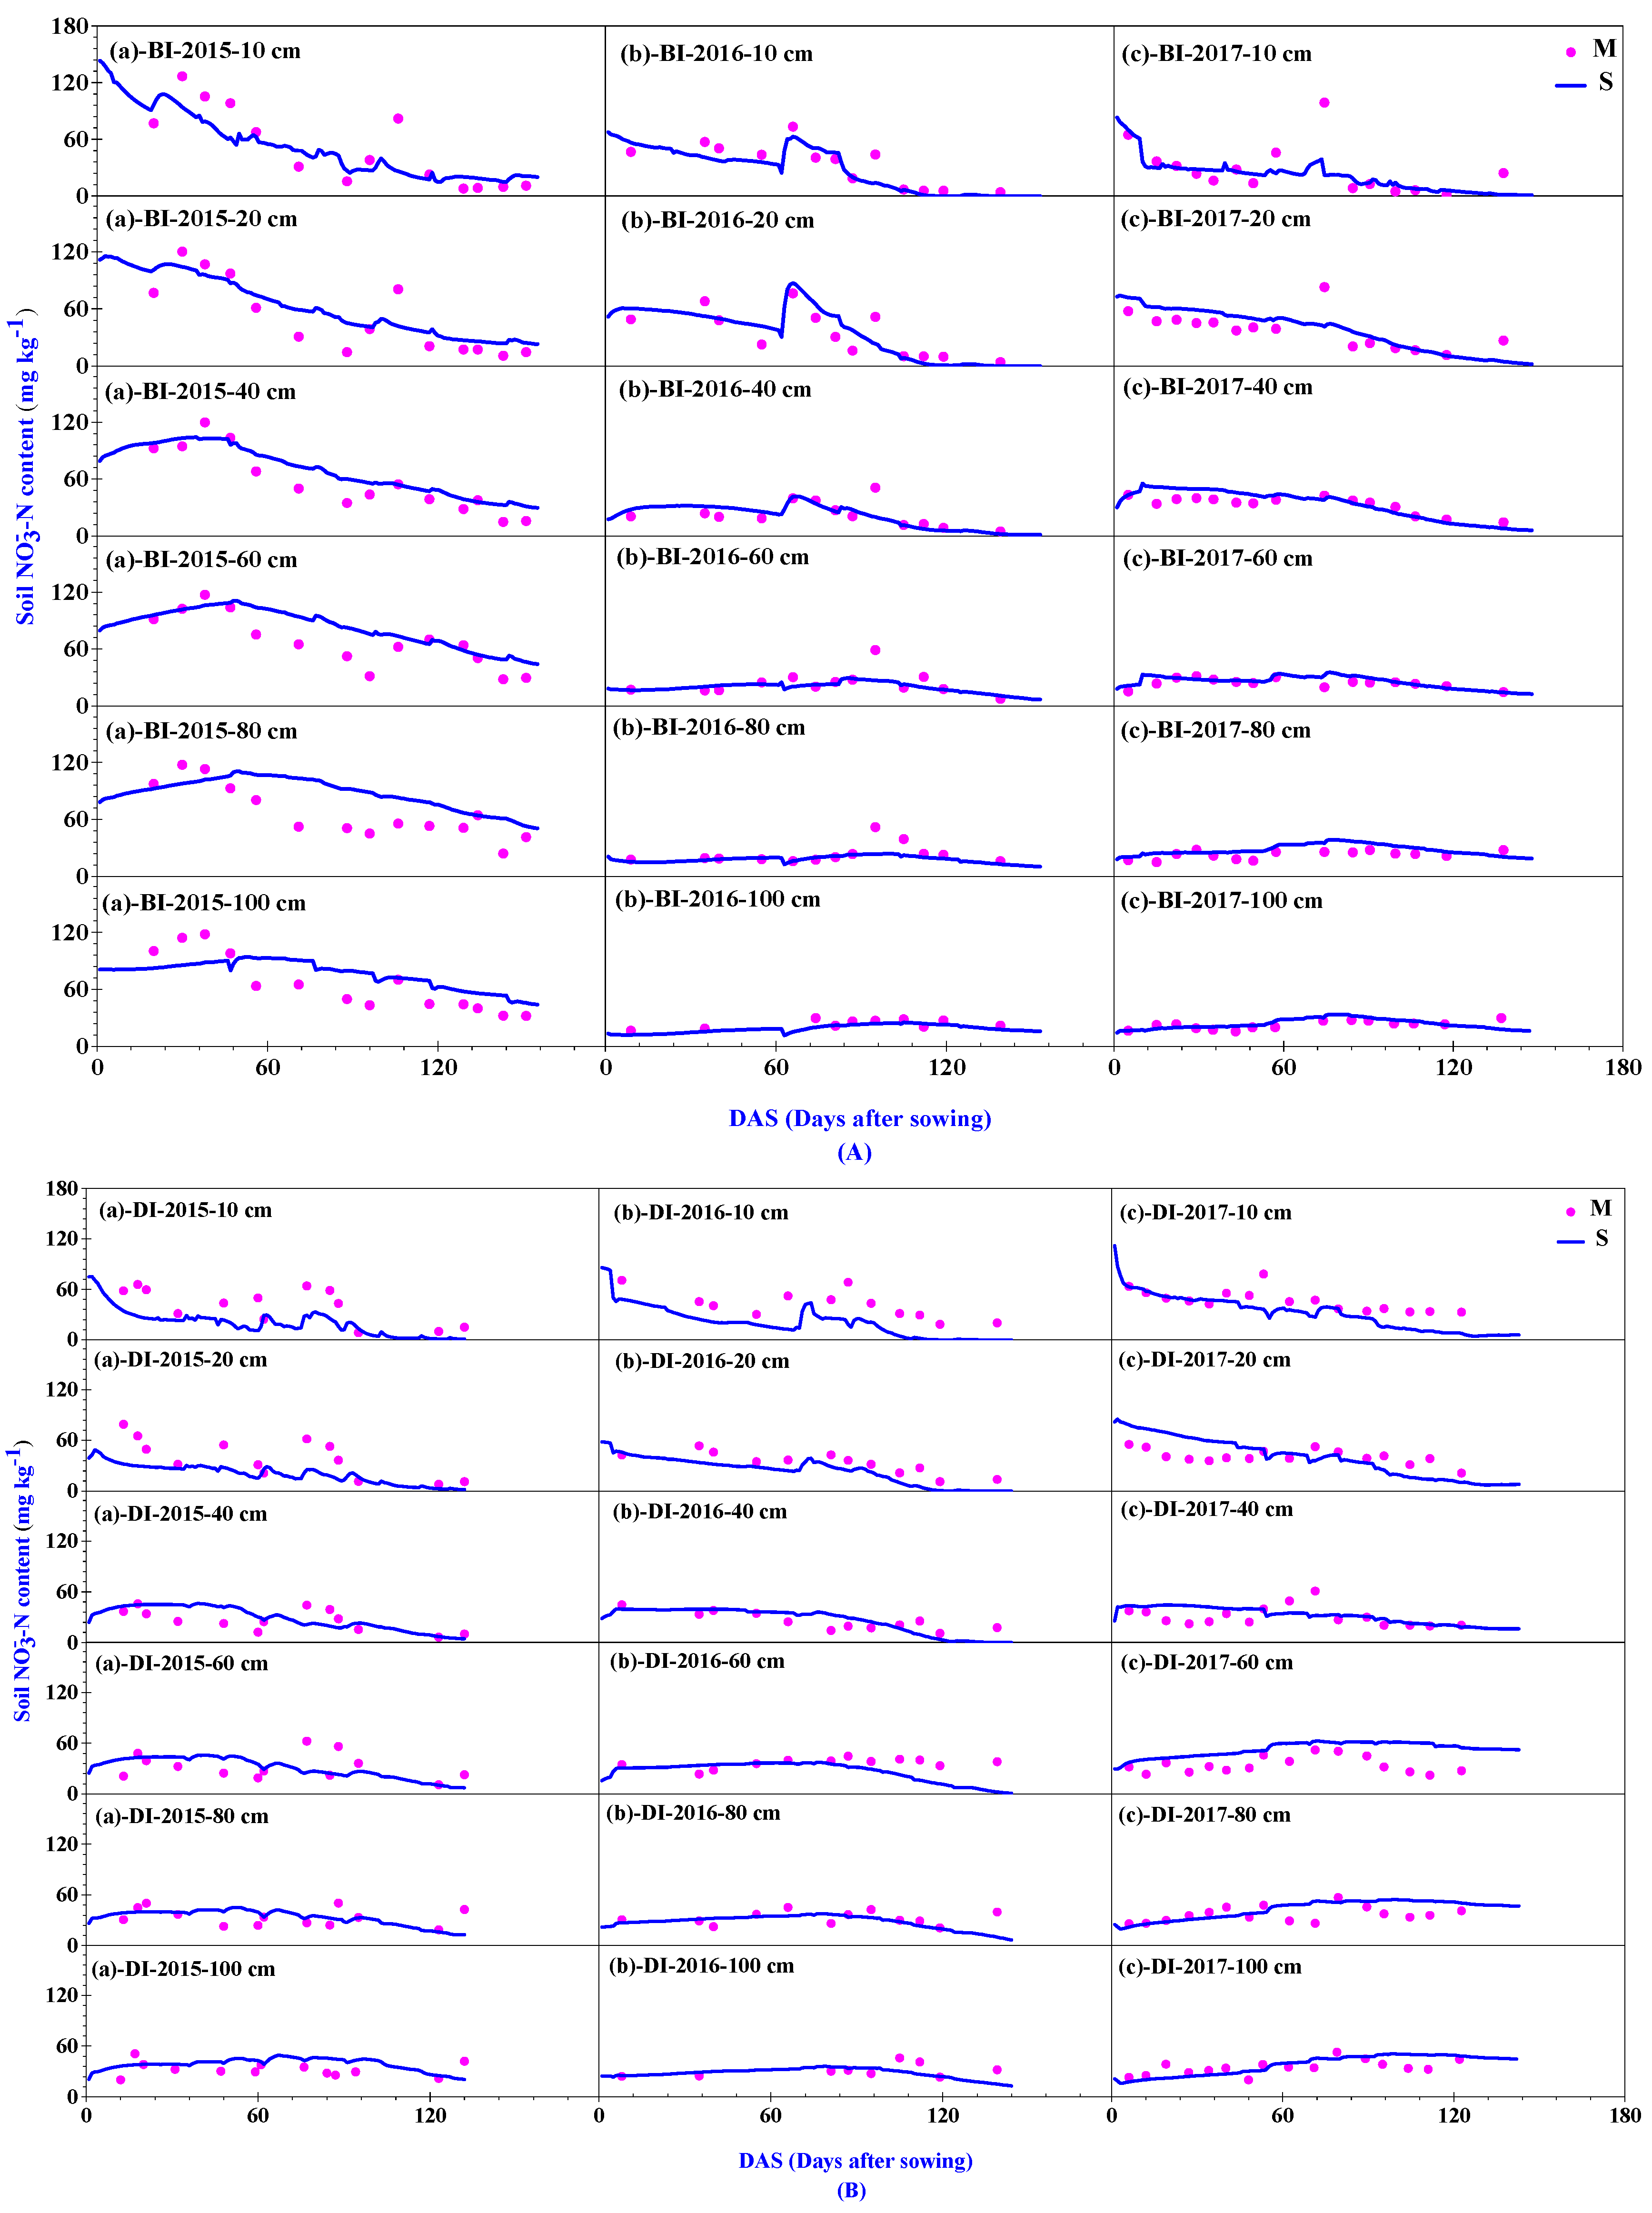
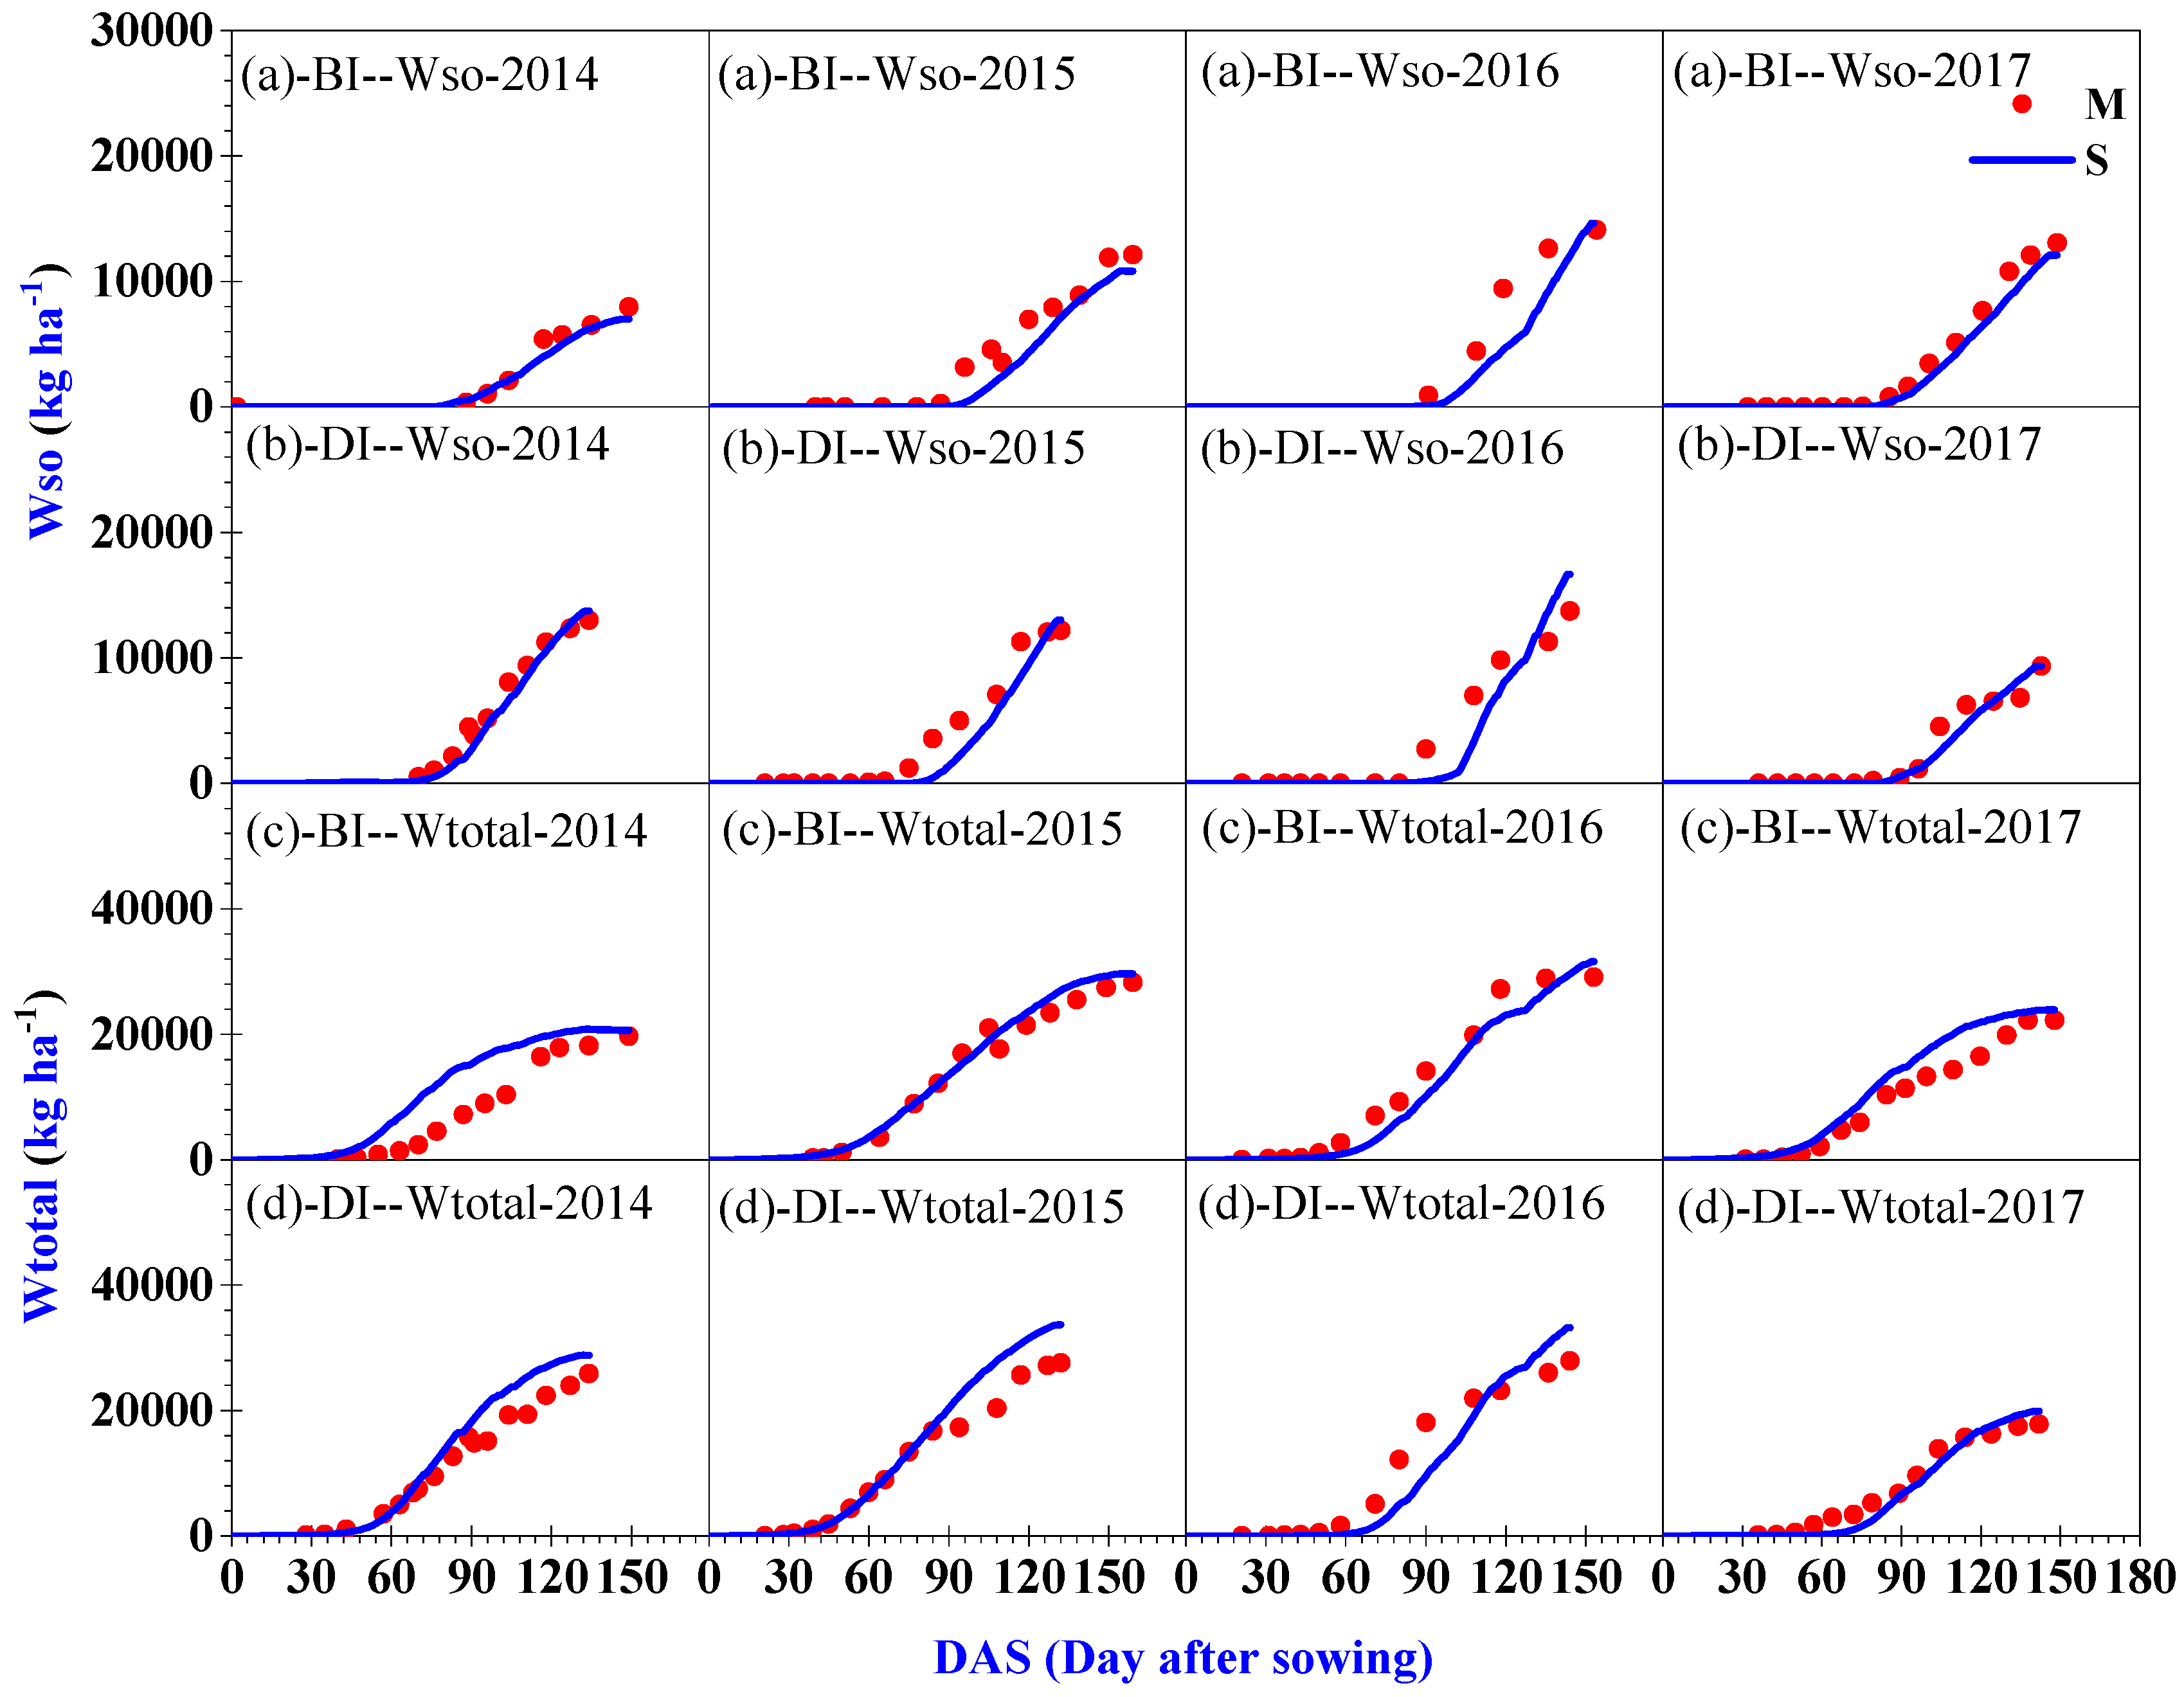
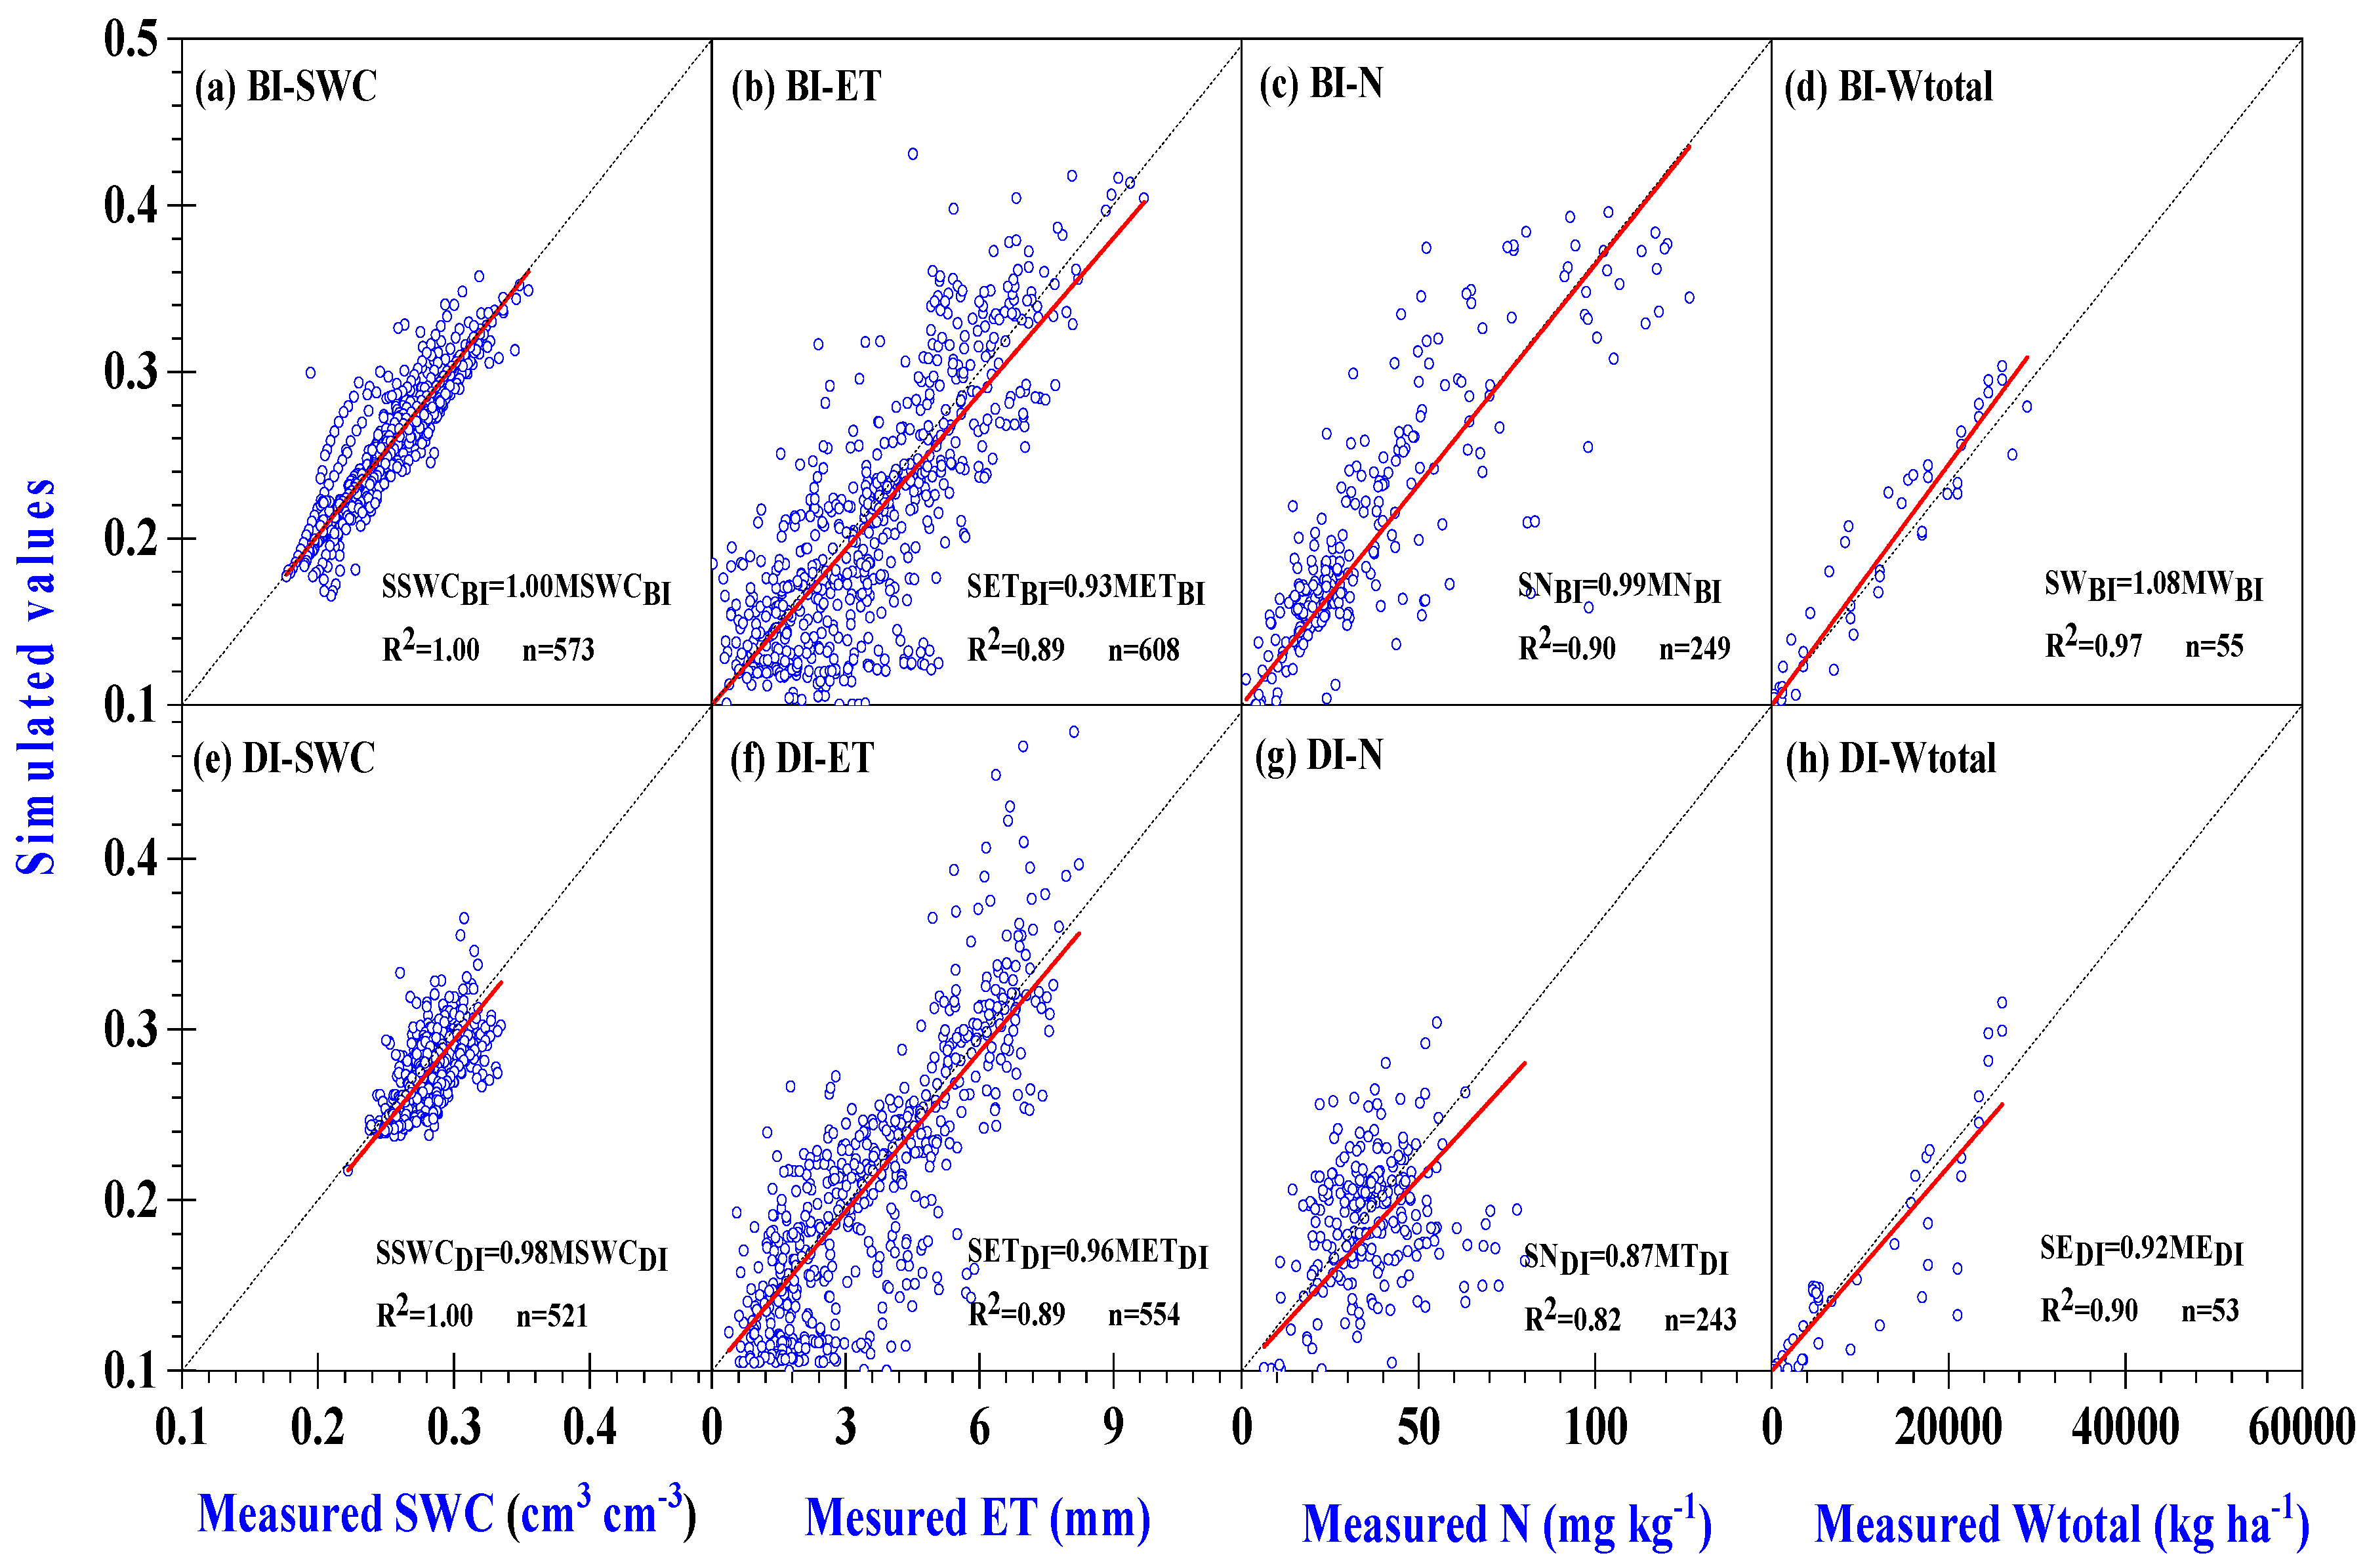
3.1. Simulation Performance of the Model under Film Mulching Border Irrigation (BI) and Film Mulching Drip Irrigation (DI)

Figure 1, Figure 2, Figure 3 and Figure 4 show that the soil water content (SWC), evapotranspiration (ET), soil N O 3 - -N content, crop yield and total dry matter under BI and DI treatments simulated by the WHCNS model are in good agreement with the measured values, presenting a favorable simulation effect from 2014 to 2017. Simulated and measured values of soil N O 3 - -N content in 2014 under both treatments are not presented for lack of data.
Table 6 shows statistical indices of simulated SWC and soil N O 3 - -N contents at different depths and ET under BI and DI. The simulation mean bias error (MBE) of SWC under the BI treatment in each soil layer ranges from −0.002~0.001 cm3 cm−3, along with an RMSE about 0.02 cm3 cm−3, and IA of 0.83~0.87. Meanwhile, the simulation MBE of SWC under the DI treatment in each soil layer ranges from −0.017~−0.002 cm3 cm−3, along with an RMSE of 0.02~0.03 cm3 cm−3, and IA of 0.67~0.78, indicating that the soil water contents simulated by the WHCNS model are in good agreement with the measured values of the CS616 sensor [43].
The MBE of the simulated soil N O 3 - -N content under the BI treatment ranges from 2.13~6.47 mg kg−1, along with an RMSE of 10.19~14.52 mg kg−1 and IA of 0.67~0.91. By contrast, MBE of the simulated soil N O 3 - -N content under the DI treatment ranges from −7.25~5.24 mg kg−1, with an RMSE of 9.00~16.50 mg kg−1 and IA of 0.78~0.89. The results show that the model performed well in simulation of soil nitrogen concentrations [42].
MBE of the simulated ET under the BI treatment ranges from −0.46~−0.05 mm d−1, along with an RMSE of 1.13~1.64 mm d−1 and IA of 0.83~0.87. By contrast, MBE of the simulated ET under the DI treatment ranges from −0.30~−0.11 mm d−1, with an RMSE of 0.87~1.64 mm d−1 and IA of 0.86~0.92. These indicate the simulated ET was in a good agreement with the measured value.
Figure 5 shows the relationship between the measured and simulated average SWC of 0–100 cm, ET, soil N O 3 - -N content, and total dry matter (Wtotal) under the BI treatment and the DI treatment during 2014–2017. The correlation coefficients for SWC, ET, soil N and Wtotal were 1.00, 0.89, 0.90 and 0.97 under the BI treatment, respectively, during 2014–2017, and 1.00, 0.89, 0.82 and 0.90 under the DI treatment, respectively, during 2014–2017. The slopes of the regression equations for SWC, ET, soil N O 3 - -N content and Wtotal were 1.00, 0.93, 0.99 and 1.08 under the BI treatment, respectively, during 2014–2017, and 0.98, 0.96, 0.87 and 0.92 under the DI treatment, respectively, during 2014–2017, apparently all close to 1.
In summary, the WHCNS model performs well in the simulation of SWC, soil N O 3 - -N contents, ET and Wtotal under the film mulching condition under both BI and DI treatments. Hence, the model can be reliably used as a prediction tool to evaluate water and nitrogen fate over a film mulching maize field under an irrigation change in the study area.

3.2. Water Budgets and Water-Use Efficiency (WUE) under Film Mulching Border Irrigation (BI) and Film Mulching Drip Irrigation (DI)

Based on the simulated values of WHCNS. We analyzed water budgets and water-use efficiency under two treatment. Table 7 summarizes the soil water budgets and WUE at 1.0 m soil depth under the BI treatment and the DI treatment. Irrigation and rainfall were the main sources of farmland water input. Under the BI treatment, the total water input during the whole growth period from 2014 to 2017 varied from 561 mm to 703 mm, and the irrigation amount varied greatly from 360 mm to 570 mm, while under the DI treatment, the total amount of water input during the whole growth period from 2014 to 2017 ranged from 502–545 mm, and irrigation amount saw smaller change ranging from 350–427 mm. As BI was switched to DI, the amount of water input was significantly reduced. The interannual difference of water input under the two treatments was related to the local irrigation management tradition, meteorological conditions and soil water environment.
Farmland water was mainly consumed through evapotranspiration (ET) and drainage, the two parameters with a great difference under two treatments. Among them, the ET consumption during the whole growth period under the BI treatment varied from 486 mm to 543 mm during the four years, while under the DI treatment varied from 450 mm to 500 mm. The ratios of ET in the total water input under BI and DI treatments were 86% and 86% in 2014, 78% and 96% in 2015, 84% and 85% in 2016, 75% and 90% in 2017, with an average of 80% and 89%, respectively, over four years. Under the traditional BI treatment, the proportion of ET to water input rose with the increase of water input, but decreased when the water input exceeded a certain limit. This is because excessive water input caused waste of water resources. The results show that switch from BI to DI has reduced the ET consumption.
Water drainage under the BI treatment changed from 102 mm to 139 mm, while under the DI treatment it changed from 28 mm to 72 mm. The ratios of deep drainage to total water input under BI and DI treatments were 20% and 13% in 2014, 18% and 5% in 2015, 23% and 13% in 2016, 15% and 8% in 2017, respectively, with averages of 19% and 10%, respectively, for four years. Switching from BI to DI can greatly reduce the water loss in the water drainage during the growth period.
The balance value under the BI treatment changed from −1 mm to 24 mm, while the balance value under the DI treatment changed from −31 mm to 3 mm. This indicates that the two irrigation management methods still need further optimization and that further research is needed to find out specific optimization methods.
Research shows that DI could considerably reduce the irrigation water input and loss in the growth period compared with BI during 2014–2017. For crop yield, in 2017, the highest input of irrigation water in four years under the BI treatment achieved significantly higher crop yield than that under the DI treatment, but the DI treatment achieved higher crop yield in other years. Except that WUE under the two treatments was similar in 2017, the mean results of other years all showed that DI significantly improved WUE.
The results show that switching from BI to DI reduced the amount of irrigation water input, decreased ET consumption and water drainage loss, and improved WUE in the growth period.

3.3. Nitrogen Budgets and Nitrogen-Use Efficiency (NUE) under Film Mulching Border Irrigation (BI) and Film Mulching Drip Irrigation (DI)

Based on the simulated values of WHCNS, we analyzed nitrogen budgets and nitrogen-use efficiency under the two treatments. Table 8 shows nitrogen budgets and NUE at 1.0 m soil depth under the BI treatment and the DI treatment. The nitrogen fertilizer input under the BI treatment was slightly higher than that under the DI treatment. From 2014 to 2017, the average annual increase in nitrogen fertilizer input under the BI treatment was about 8% against the DI treatment. Another source of available nitrogen is the mineralization of organic nitrogen in the soil. The net mineralization values of cornfields under the two treatments during the whole growth period from 2014 to 2017 were all positive and very similar.
Plant nitrogen absorption, nitrogen leaching and gaseous nitrogen loss are the main forms of soil nitrogen consumption. The change range of nitrogen uptake of maize during the whole growth period under the BI treatment was 154–246 kg N ha−1, while under the DI treatment it was 225–314 kg N ha−1 over four years. Under the same treatment, the nitrogen absorption is directly proportional to increase of yield. The amount of leaching is affected by the irrigation amount and related to the amount of water leakage. Our study has shown that the DI treatment significantly reduced the loss of nitrogen leaching. From 2014 to 2017, farmland nitrogen leaching during the total growth period under the BI treatment ranged from 97 to 186 kg N ha−1, while under the DI treatment it ranged from 11 to 67 kg N ha−1. Compared with the BI treatment, the nitrogen leaching during the whole growth period under the DI treatment fell by 68% on average.
Nitrogen emission is another important cause of nitrogen loss in farmland, including ammonia volatilization and nitrogen denitrification. From 2014 to 2017, ammonia volatilization during the whole growth period under the BI treatment ranged from 18–62 kg N ha−1, accounting for 7–17% of nitrogen fertilizer input, while under the DI treatment it varied within the range of 11–31 kg N ha−1, accounting for 6–15% of nitrogen fertilizer input. From 2014 to 2017, the average annual ammonia volatilization under the DI treatment was 34% lower than that under the BI treatment. From 2014 to 2017, NUE under BI and DI treatments was 24.6 and 43.5 kg kg−1 in 2014, 27.7 and 42.9 kg kg−1 in 2015, 34.8 and 41 kg kg−1 in 2017, 28.7 and 33.8 kg kg−1 in 2017, respectively, with the average values of 29.0 and 40.3 kg kg−1, respectively, over four years. Thus it can be seen that DI improved NUE.
The results show that the switch of the irrigation mode under mulching reduced the amount of nitrogen input in the growth period, decreased nitrogen leaching and nitrogen emission, and improved NUE.

4. Discussion

4.1. How Can Drip Irrigation Affect the Field Water Balance Compared with Border Irrigation?

In our study, both treatments had the same mulching ratio, yet were mainly different in terms of the irrigation methods. Local BI events occur over the mulch with water infiltrating through membrane holes and bare soil between membranes. When irrigated each time, water can quickly fill the field block, forming a layer of water on the surface and infiltrating into the deep soil. In contrast, the irrigation of the DI treatment occurred under the membrane, with irrigation water running through the drip into the soil infiltration. In contrast with the BI treatment, the amount of irrigation water applied and the wetting range under the DI treatment during one irrigation practice were smaller, but with a higher irrigation frequency during the whole growth period.
The results show that the change of the irrigation mode affected the process of farmland water balance. Studies have shown that DI is a more efficient way than border irrigation, reducing both water input and water loss [44], which has been verified by our study. Our study showed the primary irrigation amount under the DI treatment was significantly reduced (about 1/2 of that under the BI treatment) compared with BI treatment. Meanwhile, the smaller soil wetting area and wetting depth of irrigation under DI minimized deep percolation and leaching of nutrients from the root zone [11,45,46]. However, ET is related to crop growth. Our study shows DI reduced the average annual water consumption of ET by about 9%, failing to exceed 15% as concluded by many field experiments [47,48,49,50]. Meanwhile, previous studies showed the evapotranspiration decrease under DI treatment was mainly through reducing evaporation against BI treatment [25,26].

4.2. How Can Drip Irrigation Affect the Field Nitrogen Balance Compared with Border Irrigation?

The fertilization method also differed under different irrigation methods as described in 2.2. This difference also led to a change in field nitrogen balances. Previous results showed that this difference was mainly reflected in the leaching loss of nitrogen [51], which is related to the amount of nitrogen and irrigation input [20]. Our study indicated the amount of irrigation and N fertilizer applied under DI were both lower than those under BI, which reduced the annual loss of nitrogen under DI by about 68%. The result is consistent with the relevant research conclusions of Romic et al. (2013) [52]. In the case of nitrogen gas loss, many studies have proved that mulching can reduce nitrogen gas loss [11,53,54]. The fertilization event in the DI treatment occurred under the film, which hindered the gas loss process. Studies have shown that gas loss under film-mulching drip irrigation decreased by 35% annually. The net mineralization values under the two treatments during the whole growth period in 2014–2017 were all positive and very similar. This may be attributed to the residual nitrogen fertilizer and large amount of corn straw in the soil before maize planting [55]. However, the results may differ from some previous studies in 2014, which showed that because drier soil under DI retarded the decomposition of cover crop biomass, thereby DI slightly reduced the amount of nitrogen mineralization [54,56].

4.3. The Effects of Irrigation Switch on WUEs and NUEs

In our study, the two irrigation methods had the same mulching ratio. However, the interaction between drip irrigation and film mulching factors enables DI to have the advantages of both drip irrigation and film mulching [26,41]. Deng et al (2006) [44] pointed out that DI was more efficient than border/furrow irrigation. Studies have shown that drip irrigation under film mulching functions to heat up and increase yield, and can provide more suitable water and fertilizer environment for crop growth and development [57], which has been verified by our study. Under the premise of saving water and fertilizer, DI can ensure the yield is not reduced. Hatfield et al (2001) [58] found that WUE can be enhanced by 25% to 40% through transforming field management practices. Our results show DI increased WUE by about 27% (0.6 kg m−3) mainly due to the decreased water input and loss. As mentioned above, the nitrogen fertilizer loss in the farmland was greatly reduced after this transformation. Application of DI also increased NUE by 11.3 kg kg−1 annually during the four years in the farmland. Evidently, improving WUE and NUE is important to better meet demand for water and fertilizer from crops temporally and spatially [24,59]. Previous analysis by Li et al (2016) [60] over more than 30 years in arid regions in northwest China concluded that the shift in irrigation practices is an important factor for increasing water productivity in the region.
Studies have shown that the change of the irrigation method from film mulching border irrigation to film mulching drip irrigation is beneficial to the utilization of water and nitrogen in farmland, which not only meets the strategic need of water-saving but also guarantees food security to a certain extent.

5. Conclusions

This study adopted a model to evaluate the water- and nitrogen-use efficiency of a film mulching cornfield under a change in irrigation from BI to DI. The conclusions are as follows: (1) The irrigation income and expenditure of irrigation water were significantly changed: water leakage loss was reduced by up to 56% annually, and the ratio of ET to farmland water input increased by 9% annually. The average annual increase of WUE in farmland was 0.6 kg m−3. (2) The nitrogen income and expenditure process of farmland changed. DI reduced the average annual nitrogen leakage loss by about 68% and lowered the average annual nitrogen loss by 35%. The average annual increase of NUE in farmland was 11.3 kg kg−1. DI saved the input cost of water and nitrogen fertilizer and reduced the waste loss of water and nitrogen fertilizer during irrigation, thus improving economic efficiency to a certain extent compared with BI.
The research results reveal the impact of the application of DI on water and nitrogen budgets in farmland, and confirm the practical significance of promoting DI technology in arid and semi-arid areas. It provides a scientific reference for the application and popularization of DI in arid areas.

Author Contributions

Conceptualization, Y.W. and S.L.; Methodology, Y.W., S.L., K.H. and H.L.; Software, Y.W., K.H. and H.L.; validation, Y.W.; formal analysis, Y.W.; investigation, Y.W., S.Q. and H.G.; Resources, S.L.; Writing—original draft preparation, Y.W.; Writing—review and editing, S.L. Project administration, S.L.; Funding acquisition, S.L. All authors have read and agreed to the published version of the manuscript.

Funding

This work was financially supported by the National Key Research and Development Program of China (2016YFC0400201), National Natural Science Foundation of China (51622907, 51621061 and 51879262), and Special Fund for Research in the Public Interest provided by the Chinese Ministry of Agriculture (201503125).

Acknowledgments

We wish to thank the staff of the Shiyang River Basin Experimental Station for Agriculture and Ecological Water Saving of China Agriculture University.

Conflicts of Interest

The authors declare no conflict of interest.

References

  1. World Bank. 2017. Available online: http://data-worldbank-org-s/indicator/ER.H2O.FWAG.ZS (accessed on 31 March 2020).
  2. Carlos, G.-R.; Douglas, V.; Giovanni, M. Irrigation Management Transfer Worldwide Efforts and Results; Paper No.1; FAO: Rome, Italy, 2007. [Google Scholar]
  3. Jin, L.; Cui, H.; Li, B.; Zhang, J.-W.; Dong, S.; Liu, P. Effects of integrated agronomic management practices on yield and nitrogen efficiency of summer maize in North China. Field Crop. Res. 2012, 134, 30–35. [Google Scholar] [CrossRef]
  4. Liu, X.; Zhang, Y.; Han, W.; Tang, A.; Shen, J.; Cui, Z.; Vitousek, P.M.; Erisman, J.W.; Goulding, K.; Christie, P.J.; et al. Enhanced nitrogen deposition over China. Nat. Cell Biol. 2013, 494, 459–462. [Google Scholar] [CrossRef] [PubMed]
  5. Li, Y.-S.; Wu, L.-H.; Zhao, L.-M.; Lu, X.-H.; Fan, Q.-L.; Zhang, F.-S. Influence of continuous plastic film mulching on yield, water use efficiency and soil properties of rice fields under non-flooding condition. Soil Tillage Res. 2007, 93, 370–378. [Google Scholar] [CrossRef]
  6. Ghosh, P.; Dayal, D.; Bandyopadhyay, K.; Mohanty, M. Evaluation of straw and polythene mulch for enhancing productivity of irrigated summer groundnut. Field Crop. Res. 2006, 99, 76–86. [Google Scholar] [CrossRef]
  7. Wang, X.K.; Li, Z.B.; Xing, Y.Y. Effects of mulching and nitrogen on soil temperature water content, nitrate-N content and maize yield in the Loess Plateau of China. Agric. Water Manag. 2015, 161, 53–64. [Google Scholar]
  8. Bowen, P.; Frey, B. Response of Plasticultured Bell Pepper to Staking, Irrigation Frequency, and Fertigated Nitrogen Rate. HortScience 2002, 37, 95–100. [Google Scholar] [CrossRef] [Green Version]
  9. Xie, Z.-K.; Wang, Y.-J.; Li, F.M. Effect of plastic mulching on soil water use and spring wheat yield in arid region of northwest China. Agric. Water Manag. 2005, 75, 71–83. [Google Scholar] [CrossRef]
  10. Tiwari, K.; Kumar, M.; Singh, V.K.; Santosh, D. Response of Drip Irrigation and Plastic Mulch on Quality of Sapota(Achras Zapota)Fruits. Int. J. Agric. Environ. Biotechnol. 2016, 9, 699. [Google Scholar] [CrossRef]
  11. Yao, Z.; Yan, G.; Wang, R.; Zheng, X.; Liu, C.; Butterbach-Bahl, K. Drip irrigation or reduced N-fertilizer rate can mitigate the high annual N2O+NO fluxes from Chinese intensive greenhouse vegetable systems. Atmos. Environ. 2019, 212, 183–193. [Google Scholar] [CrossRef]
  12. Obayomi, O.; Edelstein, M.; Safi, J.; Mihiret, M.; Ghazaryan, L.; Vonshak, A.; Bernstein, N.; Gillor, O. The combined effects of treated wastewater irrigation and plastic mulch cover on soil and crop microbial communities. Biol. Fertil. Soils 2020, 56, 729–742. [Google Scholar] [CrossRef]
  13. Lamm, F.R.; Trooien, T.P. Subsurface drip irrigation for corn production: A review of 10 years of research in Kansas. Irrig. Sci. 2003, 22, 195–200. [Google Scholar] [CrossRef]
  14. Li, J.; Xu, X.; Lin, G.; Wang, Y.; Liu, Y.; Zhang, M.; Zhou, J.; Wang, Z.; Zhang, Y. Micro-irrigation improves grain yield and resource use efficiency by co-locating the roots and N-fertilizer distribution of winter wheat in the North China Plain. Sci. Total. Environ. 2018, 643, 367–377. [Google Scholar] [CrossRef] [PubMed]
  15. Fawibe, O.O.; Honda, K.; Taguchi, Y.; Park, S.; Isoda, A. Greenhouse gas emissions from rice field cultivation with drip irrigation and plastic film mulch. Nutr. Cycl. Agroecosyst. 2019, 113, 51–62. [Google Scholar] [CrossRef]
  16. Sandhu, O.; Gupta, R.K.; Thind, H.; Jat, M.; Sidhu, H.; Singh, Y. Drip irrigation and nitrogen management for improving crop yields, nitrogen use efficiency and water productivity of maize-wheat system on permanent beds in north-west India. Agric. Water Manag. 2019, 219, 19–26. [Google Scholar] [CrossRef]
  17. Mehmood, F.; Wang, G.; Gao, Y.; Liang, Y.; Chen, J.; Si, Z.; Ramatshaba, T.S.; Zain, M.; Rahman, S.-U.; Duan, A. Nitrous oxide emission from winter wheat field as responded to irrigation scheduling and irrigation methods in the North China Plain. Agric. Water Manag. 2019, 222, 367–374. [Google Scholar] [CrossRef]
  18. Liang, H.; Hu, K.L.; Li, B.G.; Liu, H.T. Coupled simulation of soil water-heat-carbon-nitrogen process and crop growth at soil-plant-atmosphere continuum system. Trans. Chin. Soc. Agric. Eng. 2014, 30, 54–66. [Google Scholar]
  19. Liang, H.; Hu, K.; Batchelor, W.D.; Qi, Z.; Li, B. An integrated soil-crop system model for water and nitrogen management in North China. Sci. Rep. 2016, 6, 25755. [Google Scholar] [CrossRef] [Green Version]
  20. Li, Z.; Hu, K.; Li, B.; He, M.; Zhang, J. Evaluation of water and nitrogen use efficiencies in a double cropping system under different integrated management practices based on a model approach. Agric. Water Manag. 2015, 159, 19–34. [Google Scholar] [CrossRef]
  21. Liang, H.; Qi, Z.; Hu, K.; Prasher, S.O.; Zhang, Y. Can nitrate contaminated groundwater be remediated by optimizing flood irrigation rate with high nitrate water in a desert oasis using the WHCNS model? J. Environ. Manag. 2016, 181, 16–25. [Google Scholar] [CrossRef]
  22. Chen, S.; Wang, S.; Shukla, M.K.; Wu, D.; Guo, X.; Li, D.; Du, T. Delineation of management zones and optimization of irrigation scheduling to improve irrigation water productivity and revenue in a farmland of Northwest China. Precis. Agric. 2019, 21, 655–677. [Google Scholar] [CrossRef]
  23. Li, S.; Zhang, L.; Kang, S.; Tong, L.; Du, T.; Hao, X.; Zhao, P. Comparison of several surface resistance models for estimating crop evapotranspiration over the entire growing season in arid regions. Agric. For. Meteorol. 2015, 208, 1–15. [Google Scholar] [CrossRef]
  24. Qin, S.; Li, S.; Yang, K.; Hu, K. Can plastic mulch save water at night in irrigated croplands? J. Hydrol. 2018, 564, 667–681. [Google Scholar] [CrossRef]
  25. Wang, Y.; Li, S.; Qin, S.; Guo, H.; Yang, D.; Lam, H.-M. How can drip irrigation save water and reduce evapotranspiration compared to border irrigation in arid regions in northwest China. Agric. Water Manag. 2020, 239, 106256. [Google Scholar] [CrossRef]
  26. Qin, S.; Li, S.; Kang, S.; Du, T.; Tong, L.; Ding, R. Can the drip irrigation under film mulch reduce crop evapotranspiration and save water under the sufficient irrigation condition? Agric. Water Manag. 2016, 177, 128–137. [Google Scholar] [CrossRef]
  27. Falge, E.; Baldocchi, D.; Olson, R.; Anthoni, P.; Aubinet, M.; Bernhofer, C.; Burba, G.; Ceulemans, R.; Clement, R.; Dolman, H.; et al. Short communication: Gap filling strategies for long term energy flux data sets. Agric. For. Meteorol. 2001, 107, 71–77. [Google Scholar] [CrossRef] [Green Version]
  28. Blake, G.R. Bulk density. In Methods of Soil Analysis, 1965. Part 1. Physical and Mineralogical Properties; Black, C.A., Ed.; ASA and SSSA: Madison, WI, USA, 1965; pp. 374–390. [Google Scholar]
  29. Ryżak, M.; Bieganowski, A. Methodological aspects of determining soil particle-size distribution using the laser difraction method. J. Plant Nutr. Soil Sci. 2011, 174, 624–633. [Google Scholar] [CrossRef]
  30. Sabbagh, G.J.; Geleta, S.; Elliott, R.; Williams, J.R.; Griggs, H.R. Modification of Epic to simulate pesticide activities: Epic-pst. Trans. ASAE 1991, 34, 1683–1692. [Google Scholar] [CrossRef]
  31. Green, W.H.; Ampt, G.A. Studies on soil physics, 1. The flow of air and water through soils. J. Agric. Sci. 1911, 4, 1–24. [Google Scholar]
  32. Simunek, J.; Huang, K.; Van Genuchten, M.T. The HYDRUS Code for Simulating the One-Dimensional Movement of Water, Heat, and Multiple Solutes in Variably-Saturated Media; Version 6.0. Res Rep.; U.S. Salinity Lab.: Riverside, CA, USA, 1998; p. 144. [Google Scholar]
  33. Allen, R.G.; Pereira, L.S.; Raes, D.; Martin, S. Crop Evapotranspiration Guidelines for Computing Crop Water Requirements; FAO Irrigation and Drainage Paper No.56; FAO: Rome, Italy, 1998; pp. 147–148. [Google Scholar]
  34. Jones, C.A.; Kiniry, J.R. CERES-Maize: A Simulation Model of Maize Growth and Development; Texas A & M University Press: College Station, TX, USA, 1987. [Google Scholar]
  35. Šimůnek, J. The HYDRUS-1D Software Package for Simulating the Movement of Water, Heat, and Multiple Solutes in Variably Saturated Media; Hydrus Software, U.S. Salinity Laboratory, Agricultural Research Service. U.S.: Riverside, CA, USA, 2005; p. 68. [Google Scholar]
  36. Hansen, S.; Jensen, H.E.; Nielsen, N.E.; Svendsen, H. NPo-research, A10: Daisy: Soil Plant Atmosphere System Model; The National Agency of Environmental Protection: Copenhagen, Denmark, 1990. [Google Scholar]
  37. Freney, J.; Leuning, R.; Simpson, J.R.; Denmead, O.T.; Muirhead, W.A. Estimating Ammonia Volatilization From Flooded Rice Fields by Simplified Techniques. Soil Sci. Soc. Am. J. 1985, 49, 1049–1054. [Google Scholar] [CrossRef]
  38. Lind, A.M. Denitrification in the root zone. Tidsskrift Planteavl 1980, 84, 101–110. [Google Scholar]
  39. Driessen, P.M.; Konijn, N.T. Land-Use System Analysis; Wageningen Agricultural University: Wageningen, The Netherlands, 1992. [Google Scholar]
  40. Mueller, T.; Jensen, L.S.; Magid, J.; Nielsen, N. Temporal variation of C and N turnover in soil after oilseed rape straw incorporation in the field: Simulations with the soil-plant-atmosphere model DAISY. Ecol. Model. 1997, 99, 247–262. [Google Scholar] [CrossRef]
  41. He, Q.; Li, S.; Kang, S.; Yang, H.; Qin, S. Simulation of water balance in a maize field under film-mulching drip irrigation. Agric. Water Manag. 2018, 210, 252–260. [Google Scholar] [CrossRef]
  42. Willmott, C.J. Some comments on the evaluation of model performance. Bull. Am. Meteorol. Soc. 1982, 63, 1309–1313. [Google Scholar] [CrossRef] [Green Version]
  43. Modelling Water and Nutrient Dynamics in Soil & Ndash; Crop Systems; Springer Science and Business Media LLC: New York, NY, USA, 2007.
  44. Deng, X.-P.; Shan, L.; Zhang, H.; Turner, N.C. Improving agricultural water use efficiency in arid and semiarid areas of China. Agric. Water Manag. 2006, 80, 23–40. [Google Scholar] [CrossRef]
  45. Cote, C.M.; Bristow, K.L.; Charlesworth, P.B.; Cook, F.J.; Thorburn, P. Analysis of soil wetting and solute transport in subsurface trickle irrigation. Irrig. Sci. 2003, 22, 143–156. [Google Scholar] [CrossRef]
  46. Vázquez, N.; Pardo, A.; Suso, M.; Quemada, M. Drainage and nitrate leaching under processing tomato growth with drip irrigation and plastic mulching. Agric. Ecosyst. Environ. 2006, 112, 313–323. [Google Scholar] [CrossRef]
  47. Fasinmirin, J.T.; Olufayo, A.A.; Oguntunde, P.G.; Oguntuase, A.M. Parametrizing Simple Model between Yield and Evapotranspiration for Amaranthus cruentus under Drip and Sprinkler Irrigations. Int. J. Plant Prod. 2009, 3, 75–90. [Google Scholar]
  48. Qiu, R.; Kang, S.; Li, F.; Du, T.; Tong, L.; Wang, F.; Chen, R.; Liu, J.; Li, S. Energy partitioning and evapotranspiration of hot pepper grown in greenhouse with furrow and drip irrigation methods. Sci. Hortic. 2011, 129, 790–797. [Google Scholar] [CrossRef]
  49. Zhang, Y.; Wang, J.; Gong, S.; Xu, D.; Sui, J.; Wu, Z.; Mo, Y. Effects of film mulching on evapotranspiration, yield and water use efficiency of a maize field with drip irrigation in Northeastern China. Agric. Water Manag. 2018, 205, 90–99. [Google Scholar] [CrossRef]
  50. Valentín, F.; Nortes, P.A.; Domínguez, A.; Sánchez, J.M.; Intrigliolo, D.S.; Alarcón, J.J.; López-Urrea, R. Comparing evapotranspiration and yield performance of maize under sprinkler, superficial and subsurface drip irrigation in a semi-arid environment. Irrig. Sci. 2019, 38, 105–115. [Google Scholar] [CrossRef]
  51. Lv, H.; Lin, S.; Wang, Y.; Lian, X.; Zhao, Y.; Li, Y.; Du, J.; Wang, Z.; Wang, J.; Butterbach-Bahl, K. Drip fertigation significantly reduces nitrogen leaching in solar greenhouse vegetable production system. Environ. Pollut. 2019, 245, 694–701. [Google Scholar] [CrossRef] [PubMed]
  52. Romic, D.; Romic, M.; Borosic, J.; Poljak, M. Mulching decreases nitrate leaching in bell pepper (Capsicum annuum L.) cultivation. Agric. Water Manag. 2003, 60, 87–97. [Google Scholar] [CrossRef] [Green Version]
  53. Tao, R.; Li, J.; Guan, Y.; Liang, Y.; Hu, B.; Lv, J.; Chu, G. Effects of urease and nitrification inhibitors on the soil mineral nitrogen dynamics and nitrous oxide (N2O) emissions on calcareous soil. Environ. Sci. Pollut. Res. 2018, 25, 9155–9164. [Google Scholar] [CrossRef] [PubMed]
  54. Kallenbach, C.M.; Rolston, D.E.; Horwath, W.R. Cover cropping affects soil N2O and CO2 emissions differently depending on type of irrigation. Agric. Ecosyst. Environ. 2010, 137, 251–260. [Google Scholar] [CrossRef]
  55. Penna, D.; Geris, J.; Hopp, L.; Scandellari, F. Water sources for root water uptake: Using stable isotopes of hydrogen and oxygen as a research tool in agricultural and agroforestry systems. Agric. Ecosyst. Environ. 2020, 291, 106790. [Google Scholar] [CrossRef]
  56. Shelton, D.R.; Sadeghi, A.M.; Mccarty, G.W. Effect of Soil Water Content on Denitrification during COVER Crop Decomposition. Soil Sci. 2000, 165, 365–371. [Google Scholar] [CrossRef]
  57. Wang, J.; Niu, W.; Li, Y.; Lv, W. Subsurface drip irrigation enhances soil nitrogen and phosphorus metabolism in tomato root zones and promotes tomato growth. Appl. Soil Ecol. 2018, 124, 240–251. [Google Scholar] [CrossRef]
  58. Hatfield, J.L.; Sauer, T.J.; Prueger, J.H. Managing Soils to Achieve Greater Water Use Efficiency. Agron. J. 2001, 93, 271–280. [Google Scholar] [CrossRef]
  59. Tilman, D.; Cassman, K.G.; Matson, P.A.; Naylor, R.; Polasky, S. Agricultural sustainability and intensive production practices. Nature 2002, 418, 671–677. [Google Scholar] [CrossRef]
  60. Li, X.; Zhang, X.; Niu, J.; Tong, L.; Kang, S.; Du, T.; Li, S.; Ding, R. Irrigation water productivity is more influenced by agronomic practice factors than by climatic factors in Hexi Corridor, Northwest China. Sci. Rep. 2016, 6, 37971. [Google Scholar] [CrossRef]
Figure 1. Comparison of measured values (M) and simulated values (S) of soil water content under border-irrigated (BI) treatment and drip-irrigated (DI) treatment in different depths (20 cm, 40 cm, 60 cm, 80 cm, 100 cm) during 2014–2017, respectively. Figure (A) represents BI; figure (B) represents DI.
Agronomy 10 01890 g001aAgronomy 10 01890 g001b
Figure 2. Comparison of measured values (M) and simulated values (S) of evapotranspiration (ET) under border-irrigated (BI) treatment and drip-irrigated (DI) treatment during 2014–2017, respectively.
Agronomy 10 01890 g002
Figure 3. Comparison of measured values (M) and simulated values (S) of soil N O 3 - -N content under border-irrigated (BI) treatment and drip-irrigated (DI) treatment in different depths (10 cm, 20 cm, 40 cm, 60 cm, 80 cm, 100 cm) during 2014–2017, respectively. Figure (A) represents BI; figure (B) represents DI.
Agronomy 10 01890 g003
Figure 4. Comparison of measured values (M) and simulated values (S) of crop yield (Wso) and total dry matter (Wtotal) under border-irrigated treatment (BI) and drip-irrigated treatment (DI) during 2014–2017, respectively.
Agronomy 10 01890 g004
Figure 5. The relationship between measured and simulated soil water content (SWC), evapotranspiration (ET), soil N O 3 - -N content (N), and total dry matter (Wtotal) under film-mulching border irrigation (BI) treatment and film-mulching drip irrigation (DI) treatment during 2014–2017.
Agronomy 10 01890 g005
Table 1. The irrigation regime. IA is the irrigation amount; BI represents border irrigation; DI represents drip irrigation.
TreatmentBIDITreatmentBIDI
YearDate IA (mm)Date IA (mm)YearDate IA (mm)Date IA (mm)
20146/9906/65020164/19 4/2451
6/30906/23506/19 6/1045
7/19 6/28506/201206/2550
7/20907/7507/111207/355
8/23907/18508/11207/1565
7/28508/221207/2754
8/2250 8/754
8/2253
20155/3 6/15020175/81004/2335
5/30 6/13506/20 6/1468
5/311106/26506/231006/2565
7/11107/10507/6 7/1062
7/221107/24507/91007/2257
8/111108/7507/211008/854
9/71108/20508/161008/2227
8/31509/7100
Table 2. Field observation items.
Observation DataInstrumentSampling IntervalSensors/ManufacturerPeriod
Meteorological DataMeteorological Station5 sH21001/Onset Computer Corp., MA, USA2014–2017
Soil water content (SWC)CS616 probes30 minCS616/Campbell Scientific, Inc., USA
Evapotranspiration (ET)Eddy covariance system30 minEC150/Campbell Scientific, Inc., USA
Irrigation amountwater meter rotating vane type/China
Total dry matterelectronic balance7–10d/Mettler Toledo, China
Soil N O 3 - -N contentAutoAnalyzer37–10d/Bran + Luebbe, SEAL Analytical GmbH, Germany
Table 3. Soil hydraulic parameters of simulating region in different soil depths. Saturated hydraulic conductivity (Ks) and saturated water content (θs) were measured in the field, while α, n and θr were predicted through a neural network. In the table, θr represents the residual moisture content, while θs the saturated moisture content, α the empirical parameter, n the porous medium parameter, Ks the saturated hydraulic conductivity, l the pore correlation parameter.
SiteDepth (cm)Ks (cm Day−1)θs (cm3 cm−3)θr (cm3 cm−3)αnl
Site A−2021.160.280.030.0111.470.5
−4015.320.380.040.0091.500.5
−6031.270.390.040.0051.680.5
−8018.080.410.040.0081.640.5
−10015.070.420.040.0071.670.5
Site B−2022.100.370.05 0.0071.470.5
−4027.320.470.17 0.0061.50 0.5
−6028.720.480.18 0.0051.680.5
−8023.340.460.10 0.0051.640.5
−10019.320.490.13 0.0051.670.5
Site C−2018.060.36 0.050.0111.470.5
−4016.340.34 0.050.0101.500.5
−6020.540.44 0.060.0041.680.5
−8011.280.45 0.090.0061.640.5
−10011.770.46 0.080.0041.670.5
Table 4. Soil texture of experimental sites.
Site Depth(cm)Particle Size Distribution (%) Soil TextureDry Bulk Density(g cm−3)
Sand
>0.05 mm
Silt
0.05–0.002 mm
Clay
<0.002 mm
Site A2030.8158.6710.52silty loam1.65
4019.4368.2512.32silty loam1.70
6013.2270.5816.20silty loam1.29
8010.3874.8714.75silty loam1.49
10011.8176.5311.66silty loam1.46
Site B2030.5958.0211.40silty loam1.57
4020.6266.7512.64silty loam1.58
6022.2064.5213.28silty loam1.53
8012.0076.6211.38silty loam1.54
1008.9480.0810.99silt1.48
Site C2027.2262.0210.77silty loam1.63
4035.2257.397.39silty loam1.57
6020.0268.9311.06silty loam1.41
807.1581.2511.60silt1.43
10011.0979.129.80silty loam1.69
Table 5. Crop parameters used in water, heat, carbon and nitrogen simulator (WHCNS) model.
ParametersDescriptionValue
Default/MeasuredCalibrated (BI/DI)
TbaseBase temperature (°C)83
TsumAccumulated temperature (°C)16002350/2150
KiniCrop coefficient in initial stage0.721.00
KmidCrop coefficient in middle stage1.291.45
KendCrop coefficient in end stage1.031.10
KeExtinction coefficient0.60.6
SLA minThe maximum specific leaf area (m2 kg1)1412
SLA maxThe minimum specific leaf area (m2 kg−1)54
R maxMaximum root depth (cm)150100
Table 6. Statistical indices: RMSE (root mean square error), IA (index of agreement) and MBE (mean bias error) for predicted SWC (soil water contents) and SNC (soil N O 3 - -N content) at different depths and ET (evapotranspiration) under film mulching border irrigation (BI) and film mulching drip irrigation (DI).
TreatmentsYear/Layer (cm)SWCSNCET
(cm3 cm−3)(mg kg−1)(mm)
RMSEIAMBERMSEIAMBERMSEIAMBE
BI20140.020.870.00115.420.914.231.340.86−0.05
20150.020.84010.620.893.71.640.78−0.46
20160.020.85011.070.84.021.170.92−0.07
20170.020.83−0.00214.520.676.471.130.93−0.35
Average0.020.85012.910.824.611.320.87−0.23
200.020.870.00115.420.914.23
400.020.84010.620.893.7
600.020.85011.070.84.02
800.020.83−0.00214.520.676.47
1000.020.84−0.00110.190.872.13
Average0.020.85−0.00112.360.834.11
DI20140.020.74−0.00816.50.82−7.250.880.920.21
20150.030.67−0.01511.540.823.350.870.92−0.11
20160.020.72−0.00213.670.785.241.520.87−0.3
20170.020.72−0.00811.820.81−0.21.640.86−0.25
Average0.020.71−0.00813.380.80.281.230.89−0.11
200.020.74−0.00816.50.82−7.25
400.030.67−0.01511.540.823.35
600.020.72−0.00213.670.785.24
800.020.72−0.00811.820.81−0.2
1000.030.78−0.0179.000.890.64
Average0.020.73−0.0112.510.820.36
Table 7. Water budgets and water use efficiencies (WUE) in a 1 m depth soil profile during 2014–2017 under two treatments. In the table, ΔW (mm) represents the variation of soil water storage for 0–100 cm, while P the precipitation (mm), I the irrigation (mm), ET the evapotranspiration (mm), D the water drainage (mm).
TreatmentYearPeriodDaysP (mm)I (mm)∆W (mm)ET (mm)D (mm)Balance (mm)Yield (kg ha−1)WUE (ET/Yield)
BI20144.25–9.20149201360−42486112569941.4
DI20144.27–9.07134195350346872313,7512.9
BI20154.15–9.1615515155055431282410,8152.0
DI20154.26–9.04132119400−1350028413,0342.6
BI20164.20–9.20153119480−45506139−114,6342.9
DI20164.20–9.10144115427−11463692115,8073.4
BI20174.27–9.20147133570655251021012,0962.3
DI20174.22–9.101421343684145042−3110,3332.2
BIAverage2014–2017151151490−45151201011,1352.2
DIAverage2014–2017138141386547053−113,2312.8
Table 8. Nitrogen budgets and nitrogen-use efficiencies (NUE) during 2014–2017 under the two treatments. F: N fertilizer; Nnet: net mineralization; NH3: ammonia volatilization; Nden: N denitrification; Nup: crop N uptake; Nle: nitrate leaching; Balance = F + Nnet- NH3- Nden- Nup- Nle; NUE = grain yield/(NH3 + Nden + Nup + Nle).
TreatmentYearF
(kg N ha−1)
Nnet
(kg N ha−1)
NH3
(kg N ha−1)
Nden
(kg N ha−1)
Nup
(kg N ha−1)
Nle
(kg N ha−1)
Balance
(kg N ha−1)
Yield
(kg ha−1)
NUE
BI201422451330.4 15497−10699424.6
DI201420560310.8 23054−5113,75143.5
BI201523568181.6185186−8810,81527.7
DI201519742111.022567−6513,03442.9
BI201637866281.62461452414,63434.8
DI201636456210.3314503415,80741.0
BI201735653620.4224135−1212,09628.7
DI201734252290.3266118810,33333.8
BIAverage29860351.0202141−2211,13529.0
DIAverage27753230.625946213,23140.3
Publisher’s Note: MDPI stays neutral with regard to jurisdictional claims in published maps and institutional affiliations.

