Article

Nitrogen Fertilization Management with Blends of Controlled-Release and Conventional Urea Affects Common Bean Growth and Yield during Mild Winters in Brazil

by
Pedro Lopes Garcia
1,*,
Renata Alcarde Sermarini
2 and
Paulo Cesar Ocheuze Trivelin
1
1
Stable Isotopes Laboratory, Center for Nuclear Energy in Agriculture (CENA), University of São Paulo (USP), Piracicaba 13416-000, São Paulo, Brazil
2
Exact Sciences Department, “Luiz de Queiroz” College of Agriculture (ESALQ), University of São Paulo (USP), Piracicaba 13418-900, São Paulo, Brazil
*
Author to whom correspondence should be addressed.
Submission received: 8 October 2020 / Revised: 18 November 2020 / Accepted: 23 November 2020 / Published: 9 December 2020

Abstract

:
The common bean (Phaseolus vulgaris L.) requires nitrogen (N) during its vegetative and reproductive stages. A single application of a blend of polymer-sulfur coated urea (PSCU) and conventional urea (U) treated with NBPT (N-(n-butyl) thiophosphoric triamide) can meet that demand. Broadcast application could improve yield than other N management practices. This research evaluated two blends (70%PSCU + 30%U and 30%PSCU + 70%U) and three N fertilization managements (incorporated, broadcast, and split application) on soil ammonia volatilization (AV) and N mineral content (NM); plant N uptake (NU) and 15N recovery from U (NUR); and yield (GY). Irrigated field experiments were conducted in 2018 and 2019 in Rhodic Eutrustox soil. The N application rate was 90 kg ha−1. AV reached 12% (30%PSCU + 70%U, broadcast application) and 14% of the applied N (split application at the third trifoliate leaf unfolded stage (V4)). The incorporated application resulted in higher NM in the vegetative and reproductive stages than the other management practices. Broadcast application resulted in higher NU than split application at physiological maturity. Split application resulted in higher NUR (grain) and GY than broadcast application. There was a positive correlation between NUR (grain) and GY in all N fertilization management treatments. The NUR values reached 48% (30%PSCU + 70%U) and 18% (70%PSCU + 30%U). Split N application using these blends can improve NUR in grain and GY compared to broadcast application in Rhodic Eutrustox soil. This information can help farmers improve the fertilization management practices used with these blends, and thereby avoid economic losses and environmental pollution.

1. Introduction

The common bean is a legume cultivated in three growing seasons per year in Brazil, the world’s largest consumer and producer of the common bean (3.3 million tons) [1]. The first growing season of common bean in Brazil occurs between July and October, the second occurs between January and March, and the third occurs between April and July. The average common bean yield in Brazil is 1100 kg ha−1 and reaches 1800, 850, and 2511 kg ha−1 in the first, second and third growing seasons in São Paulo state, respectively [1]. The difference in yield between the first and second growing seasons is related especially to climatic conditions (high temperatures and hydric stress) and is associated with low soil fertility, soil acidity, pests and diseases, and low technology use by farmers [2]. The third growing season, which occurs during the mild winters, emerged in Brazil simultaneously with center-pivot irrigation systems [3]. These systems prompted farmers to invest in irrigation to cultivate crops during this period, in which almost no rain falls. The third season produces higher yields than the first and second season due to irrigation, as well as fertilization and pest and disease control.
The common bean is a legume, but the symbiotic bacterial association (Rhizobium leguminosarum bv. phaseoli) with its roots provides low-efficiency biological nitrogen (N) fixation [4], and N fertilizer application is recommended to meet its N demand in most cases. N is the most limiting nutrient for common bean yield [2], and conventional urea (U) is the main N source because of its high N concentration and low price compared to other N sources [5]. However, N fertilizer recovery from U application in common bean can be lower than 50% [2], resulting in ammonia volatilization losses [6] when U is applied on the soil surface, nitrate leaching [7] and denitrification [8]. N immobilization [9] must also be considered, especially under current crop system management practices in which the straw of the previous crop is left on the soil surface. Thus, N fertilization management using U in common bean is a challenge for the current cropping systems, and split U application is necessary aiming to supply N in early growth [10], before flowering [11], and during flowering and grain filling [12].
Controlled-release U (CRU) provides an alternative to split U application in the common bean due to the gradual N release provided by the micropores of its polymers [13]. CRU is more expensive than U, and although CRU provides a reduction in ammonia volatilization losses [14], nitrate leaching [15], and denitrification [16], it can result in low N availability after application [17], compromising common bean growth [12].
Blending CRU and U could be an alternative for supplying N during early growth and throughout the common bean growth cycle. U (the soluble source) would be readily available at the beginning of the common bean growth cycle, and if it were treated with NBPT (N-(n-butyl) thiophosphoric triamide), ammonia volatilization losses in the first days of U application on the soil surface would be reduced [6,18], thereby improving N recovery from U. CRU (the insoluble source) would supply N after initial growth at high-demand growth stages until the end of the common bean growth cycle, without compromising yield. Moreover, blending CRU and U can decrease the application cost compared with that of using only CRU.
A single application incorporated at sowing using blends of polymer-sulfur coated urea (PSCU), which is a type of CRU [13], and U have proven to be efficient for supplying N in other cropping systems in Brazil [19,20]. There are no studies of a single broadcast application during common bean sowing using these blends. Broadcast application would reduce the costs associated with fertilizer incorporation. The most common proportion of CRU and U in annual crops in North China is 70%CRU + 30%U [21], and this proportion was also recommended for soils from Brazil [19,20,22,23]. 30%CRU + 70%U was also recommended in Northeast China [24,25] and it represents a potential way to avoid low N levels due to N immobilization, especially at the beginning of the common bean growth cycle, in the current crop system in Brazil, in which the straw from the previous crop is left on the soil surface.
In this context, our hypothesis is that N broadcast application using 70%PSCU and 30%U will be a better choice to provide N during the common bean growth cycle and to improve grain yield than incorporated or split application using 70%PSCU and 30%U or 30%PSCU and 70%U. The N recovery from the U sources treated with NBPT would be higher than 50% in both blends. This research evaluated the effect of N fertilization practices and blends of PSCU and U (treated with NBPT) on ammonia volatilization, soil mineral N content, N uptake, 15N-fertilizer recovery from U (NUR) in plants and common bean yield in irrigated field experiments with straw on the soil surface during the mild winters in Brazil.

2. Materials and Methods

2.1. Field Site Description

Two irrigated field experiments were performed at Compass Minerals Innovation Center in Iracemápolis, São Paulo state, Brazil (22°39′ S, 47°30′ W, 608 m elevation) during 2018 and 2019 mild winter growing seasons. The soil of the experimental area is classified as a Rhodic Eutrustox soil [26] with a clayey texture: 41.9% sand, 11.9% silt, and 46.2% clay [27]. Millet was the previous crop in 2018, and 4.2 ± 0.3 Mg ha−1 of straw with a 22:1 C/N ratio was left on the soil. Oat was the previous crop in 2019, and 3.5 ± 0.2 Mg ha−1 of straw with a 31:1 C/N ratio was left on the soil. Three samples of one square meter of straw per block were weighed and subsamples were oven-dried (65 °C) and ground with a Wiley mill (0.5-mm sieve) to quantify the straw and analyze its N and C contents [28]. Limestone application, plowing, and harrowing were performed in 2019 before oat sowing. The three-year average temperature and precipitation were 21.8 °C and 1200 mm, respectively.
Fifteen soil samples at intervals 20 cm in the soil (0 to 60 cm depth) were performed for chemical characterization in both years prior to the beginning of the experiment (Table 1).
The samples from each soil layer were mixed for analysis. To determine the soil pH 0.01 mol L−1 CaCl2 [29] (1:2.5 soil/solution) was used. The Walkley–Black procedure [30] was used to determine the soil organic matter. Mass spectrometry [31] was used to determine the total N content. A solution of 2 mol L−1 KCl [29] (1:5 soil/solution ratio) was used to determine the NH4+-N and NO3-N contents. The available nutrients (phosphorus (P), potassium (K), calcium (Ca), and magnesium (Mg)) were extracted by ion exchange and quantified by colorimetric (P), flame photometric (K), and atomic absorption spectroscopy (Ca and Mg) analyses. Al and SO4−2-S were determined by titration and turbidimetry, respectively [29]. To determine the cation exchange capacity (CEC), the exchangeable cations (Ca, Mg and K) were summed by potential acidity (H + Al). The base saturation (%) was determined by dividing the total exchangeable cations by CEC and multiplying by 100. To determine the Al saturation (%), the Al was multiplied by 100 and divided by (Ca + Mg + K + Al).

2.2. Experimental Setup and Treatment Description

The experiments were performed in a factorial (2 × 3) + 1 randomized block design with 4 replications. The treatments consisted of two blends (70%PSCU + 30%U and 30%PSCU + 70%U) and three N fertilization management practices (broadcast application: a single topdressing N application at sowing; split application: 1/3 of N incorporated at sowing and 2/3 as a side-dressing at V4 (third trifoliate leaf unfolded); incorporated application: a single N application incorporated at sowing). A control treatment (without U) was included. The N rate used was 90 kg ha−1, which would be expected to produce common bean yields between 2.5 and 3.5 Mg ha−1 in São Paulo, Brazil [32]. The incorporation of N fertilizer was 15 cm depth and 10 cm to the side of seed row, and all N treatments were applied by hand. The U (45% N) fertilizer was treated with NBPT (530 mg NBPT kg−1). The manufacturer of PSCU (patent n. EP 0574541), which is 39%N and 12%S, suggests that ~80% of the N is released within 60 days after application [33] considering that it contains 0.78% of polymers that are biodegradable and insoluble in water. The 15N-enriched U with 1.6 atom % 15N was manufactured at Stable Isotopes Laboratory at CENA/USP [34] and treated with NBPT as mentioned above to evaluate the 15N recovery of U by plants in 2019. The experimental plot had 10 common bean rows of 10 m in length with 0.45-m spacing and a density of 244,000 plants ha−1. One microplot (2 m2: 1.5 m long and 1.35 m wide) that included 3 sections of 1.5 m of common bean row was set up within the plots to apply the 15N-fertilizer (PSCU + 15N-U).
The common bean cultivar (Pérola: carioca-grain group) was sown on 7 June 2018. Pérola is the most common bean cultivated in the mild winter season in Brazil [1], and it has a semi-upright architecture and indeterminate growth habit (between type II and III, [35]). BRS Estilo, which is also a cultivar of the carioca-grain group, was sown on 10 June 2019. BRS Estilo has an upright architecture and indeterminate growth habit (type II, [36]), and it was chosen to facilitate plant sampling in the microplots in 2019. 80 kg P2O5 ha−1 as triple superphosphate was applied under the seed row at sowing in 2018 and 2019. 40 kg K2O ha−1 as KCl was broadcast-applied at sowing. S0 was applied at sowing in the treatments of 30%PSCU + 70%U and in the control to equalize the S0 contained in the 70%PSCU + 30%U treatments. One-kilogram B ha−1 and 1 kg Zn ha−1 were applied at sowing with the N treatments and with S0 in the control in 2018 and 2019. Insects, diseases and weeds were controlled in both years when needed. Two common bean rows of 5 m long were harvested by hand on 2 October 2018 and on 3 October 2019 to measure yield (13% moisture content).

2.3. Quantification of Ammonia Volatilization

Ammonia (NH3-N) volatilization was evaluated at 34 days after N broadcast application (90 kg N ha−1) and split application (side dressing at V4: 60 kg N ha−1) on the soil surface in 2018. To capture ammonia volatilization, open collectors (14 cm × 14 cm × 7 cm) with a foam disc (15 cm in diameter, 6 cm in height and density of 0.02 g cm−3) soaked in 25 mL of phosphoric acid (1.5 mol L−1 and 5% glycerol) attached to the open side of the collectors were used. The collectors were placed 1 cm above the N-fertilizer application region on the soil surface. The foams discs were replaced at 2, 3, 4, 5, 6, 7, 9, 12, 16, 21, 27, and 34 days after N application. The NH4+-N retained as ammonium phosphate in the sampled foam discs was extracted by squeezing each disc into 300 mL of deionized water in a beaker. After weighing the beaker, an aliquot of each sample solution was analyzed by flow injection analysis (FIA), to determine the NH4+-N [37]. The NH4+-N (mg per collector) was divided by the N-fertilizer applied per collector (broadcast: 176 mg; split (side dressing at V4): 400 mg) to determine the NH3-N volatilization. The efficiency of the collector (26%) capturing ammonia was also considered [38]. The daily losses of NH3-N (kg ha−1 day−1) were determined by dividing the losses by the sample time (day), and the cumulative losses (kg ha−1) were determined by summing the losses from each sample.

2.4. Analyses of Plant and Soil Samples

Plant and soil sampling were performed at the V4, R6 (flowering), R7 (pod formation), R8 (grain filling) and R9 (physiological maturity) [39] stages. Three samples of soil per depth (0–20 cm, 20–40 cm, and 40–60 cm) in each plot, sampled in the N fertilized row, were mixed for analysis. The mineral N content (NO3-N + NH4+-N) was extracted by 2 mol L−1 KCl and determined by FIA (1:5 soil/solution ratio; [29]). The aerial-part samples of eight plants per plot were divided (leaf, stem, pod, and grain), oven-dried at 65 °C to a constant weight, weighed and ground in a Wiley mill using a 0.5-mm sieve. The micro-Kjeldahl method [28] was performed to determine the N concentration in each plant component. The N concentration was multiplied by the dry weight to determine the N uptake (kg ha−1). The maximum rates of dry matter and N accumulation were determined according to Laviola et al. [40] and Garcia et al. [19].

2.5. 15N-Fertilizer Recovery Analyses

The PSCU + 15N-U was applied by hand (incorporated, broadcast and split application) in the microplots in 2019. The 15N-U recovery (NUR) in two plants (aerial parts) sampled in the internal adjacent rows of the microplots was added to the NUR of two plants (aerial parts) in the external adjacent rows to determine the NUR at V4, R6, R7 and R8 [41]. At R9, two plants (aerial parts) were sampled at the center of the microplots to determine the NUR. The plant components (leaf + stem + pod, and grain) were oven-dried at 65 °C to a constant weight, weighed, and ground (0.5-mm sieve). The 15N abundance and total N concentration of the plant components were determined in a mass spectrometer (PDZ Europa ANCA-GLS, 20-20, Sercon Ltd., Crewe, UK). The following equations were used to determine the 15N recovery [41,42]:
Ndff   ( % ) = ( a c b c   ) ×   100
Ndff   ( kg   ha 1 ) = [ Ndff   ( % ) 100 ] ×   Total   N
Nrecovery 15   ( % ) = [ Ndff   ( kg   ha 1 ) N   rate ] ×   100
where Ndff (% and kg ha−1) is the N derived from the fertilizer in the plant components; a is the 15N abundance (atom % 15N excess) in the plant components; b is the 15N abundance (atom % 15N excess) in the fertilizer; c is the natural 15N abundance (atom % 15N) in the control treatment. Total N is the plant N content (kg N ha−1). 15N recovery is the N of U treated with NBPT recovered by common bean plant (%). N rate is the N-fertilizer rate in kg N ha−1 that was 90 kg N ha−1.

2.6. Statistical Analyses

The PROC MIXED procedure in SAS (version 9.0, SAS Institute Inc., Cary, NC, USA) was used to perform a combined analysis of variance (ANOVA) for the variables evaluated in 2018 and 2019. Fertilizer blend, N fertilization practice and year were considered fixed effects. The control treatment, included as a new factor, was also compared. The means were compared using Fisher’s least-test difference (LSD) at the 0.05 significance level. Fertilizer blend and N fertilization management were considered fixed effects for the variable 15N-fertilizer recovery, the software R [43], and its ExpDes package were used, and the means were tested by the LSD test (p ≤ 0.05). The seasonal biomass (dry matter) and N partitioning (leaf, stem, pod and grain) during common bean growth were fitted to a Gaussian equation [19]. The N remobilization was estimated by subtracting the total N uptake and 15N recovery (leaf, stem and pod) at R7 from those at R9 based on the N accumulation models.

3. Results

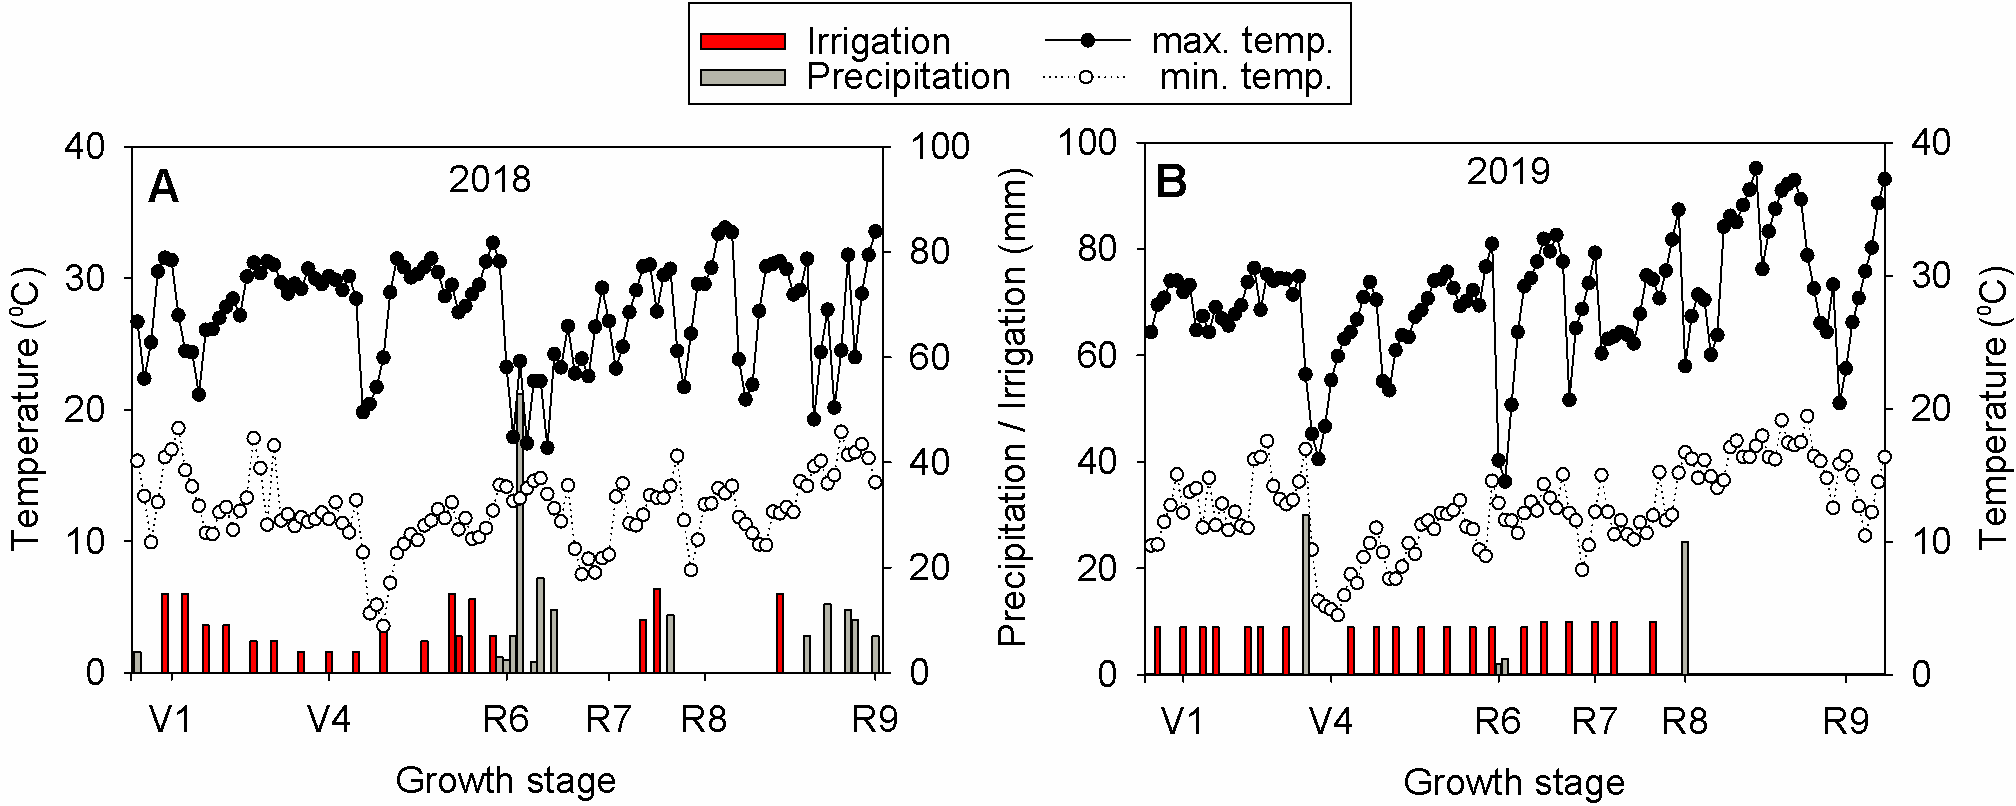
3.1. Weather Conditions

The average daily air temperature was 20 °C during the mild winter common bean growing seasons (Figure 1A,B). The total irrigation was 171 mm, of which 130 mm occurred from sowing to R6, and 41 mm occurred from R6 to R9 in 2018 (Figure 1A). In addition, 3 mm of precipitation occurred after sowing, 109 mm occurred between R6 and R8, and 49 mm occurred between R8 and R9 (Figure 1A). The total irrigation was 194 mm of which 144 mm occurred from sowing to R6, and 50 mm occurred from R6 to R8 in 2019 (Figure 1B). In addition, 30 mm of precipitation occurred between sowing and V4, 5 mm occurred between V4 and R6, and 25 mm occurred between R7 and R8 (Figure 1B).

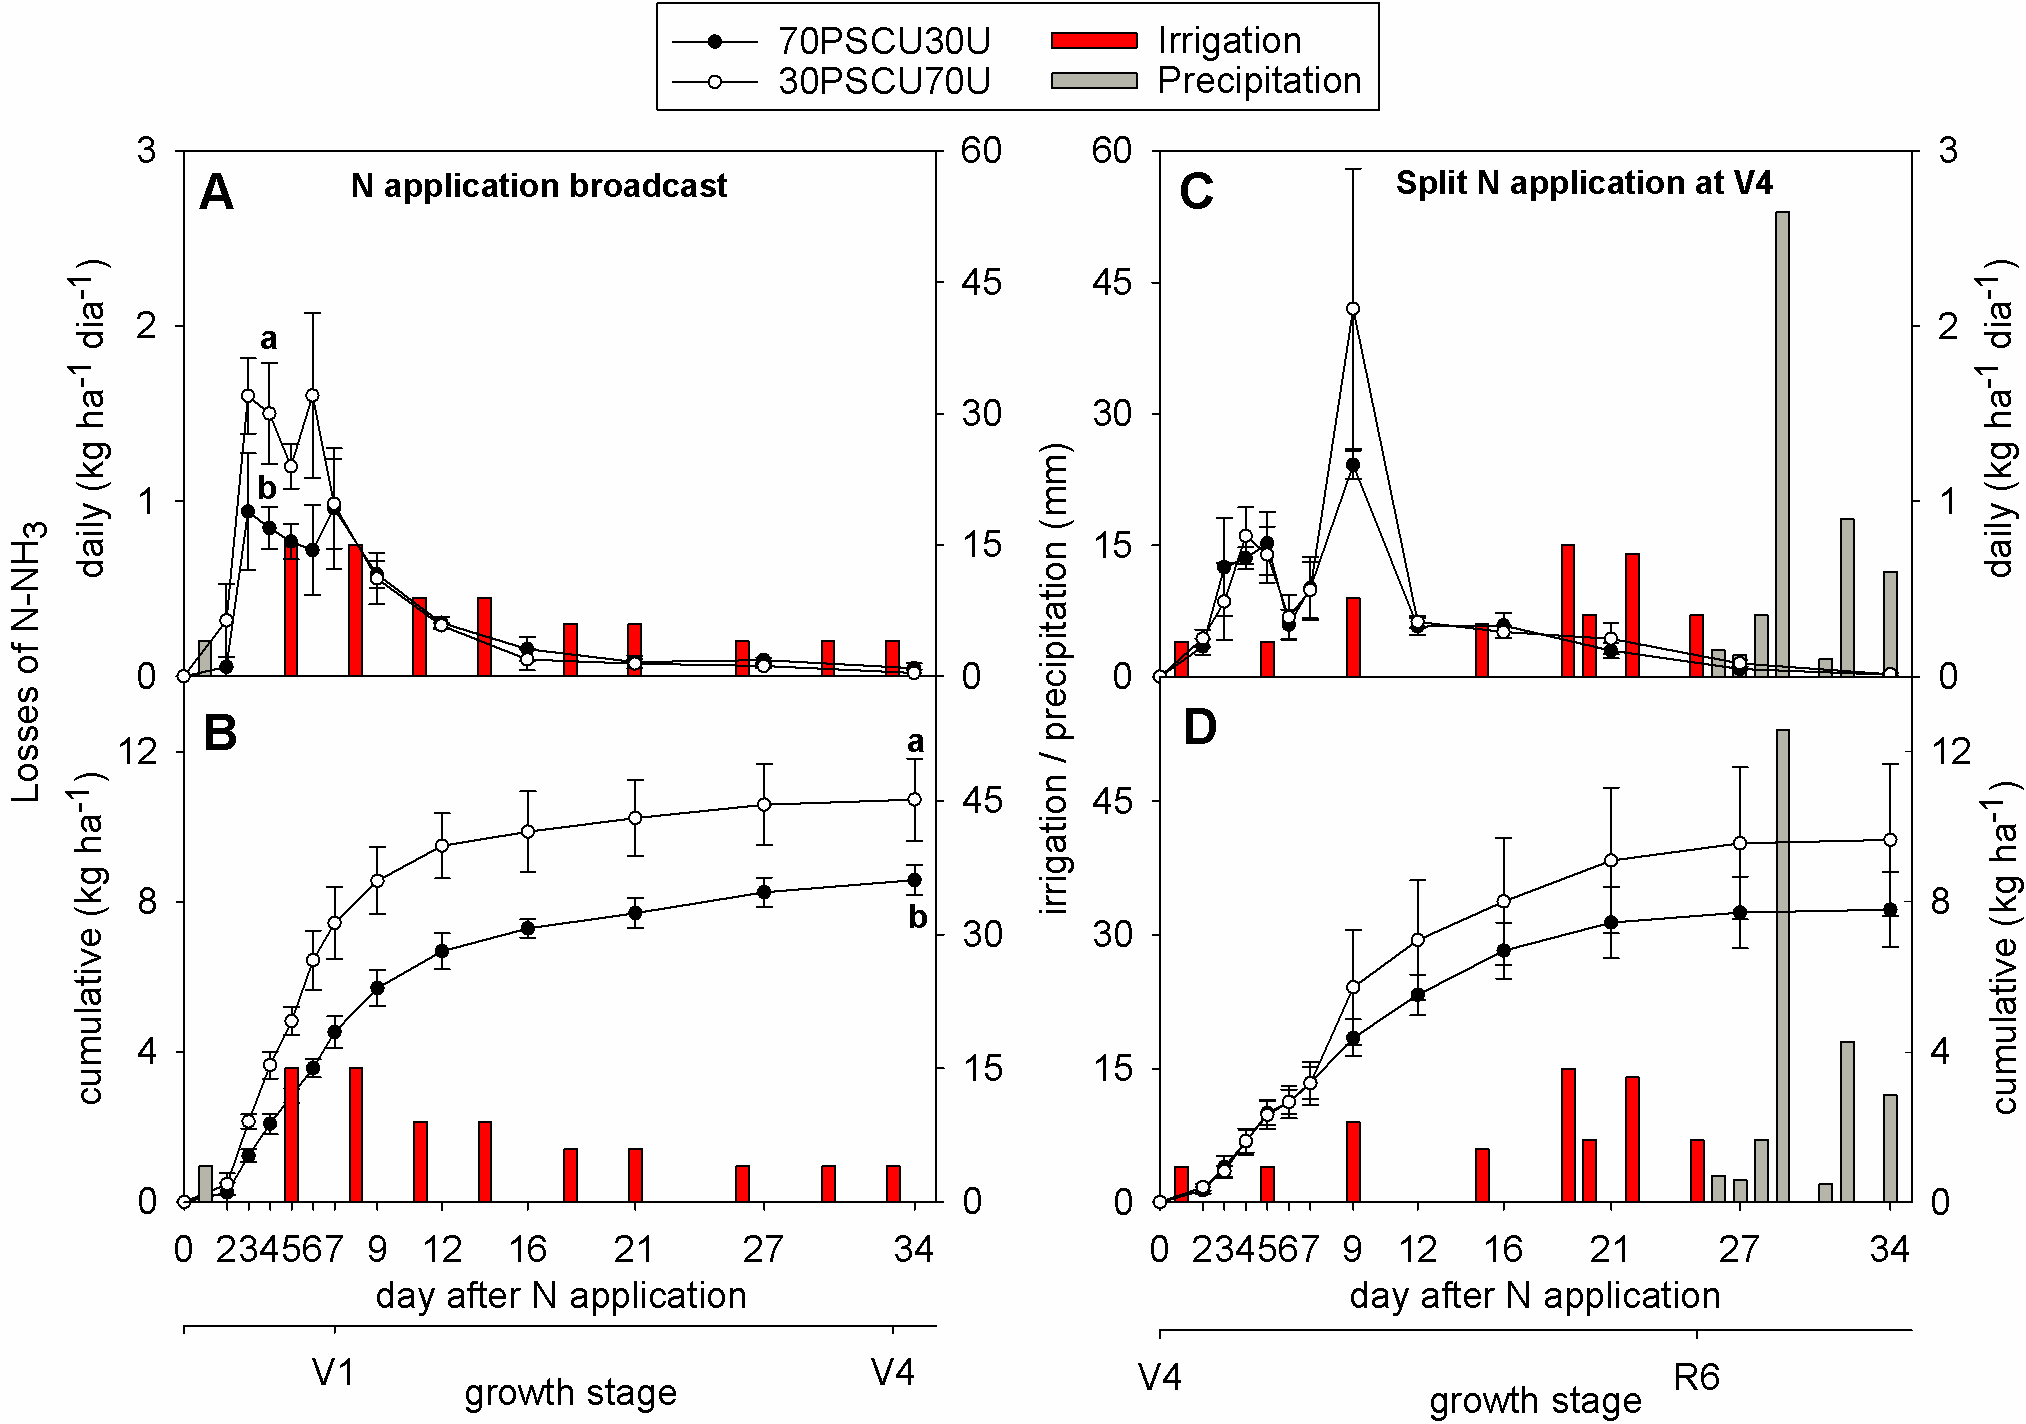
3.2. Ammonia Volatilization

The 30%PSCU + 70%U broadcast application resulted in the maximum daily loss of NH3-N (1.6% of the applied N) on the fourth day after N application and a cumulative loss of 12% of the applied N on the 34th day after N application in 2018. The 70%PSCU + 30%U broadcast application provided lower daily (0.9% of the applied N) and cumulative (9% of the applied N) losses than the 30%PSCU + 70%U treatment (Figure 2A,B). The maximum daily NH3-N loss (2.5% of the applied N) occurred on the ninth day after split N application, and cumulative losses of 14% of the applied N were determined on the 34th day (at V4) for both blends (Figure 2C,D).

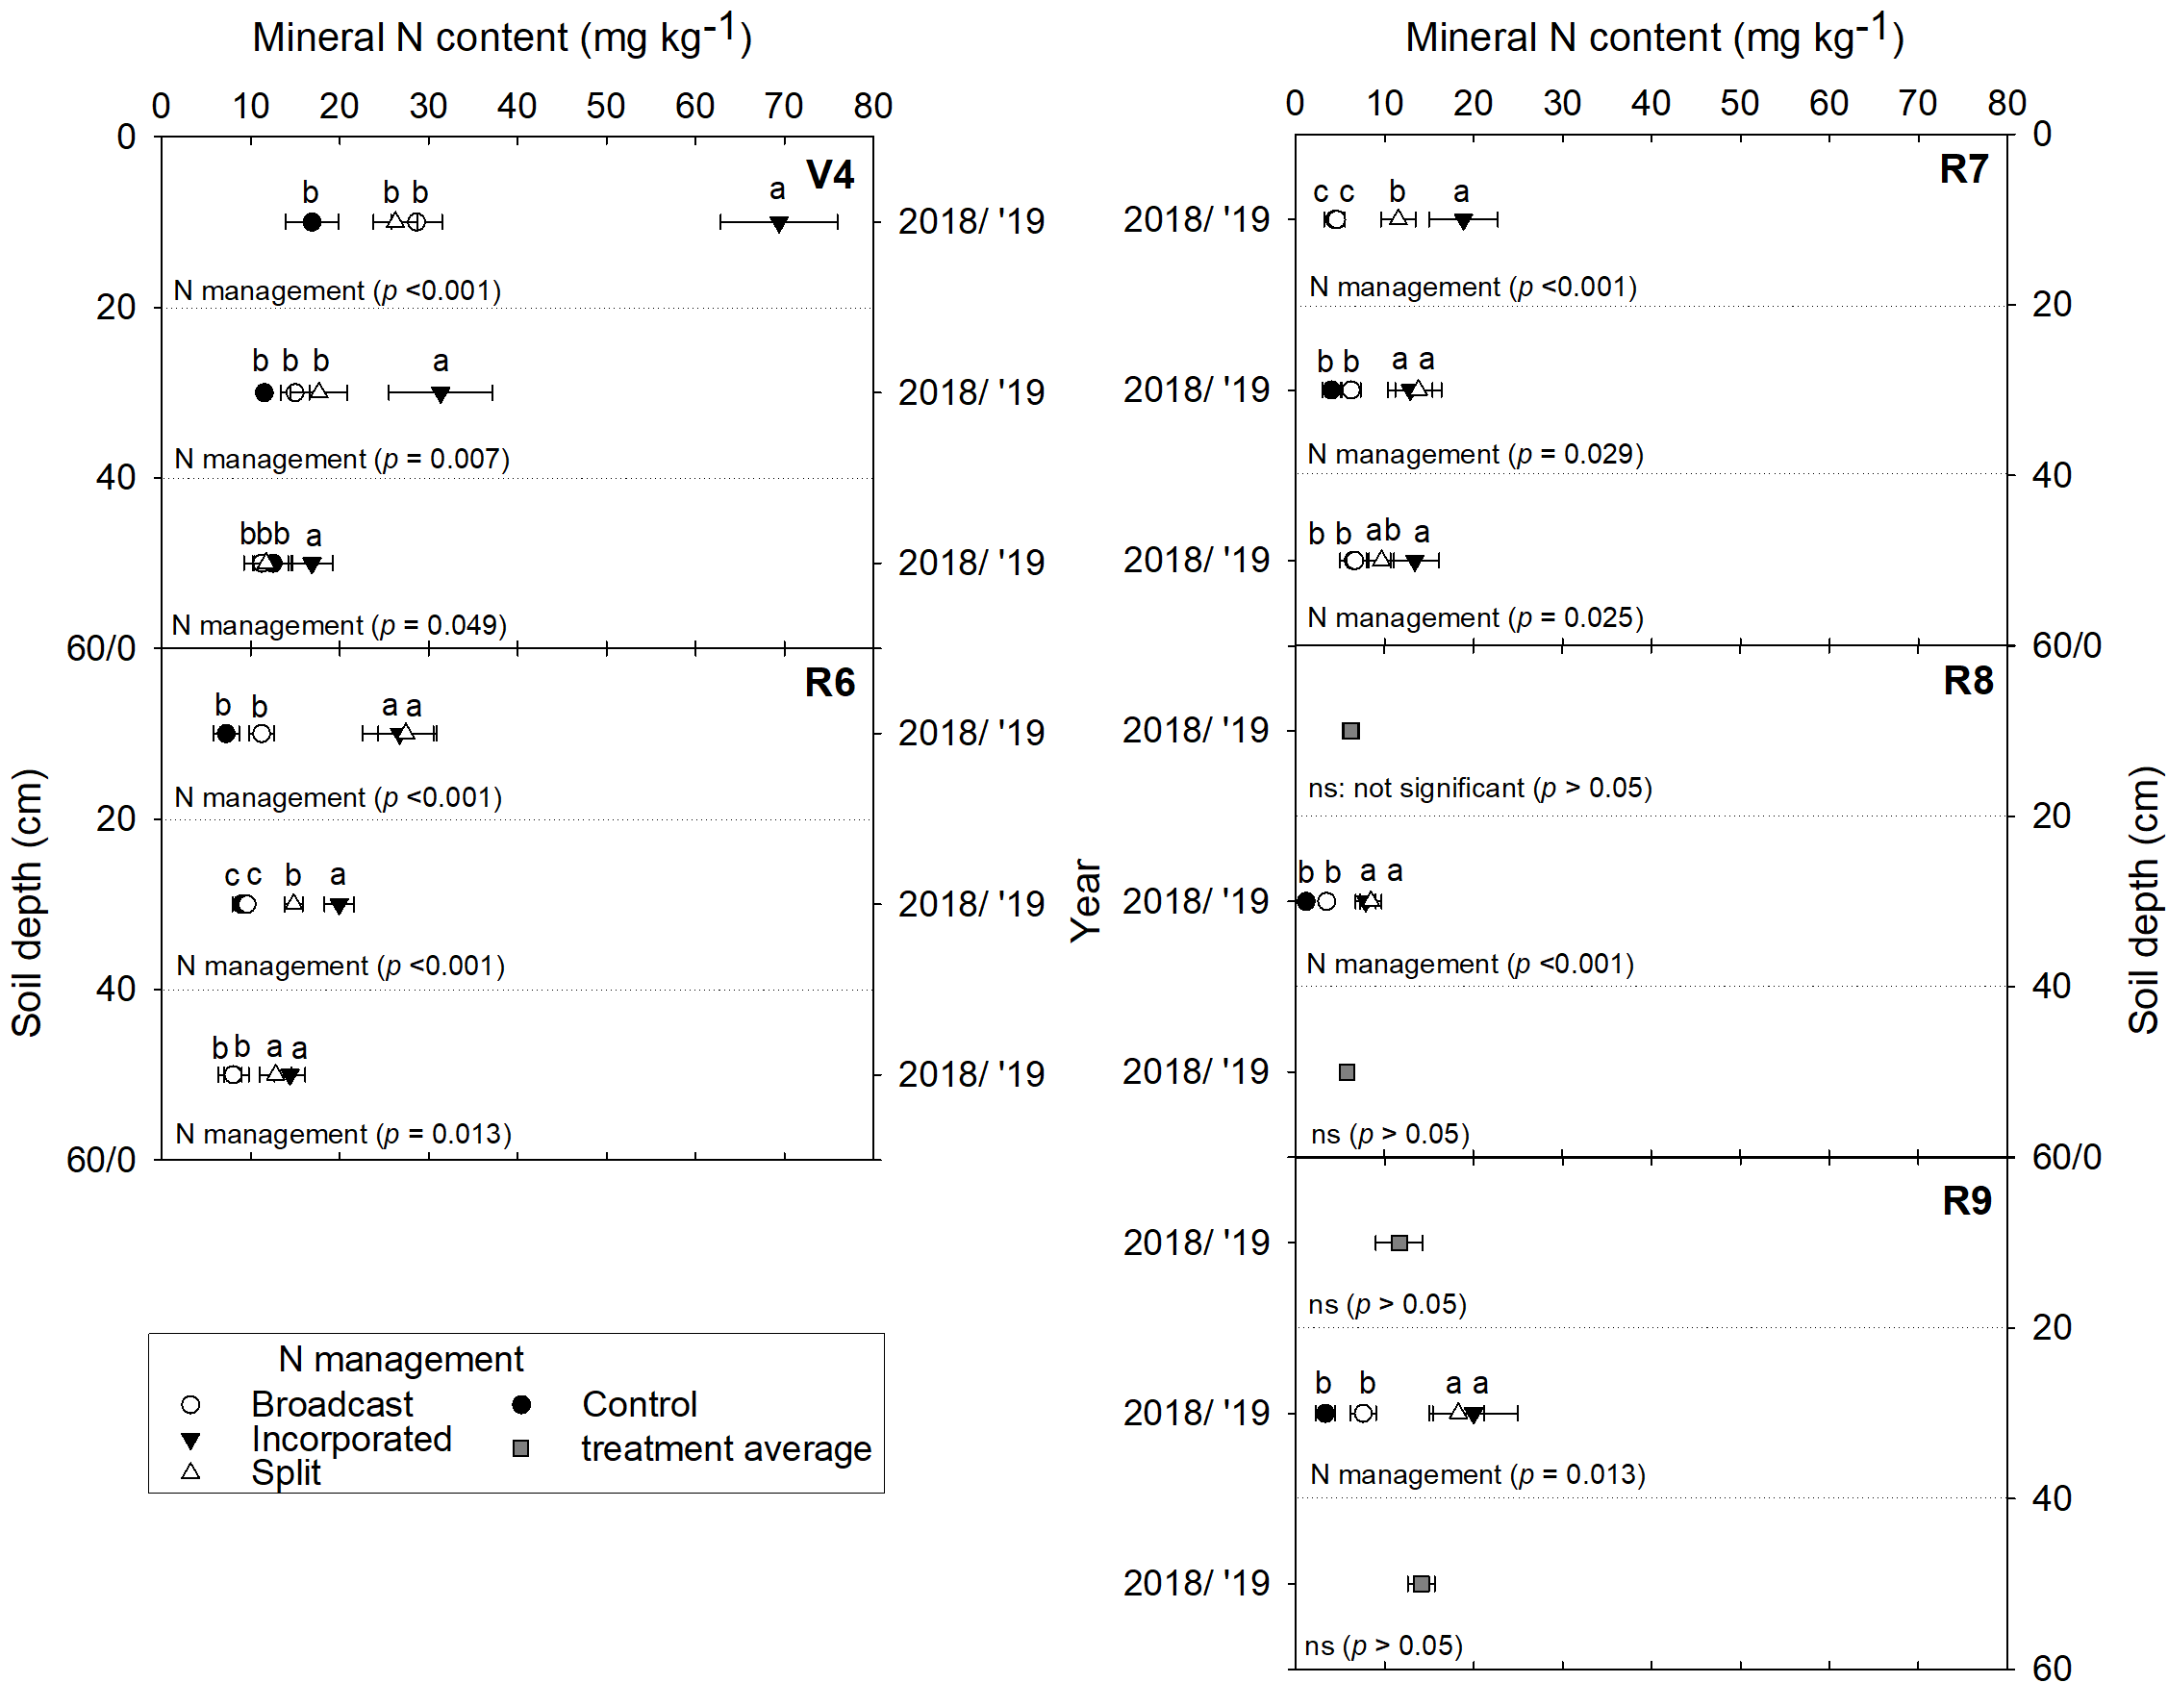
3.3. Mineral N Content in the Soil

The N fertilization management practice affected the mineral N content during the common bean growth cycle in 2018 and 2019 (Figure 3). At V4, the incorporated N application resulted in higher mineral N content than the other N fertilization management practices at depths of 0–20, 20–40, and 40–60 cm. At R6, incorporated and split N applications resulted in higher mineral N content than broadcast application at 0–20 and 40–60 cm depth, and incorporated application resulted in higher mineral N content than the other N fertilization management practices at 20–40 cm depth. At R7, incorporation resulted in a higher mineral N content than the other N management practices and broadcast application at 0–20 cm depth and 40–60 cm depth, respectively. Incorporated and split N applications resulted in higher mineral N content than broadcast application at 20–40 cm depth at R7, R8, and R9.

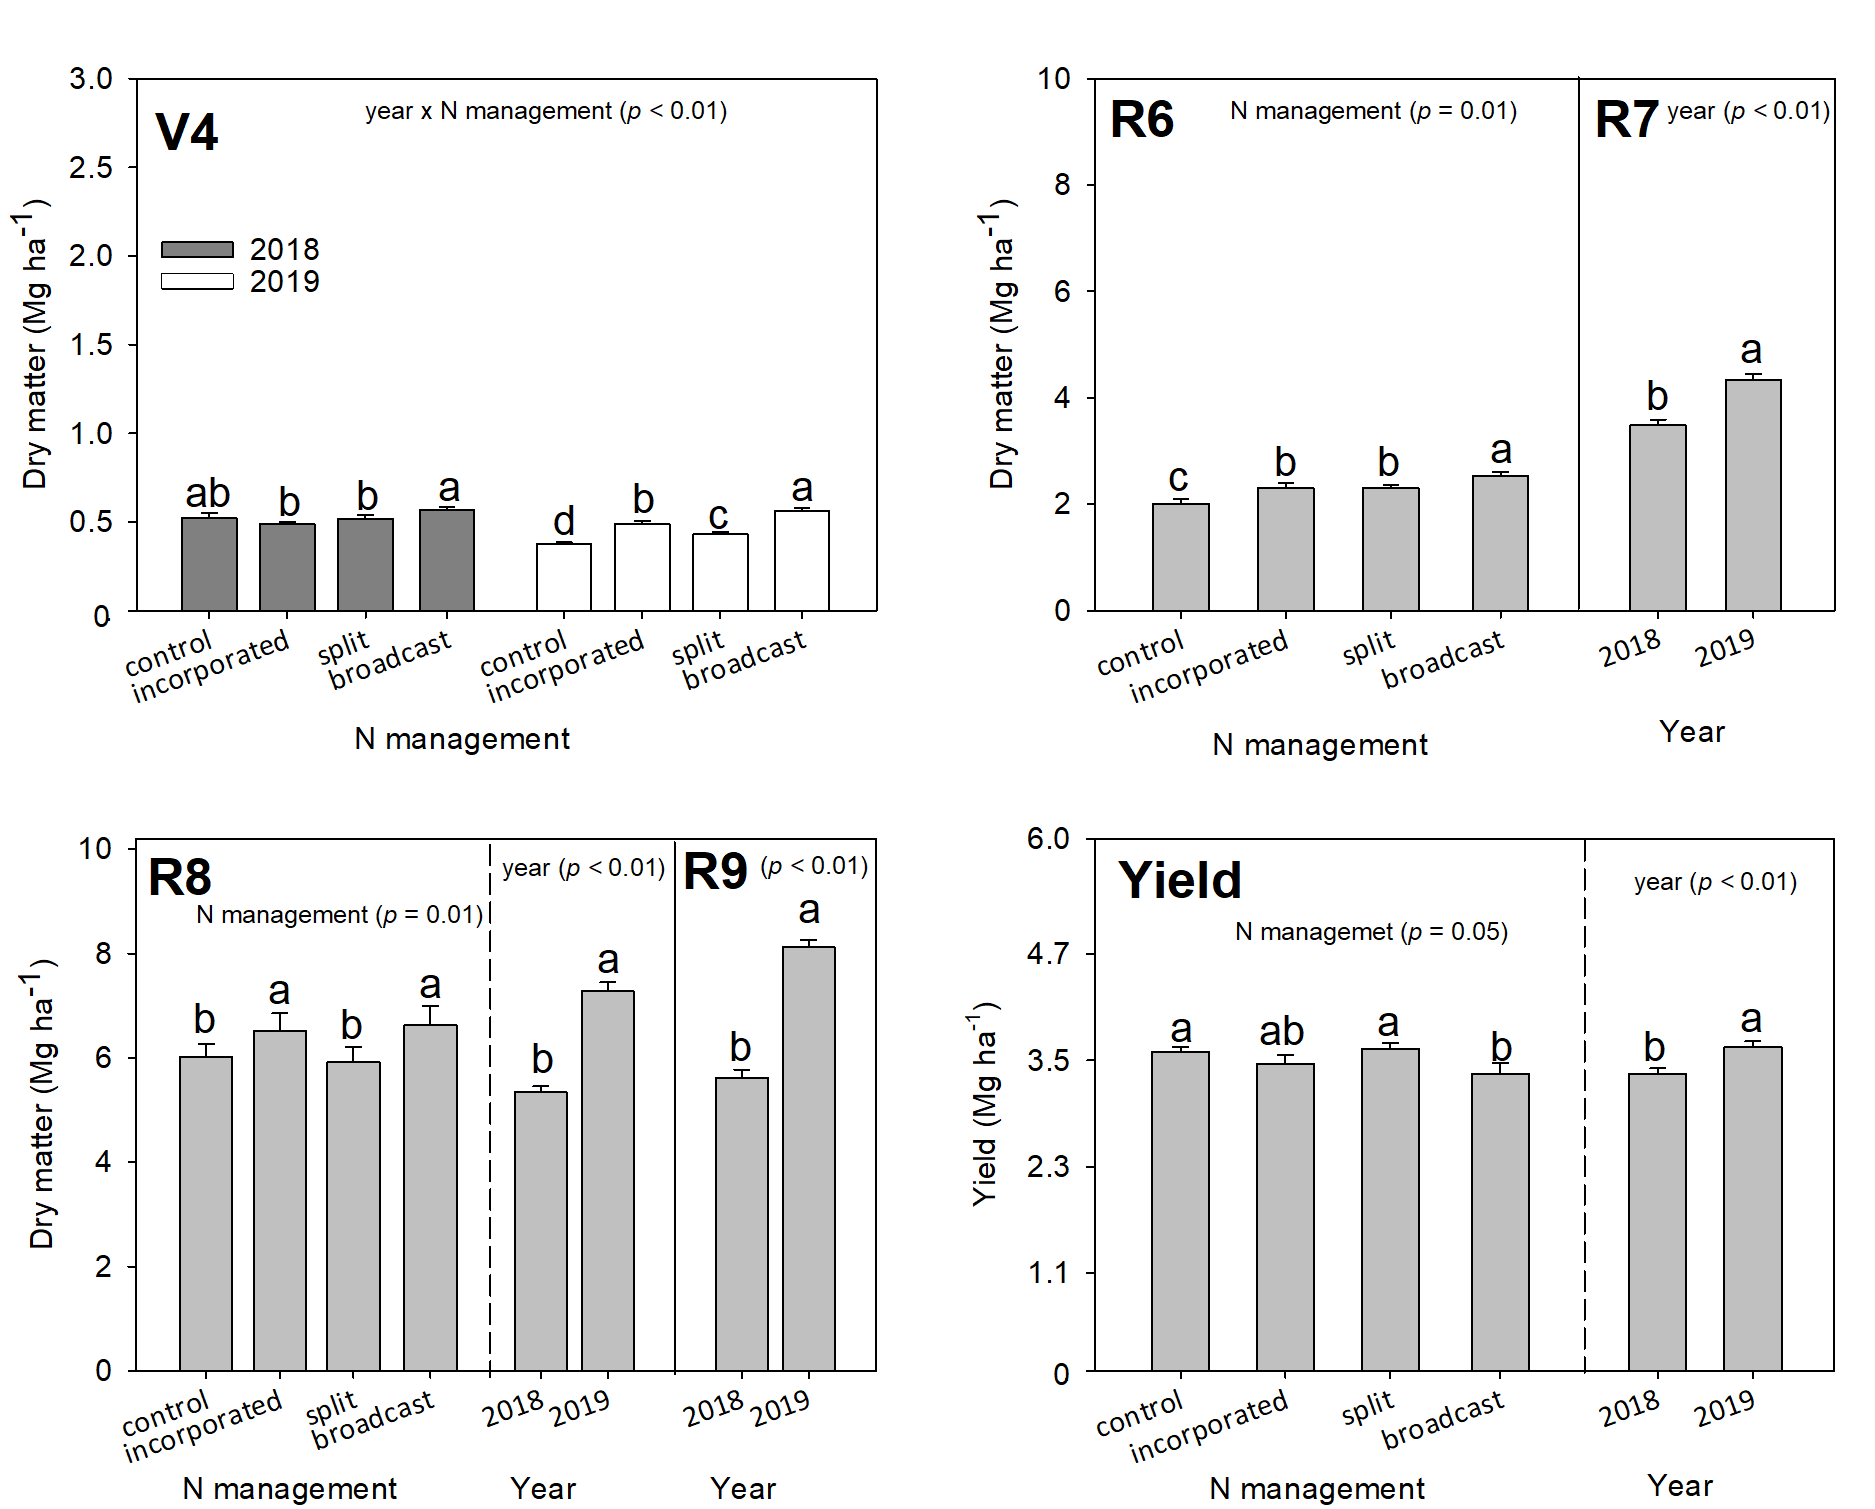
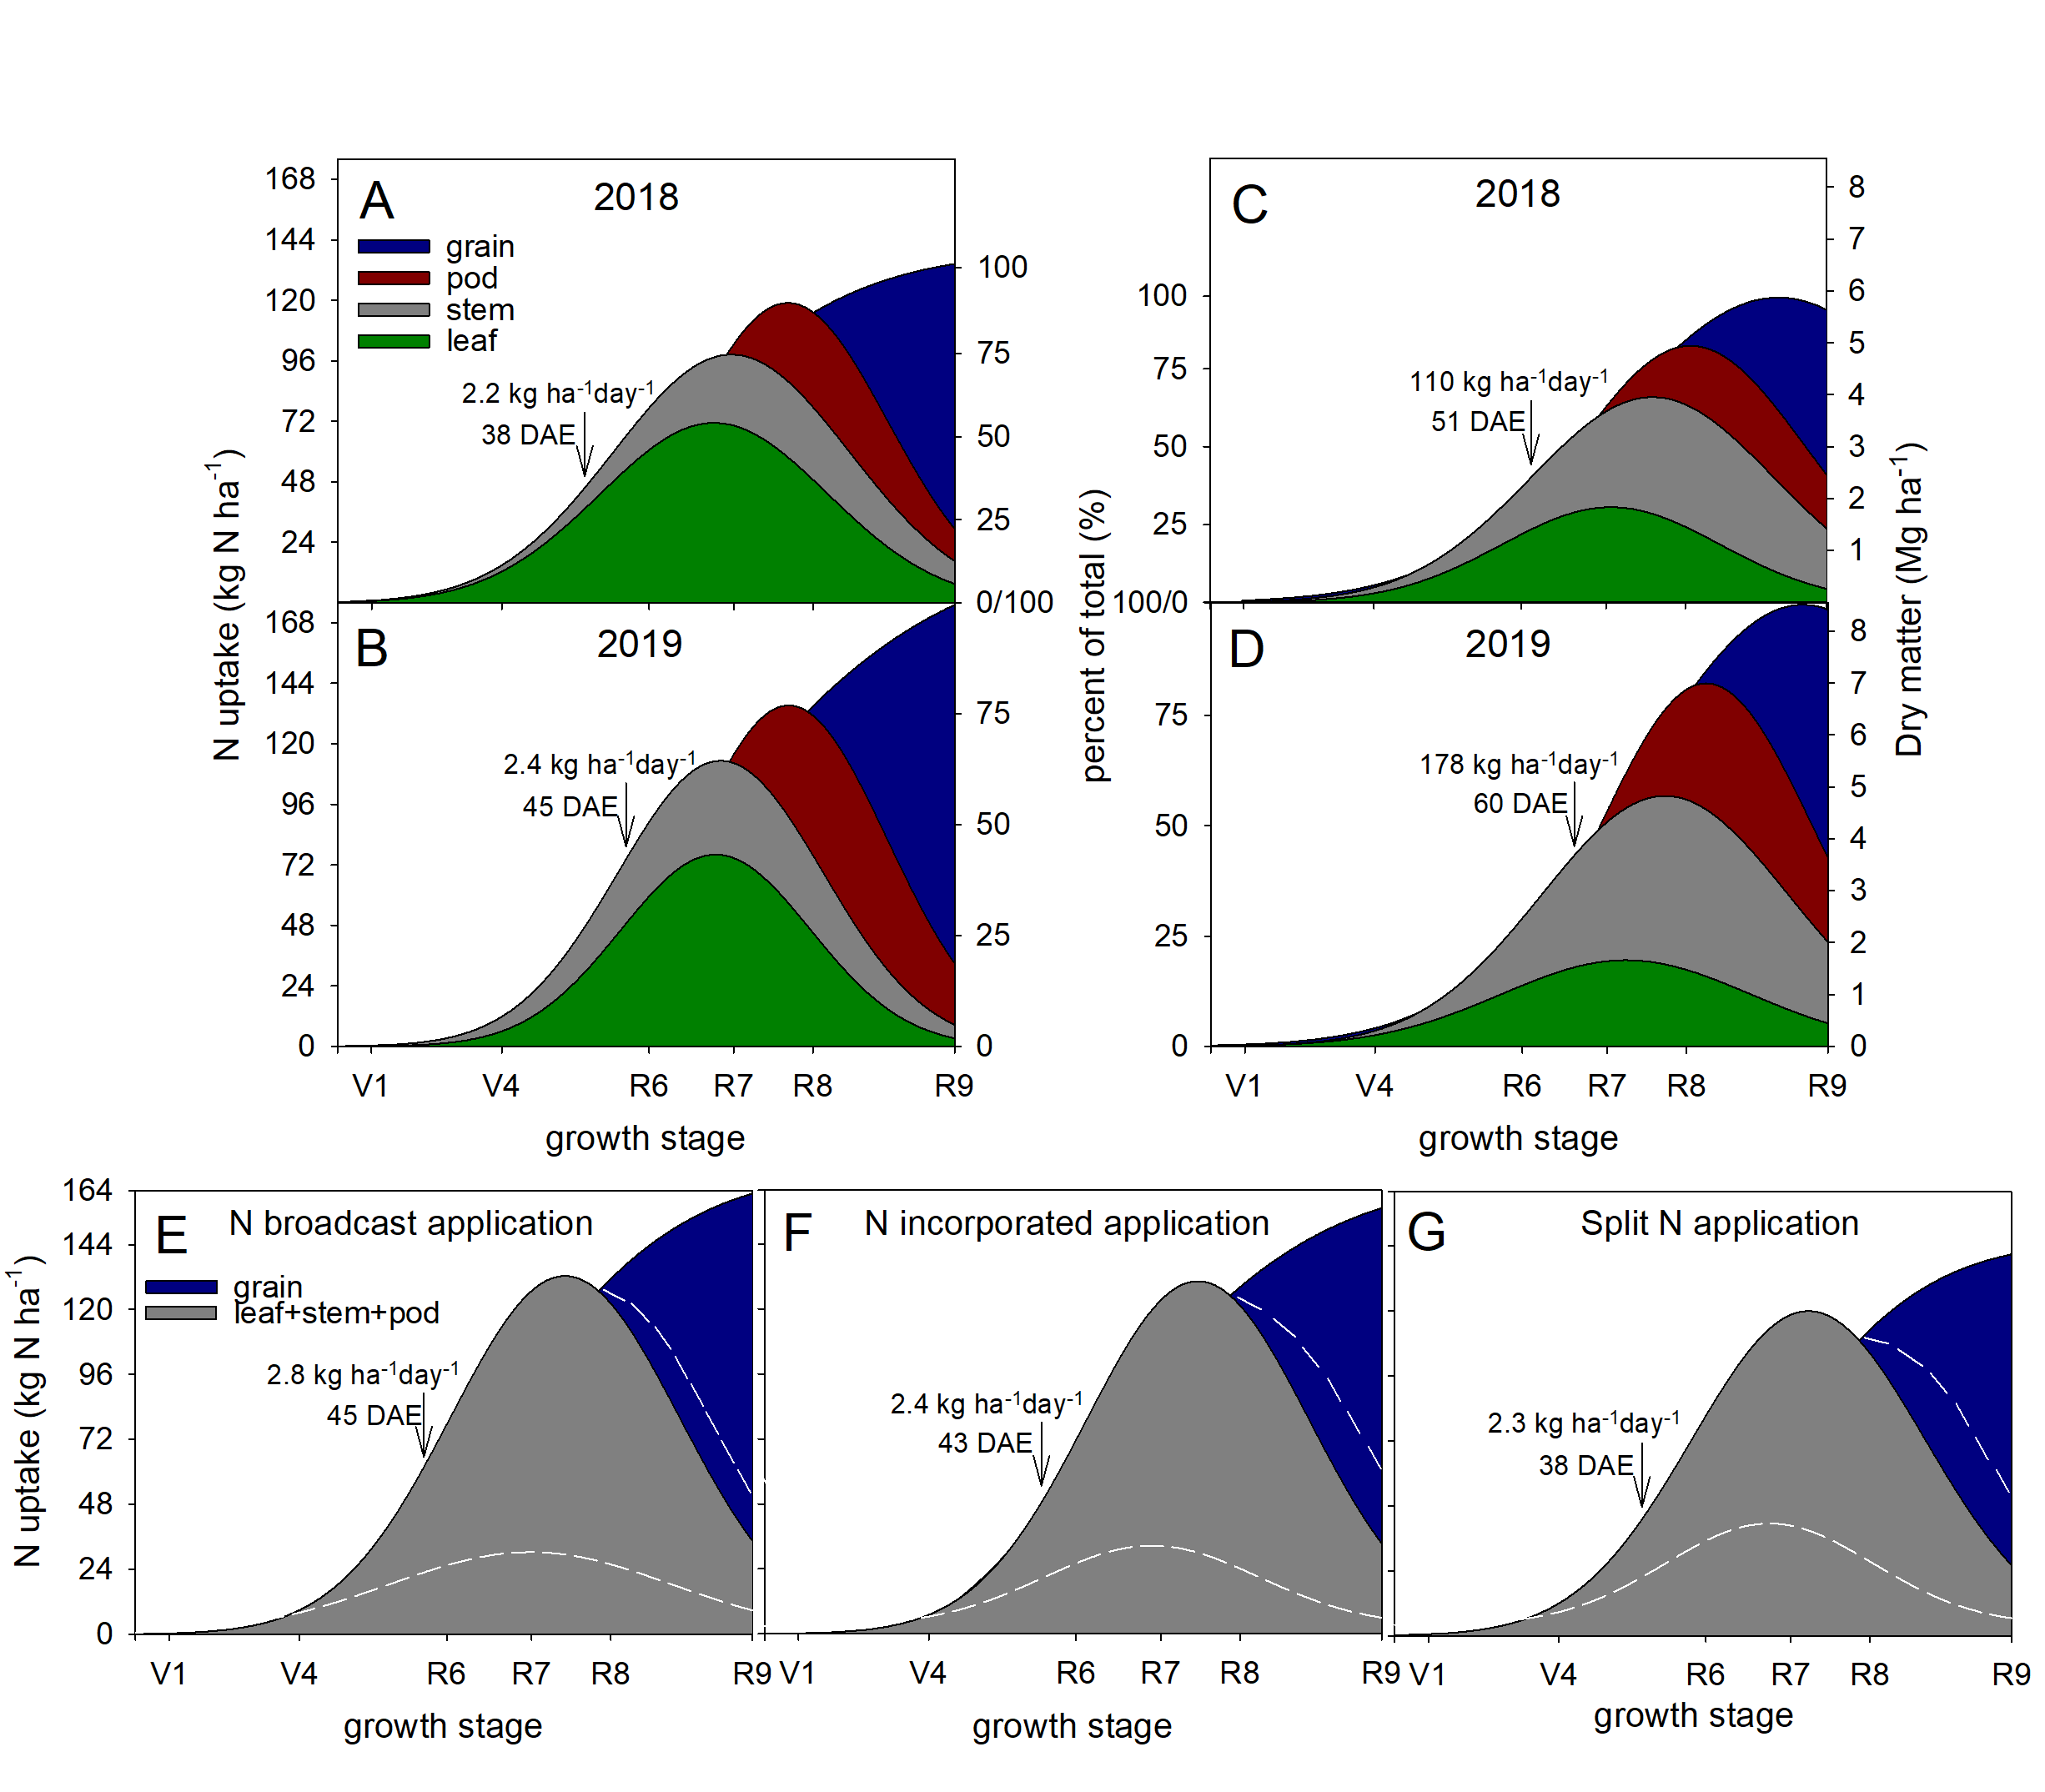
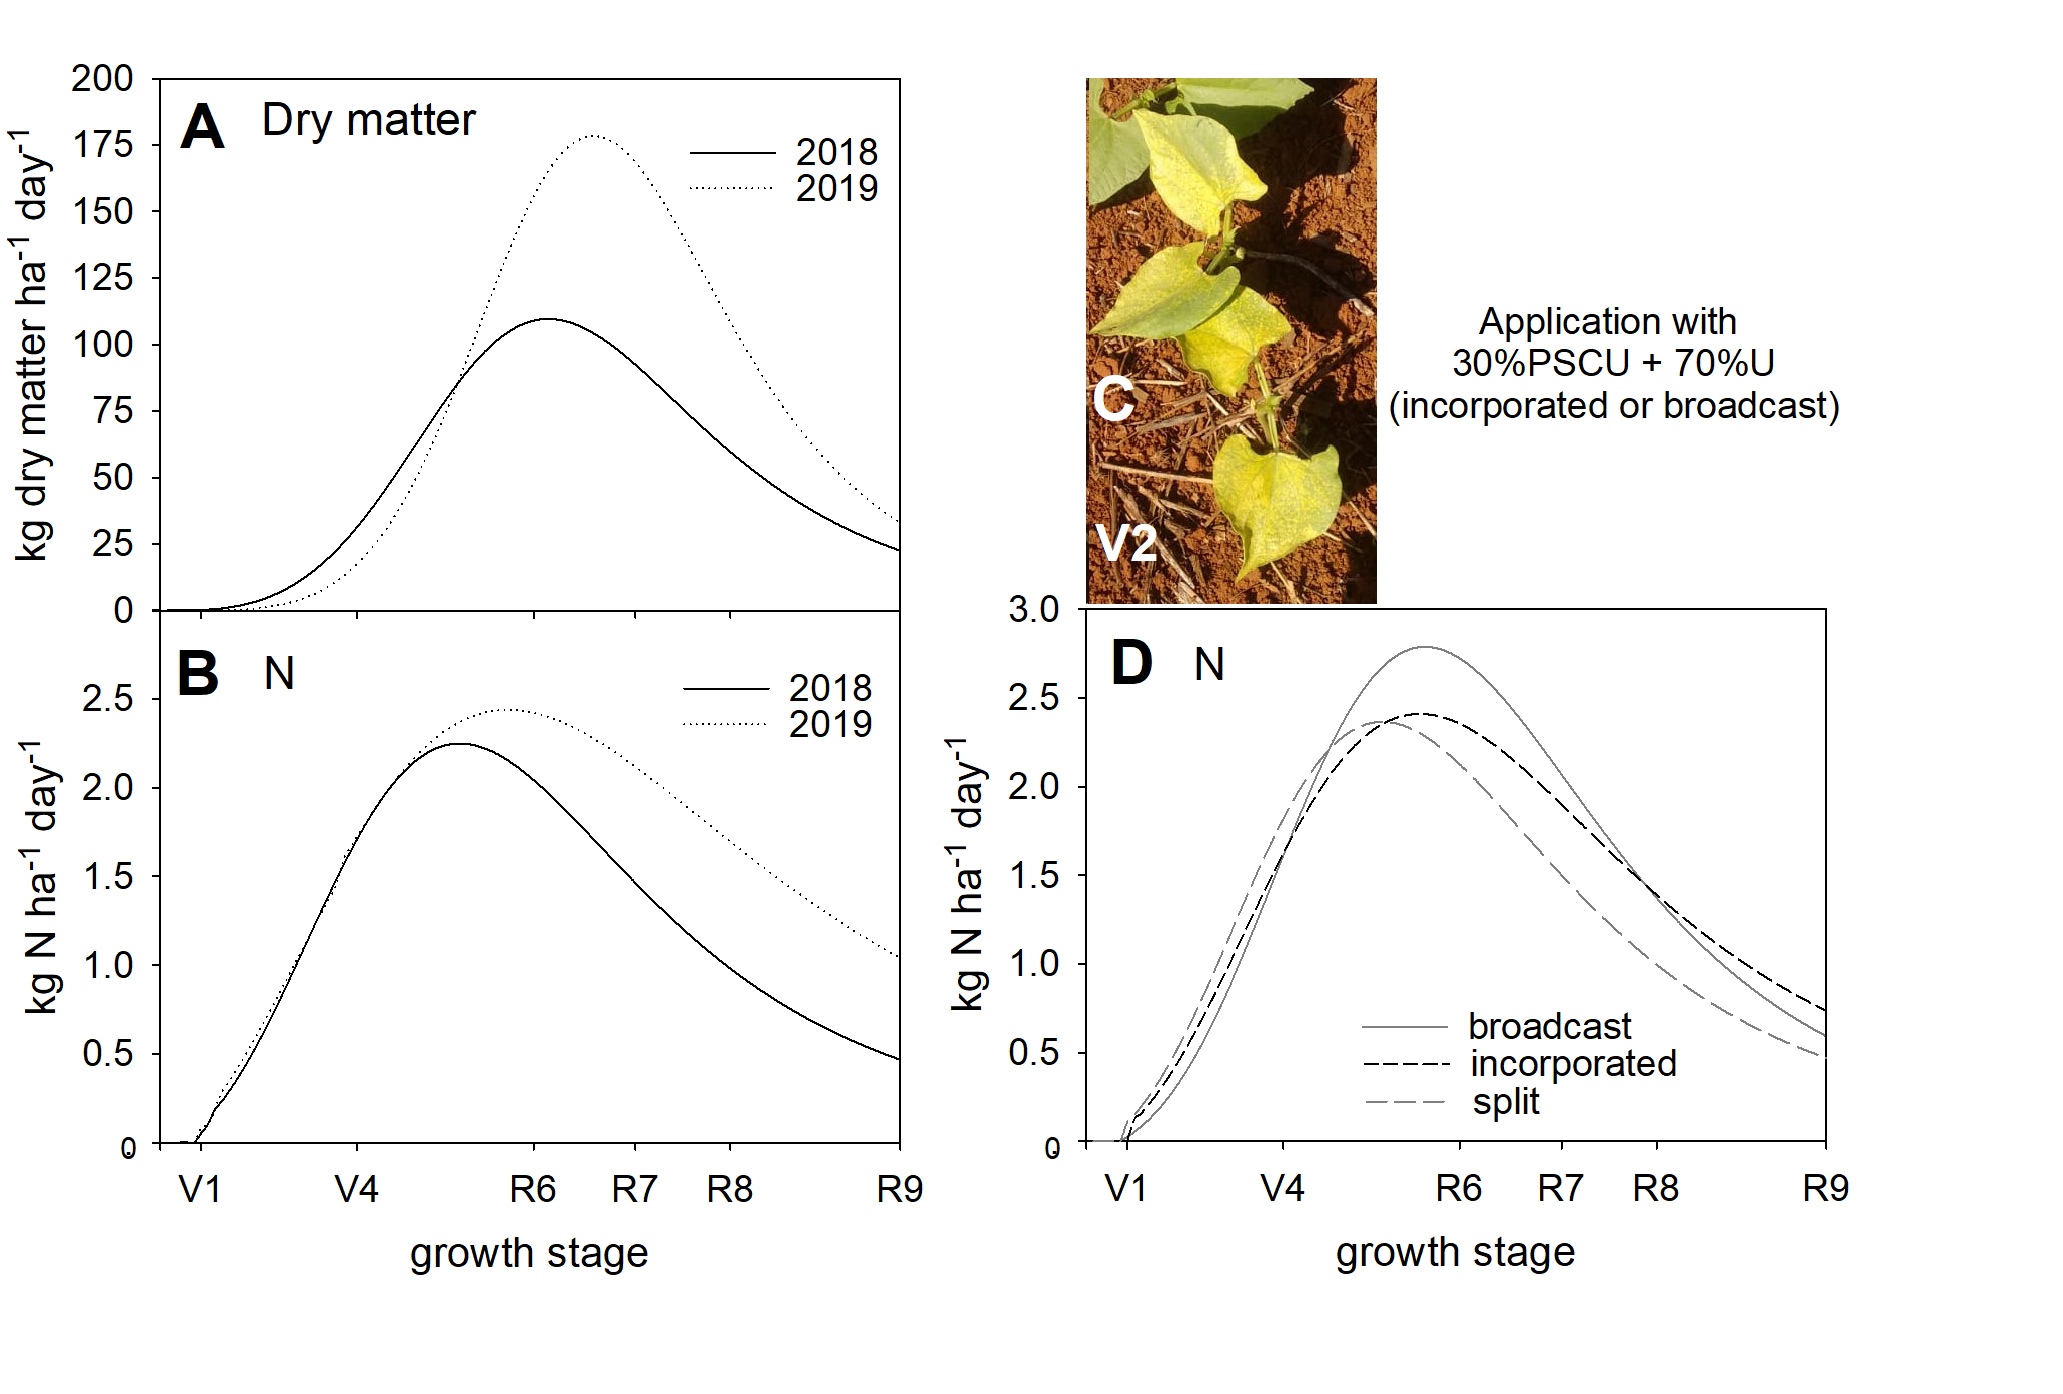
3.4. Biomass (Dry Matter) Accumulation in Plants and Common Bean Yield

The N fertilization management practice influenced the dry matter accumulation (aerial part) in the vegetative and reproductive growth stages of common bean and its yield in 2018 and 2019 (Figure 4). At V4, broadcast application resulted in higher dry matter accumulation (0.56 Mg ha−1) than the other N treatments in 2018 (0.5 Mg ha−1) and 2019 (0.45 Mg ha−1); that value in the broadcast application was similar to that in the control treatment in 2018. Incorporated application (0.48 Mg ha−1) resulted in higher dry matter accumulation than split N application (0.43 Mg ha−1) and the control (0.37 Mg ha−1) in 2019.
At R6, broadcast application resulted in higher dry matter accumulation (2.53 Mg ha−1) than the other N treatments (2.3 Mg ha−1) and the control (2 Mg ha−1) in 2018 and 2019, and the experiment in 2019 generated more dry matter (4.3 Mg ha−1) than in 2018 (3.5 Mg ha−1) at R7. At R8, the broadcast and incorporated application resulted in higher dry matter (6.5 Mg ha−1) than split N application (5.9 Mg ha−1) and the control (6 Mg ha−1) in 2018 and 2019, and the experiment in 2019 generated more dry matter (7.2 Mg ha−1) than in 2018 (5.3 Mg ha−1). At R9, the experiment in 2019 generated more dry matter (8.1 Mg ha−1) than in 2018 (5.6 Mg ha−1). The yield under split N application (3.63 Mg ha−1), which was similar to that in the control, was higher than that under broadcast application (3.34 Mg ha−1) in 2018 and 2019, and the experiment in 2019 generated a higher yield (3.65 Mg ha−1) than in 2018 (3.34 Mg ha−1). The maximum rate of dry matter accumulation (110 kg ha−1 day−1) occurred on the 51st day after common bean emergence (V1) in 2018 (Figure 5C and Figure 6A) and on the 60th day (178 kg ha−1 day−1) after V1 in 2019 (Figure 5D and Figure 6A).

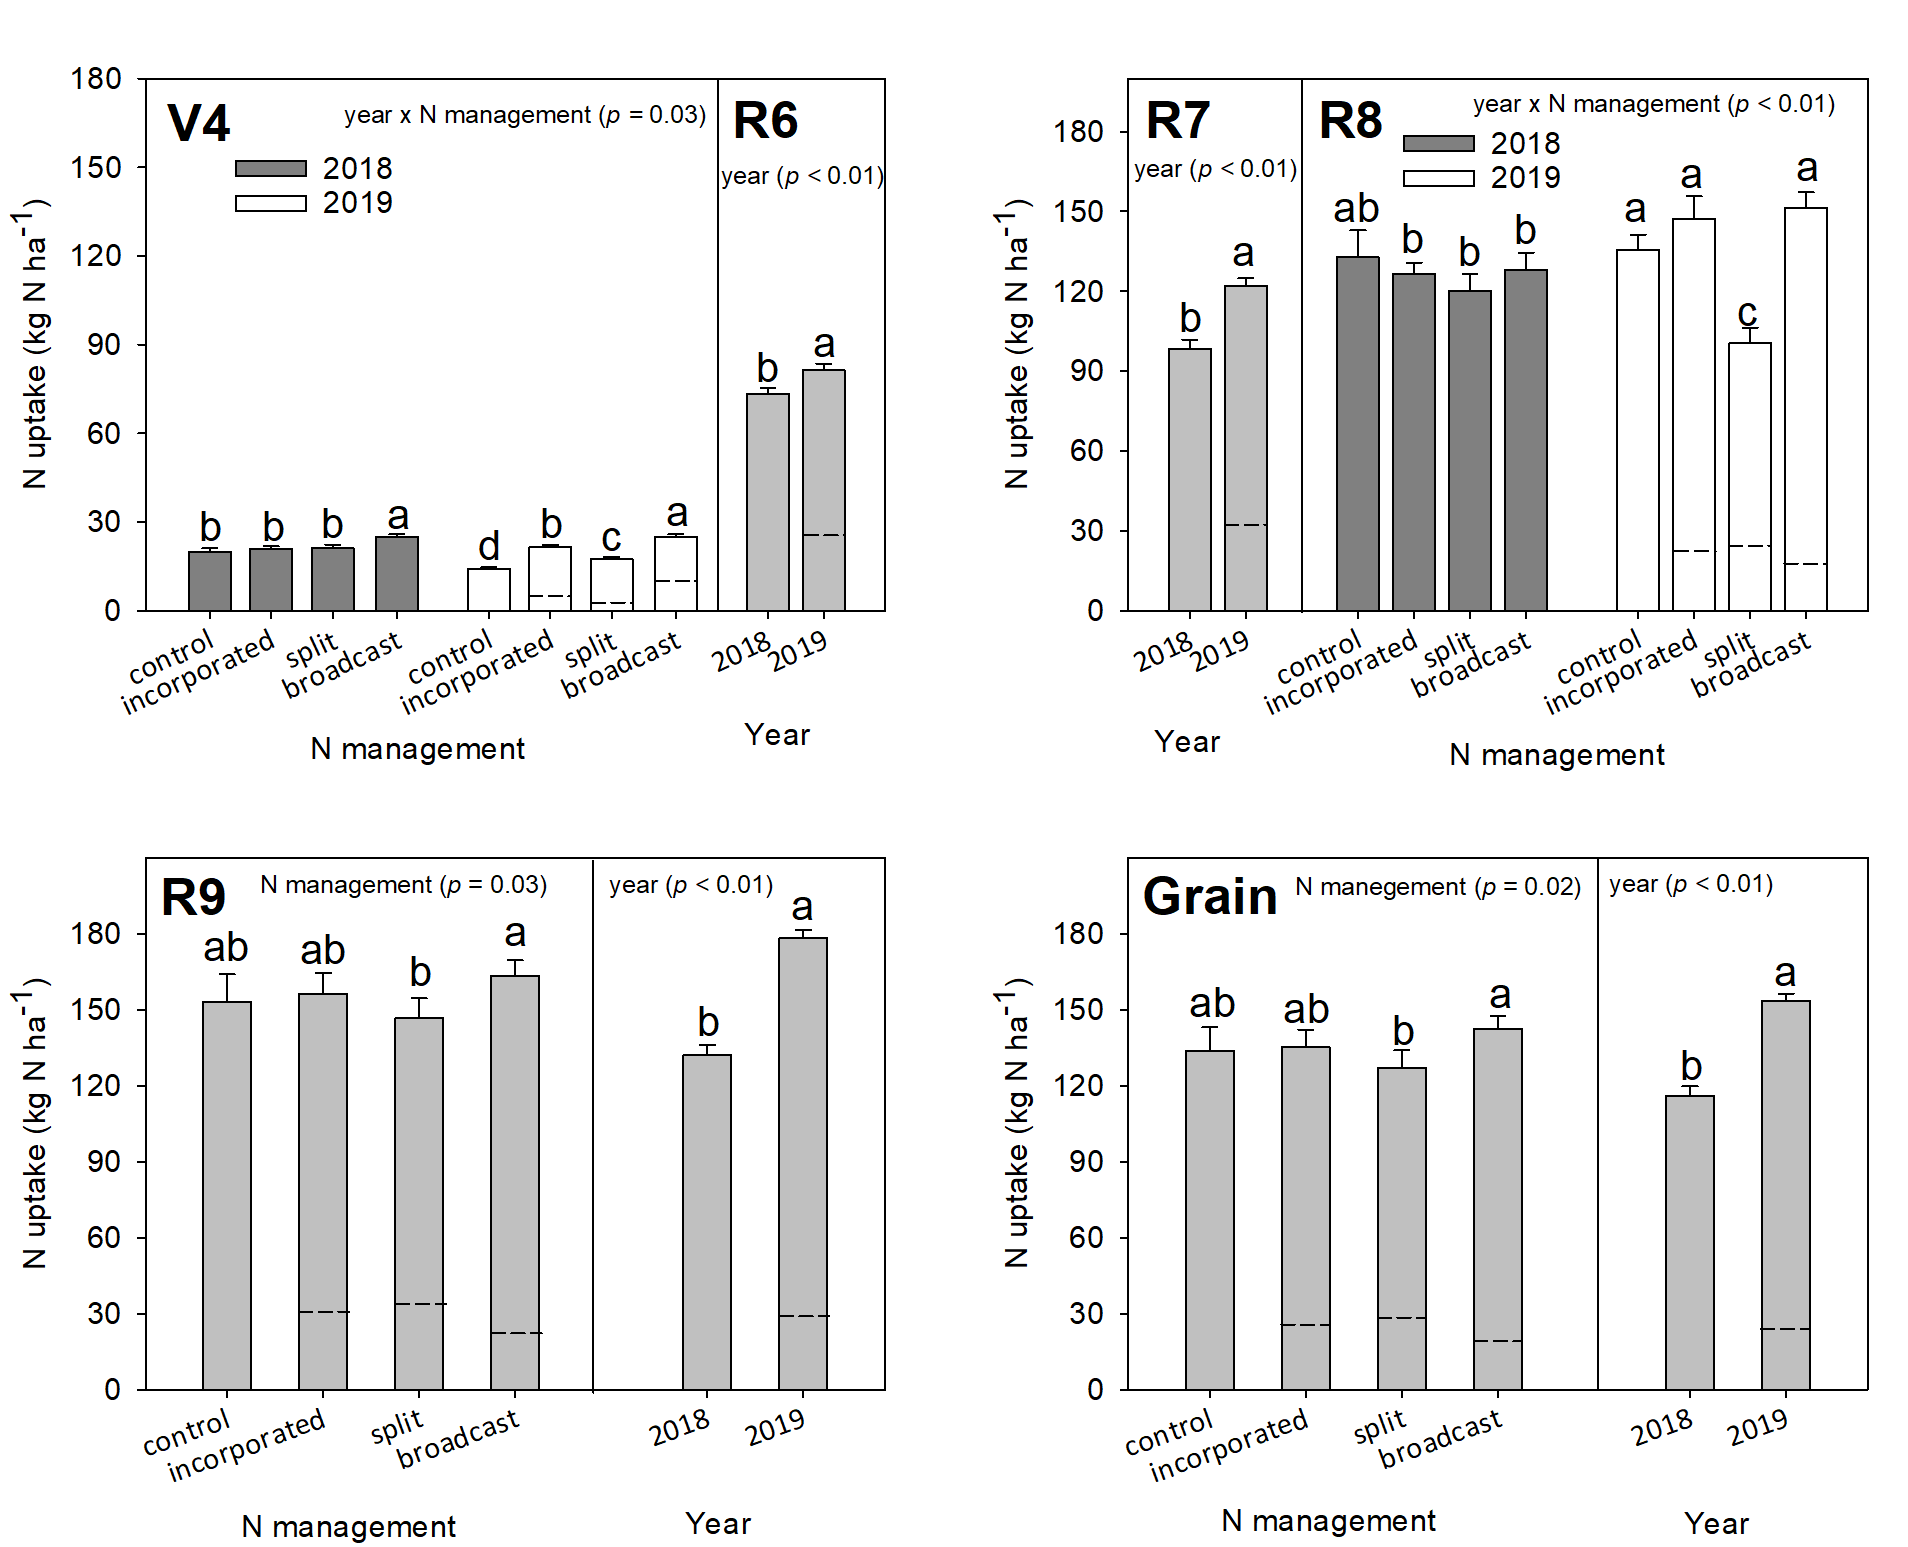
3.5. Nitrogen Uptake in Common Bean Plants

The N fertilization management practices influenced the total N uptake in the vegetative and reproductive stages of common bean (Figure 7). At V4, the N application broadcast resulted in higher N uptake (25 kg ha−1) than the other N management practices in 2018 (21 kg ha−1) and 2019 (19 kg ha−1), and the incorporated application resulted in higher N uptake (21 kg ha−1) than split N application (18 kg ha−1) and the control (14 kg ha−1) in 2019. The Ndff was 8 kg ha−1 on average in 2019 (V4). At R6, higher N uptake was observed in 2019 (82 kg ha−1) than in 2018 (73 kg ha−1). At R7, higher N uptake was observed in 2019 (122 kg ha−1) than in 2018 (98 kg ha−1). At R8, all treatments did not affect N uptake (126 kg ha−1) in 2018, and the split N application resulted in lower N uptake (100 kg ha−1) than the other treatments (147 kg ha−1) in 2019. At R9, broadcast application resulted in higher total N uptake (163 kg ha−1) and N uptake in grain (142 kg ha−1) than split N application (total: 146 kg ha−1; grain: 127 kg ha−1). The Ndff was 30 kg ha−1 on average from R6 to R9 in 2019 and was 23 kg ha−1 in grain at R9 in 2019. Split N, incorporated and broadcast application resulted in Ndff values of 34 kg ha−1 (28 kg ha−1 in the grain), 30 kg ha−1 (25 kg ha−1 in grain), and 23 kg ha−1 (18 kg ha−1 in grain), respectively (Figure 5E–G and Figure 7). The maximum rate of N uptake in 2018 (2.2 kg ha−1 day−1) occurred on the 38th day after V1, and in 2019 (2.4 kg ha−1 day−1) occurred on the 45th day after V1 (Figure 5A,B and Figure 6B). The remobilization from R7 (leaf, stem and pod) to R9 (grain) was 82 kg ha−1 in 2018 and 97 kg ha−1 in 2019 (Figure 5A,B). The remobilization in terms of Ndff was, on average, 27 kg ha−1. It is possible for remobilization values to be overestimated once the plant leaves fall at R9.

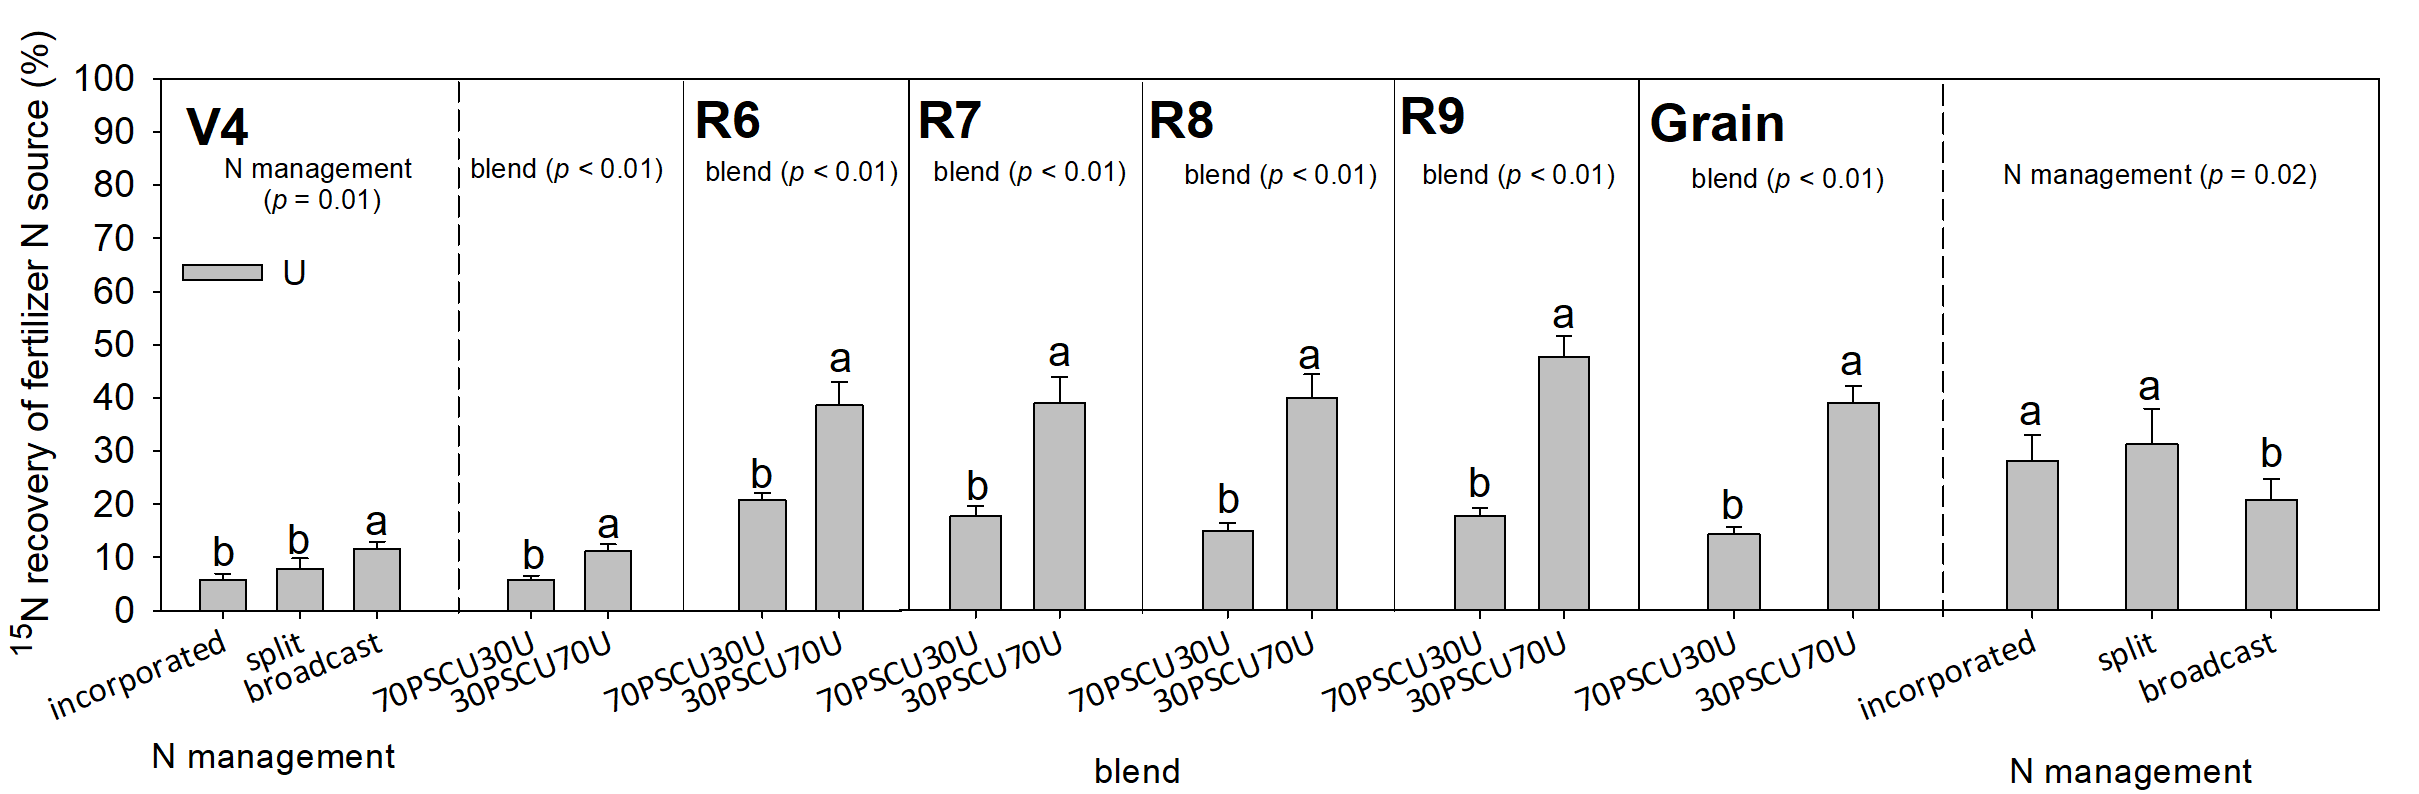
3.6. 15N-Fertilizer Recovery in Common Bean Plants

The N fertilization management practice and fertilizer blend affected the 15N recovery from U treated with NBPT (NUR) by plants during the common bean growth cycle in 2019 (Figure 8). At V4, broadcast application provided a higher NUR (12%) than the other N management practices (7%), and 30%PSCU + 70%U provided a higher NUR (11%) than 70%PSCU + 30%U (6%). From R6 to R8, 30%PSCU + 70%U provided a higher NUR (43% on average) than 70%PSCU + 30%U (18% on average). At R9, 30%PSCU + 70%U provided a higher NUR (48%) and NUR in grain (39%) than 70%PSCU + 30%U (NUR: 18%; NUR in grain: 14%), and split N application and incorporation provided higher NUR in grain (30%) than broadcast application (21%). The NUR in the grain was positively correlated with common bean yield (Figure 9).

4. Discussion

The common bean growth and yield were affected by precipitation in the different years of the experiments in another study [44]. In our irrigated experiments, the daily rate of dry matter accumulation and N uptake during the common bean growth cycle were probably affected by the agricultural history in 2018 and 2019, which would explain the higher dry matter accumulation, N uptake and yield in 2019 than in 2018. The common bean has a low tolerance to low soil fertility [44,45]. The better conditions for common bean growth in 2019 than in 2018 are partially explained by the mechanized operations (plowing and harrowing) and limestone application performed before the sowing of the previous crop in 2019. These factors probably contributed to accelerating the decomposition and mineralization of soil organic matter [46] and increasing the plant N uptake, dry matter accumulation and yield in 2019. Limestone also improved common bean yield during three growing seasons in the Cerrado region in Brazil [47]. Ammonia volatilization reached 11 kg ha−1 under the broadcast-applied 30%PSCU + 70%U treatment, which was 3 kg ha−1 more than that under 70%PSCU + 30%U, and ammonia volatilization increased after the first precipitation event in the growing season (4 mm, in 2018). After the fourth irrigation event, ammonia volatilization decreased, probably due to the incorporation of U. Ammonia volatilization also occurred in the split N application at V4 followed by irrigation and precipitation. The blend with more PSCU tended to result in lower ammonia volatilization because of the controlled N release provided by the insoluble polymers. The intervals of irrigation also contributed to minimizing the daily ammonia volatilization in the PSCU. In situations with more daily precipitation, the daily volatilization of CRU tends to be higher than that observed in our irrigated experiment [48]. The ammonia volatilization probably had the same pattern in 2019, based on the similar irrigation and temperature in the first days after N-fertilizer application compared to those in 2018. The poorer growth performance of common bean in 2018 can also be attributed to the aluminum saturation of the soil, which was higher than 20% below 20 cm; common bean roots in favorable conditions can reach 30 cm depth depending on the soil texture [49]. The aluminum saturation probably restricted common bean root growth at 0–20 cm depth in 2018, limiting water and nutrient absorption and favoring nutrient percolation. Roots were likely more developed at deeper depths in 2019 than in 2018; this would improve plant water and nutrient absorption, especially during periods without rain or irrigation such as during R8 in 2019. Conditions with high Al saturation, as observed in 2018, are normally found in no-tillage systems where limestone is applied to the soil surface without incorporation and reacts with the soil in the application region [50]. To mitigate toxic levels of aluminum in deeper soils, gypsum [51] can be applied in no-tillage systems.
The N fertilization management treatments also affected the daily rate of N uptake in 2018 and 2019 and influenced the differences in N uptake during the common bean growth cycle. Moreover, chlorosis (Figure 6C) in the primary leaves (V2) occurred in 2018 and 2019 after broadcast and incorporated application using 30%PSCU + 70%U. This can be attributed to the salt toxicity [52] caused by the excess N, especially that from U (soluble source), which was mostly concentrated in the incorporated fertilizer application treatments. This result can be explained by the higher soil N mineral levels under incorporated application than under the other N management practices in the N application region, especially at the V4 growth stage. A similar level of soil N mineral was also observed at the V4 maize growth stage at 0–20 cm depth in the fertilizer application region, in studies incorporating 70%PSCU + 30%U and 100%PSCU at sowing [53]. Other studies associated the soil salinity, provided by greater amounts of fertilizers in the seed row, with damage in common bean roots [54]. Chlorosis in primary leaves of the common bean was also observed when applying greater amounts of potassium fertilizer close to the seeds [54,55]. K2O (as KCl) was broadcast applied at sowing in our experiments, and it probably enhanced the effects of salt on plants that underwent broadcast application with 30%PSCU + 70%U. To provide better conditions for N broadcast application using these blends, it is necessary to determine a better rate of N and K2O for broadcast application at sowing in Rhodic Eutrustox soil. Lacerda et al. [54] observed that 22.5 kg N ha−1 and 67.5 kg K2O ha−1 applied broadcast at common bean sowing is an alternative to the application incorporated at sowing. The authors also applied 60 kg N ha−1 (as urea) topdressing at V4 common bean growth stage in their treatments. Other studies evaluated the salt effect in maize plants using 70%PSCU + 30%U [22,23], and a deleterious effect, caused by the excess N, was observed in early growth. Based on that result the optimal N rate and application mode with 70%PSCU + 30%U in maize were recommended. Similar studies would be helpful in determining the ideal application mode and N rate using the blends in our study for common bean. The optimal method would avoid the possible effects of salt on the plants. Moreover, excess N can accelerate the vegetative growth of common bean, which negatively affects the reproductive stages by retarding flowering and disrupting the nutrient balance [52,56,57]. The split N application in our research provided better conditions for the early growth of common bean than other N management practices, based on the slightly higher daily rate of N uptake observed from V2 to V4 (Figure 6D). In this period, plant stress can indirectly affect common bean yield [39]. From V4 until R8, broadcast application resulted in a higher daily rate of N uptake than the other N fertilization management practices. Broadcast application resulted in higher N uptake and NUR at V4 than the other N management practices, and higher total N uptake at R9 than split N application, especially in the grain. These results suggest that broadcast application probably provided a greater priming effect [58] than the other N management practices between V4 and R8, as the plants had lower NUR in the grain at R9 in the broadcast application than in the split N application. In addition, the plants tended to reach their maximum NUR at the R6 growth stage with both blends. This tendency probably occurred because U is a soluble N source; after R6, the N from this source was probably located below the roots, and the plants probably absorbed more N from the soil and from PSCU which provided N higher on the soil surface. It would be of interest to confirm this hypothesis in another study with 15N in the PSCU source.
We also found an imbalance between the N uptake and the NUR in the grain in the broadcast application but no in the other management treatments, and the NUR in the grain was positively correlated with common bean yield (Figure 9). Our hypothesis explaining that correlation is that the salt effect observed in common bean plants, especially under the broadcast application of 30%PSCU + 70%U, probably affected the NUR, and plants in that situation tended to absorb less N from the fertilizer than those in split N application treatments. The stress probably disrupted the balance between the N uptake from the U source and the total N uptake, and indirectly interfered with the common bean yield; the yield was lower in the broadcast application treatment than in split N application treatment and the control treatment (without N-fertilizer application) in 2018 and 2019. Similar results have not been reported in other studies in common bean using these blends, and studies evaluating the influence of salt effects on common bean plants and their association with common bean yield would clarify these results. Other studies observed that the split N application in the proportion 1:1 (basal N application:topdressed N application) resulted in a higher N uptake, NUR and yield than the proportion 2:1 [59,60]. Contrary to our results, Oliveira et al. [61] did not observe a difference in yield for N fertilization management practices with a controlled-release fertilizer in common bean. Moreover, in our study, the control treatment provided similar conditions for better common bean growth and yield; nonresponse to N-fertilizer application were also observed in maize production at Rhodic Haplustox sites using blends of PSCU + U and only U [19,62] and in sugarcane in a Typic Hapludox soil [63].
The challenges of U application that have been observed in other studies (ammonia volatilization [6], salt effect [22], and N percolation [7]) were observed in our research despite the N-fertilizer recovery of U treated with NBPT being higher than 50% for both blends. Neptune and Muraoka [64] observed that NUR in common bean varied from 11% to 35% in N fertilization management practices with U, and the N application at sowing resulted in lower N uptake than the N application before or at flowering stage. Based on our results, split N application using the less expensive blend can be recommended. Fertilizer incorporation can also be recommended with adjustments associated with the distance from the N-fertilizer application region to the seed row to avoid salt toxicity. Similar recommendations were also made in a study evaluating N fertilization management using only U and based only on common bean yield [65]. At nonresponsive sites, it is advantageous to apply N to replace the N extracted by plants, thereby avoiding economic losses and pollution. This suggests the benefits of a reduction in the N application rate, which would reduce costs and, in this study, minimize the salt toxicity observed in the broadcast and incorporated applications for common bean in Rhodic Eutrustox soil.

5. Conclusions

Broadcast application using blends of PSCU and U (70%PSCU + 30%U and 30%PSCU + 70%U) did not improve grain yield compared to N incorporated application at sowing and split N application in irrigated experiments in Rhodic Eutrustox soil during the mild winter in Brazil. Broadcast application also resulted in lower grain yield than the control treatment (without N-fertilizer application) and the split N application treatment. Broadcast application resulted in lower NUR in the grain at harvest than split N application, which indicates that broadcast application was less efficient at supplying N from the U source in the blends. The U source provided 18% of the NUR in common bean plants with the 70%PSCU + 30%U blend and 48% with the 30%PSCU + 70%U blend. These NURs are higher than 50% considering the proportion of U in each blend. The nonrecovery of N from U by plants can be attributed to ammonia volatilization, which reached 12% of the total N applied, on average, under split N application and broadcast application, and the likely percolation of N below the common bean root zone.

Author Contributions

P.L.G. conceived, designed, and performed the experiments, field sampling, laboratory and data analyses, funding acquisition, writing, review and editing; R.A.S. review and data analyses; P.C.O.T. supervision, conceived and designed the experiments, funding acquisition, project administration and review. All authors have read and agreed to the published version of the manuscript.

Funding

This research was funded by FUNDAÇÃO DE AMPARO À PESQUISA DO ESTADO DE SÃO PAULO (FAPESP), grant number 2017/25813-5 and grant number 2017/24516-7. This research was also funded by COMPASS MINERALS PLANT NUTRITION and by CENTER FOR NUCLEAR IN AGRICULTURE (CENA/USP).

Acknowledgments

We are most grateful to Stable Isotopes Laboratory team for the strong laboratory and field assistance. Technicians: Hugo, Ana, Miguel, Pingin, Clélber and Bento. Interns: Cátia, Henrique, Matheus, Carla, Pablo, Leonardo, Monique, Maick, Bianca, Everton, Maria Roberta and Magrão (in memoriam). Graduate students: Beatriz, Nicole, Bruno, Gabriela and Saulo. Professors: José Albertino Bendassolli and José Lavres Junior. We also thank Compass Minerals South America research team (Ithamar Prada, José Marcos Leite, Bruno Saito, Daniela Vitti, Robson Mauri, Gabriel Uehara, Douglas, Linker, interns and the previous research manager Fabio Scudeler) for the strong field assistance.

Conflicts of Interest

The authors declare no conflict of interest.

References

  1. CONAB. National Company of Supplying. Monthly Analysis of Common Bean; 2020. Available online: https://www.conab.gov.br/info-agro/analises-do-mercado-agropecuario-e-extrativista/analises-do-mercado/historico-mensal-de-feijao (accessed on 24 November 2020).
  2. Fageria, N.K.; Stone, L.F.; Santos, A.B.; Carvalho, M.C.S. Mineral Nutrition of Common Bean; EMBRAPA: Brasilia, Brazil, 2015; 394p. [Google Scholar]
  3. Zimmermann, M.J.; Rocha, M.; Yamada, T. Common Bean Crop: Factors that Affect Yield; Potafos: Piracicaba, Brazil, 1988; 589p. [Google Scholar]
  4. Reinprecht, Y.; Schram, S.; Marsolais, F.; Smith, T.H.; Hill, B.; Pauls, K.P. Effects of nitrogen application on nitrogen fixation in common bean production. Front. Plant Sci. 2020, 11, 1–19. [Google Scholar] [CrossRef] [PubMed]
  5. Carneiro, J.E.; Junior, T.J.P.; Borem, A. Common Bean from Sowing to Harvest; Federal University of Viçosa: Viçosa, Brazil, 2015; 384p. [Google Scholar]
  6. Rinaldi, L.F.; Garcia, P.L.; Sermarini, R.A.; Trivelin, P.C.O. 15N-Urea efficiency in maize as influenced by humic substances and urease inhibitors treatments. Commun. Soil Sci. Plant Anal. 2019, 50, 198–208. [Google Scholar] [CrossRef]
  7. Hong, N.; Scharf, P.C.; Davis, J.G.; Kitchen, N.R.; Sudduth, K.A. Economically optimal nitrogen rate reduces soil residual nitrate. J. Environ. Qual. 2007, 36, 354–362. [Google Scholar] [CrossRef] [PubMed] [Green Version]
  8. Dusenbury, M.P.; Engel, R.E.; Miller, P.R.; Lemke, R.L.; Wallander, R. Nitrous oxide emissions from a Northern Great Plains soil as influenced by nitrogen management and cropping system. J. Environ. Qual. 2008, 37, 542–550. [Google Scholar] [CrossRef] [PubMed]
  9. Kong, L. Maize residues, soil quality, and wheat growth in China: A review. Agron. Sustain. Dev. 2014, 34, 405–416. [Google Scholar] [CrossRef] [Green Version]
  10. Meira, F.A.; Sá, M.E.; Buzetti, S.; Arf, O. Doses and time of nitrogen top-dressed application for common bean in no-till system. Pesqui. Agropecuária Bras. 2005, 40, 383–388. [Google Scholar] [CrossRef] [Green Version]
  11. Henson, R.A.; Bliss, F.A. Effects of N fertilizer application timing on common bean production. Fertil. Res. 1991, 29, 133–138. [Google Scholar] [CrossRef]
  12. Araújo, A.P.; Teixeira, M.G. Relationshis between grain yield and accumulation of biomass, nitrogen and phosphorus in common bean cultivars. Rev. Bras. Ciência do Solo 2008, 32, 1977–1986. [Google Scholar] [CrossRef] [Green Version]
  13. Snyder, C.S. Enhanced nitrogen fertilizer technologies support the “4R” concept to optimize crop production and minimise environmental losses. Soil Res. 2017, 55, 463–472. [Google Scholar] [CrossRef]
  14. Tian, X.; Geng, J.; GUO, Y.; LI, C.; Zhang, M.; Chen, J. Controlled-release urea decreased ammonia volatilization and increased nitrogen use efficiency in cotton. J. Plant Nutr. Soil Sci. 2017, 180, 667–675. [Google Scholar] [CrossRef]
  15. Tian, X.; Li, C.; Zhang, M.; Li, T.; Lu, Y.; Liu, L. Controlled release urea improved crop yields and mitigated nitrate leaching under cotton-garlic intercropping system in a 4-year field trial. Soil Tillage Res. 2018, 175, 158–167. [Google Scholar] [CrossRef]
  16. Halvorson, A.D.; Del Grosso, S.J. Nitrogen source and placement effects on soil nitrous oxide emissions from no-till corn. J. Environ. Qual. 2012, 41, 1349–1360. [Google Scholar] [CrossRef] [PubMed]
  17. Grant, C.A.; Wu, R.; Selles, F.; Harker, K.N.; Clayton, G.W.; Bittman, S.; Zebarth, B.J.; Lupwayi, N.Z. Crop yield and nitrogen concentration with controlled release urea and split applications of nitrogen as compared to non-coated urea applied at seeding. Field Crops Res. 2012, 127, 170–180. [Google Scholar] [CrossRef]
  18. IPNI. Slow or Controlled Release and Stabilized Nitrogen Fertilizers. 2017. Available online: http://www.ipni.net/PUBLICATION/IA-BRASIL.NSF/0/90DE38570A7216CB832580FB0066E3B4/$FILE/Jornal-157.pdf (accessed on 24 November 2020).
  19. Garcia, P.L.; González-Villalba, H.A.; Sermarini, R.A.; Trivelin, P.C.O. Nitrogen use efficiency and nutrient partitioning in maize as affected by blends of controlled-release and conventional urea. Arch. Agron. Soil Sci. 2018, 64, 1944–1962. [Google Scholar] [CrossRef]
  20. Villalba, H.A.G. Blending Polymer-Sulfur Coated and NBPT-Treated Urea to Improve Nitrogen Use Efficiency and Grain Yield in Corn Production Systems. Ph.D. Thesis, University of São Paulo, Piracicaba, Brazil, 2018. Available online: https://www.teses.usp.br/teses/disponiveis/11/11140/tde-14082018-100857/pt-br.php (accessed on 24 November 2020).
  21. Guo, J.; Wang, Y.; Blaylock, A.D.; Chen, X. Mixture of controlled release and normal urea to optimize nitrogen management for high-yielding (>15 Mg ha−1) maize. Field Crops Res. 2017, 204, 23–30. [Google Scholar] [CrossRef]
  22. Garcia, P.L.; Sermarini, R.A.; Trivelin, P.C.O. Effects of nitrogen rates applying controlled-release and conventional urea blend in maize. J. Plant Nutr. 2019, 42, 2199–2208. [Google Scholar] [CrossRef]
  23. Garcia, P.L.; Sermarini, R.A.; Trivelin, P.C.O. Placement effect of controlled-release and conventional urea blend in maize. Commun. Soil Sci. Plant Anal. 2019, 50, 2321–2329. [Google Scholar] [CrossRef]
  24. Li, C.; Wang, Y.; Li, V.; Zhu, L.; Cao, Y.; Zhao, X.; Feng, G.; Gao, Q. Mixture of controlled-release and normal urea to improve nitrogen management for maize across contrasting soil types. Agron. J. 2020, 112, 3101–3113. [Google Scholar] [CrossRef]
  25. Li, C.L.; Cao, Y.Q.; Wang, Y.; Li, X.Y.; Li, Y.X.; Zhu, L.; Zhao, X.H.; Gao, Q. Effects of mixed controlled release and normal urea on maize (Zea Mays L.) growth, grain yield and nitrogen balance and use efficiency in northeast China. Appl. Ecol. Environ. Res. 2020, 18, 5367–5382. [Google Scholar] [CrossRef]
  26. Soil Survey Staff. Keys to Soil Taxonomy, 12nd ed.; USDA-NRCS: Washington, DC, USA, 2014. [Google Scholar]
  27. Gee, G.W.; Bauder, J.W. Particle-size analyzis. In Methods of Soil Analysis: Physical and Mineralogical Methods; Klaute, A., Ed.; ASA and SSSA: Madison, WI, USA, 1986; pp. 383–411. [Google Scholar]
  28. Bataglia, O.C.; Furlani, A.M.C.; Teixeira, J.P.F.; Furlani, P.R.; Gallo, J.R. Methods of Chemical Analysis of Plants; Instituto Agronômico: Campinas, Brazil, 1983; pp. 1–48. [Google Scholar]
  29. Van Raij, B.; Andrade, J.C.; Cantarella, H.; Quaggio, J.A. Chemical Analysis for Fertility Evaluation of Tropical Soils; Instituto Agronômico: Campinas, Brazil, 2001. [Google Scholar]
  30. Nelson, D.W.; Sommers, L.E. Total Carbon, organic carbon and organic matter. In Methods of Soil Analysis: Chemical Methods; Sparks, D.L., Ed.; ASA and SSSA: Madison, WI, USA, 1996; pp. 961–1010. [Google Scholar]
  31. Barrie, A.; Prosser, S.J. Automated analyses of light-element stable isotopes by isotope ratio mass spectrometry. In Mass Spectrometry of Soils; Boutton, T.W., Yamasaki, S., Eds.; Marcel Dekker: New York, NY, USA, 1996; pp. 1–46. [Google Scholar]
  32. Van Raij, B.; Cantarella, H. Corn for grain and silage. In Recommendation of Fertilization and Liming for the State of São Paulo; Cantarella, H., Quaggio, J.A., Furlani, A.M.C., Eds.; Instituto Agronômico: Campinas, Brazil, 1997; pp. 56–59. [Google Scholar]
  33. Mariano, E.; Filho, C.R.S.A.; Bortoletto-Santos, R.; Bendassoli, J.A.; Trivelin, P.C.O. Ammonia losses following surface application of enhanced-efficiency nitrogen fertilizers and urea. Atmos. Environ. 2019, 203, 242–251. [Google Scholar] [CrossRef]
  34. Fritsche, L.S. Urea-15N. Master’s Thesis, University of São Paulo, Piracicaba, Brazil, 2019. Available online: https://www.teses.usp.br/teses/disponiveis/64/64135/tde-09102019-091454/publico/Leticia_Sbrana_Fritsche_Revisada.pdf (accessed on 24 November 2020).
  35. Lisboa, F.C.; Silva, D.D.A.; Teixeira, I.R.; Silva, A.G.; Mota, J.H. Agronomic characteristics of common bean and castor bean hybrids in intercropping and monocropping. Rev. Bras. Eng. Agrícola Ambient. 2018, 22, 200–205. [Google Scholar] [CrossRef] [Green Version]
  36. Melo, L.C.; Peloso, M.J.D.; Pereira, H.S.; Faria, C.L.; Costa, J.G.C.; Diaz, J.L.C.; Rava, C.A.; Wendland, A.; Abreu, A.F.B. BRS Estilo—Common bean cultivar with Carioca grain, upright growth and high yield potential. Crop Breed. Appl. Biotechnol. 2010, 10, 377–379. [Google Scholar] [CrossRef] [Green Version]
  37. Reis, B.F.; Vieira, J.A.; Krug, F.J.; Giné, M.F. Development of a flow injections system two analytical paths for ammonium determination in soil extracts by conductometry. J. Braz. Chem. Soc. 1997, 8, 524–528. [Google Scholar] [CrossRef] [Green Version]
  38. Gonzaga, M.M.; Trivelin, P.C.O. Open Collector Efficiency to Capture NH3 Volatilized from the Soil. SIICUSP. 2018. Available online: https://uspdigital.usp.br/siicusp/siicPublicacao.jsp?codmnu=7210 (accessed on 24 November 2020).
  39. Embrapa. Knowing the Common Bean Phenology and Its Phytotechnician Aspects. 2018. Available online: https://ainfo.cnptia.embrapa.br/digital/bitstream/item/173690/1/CNPAF-2018-lvfeijoeiro.pdf (accessed on 24 November 2020).
  40. Laviola, B.G.; Martinez, H.E.P.; Souza, R.B.; Salomão, L.C.C.; Cruz, C.D. Macronutrient accumulation in coffee fruits at Brazilian Zona da Mata conditions. J. Plant Nutr. 2009, 32, 980–995. [Google Scholar] [CrossRef]
  41. Trivelin, P.C.O.; Lara Cabezas, W.A.R.; Victoria, R.L.; Reichardt, K. Evaluation of a 15N plot design for estimating plant recovery of fertilizer nitrogen applied to sugar cane. Sci. Agric. 1994, 51, 226–234. [Google Scholar] [CrossRef] [Green Version]
  42. Hauck, R.D.; Bremmer, J.M. Use of tracers for soil and fertilizer nitrogen research. Adv. Agron. 1976, 28, 219–266. [Google Scholar]
  43. R Development Core Team. R: A Language and Environment for Statistical Computing R. Foundation for Statistical Computing. 2015. Available online: http://www.R-project.org/ (accessed on 24 November 2020).
  44. Vanlauwe, B.; Chikowo, R.; Chekanai, V. Response of common bean (Phaseolus vulgaris L.) to nitrogen, phosphorus and rhizobia inoculation across variable soils in Zimbabwe. Agric. Ecosyst. Environ. 2018, 266, 167–173. [Google Scholar]
  45. Singh, S.P.; Terán, H.; Muñoz, C.G.; Osorno, J.M.; Tkegami, J.C.; Thung, M.D.T. Low soil fertility tolerance in landraces and improved common bean genotypes. Crop Sci. 2003, 43, 110–119. [Google Scholar] [CrossRef] [Green Version]
  46. Loss, A.; Pereira, M.G.; Costa, E.M.; Beutler, S.J. Carbon, nitrogen and the natural abundance of 13C and 15N in macro and microaggregates. Idesia 2014, 32, 15–21. [Google Scholar]
  47. Carvalho, M.C.S.; Nascente, A.S. Application of lime, phosphogypsum and fertilization rates affect soil fertility and common bean development in no-tillage system in a Cerrado Oxisol. Acta Sci. Agron. 2018, 40, e39322. [Google Scholar] [CrossRef]
  48. Ke, J.; Xing, X.; Li, G.; Ding, Y.; Dou, F.; Wang, S.; Liu, Z.; Tang, S.; Ding, C.; Chen, L. Effects of different controlled-release nitrogen fertilisers on ammonia volatilisation, nitrogen use efficiency and yield on blanket-seeding machine-transplanted rice. Field Crops Res. 2017, 205, 147–156. [Google Scholar] [CrossRef]
  49. Pires, R.C.M.; Arruda, F.B.; Fujiwara, M.; Sakai, E.; Bortoletto, N. Root-system depth of field bean and wheat under center pivot. Bragantia 1991, 50, 153–162. [Google Scholar] [CrossRef] [Green Version]
  50. Soratto, R.P.; Crusciol, C.A.C. Chemical soil attributes as affected by lime and phosphogypsum surface application in a recently established no-tillage system. Rev. Bras. Ciência do Solo 2008, 32, 675–688. [Google Scholar] [CrossRef] [Green Version]
  51. Vicensi, M.; Lopes, C.; Koszalka, V.; Umburanas, R.C.; Kawakami, J.; Pott, C.A.; Müller, M.M.L. Gypsum Rates and Splitting Under No-Till: Soil Fertility, Corn Performance, Accumulated Yield and Profits. J. Soil Sci. Plant Nutr. 2020, 20, 690–702. [Google Scholar] [CrossRef]
  52. Zhu, J.K. Plant Salt Stress. Encycl. Life Sci. 2007, 1–3. [Google Scholar] [CrossRef]
  53. Villalba, H.A.G. Blends of Polymer Coated Urea and Convetional Urea in Maize Fertilization. Master’s Thesis, University of São Paulo, Piracicaba, Brazil, 2014. Available online: https://www.teses.usp.br/teses/disponiveis/11/11140/tde-25022014-105031/pt-br.php (accessed on 24 November 2020).
  54. Lacerda, M.C.; Nascente, A.S.; Carvalho, M.C.S.; Mondo, V.H.V. Broadcast fertilizer rate impacts common bean grain yield in a no-tillage system. Afr. J. Agric. Res. 2015, 10, 1773–1779. [Google Scholar]
  55. Kluthscouski, J.; Stone, L.F. Efeitos nocivos do manejo inadequado da adubação no crescimento radicular das culturas anuais, com ênfase no potássio. Embrapa 2003, 158, 1–17. Available online: https://ainfo.cnptia.embrapa.br/digital/bitstream/CNPAF/21630/1/doc_158.pdf (accessed on 24 November 2020).
  56. Almeida, O.M.; Melo, H.C.; Portes, T.Q. Growth and yield of the common bean in response to combined application of nitrogen and paclobutrazol. Rev. Caatinga 2016, 29, 127–132. [Google Scholar] [CrossRef] [Green Version]
  57. Rabelo, A.C.R.; Ribeiro, D.F.; Rexende, R.M.; Alcantra, E.; Freitas, A.S. Nitrogen fertilization in the culture of bean. Revista Universidade Vale do Rio Verde. 2017. Available online: http://periodicos.unincor.br/index.php/revistaunincor/article/download/3141/pdf_671 (accessed on 24 November 2020).
  58. Qiao, N.; Xu, X.; Hu, Y.; Blagodatskaya, E.; Liu, E.; Schaefer, D.; Kuzyakov, Y. Carbon and nitrogen additions induce distinct priming effects along an organic-matter decay continuum. Sci. Rep. 2016, 6, 19865. [Google Scholar] [CrossRef]
  59. Wang, S.; Luo, S.; Yue, S.; Shen, Y.; Li, S. Fate of 15N fertilizer under different nitrogen split applications to plastic mulched maize in semiarid farmland. Nutr. Cycl. Agroecosyst. 2016, 105, 129–140. [Google Scholar] [CrossRef]
  60. Yi, Z.; Wang, P.; Hong, B.; Lu, L.; Yu, G. Effect of base N to dress N ratio on water and nitrogen utilization, growth of summer maize in North China Plain. II. Nitrogen accumulation and translocation of summer maize and dynamics of soil inorganic. N. Chin. J. Eco-Agric. 2008, 16, 86–90. [Google Scholar]
  61. Oliveira, R.A.; Buso, W.H.D.; Gomes, L.L.; Martins, P.H.M.; Rodovalho, R.S.; Oliveira, H.F.E. Application of controlled-release nitrogen fertilizer in irrigated common bean crops. Comun. Sci. 2019, 10, 158–167. [Google Scholar] [CrossRef]
  62. Schoninger, E.L.; Villalba, H.A.G.; Bendassolli, A.; Trivelin, P.C.O. Corn grain yield and 15N-fertilizer recovery as a function of urea sidedress timing. Anna. Braz. Acad. Sci. 2018, 90, 3299–3312. [Google Scholar] [CrossRef] [PubMed]
  63. Boschiero, B.N.; Mariano, E.; Torres-Dorante, L.O.; Sattolo, T.M.S.; Otto, R.; Garcia, P.L.; Dias, C.T.S.D.; Trivelin, P.C.O. Nitrogen fertilizer effects on sugarcane growth, nutritional status, and productivity in tropical acid soils. Nutr. Cycl. Agroecosyst. 2020, 117, 367–382. [Google Scholar] [CrossRef]
  64. Neptune, A.M.L.; Muraoka, T. Application of Urea-15N in Common Bean (Phaseolus vulgaris, L.) CV. Carioca. International Nuclear Information System. 1978. Available online: https://worldwidescience.org/topicpages/c/carioca+utilizando+15n.html (accessed on 24 November 2020).
  65. Kiehl, J.C.; Silveira, R.I.; Neto, J.B. Rates and methods of applying urea to common beans. Sci. Agric. 1993, 50, 254–260. [Google Scholar] [CrossRef]
Figure 1. Daily minimum and maximum air temperature, daily irrigation and rainfall during mild winter growing seasons of common bean ((A): 2018; (B): 2019).
Agronomy 10 01935 g001
Figure 2. Daily and cumulative losses of NH3-N in the N broadcast application at sowing (90 kg N ha−1) on soil surface (A,B) and split N application side dressing at V4 (60 kg N ha−1) common bean growth stage (C,D). Vertical bars indicate the standard error of the mean. Means followed by different letters are significantly different (p ≤ 0.05).
Agronomy 10 01935 g002
Figure 3. Effect of blends of polymer-sulfur coated urea (PSCU) and conventional urea (U) (70%PSCU + 30%U and 30%PSCU + 70%U) applied incorporated, broadcast and split on soil N mineral content during mild winter growing seasons of common bean (2018 and 2018). Vertical bars indict the standard error of the mean. Means followed by different letters are significantly different (p ≤ 0.05) at each depth.
Agronomy 10 01935 g003
Figure 4. Effect of blends of polymer-sulfur coated urea (PSCU) and conventional urea (U) (70%PSCU + 30%U and 30%PSCU + 70%U) applied incorporated, broadcast, and split on common bean yield and dry matter accumulation (aerial part) during mild winter growing seasons of common bean (2018 and 2019). Vertical bars indicate the standard error of the mean. Means followed by different letters are significantly different (p ≤ 0.05) in each common bean growth stage.
Agronomy 10 01935 g004
Figure 5. Seasonal N uptake and dry matter accumulation and partitioning during mild winter growing seasons of the common bean (2018 (A,C) and 2019 (B,D)) using blends of polymer-sulfur coated urea (PSCU) and urea (U) treated with NBPT (broadcast application: (E); incorporated application: (F); split application: (G); average of two years). The arrow indicates the maximum daily rate of dry matter and N accumulation. DAE is day after common bean emergence. The dashed line is the N derived from the fertilizer (Ndff), U treated with NBPT in the blend, in plant components during the 2019 growing season of the common bean (EG).
Agronomy 10 01935 g005
Figure 6. Daily rate of dry matter accumulation (A) and N uptake (B) (kg ha−1 day−1) in common bean during mild winter growing season (2018 and 2019), average of all treatments. Daily rate of N uptake in broadcast, incorporated and split N application (D), average of two years. (C): Chlorosis in primary leaves of common bean (V2) after broadcast application and incorporated application with 30%PSCU + 70%U (PSCU: polymer-sulfur coated urea; U: conventional urea treated with NBPT).
Agronomy 10 01935 g006
Figure 7. Effect of blends of polymer-sulfur coated urea (PSCU) and conventional urea (U) (70%PSCU + 30%U and 30%PSCU + 70%U) applied incorporated, broadcast, and split on N uptake (aerial part) during the mild winter growing season of the common bean (2018 and 2019). The dashed line is the N derived from the fertilizer (Ndff), U treated with NBPT in the blend, in the plant in 2019 growing season of common bean. Vertical bars indicate the standard error of the mean. Means followed by different letters are significantly different (p ≤ 0.05) in each common bean growth stage.
Agronomy 10 01935 g007
Figure 8. Effect of blends of polymer-sulfur coated urea (PSCU) and conventional urea (U) (70%PSCU + 30%U and 30%PSCU + 70%U) applied incorporated, broadcast and split on 15N-fertilizer recovery (aerial part) of U treated with NBPT during mild winter growing season of common bean (2018 and 2019). Vertical bars indicate the standard error of the mean. Means followed by different letters indicate difference (p ≤ 0.05) among treatments. The rate of N was 90 kg ha−1 and the results are in % of total N applied.
Agronomy 10 01935 g008
Figure 9. Correlation between common bean yield and 15N-fertilizer recovery in the grain (%) of conventional urea (U) treated with NBPT, in broadcast, incorporated, and split application using blends of polymer-sulfur coated urea (PSCU) and U. (A): average two blends (70%PSCU + 30%U and 30%PSCU + 70%U). (B): application of 30%PSCU + 70%U.
Agronomy 10 01935 g009
Table 1. Soil chemical attributes on which common bean is grown in Brazil.
DepthpHSOM 1TSN 2NH4+NO3SPKCaMgAlCEC 3AlS 4BS 5
cm g dm−3mg kg−1mg dm−3mmolc dm−3%
2018
0-205.02711301.12.430642.4297258.4566
20-404.2228833.43.1183131.31231436.34645
40-604.2208201.32.9207131.31231238.34243
2019
0-205.12713007926465.32912084055
20-404.51610009.65.267103.5198083037
40-604.4148003.24.713552.7126279926
1 SOM: soil organic matter; 2 TSN: total soil nitrogen; 3 CEC: cation exchange capacity at pH 7.0; 4 AIS: aluminum saturation; 5 BS: base saturation.
Publisher’s Note: MDPI stays neutral with regard to jurisdictional claims in published maps and institutional affiliations.

