Article

Trends on Advanced Information and Communication Technologies for Improving Agricultural Productivities: A Bibliometric Analysis

by
Dagoberto Armenta-Medina
1,2,*,
Tania A. Ramirez-delReal
1,3,
Daniel Villanueva-Vásquez
1,2 and
Cristian Mejia-Aguirre
2
1
CONACyT Consejo Nacional de Ciencia y Tecnología, Dirección de Cátedras, Insurgentes Sur 1582, Crédito Constructor, 03940 Ciudad de México, Mexico
2
INFOTEC Centro de Investigación e Innovación en Tecnologías de la Información y Comunicación, Circuito Tecnopolo Sur No 112, Fracc. Tecnopolo Pocitos II, 20313 Aguascalientes, Mexico
3
CentroGEO Centro de Investigación en Ciencias de Información Geoespacial, Circuito Tecnopolo Norte No. 117, Col. Tecnopolo Pocitos II, 20313 Aguascalientes, Mexico
*
Author to whom correspondence should be addressed.
Submission received: 14 November 2020 / Revised: 5 December 2020 / Accepted: 9 December 2020 / Published: 18 December 2020
(This article belongs to the Special Issue Automation for Digital Farming)

Abstract

:
In this work, an exhaustive revision is given of the literature associated with advanced information and communication technologies in agriculture within a window of 25 years using bibliometric tools enabled to detect of the main actors, structure, and dynamics in the scientific papers. The main findings are a trend of growth in the dynamics of publications associated with advanced information and communication technologies in agriculture productivity. Another assertion is that countries, like the USA, China, and Brazil, stand out in many publications due to allocating more resources to research, development, and agricultural productivity. In addition, the collaboration networks between countries are frequently in regions with closer cultural and idiomatic ties; additionally, terms’ occurrence are obtained with Louvain algorithm predominating four clusters: precision agriculture, smart agriculture, remote sensing, and climate smart agriculture. Finally, the thematic-map characterization with Callon’s density and centrality is applied in three periods. The first period of thematic analysis shows a transition in detecting the variability of a nutrient, such as nitrogen, through the help of immature georeferenced techniques, towards greater remote sensing involvement. In the transition from the second to the third stage, the maturation of technologies, such as unmanned aerial vehicles, wireless sensor networks, and the machine learning area, is observed.

1. Introduction

From the origins of humanity, man has needed to transform his environment through techniques that allow him to obtain the necessary food for his subsistence. This need for food subsistence has given rise to agriculture. Over the centuries, agriculture has been developing through the inclusion of emerging technologies, to achieve more efficient management of agricultural inputs and a higher level of crop productivity. At the beginning of the 20th century, the integration of chemical fertilizers, mechanization, and scientific knowledge allowed a notable development of agriculture [1]. Later, in the middle of the 20th century, the appearance of the tractor, seed improvement, and agrochemicals lead to the green revolution [2].
The green revolution represented a breakthrough in terms of agricultural productivity. However, it also brought enormous consequences, such as dependence on pesticides and herbicides, pollution of water and soil, and loss of biodiversity due to the planting of large areas of monocultures [3,4]. As a counterpart to the harmful effects of the green revolution, the concept of sustainable agriculture is born, which seeks to make efficient use of resources that guarantee the levels of productivity that the world population demands, seeking the least ecological impact [5]. The aforementioned represents a significant challenge since the estimation of the growth of the world population in 2050 is 9.7 billion people, generating an increase of up to 70% in demand for food, without considering the complexity of mitigation of climate change [6].
Converge in electronics, data science, and information and communication technologies, with agriculture derived in the now called precision agriculture and smart agriculture (here defined as advanced information and communication technologies in agriculture). By the mid-1990s, the term precision agriculture was established as a new paradigm in agriculture [7]. Precision agriculture appeared to apply the accurate management of the crop in the correct place and time [8], for proper decision-making in agricultural [9]. The purposes followed in agriculture through the use of new technology are several: to maintain quality, to increase productivity [10], and to monitor physical aspects related to crops, for example, soil nutrition and erosion [11].
Another relevant term is smart agriculture, although used interchangeably by some authors as a synonym of precision agriculture, is a more recent term which dates from the beginning of 2010. This concept is usually associated with the use of last generation sensor networks for data transmission, storage, and processing in real-time for decision-making in agriculture [12,13].
The term smart agriculture is closely associated with the internet of things (IoT), which in turn is related to other definitions, such as smart cities and smart health, among others. These terms probably have been influenced by European funding calls, for example, the European Union’s Research and Innovation funding program or current program Horizon 2020 [13]. Some authors have begun to refer to the term smart agriculture as a modern definition of the concept of precision agriculture [13].
In this work, the two terms of precision agriculture and smart farming are integrated, in the concept of advanced information and communication technologies (ICT) in agriculture.
This concept, through technological implements, seeks to manage more efficiently the temporary space variables of agricultural inputs, achieving higher economic performance and reducing environmental impact, in addition to taking advantage of the data generated by these implements for adequate decision-making in crop management [14,15].
Advanced ICT in agriculture allows unifying different concepts and extending the meaning without referring in a particular way (precision agriculture, smart agriculture, smart farming) depending on each author’s definitions.
Advanced ICT in agriculture is still in the process of maturation, and its application is not widespread in the world. However, on the academic side, there has been an explosion of scientific literature. The emergence of advanced ICT in agriculture has been observed since the 1990s, with considerable growth in literature in recent years. Derived from the above, an exhaustive review of 25 years of scientific research associated with the field of advanced ICT in agriculture through performance analysis is relevant.
Bibliometrics is a successful approach for assessing trends and analyze the impact of research outputs [16] through performance analysis and science mapping. The performance analysis reveals the main actors: universities, countries, and authors, allowing the understanding of the environments that favor the development of the field. In the same way, through science mapping techniques, the structure and dynamics of the field can be revealed, allowing a comprehensive knowledge about the trends over the years and the main thematic areas and its collaboration networks.
Previous works have studied the evolution of precision agriculture by applying bibliometrics, but the authors only focus on journals, terms, and countries, especially in Italy; they limited it to a local perspective, and the science mapping method is only related to terms of precision agriculture, forestry, viticulture, farming, and aquaculture [17]. Additionally, other works are center on a specific technology, such as IoT [18]. This work proposes a global view of using advanced ICT on agriculture (smart and precision) in published papers, particularly all collections of databases in Web of Science.
This paper is structured as follows: Section 2 introduces the methods. Section 3 presents the results and discussion. Finally, Section 4 describes the conclusions of the study.

2. Method

2.1. Bibliographic Recovery

A bibliometric analysis was performed using the web of knowledge database on the scientific published papers [19,20] related to worldwide advanced ICT in agriculture. For the bibliographic search is used the following keywords: ((TS = (“smart agriculture” OR (“smart farming” AND agriculture) OR “Precision agriculture”))). In this way, 2633 records were found between 1994 and 2018 to be associated with worldwide advanced ICT in agriculture. This bibliography was used to evaluate productivity in conjunction with the structure and dynamics of advanced ICT in agriculture using the bibliometrix [21] library in R programming language [22]. To assess productivity, the number of publications is measured over the years, detecting the authors, countries, and foreign collaborating institutions with higher productivity.

2.2. Country First Author Papers

To quantify the contribution of advanced ICT in agriculture literature by country, we seek to identify the country where the affiliation of the first author associated with each paper is located. The outstanding number of first author’s papers for a country implies a relevant contribution of the country to the literature.

2.3. Co-Word, Collaboration, and Co-Citations Networks

After generating a network of co-occurrence of words [23] contained in the author’s keywords of papers, the stop words were eliminated to calculate the co-occurrence index of the words. The frequency of co-occurrence of two words determined by counting the number of documents in which two words appear together in the author’s keywords section. A network from the 30 nodes is constructed, belonging to the words extracted from the keywords with the highest degree of co-occurrence according to the association strength index considered as the most appropriate metric for the normalization of co-occurrences frequencies [24,25]. In Equation (1), C i j is the count of publications in which two keywords i and j co-occur, and C i and C j represent the count of publications in which each one appears.
e i j = c i j 2 / c i c j .
The word co-currency clusters are observed in colors, according to the Louvain clustering algorithm [26]. The country and institution collaboration networks were generated using the top 30 nodes (outstanding countries and outstanding institutions) and the Louvain clustering algorithm. The journal co-citation network was generated using the top 30 nodes (leading cited journals) and the Louvain clustering algorithm.

2.4. Theme Selection

Once the abstracts were obtained, the words contained in the author’s keywords sections were chosen for co-word analysis [23]. The next step is the calculation of similarities based on the frequency of co-occurrences of authors’ keywords, using the association strength metric for the normalization of co-occurrences frequencies [24,25].
The final step was clustering for the location of subgroups of words that are strongly linked with each other using the simple center algorithm [24]. The simple centers’ algorithm is well known in many studies in the context of word-matching [27,28] and automatically returns the clusters labeled (theme name) by using different parameters, such as minimum word frequency and cut-off values, for the co-occurrence. In addition, the algorithm has two parameters to limit the size of the detected themes, the maximum and minimum sizes of the network, which can be adjusted by experts in the field.
The 300 most abundant authors keywords for the 25 years of literature, and a minimum word cluster frequency of 5 was used as parameters. Prior to to word selection, stop words were removed and subsequently submitted to a stemming process, using the snowballC library [29] in the R language, in order to select the most relevant terms and reduce redundant terms, respectively. SnowballC implements Porter’s word stemming algorithm for collapsing words to a common root to aid comparison of concepts, avoiding prefix or suffix and sub-count words of the same concept, for example, singular and plural concepts.

2.5. Strategic Diagrams

Co-word analysis used to map science was used to obtain word clusters and their interconnections. The previous thematic selection procedure was used to obtain word clusters and their interconnections. These clusters are topics or themes, and each research topic obtained in this process is characterized by two parameters: Callon’s density and centrality [24]. Centrality evaluates the degree of interaction among clusters defined as Equation (2) with k a keyword belonging to the theme, and h a keyword belonging to other themes. The density measure defined as Equation (3) can evaluate the internal strength of the clusters, with keywords i and j belonging to the theme, and w is the keyword count in the theme.
c = 10 × e k h ,
d = 100 ( e i j / w ) .
Strategic diagrams are a two-dimensional space constructed by graphing topics according to their ranking of values in density and centrality used to classify the themes into four quadrants [24,27,30]. The strategic diagrams used here were considered to have a better interpretation of the results employing the categorization of the different themes [30].
Themes in the upper right quadrant are those that are well developed and are essential for the structuring of the research field and are externally related to concepts applicable to other themes.
Themes in the upper left quadrant, are specialized themes that maintain well-developed internal but not external relationships.
Themes in the lower left quadrant are considered marginal and underdeveloped due to their low density and centrality in the network.
Themes in the lower right quadrant group are basics general and transversal themes in such a way that the research field can be understood by a set of research themes mapped in a two-dimensional space through the X and Y axes.
The ratio of the spheres associated with a theme is proportional to documents number corresponding to each keyword of a theme. Each thematic network is labeled using the name of the most significant word associated with the theme (usually identified as the most central word in the theme).
Three periods of time were used to analyze the strategic diagrams of the area. The first period comprehends the years from 1994 to 2002 with 185 publications, the second period the years from 2003 to 2010 with 1035 publications, and the last period from 2011 to 2018 with 1813 publications. For the last two periods, periods of 8 years are considered, unlike the first period that was extended to 9 years.

3. Results and Discussion

The bibliometric analysis of the publications associated with the area of advanced ICT in agriculture is divided into two sections. The first section shows and discusses the results of the performance analysis of the most relevant institutions, countries, authors, and papers in the area. The second section is focused on discussing the results of science mapping, specifically those derived from collaborative and co-citation networks analysis, additionally to thematic map strategic analysis at different stages of advanced ICT in agriculture.

3.1. Performance Analysis

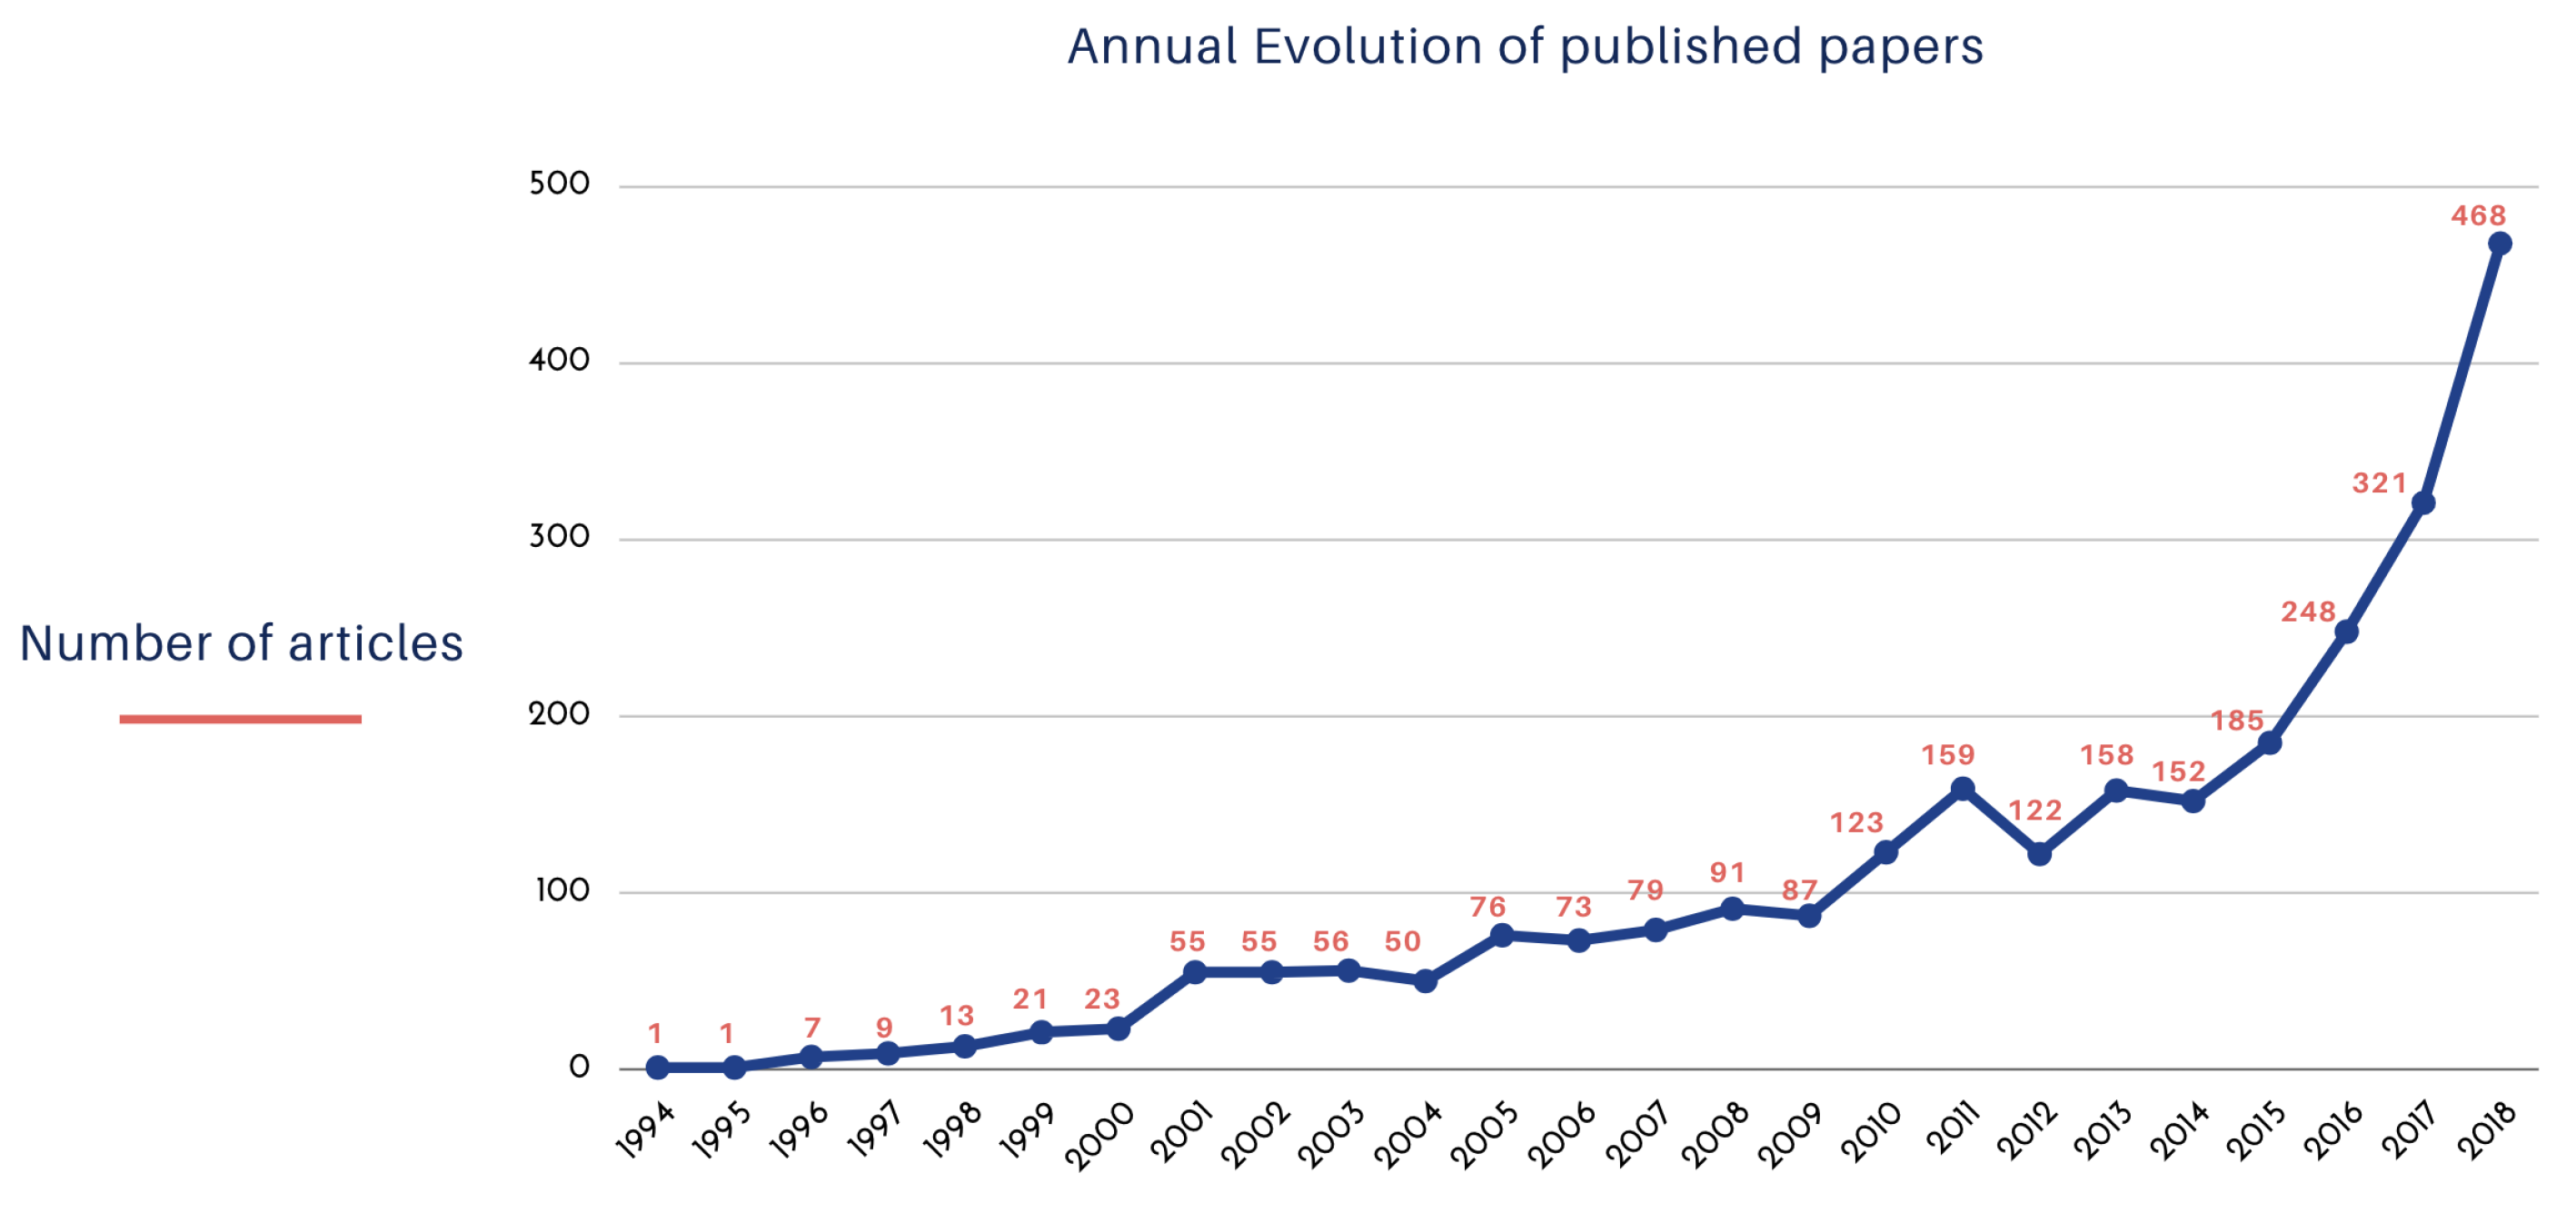
3.1.1. Publications Dynamics

The trend in growth in publications in the field of advanced ICT in agriculture over the annual evolution of the published paper is shown in Figure 1. The X-axis indicates the year, and Y-axis indicates the number of published papers. These growing dynamics of publications worldwide has been promoted by greater availability of open hardware, platforms, and software, as well as national and international efforts in financing for the development of advanced technology agriculture [31,32,33]. Specifically, Arduino has been the open hardware platform that, starting in 2010, began to be implemented in amateur projects followed in its use in the development of scientific applications [32,34]. This platform allows controlling the connection to a network of different electronic devices interacting with various variables applied in precision farming. Therefore, the acquired measurements are analyzed by applied statistical techniques, thus, generating solutions for the area [35].
Other factors that have favored the development of the area are the opening of the Global Position System (GPS) since 2000 to the public domain by the United States (U.S.) Department of Defense [7], the evolution in spatial, temporal, and spectral precision of the satellites and improvements of the new generations of wireless sensor networks (WSNs) among other technologies [12,36,37]. Public worldwide investment in agricultural research and development grew from only 5.4 billion USD in 1960 to 33.7 billion USD for 2009, growing at an average rate of 3.36% per year [38]. In public investment, in the European nations, more than 200 projects related to smart agriculture are supported by the Horizon 2020, which is an initiative of European financing in agriculture and forest conservation [39]. In addition, on the side of private investment in agricultural research and development, excluding the food industry, it grew from 5.1 billion USD in 1990 to 15.6 billion USD in 2014 [31]. Summarizing the convergence of various factors, such as public-private investment, technological development of open hardware and software are favoring the growth of scientific publications in the area of advanced ICT in agriculture.

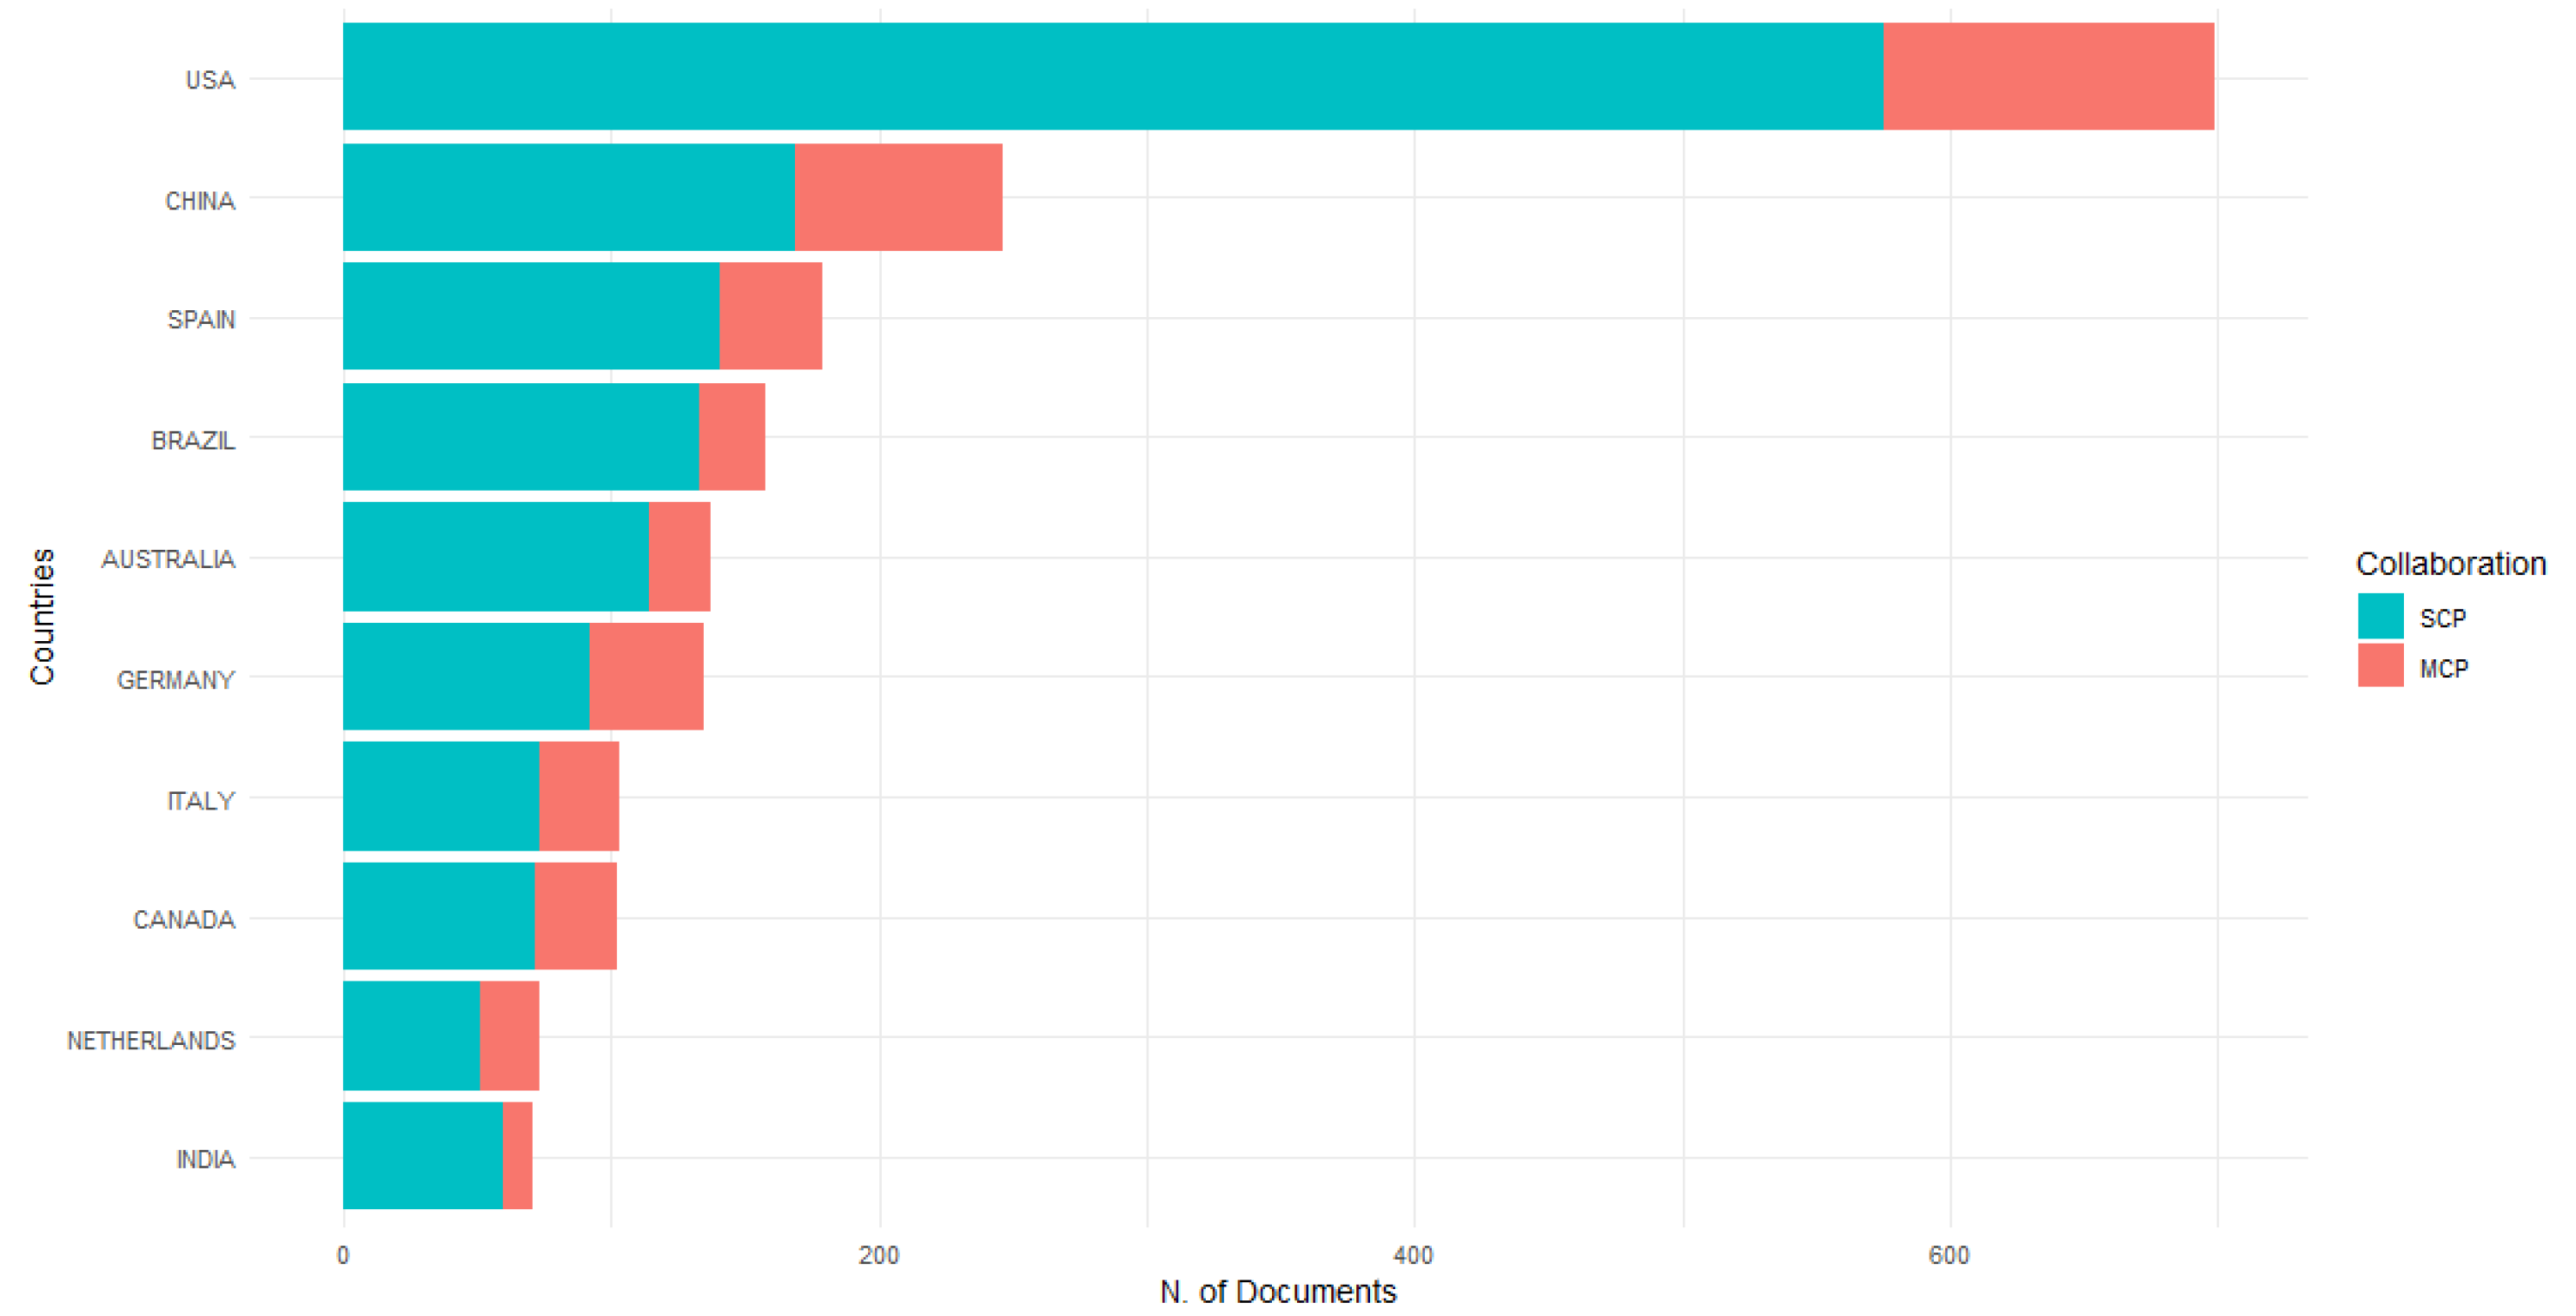
3.1.2. Most Relevant Countries

In general, the countries that invest most in research and development are those that produce the highest number of publications [31,40,41,42,43]; in the case of publications referring to the topic of advanced technology agriculture are countries with substantial investment in research and development, as well as those that maintain high levels of agricultural production. In Figure 2, within the ten most relevant countries in publications number to the field of advanced technology agriculture is the United States; the above is not surprising since the United States leads the field of information and communication technologies [44], in addition to being of the number one countries in agricultural exports with around 135 billion USD per year [45]. In 2011, the United States Department of Agriculture (USDA) generated a report showing that more than 70 percent of U.S. farmers with annual sales of more than 250,000 USD use IoT technology and small farmers around 41 percent [37]. The United States not only tops the list of countries with the highest agricultural exports but historically stands out in the budget designated for research and development [33]. To give an example in the fiscal year 2015, the USA spent about 140 billion USD of its budget on improving the production and productivity of the agricultural sector [39].
In Figure 2, China stands out as second in the number of publications; unlike the United States, in addition to its high agricultural production, its high level of population demands large amounts of food, so, despite being the leading agricultural producer, it is not the largest exporter [46]. In terms of purchasing power parity, recent studies show that, in recent years, China has become the country with the most significant public and private investment in agricultural research and development [33], which is reflected in its outstanding number of papers associated with the area of advanced ICT in agriculture. Since the beginning of the 21st century, the Chinese government has recognized new technological trends in agriculture by planning the national science and technology project in agriculture to favor food supplies for 1.6 billion people in the middle of the 21st century, according to projections [47].
Thanks to these public policies, advanced technology agriculture in China is a fact not only in Chinese university research centers, such as China Agricultural University and Zhejiang University, but also at the level of application in the field, for example, in Heilongjiang province, in Manchuria, a massive program was created for the evaluation of precision agriculture technologies in large state farms that together exceed 20 thousand hectares [48].
Collaborative agreements between private and public initiatives have also been crystallized, for example, between the Beijing Minister of Education and Shanghai Precision Information Co Ltd., in the development of advanced technology laboratories in agriculture [47]. In general, it is public support in conjunction with private interest to favored research and, consequently, the technological and scientific production associated with agriculture. Brazil also occupies a prominent place in the number of publications associated with the area of advanced ICT in agriculture. The above may reflect the importance of this economic activity in the country and its growing development in recent years. In the 80s and 90s, Brazil had a considerable increase in its agricultural productivity derived from public policies, which favored exports, followed by a considerable decrease in import taxes on agricultural inputs, which favored adopting new technologies in agriculture [49]. Currently derived from the recognition of agricultural innovations, Brazil stands out as one of the countries with the highest investment in research and development in agriculture, which, together with its characteristics of great territorial extension, has kept it as a leader in agricultural exports [50].
On the side of advanced technology agriculture, in the European countries, more than 200 projects related to smart agriculture are supported by the horizon 2020 policy, which is a European financing initiative in agriculture and forest conservation [39]. From 2016 to 2017, the 2020 horizon offers a budget of 560 million USD to enhancement farm productivity and sustainability [39]. Within the European Union, the countries that stand out in the number of publications associated with advanced technology agriculture are Spain, Germany, Italy, and the Netherlands. Interestingly, these countries also stand out at the top of countries that export agricultural products. In addition, all these countries, except Spain, are at the top in public investment in agricultural research and development [33]. Specifically, in Spain, despite not being among the top countries in public investment, private investment in agriculture seems to be favoring the development of advanced technology agriculture [51].
Spain is a leading global exporter of fresh fruits and vegetables, which had generated enormous attraction in the private sector, describing significant increases in private investment since 1986 when it became part of the European economic community [51]. In fact, at present, specifically, programs, such as Agrotech, proposed by Microsoft, EFOR, and Libelium, leading companies in information and communication hardware and technologies in conjunction with the Ibercaja bank, are responsible for promoting financing for agronomists in projects that involve the introduction and adoption of smart agriculture [52]. Other outstanding countries in the number of publications outside the European Union are Australia and Canada. Canada is also among the top countries in both export levels and public investment in agricultural research and development [33], which could be favoring its outstanding number of publications. On the other hand, Australia has been a country with outstanding agricultural export levels, with around 40 billion USD worth of goods per year, according to data from the world bank [39]. Although, in this country, in recent years, there has been a decrease in public investment in agricultural research and development, there has been an increase in the private sector side [53].
The Australian government, trying to reverse this trend and identifying the agricultural sector as a key, it has generated a plan that favors the growth of agriculture by investing 4 billion USD to its farmers in the coming years [39]. This plan promotes the adoption of intelligent technologies backed by researchers in conjunction with the public and private sectors. Historical support in agricultural research and development has influenced Australia’s position among the top publishing countries associated with advanced technology agriculture [33].
Finally, India is the country that has most recently climbed to the top countries in investment in agricultural research and development [33], which, together with its leading position in human resources trained in information and communication technologies, favors its outstanding position in the number of research papers.

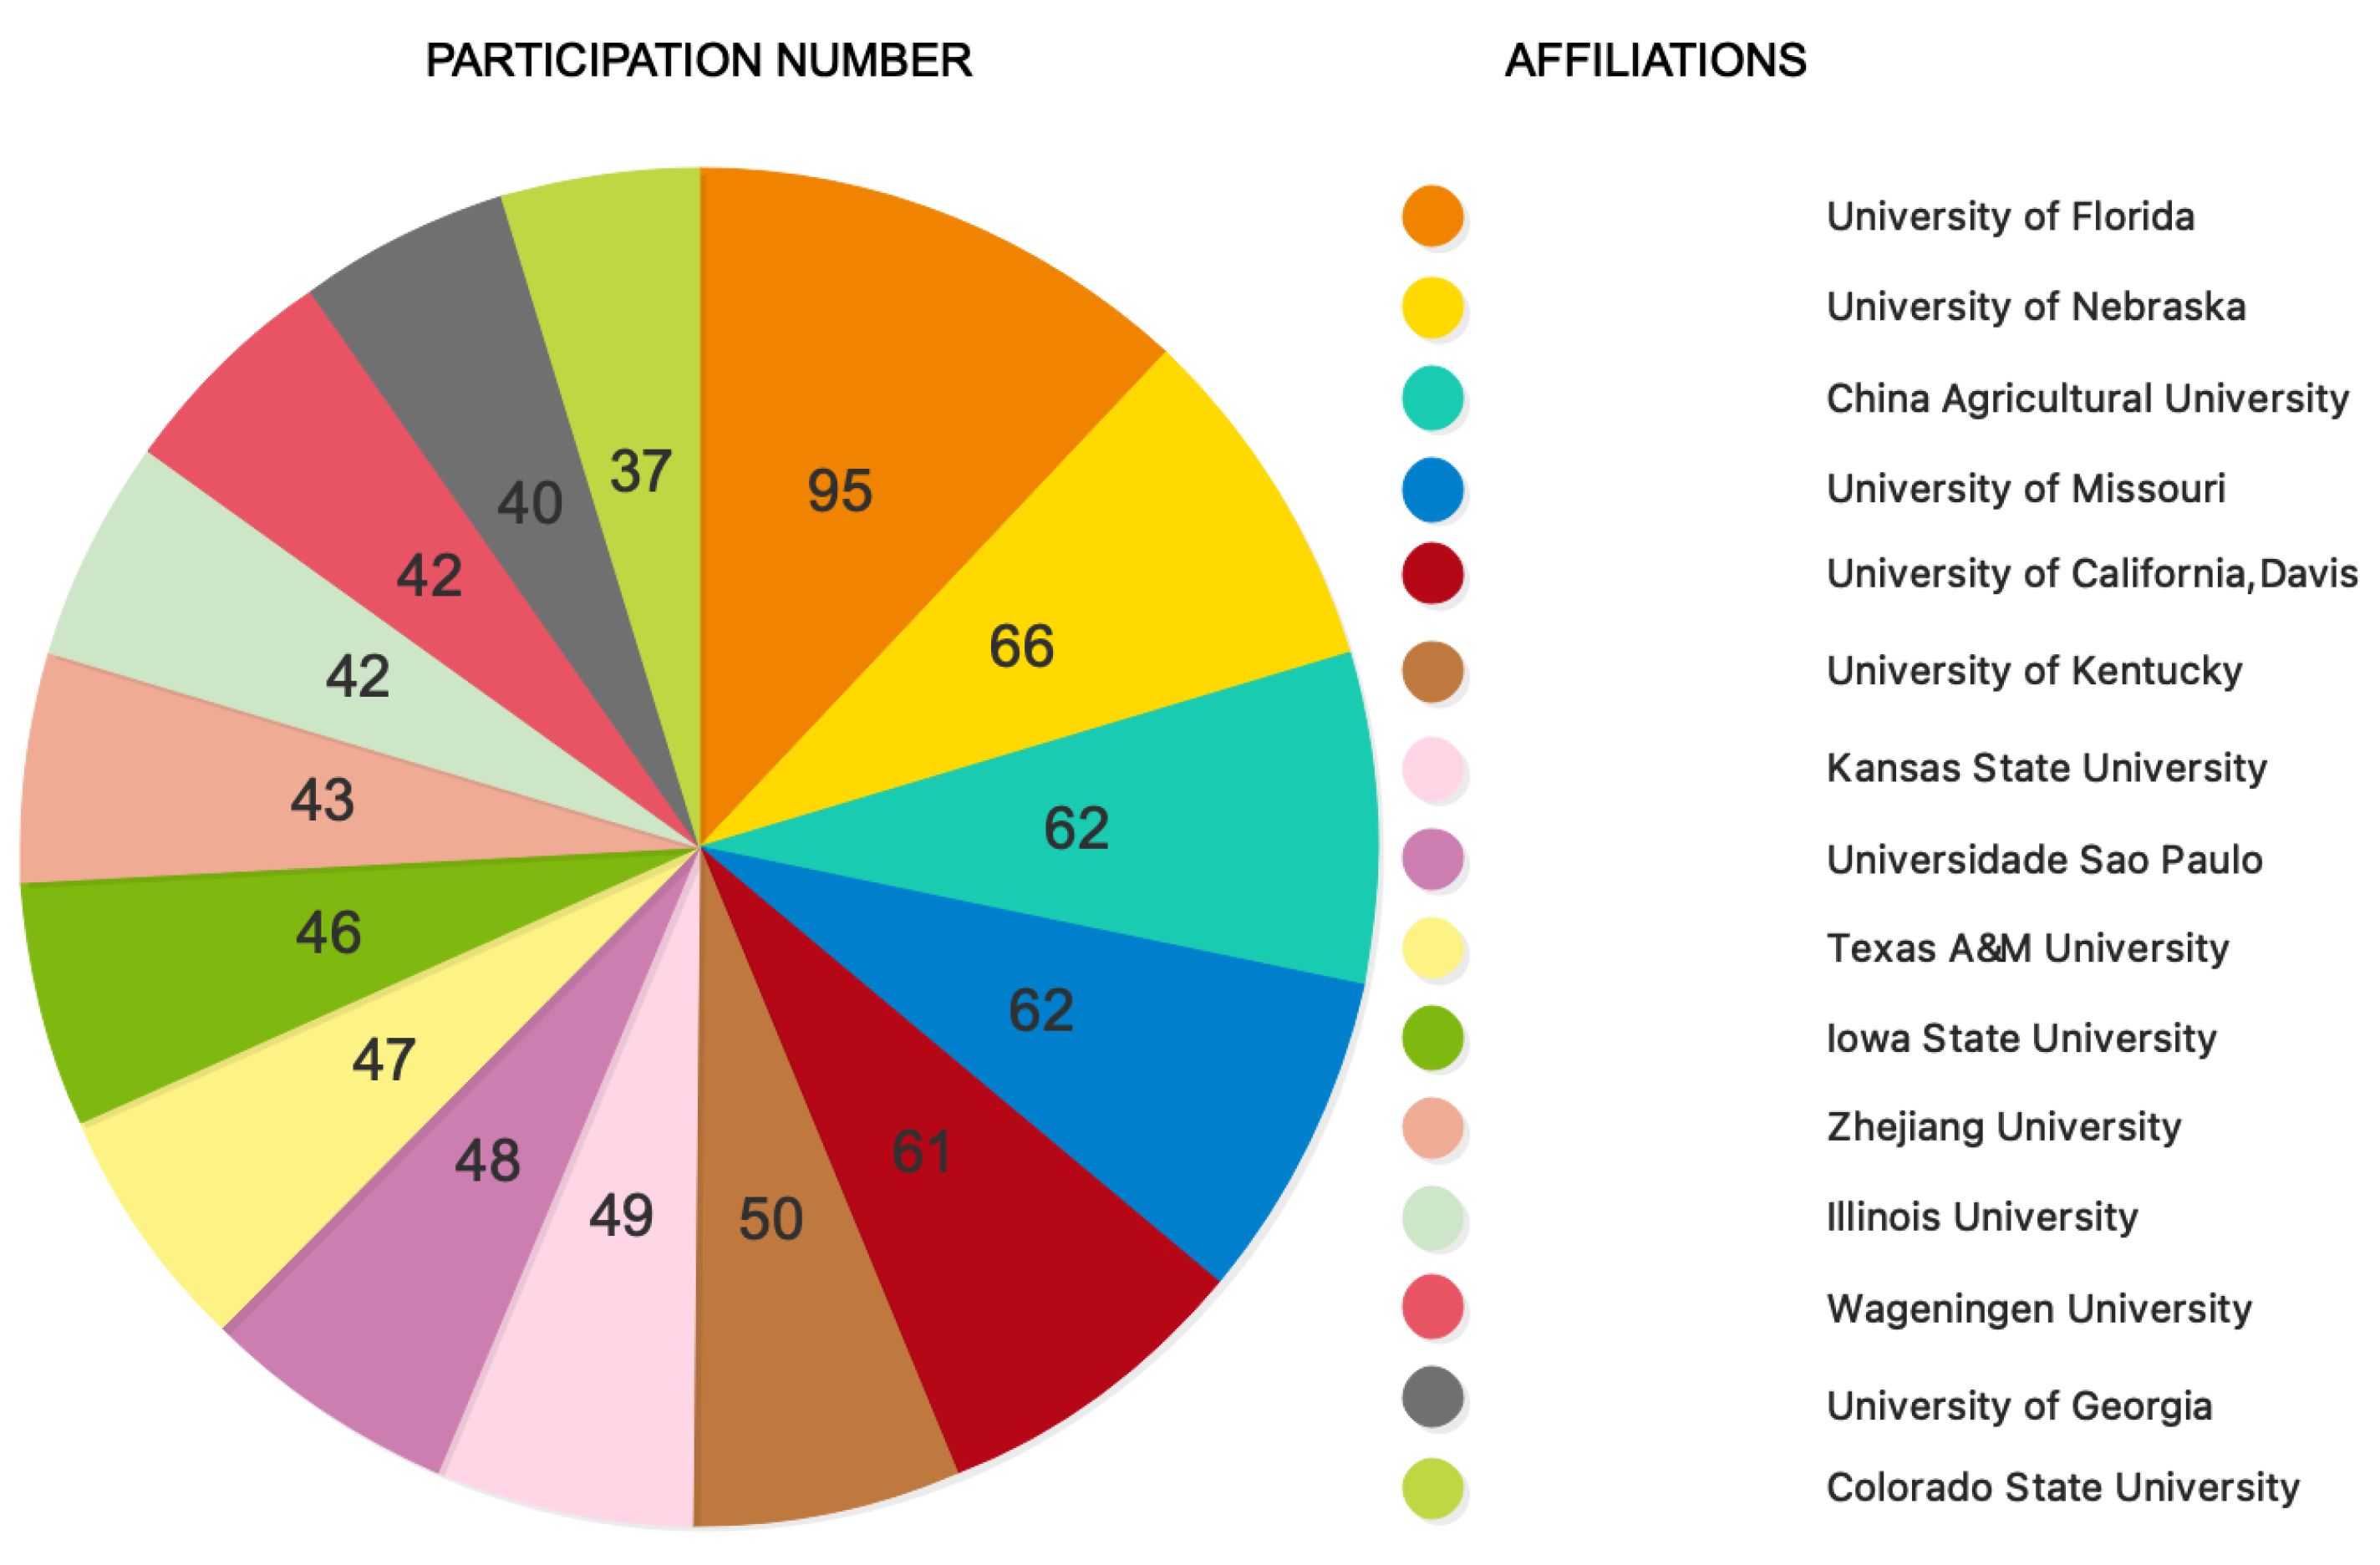
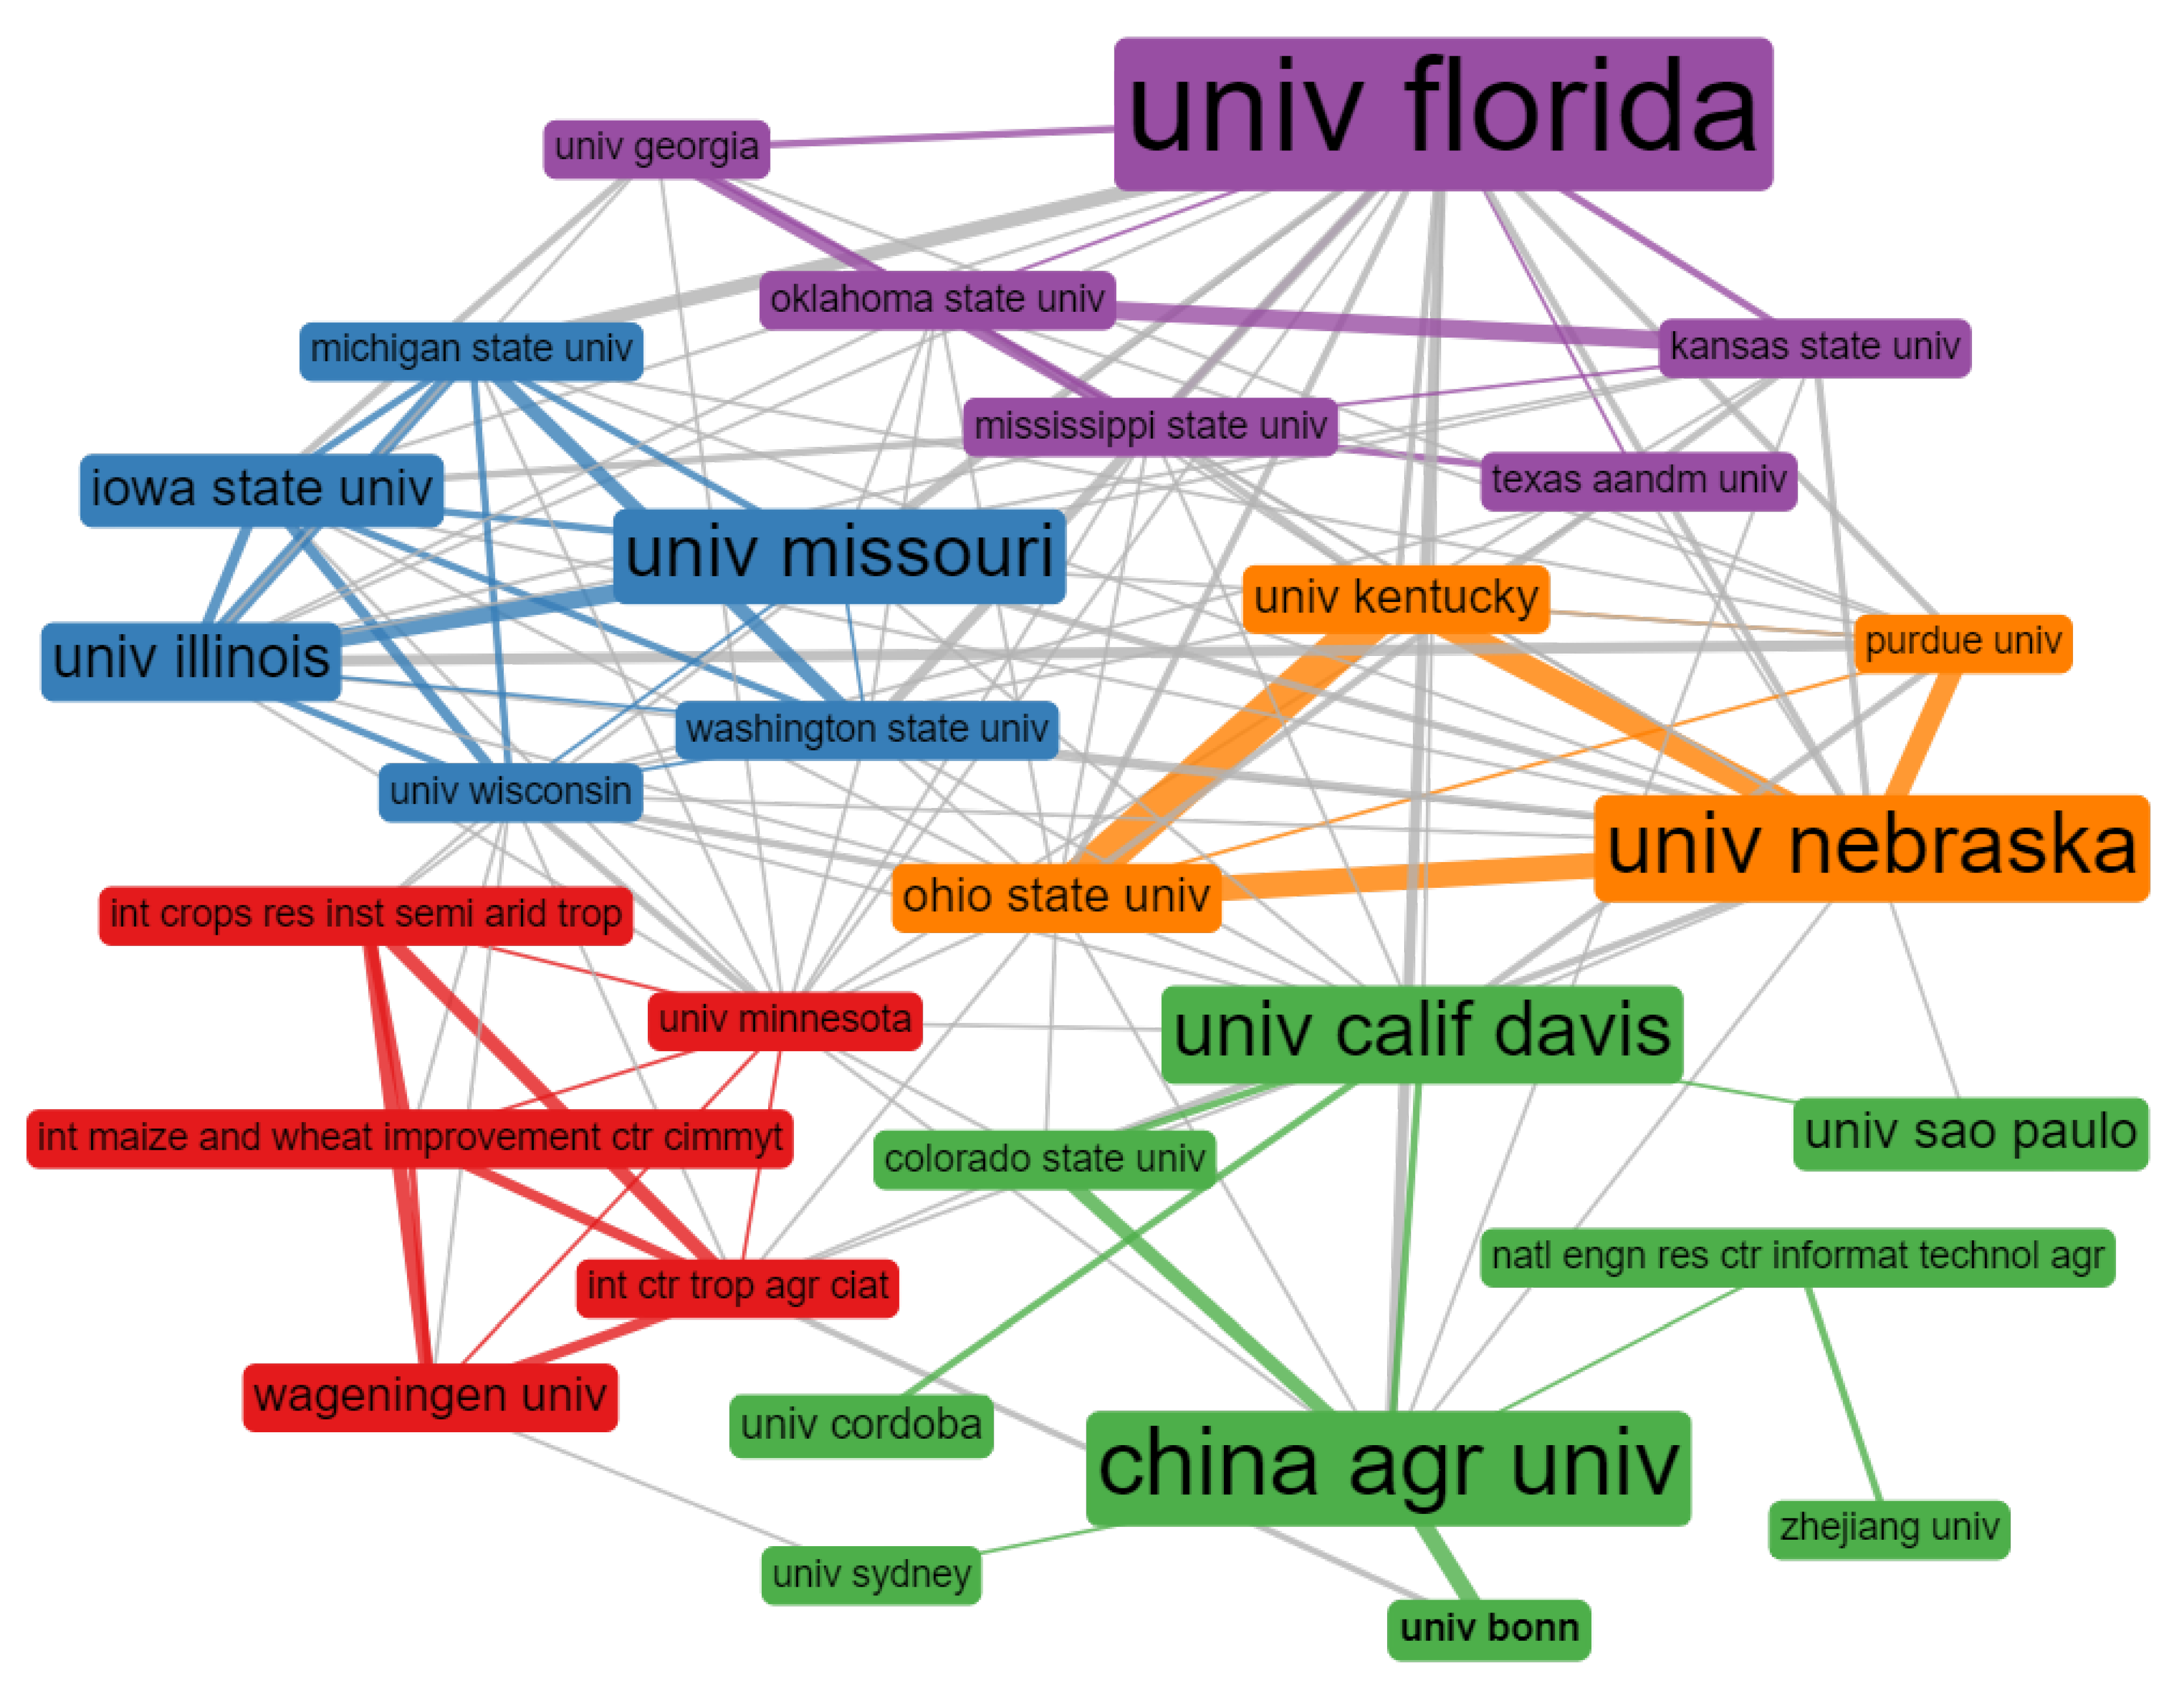
3.1.3. Most Relevant Institutions

Of the institutions with the highest scientific productivity in the area of technology agriculture, the state universities of the USA stand out, which in turn are located in the top states in agricultural production and export (see Figure 3). Consistent with our studies of scientific productivity at the country level, the top institutions associated with advanced technology agriculture outside the United States are institutions belonging to China, Brazil, and the Netherlands. Specifically, the university with the highest number of papers associated with advanced ICT in agriculture is the University of Florida. The state of Florida is distinguished by its high levels of agricultural production and export [54]. Mainly, its production focuses on non-traditional crops, such as fruits and vegetables. Florida is first in the United States in the production of citrus and the first place in vegetable production and use of greenhouses [55]. This diversity in agricultural production of the Florida state probably also promotes the research and development of a diversity of agricultural technological solutions, which is reflected in the number of publications of the University of Florida, one of the main educational institutions of the state.
Other outstanding universities in the United States are the universities of Nebraska, Missouri, and California. These states are also distinguished in their levels of agricultural production and export. Specifically, the state of Nebraska excels in the production of more traditional crops, being a leader in the production of corn, and with high levels of production in soybeans, wheat, and grain sorghum [56]. Besides, the most outstanding economic activities of Nebraska are the production of chemicals (pesticides and fertilizers) and Machinery (farm, telecommunications, and scientific equipment) [57], the synergy of economic activities and their influence could explain why the University of Nebraska is within the leading institutions at the international level in terms of scientific production associated with advanced ICT in agriculture.
Furthermore, at the University of Nebraska—Lincoln is located an important OECD test Lab at the worldwide level for tractors, so there are a long tradition and high competence in agricultural mechanization and machinery [58,59].
The University of Missouri excels in third place, where, just as Nebraska, the economy of the state of Missouri stands out for its agricultural production in traditional crops and also a greenhouse [60]. It is estimated that, from 2012 to 2017, there has been a 20% increase in the market value of Missouri agriculture sold products, including nursery and greenhouse [61]. In addition, after agriculture, its main economic activity is the production of transportation machinery and food industry [62]. The University of California is another of the leading producers of papers associated with advanced technology agriculture; in the same way as the states associated with the universities mentioned above, California stands out in the first place of agricultural production [63], as well as a world leader of computer machinery production [64].
Institutions outside the United States are led by Chinese universities, specifically China Agricultural University and Zhejiang University (see Figure 3). The China Agricultural University was formed in 1995 by the merger of the Beijing Agricultural Engineering University and the Beijing Agriculture University, with the background of the latter institution dating back to 1949 and inheriting its trajectory in agricultural studies [65]. In addition, the agricultural college of Zhejiang University has a history of more than 100 years, being one of the central educations and research institutions in China. The Chinese government has focused its efforts on investment in agricultural research and development, according to the higher population and demand for food [46]. In addition to China, Brazil and the Netherlands excel in institutions with high levels of production of scientific-technological papers associated with the area of advanced ICT in agriculture, the University of Sao Paulo, and the University of Wageningen, respectively, as seen in Figure 3. On the Brazilian side, the University of Sao Paulo is the largest and most prestigious public university in Brazil, so its high levels of scientific production are representative of the high investment in research and development in agriculture for the government [38,66].
In the Netherlands, the public university of Wageningen is located in the region called food valley; as its name describes it, this region concentrates a large number of multinationals, which in turn agglomerate a large number of human resources related to food sciences and technological development. The context where this university is located, together with the high Dutch public investment in agriculture, explains why this institution is at the top of scientific production associated with the area of advanced technologies in agriculture.
Interestingly, another independent work coincides with our results regarding the relevance of the institutions on the field of advanced ICT in agriculture. Specifically, the study carried out by the electronic magazine specialized in precision agriculture ‘precisionAg’ [67], which focuses on detecting the most outstanding 4-year academic programs in precision agriculture offered by schools and universities worldwide. The methodology used by the magazine was based on consulting experts in the industry associated with precision agriculture and Internet research; in this first stage, a list of institutions was generated from which those responsible for educational programs were interviewed to provide a self-assessment and peer review, including in the list those schools that were thought to have the best reputation in education and research in precision agriculture [67]. Despite the differences in the methodology, except for three universities, all the outstanding institutions in publication number are among the top universities with the best academic offers in precision agriculture. The above reflects that our approach can be a good indicator in the detection of universities with outstanding academic level. The other three institutions that are not in the top of academic offers in the area but outstanding in publication number are the Chinese universities and the University of Illinois. These previous discrepancies could be due to the characteristic of used methodologies, such as the restriction in the detection of 4-year programs.

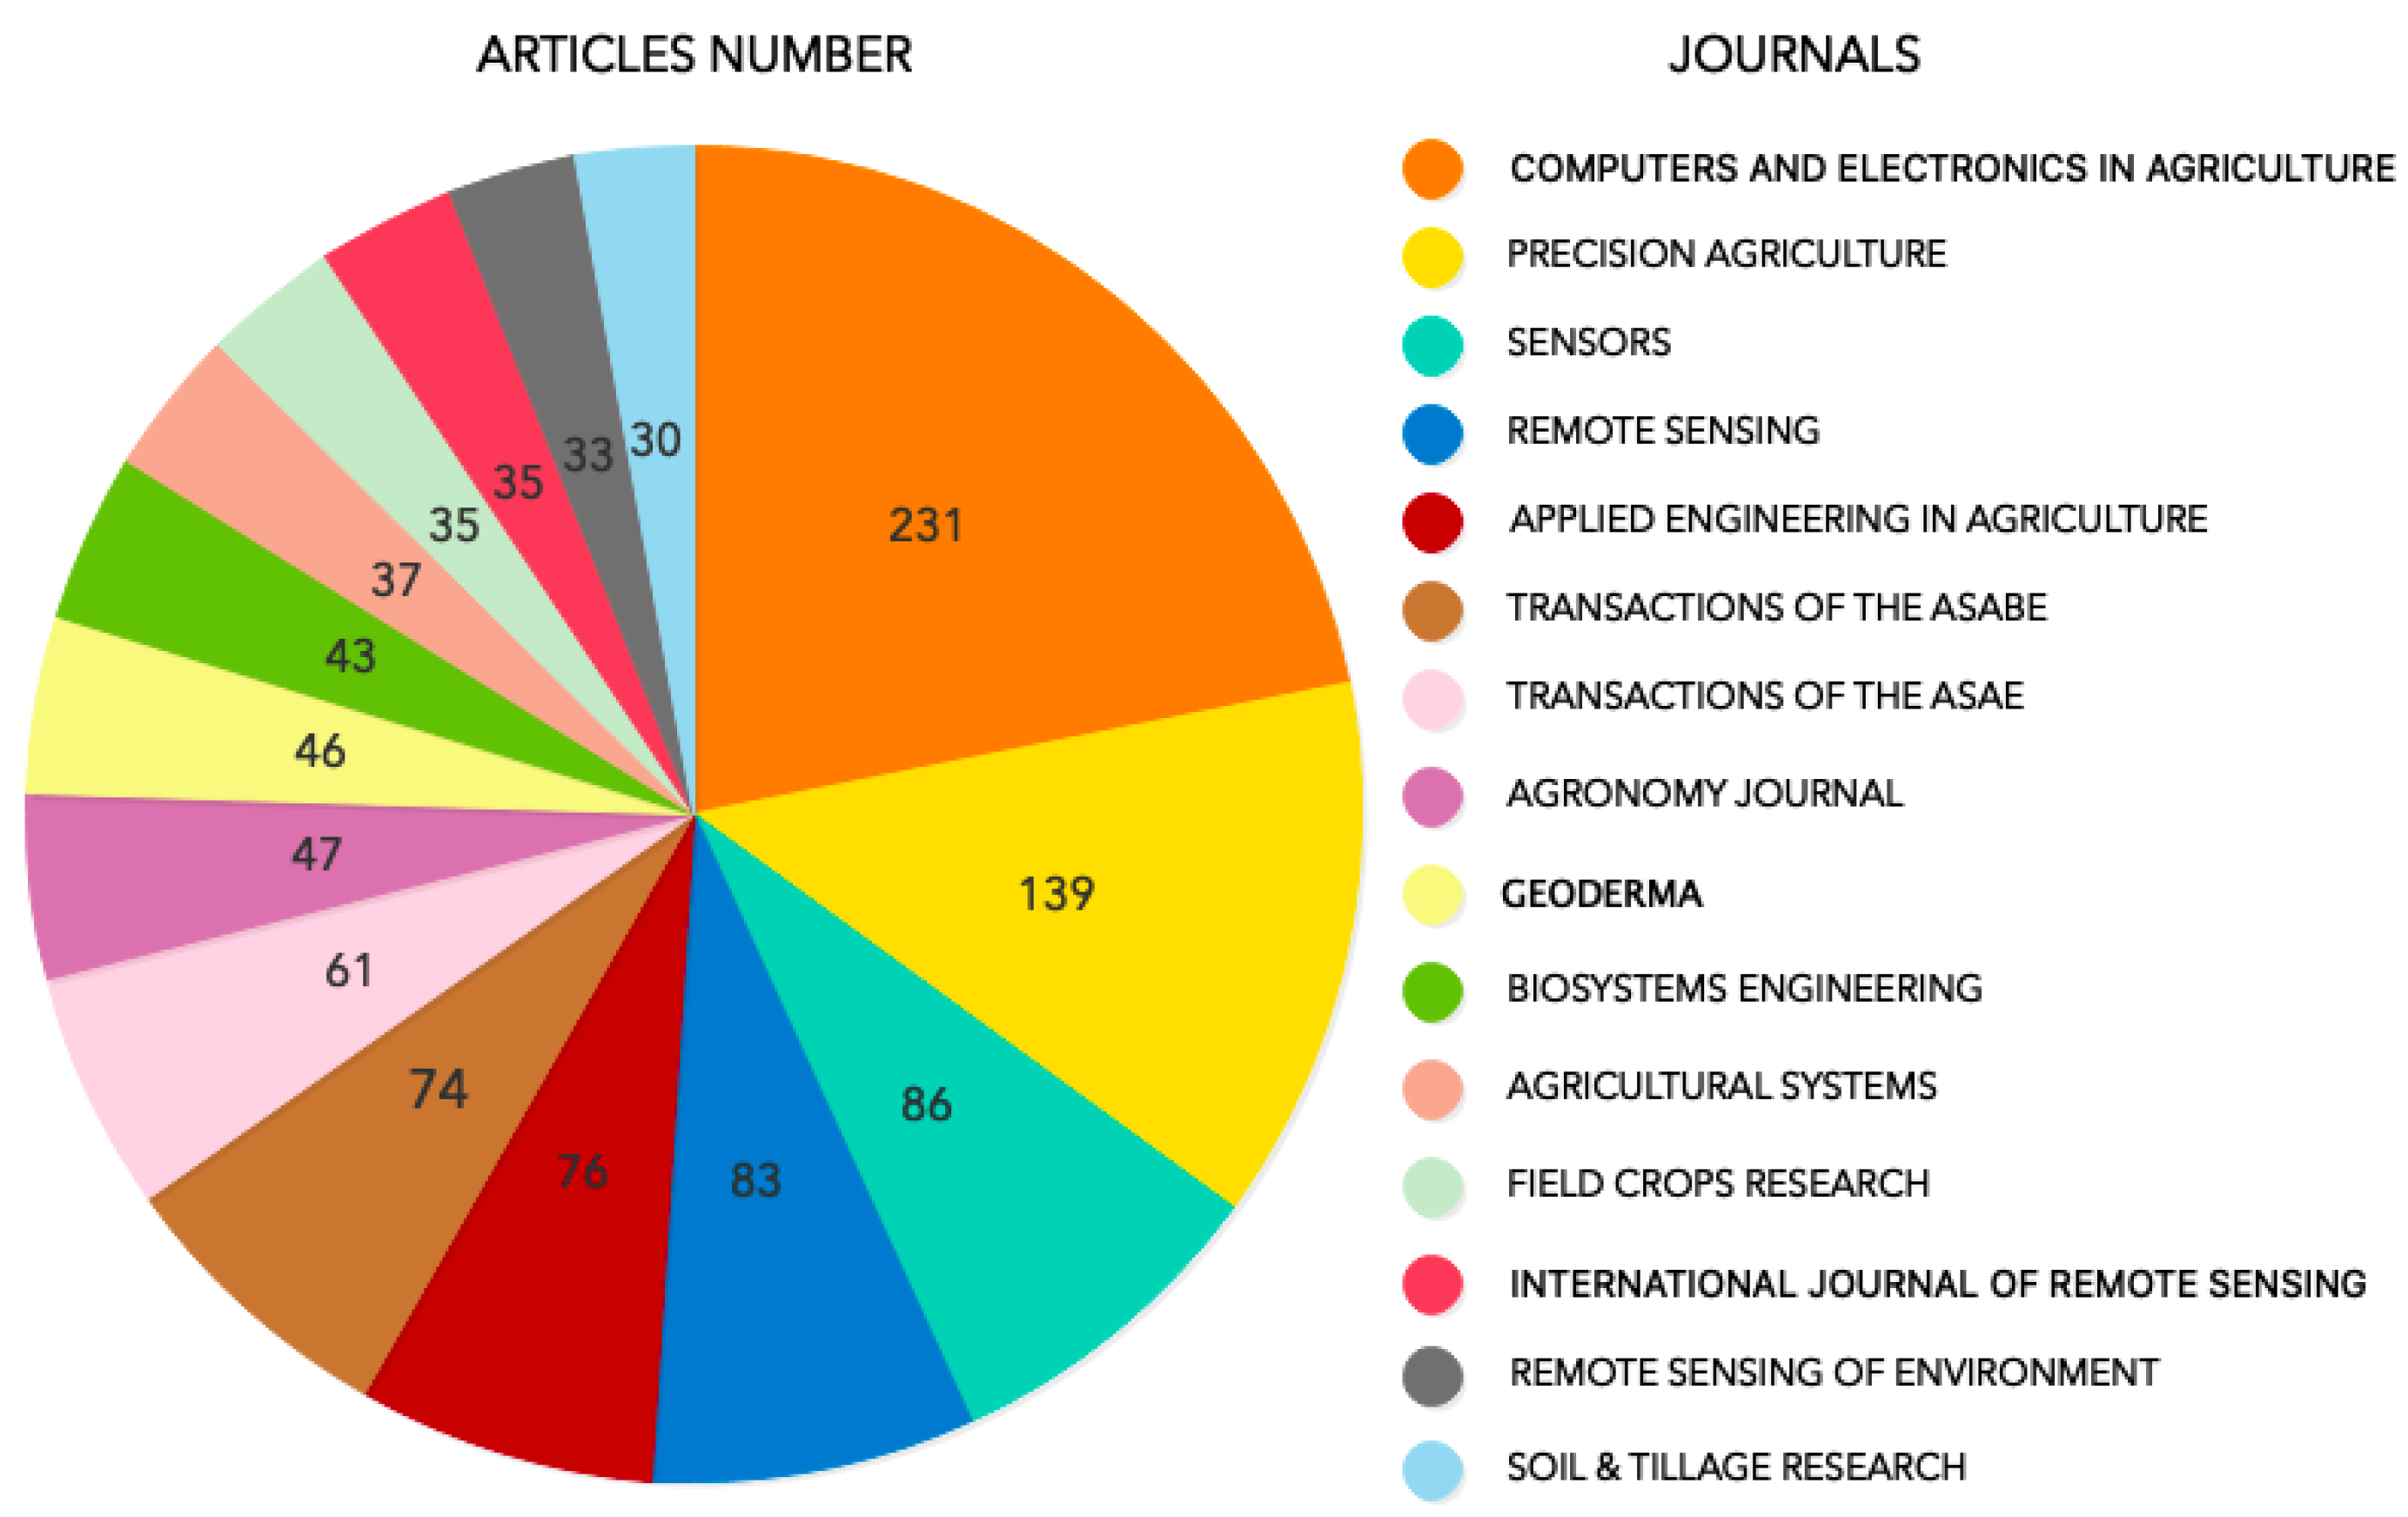
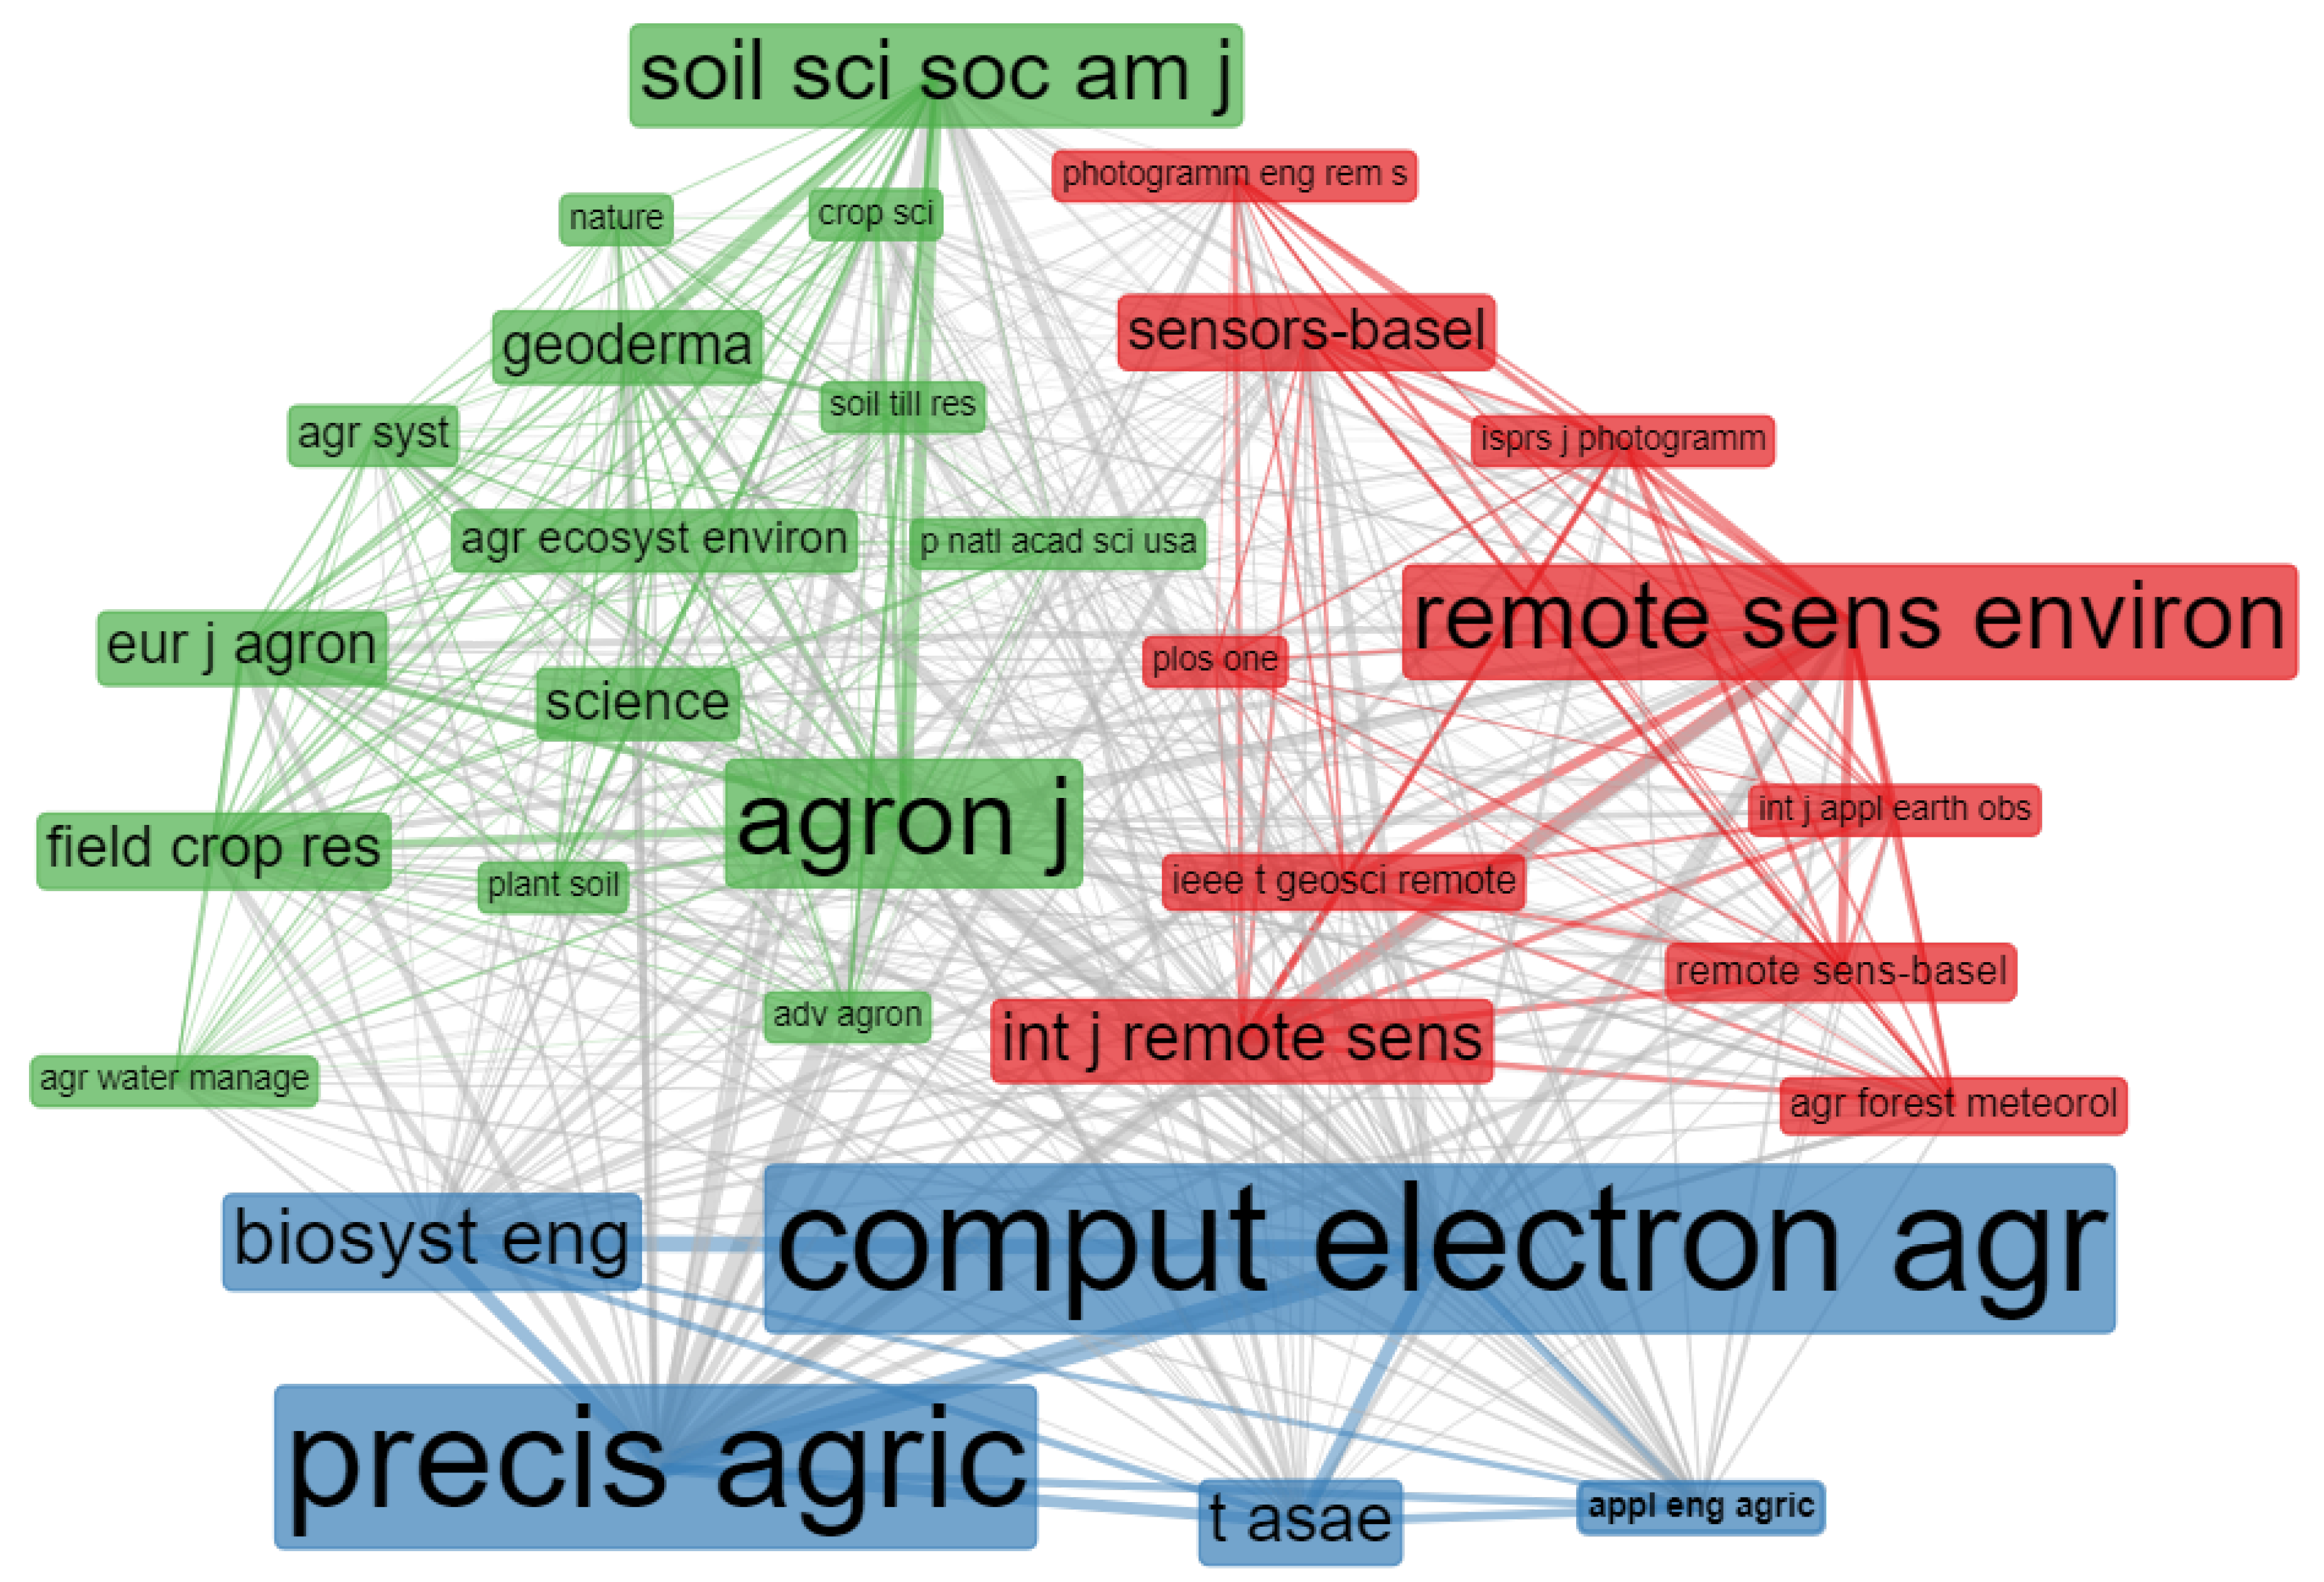
3.1.4. Most Relevant Journals

In Figure 4, the most relevant journals are Computers And Electronics In Agriculture, followed by Precision Agriculture. The multidisciplinary approach of these journals has favored their outstanding publication number related to the advanced ICT in agriculture. These journals are relatively recent and emphasize technological convergence, which favors the publication of research papers that mainly integrate computer, electronic, and data science studies with agriculture.
The journal of Computers and Electronics in Agriculture has a five-year impact factor (IF) of 3.53. This journal publishes technological innovation applications in agriculture. The second position is for Precision Agriculture with five-year IF = 3.52, and it focuses on this field. Both journals have applications in agriculture, but journals of technological innovation topic occupy the third and the fourth position; the above can be the result of the interest in aspects related to soil, crop, plant disease, and water stress studies.

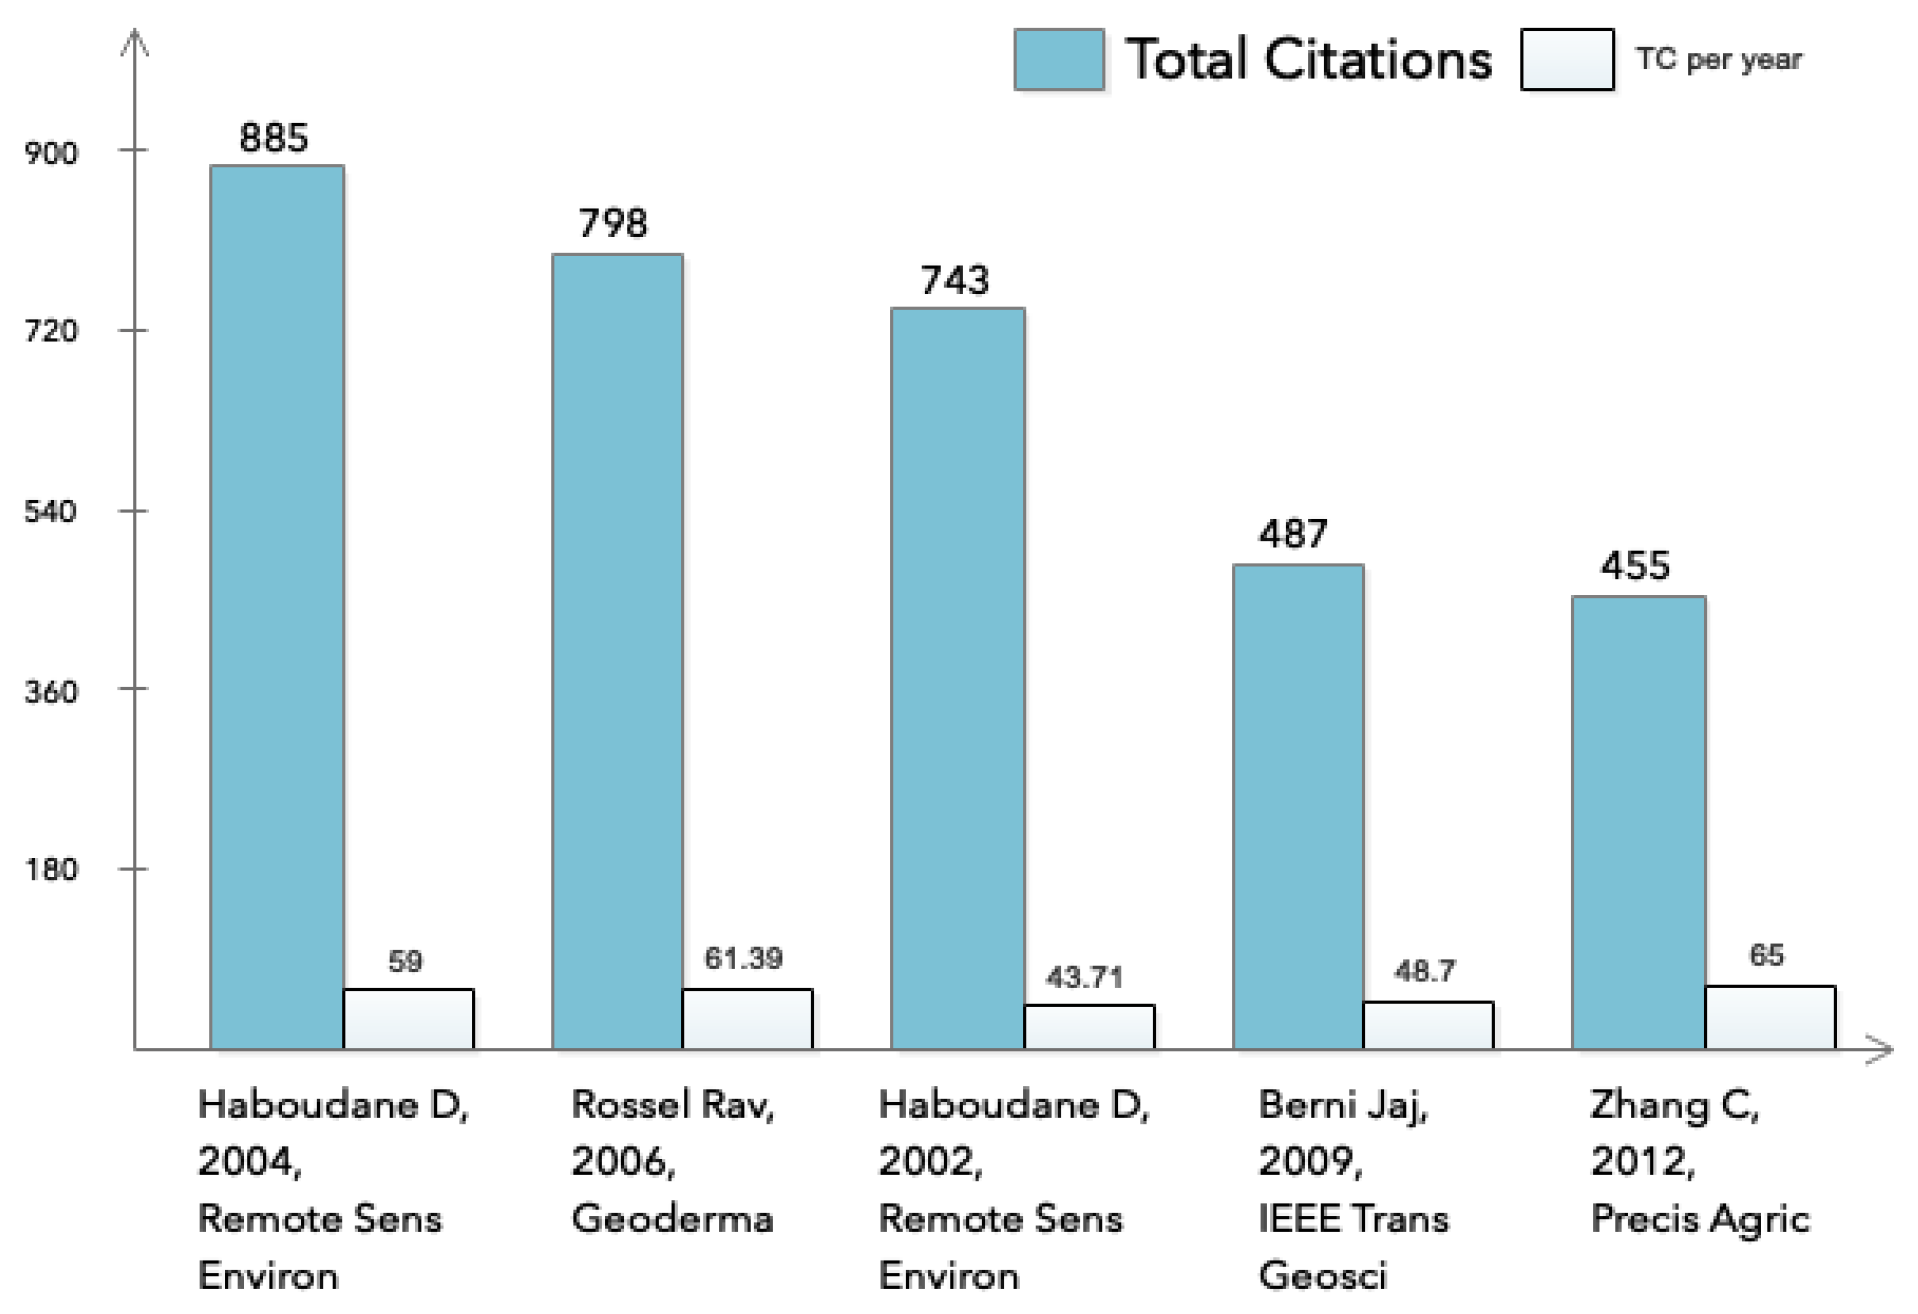
3.1.5. Most Cited Papers

The most relevant papers in the area in terms of citations are mostly focused on the use of images obtained through satellite and Unmanned Aerial Vehicle (UAV) technologies [36,68,69] and remote sensing [36,69,70], in the detection of indicators of soil and crop properties [71]. Figure 5 (Table 1) shows the total number of citations in the first column, and, in the second column, the average citation per year according to the web of science.

3.2. Science Mapping

3.2.1. Institution Collaboration Network

Figure 6 shows the collaboration between the 30 most relevant institutions in advanced technology agriculture. Interestingly, in the green cluster, the Chinese agriculture university institutions and the University of California Davis stand out, the latter being observed as the U.S. institution with the highest international collaboration since it collaborates with institutions from countries, such as China, Brazil, and Argentina. Interestingly, the red cluster shows a closer collaboration relationship between international institutions, such as International Maize and Wheat Improvement Center (CIMMYT, by its acronym in Spanish), International Crops Research Institute for the Semi-Arid Tropics (ICRISAT), International Center for Tropical Agriculture (CIAT), and Wageningen University. These centers are joined by very similar themes and objectives, such as sustainable agriculture and food improvement in developing countries [72].
The remaining clusters, associated with the colors blue, purple, and orange, are made up exclusively of U.S. universities. The member universities of each cluster are associated with states that maintain a closer geographic relationship with each other than states associated with the universities belonging to other clusters. Specifically, in the orange cluster, most of the states associated with the universities are neighboring states located in the United States central-eastern (Ohio, Indiana, Kentucky). Those belonging to the purple cluster are located in the southeast region (Texas, Florida, Georgia, Mississippi) and central region (Oklahoma and Kansas); finally, in the blue cluster are the adjoining states associated with the northeast area (Michigan, Illinois, Iowa, Wisconsin, Missouri), except for Washington.
The previous shows that geographical proximity is one of the critical factors in shaping the collaborative networks of U.S. institutions in the area of advanced ICT in agriculture. The geographical proximity can explain the above favors the mobility of research resources, in addition to the fact that there are higher probabilities of sharing climatic regions between adjacent states, which is a critical factor in the selection of crops and the control of these variables for agricultural management.

3.2.2. Sources Co-Citation Networks

In Figure 7, three clusters in the co-citation network of the 30 most relevant journals in advanced technology agriculture are detected. In the blue cluster are the most-cited journals in the area, such as Computer Electronics and Agriculture, Precision Agriculture, and Biosystem Engineering journals, and the characteristics of the journals associated with this cluster are mainly of technological and engineering approaches in agriculture.
On the other hand, in the red group, the most specialized magazines in remote sensing stand out. Remote sensing has had a significant development in recent years for monitoring and decision-making in agricultural systems [73]. Interestingly, the specialized studies in remote sensing of these journals tend to be cited more among them than in the more general-spectrum journals within agriculture.
Within the green cluster is a higher occurrence of generalist journals, such as science, nature, Proceedings of the National Academy of Sciences, and some other general thematic journals in agriculture; due to the generality of these journals, the proportion of works associated with advanced technology agriculture is minor; however, its presence can be detected.

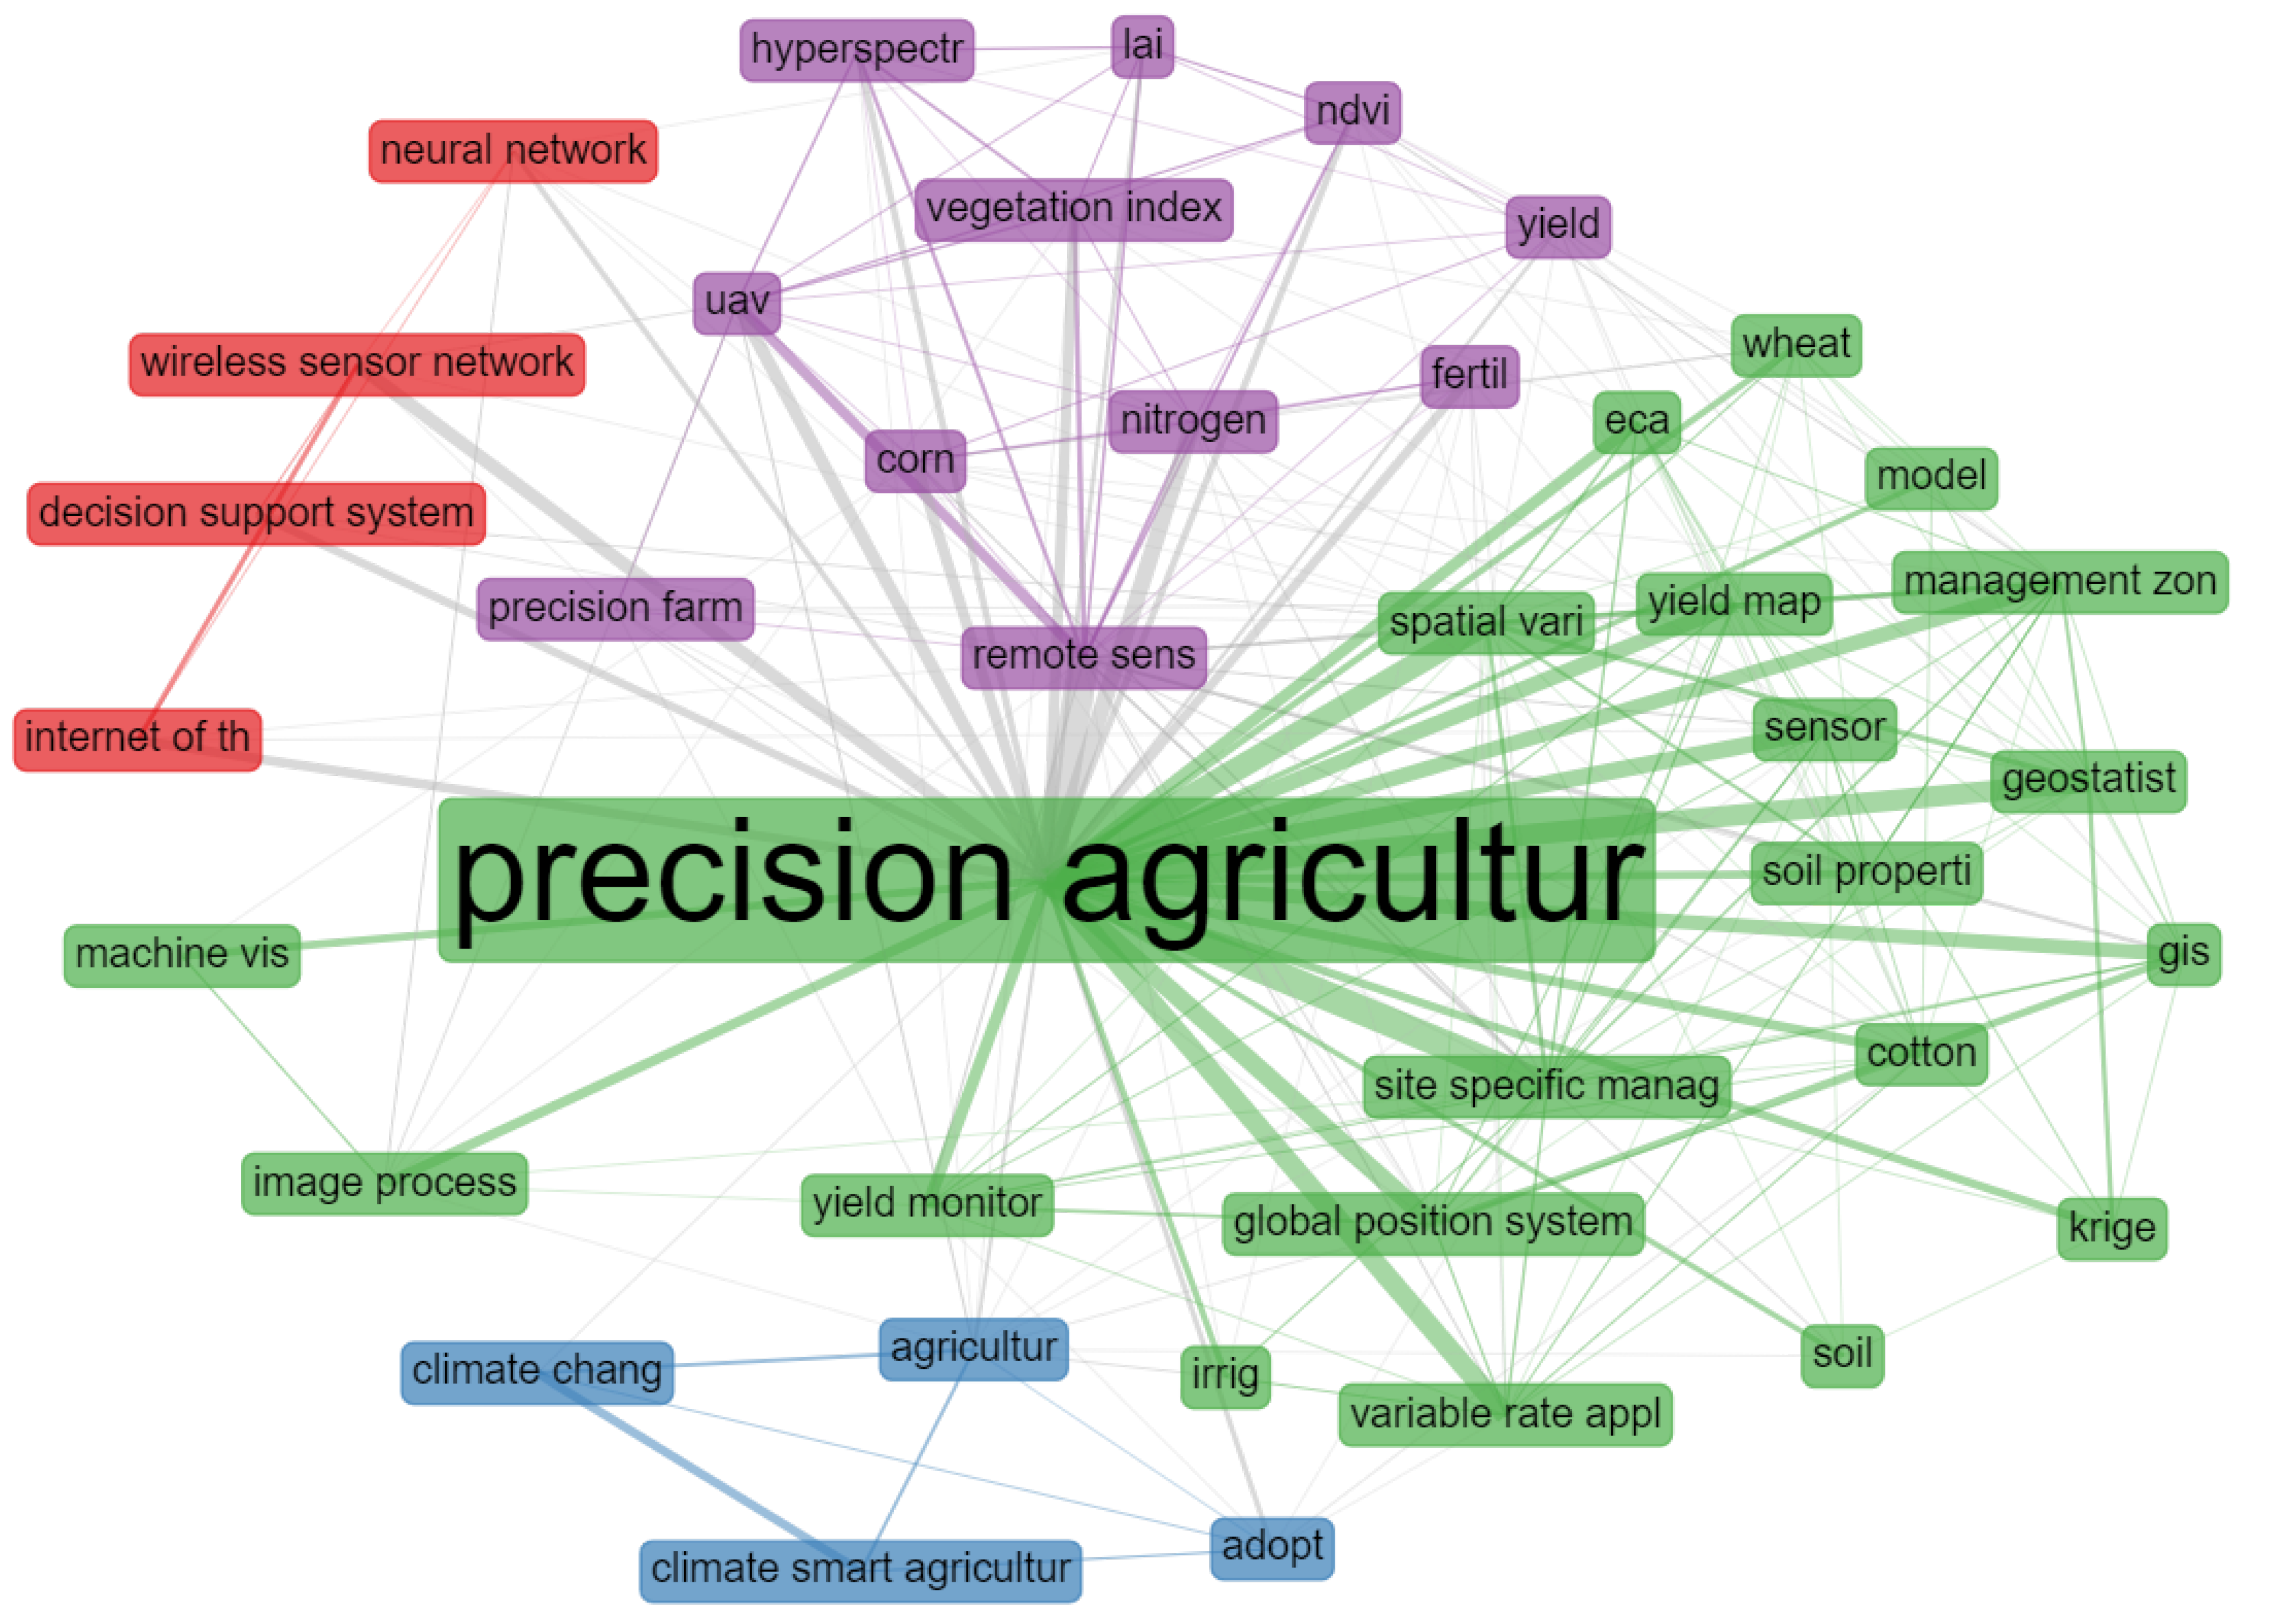
3.2.3. Word Co-Occurrence Networks

In the network of co-occurrences of words, 4 clusters are observed in Figure 8. In the green cluster, the dominant term ‘precision agriculture’ is detected, which is not surprising since it was used as a search term. Connected with the previous term was found ‘soil properties’, ‘site-specific management’, ‘spatial variation’, ‘yield monitor’, and ‘sensor’; together these terms are associated with the detection of properties and characteristics of crops, for management of crops in the application and administration of variables, such as agricultural inputs [7].
On the other hand, the blue cluster shows terms, such as climate-smart agriculture, ‘climate change, adopt’, and ‘agriculture’, that are associated with advanced technology agriculture papers, focused on technology adoption and problem-solving associated to climate change for containment and mitigation of its adverse effects [74]. The purple cluster includes terms, such as remote sensing, UAV, precision farm, Leaf Area Index (LAI), and hyperspectral, all of which are associated with remote sensing and the generation of indicators for inspection and decision-making in agricultural management [73]. Finally, in the red cluster, the terms ‘wireless sensor networks’, ‘internet of things’, and ‘decision support system’ refer to the most recent concepts in the advanced ICT in agriculture. Specifically, these terms are associated with scientific papers focused on the IoT that involve the use of the latest sensor networks for real-time monitoring and decision-making in agricultural management [9].

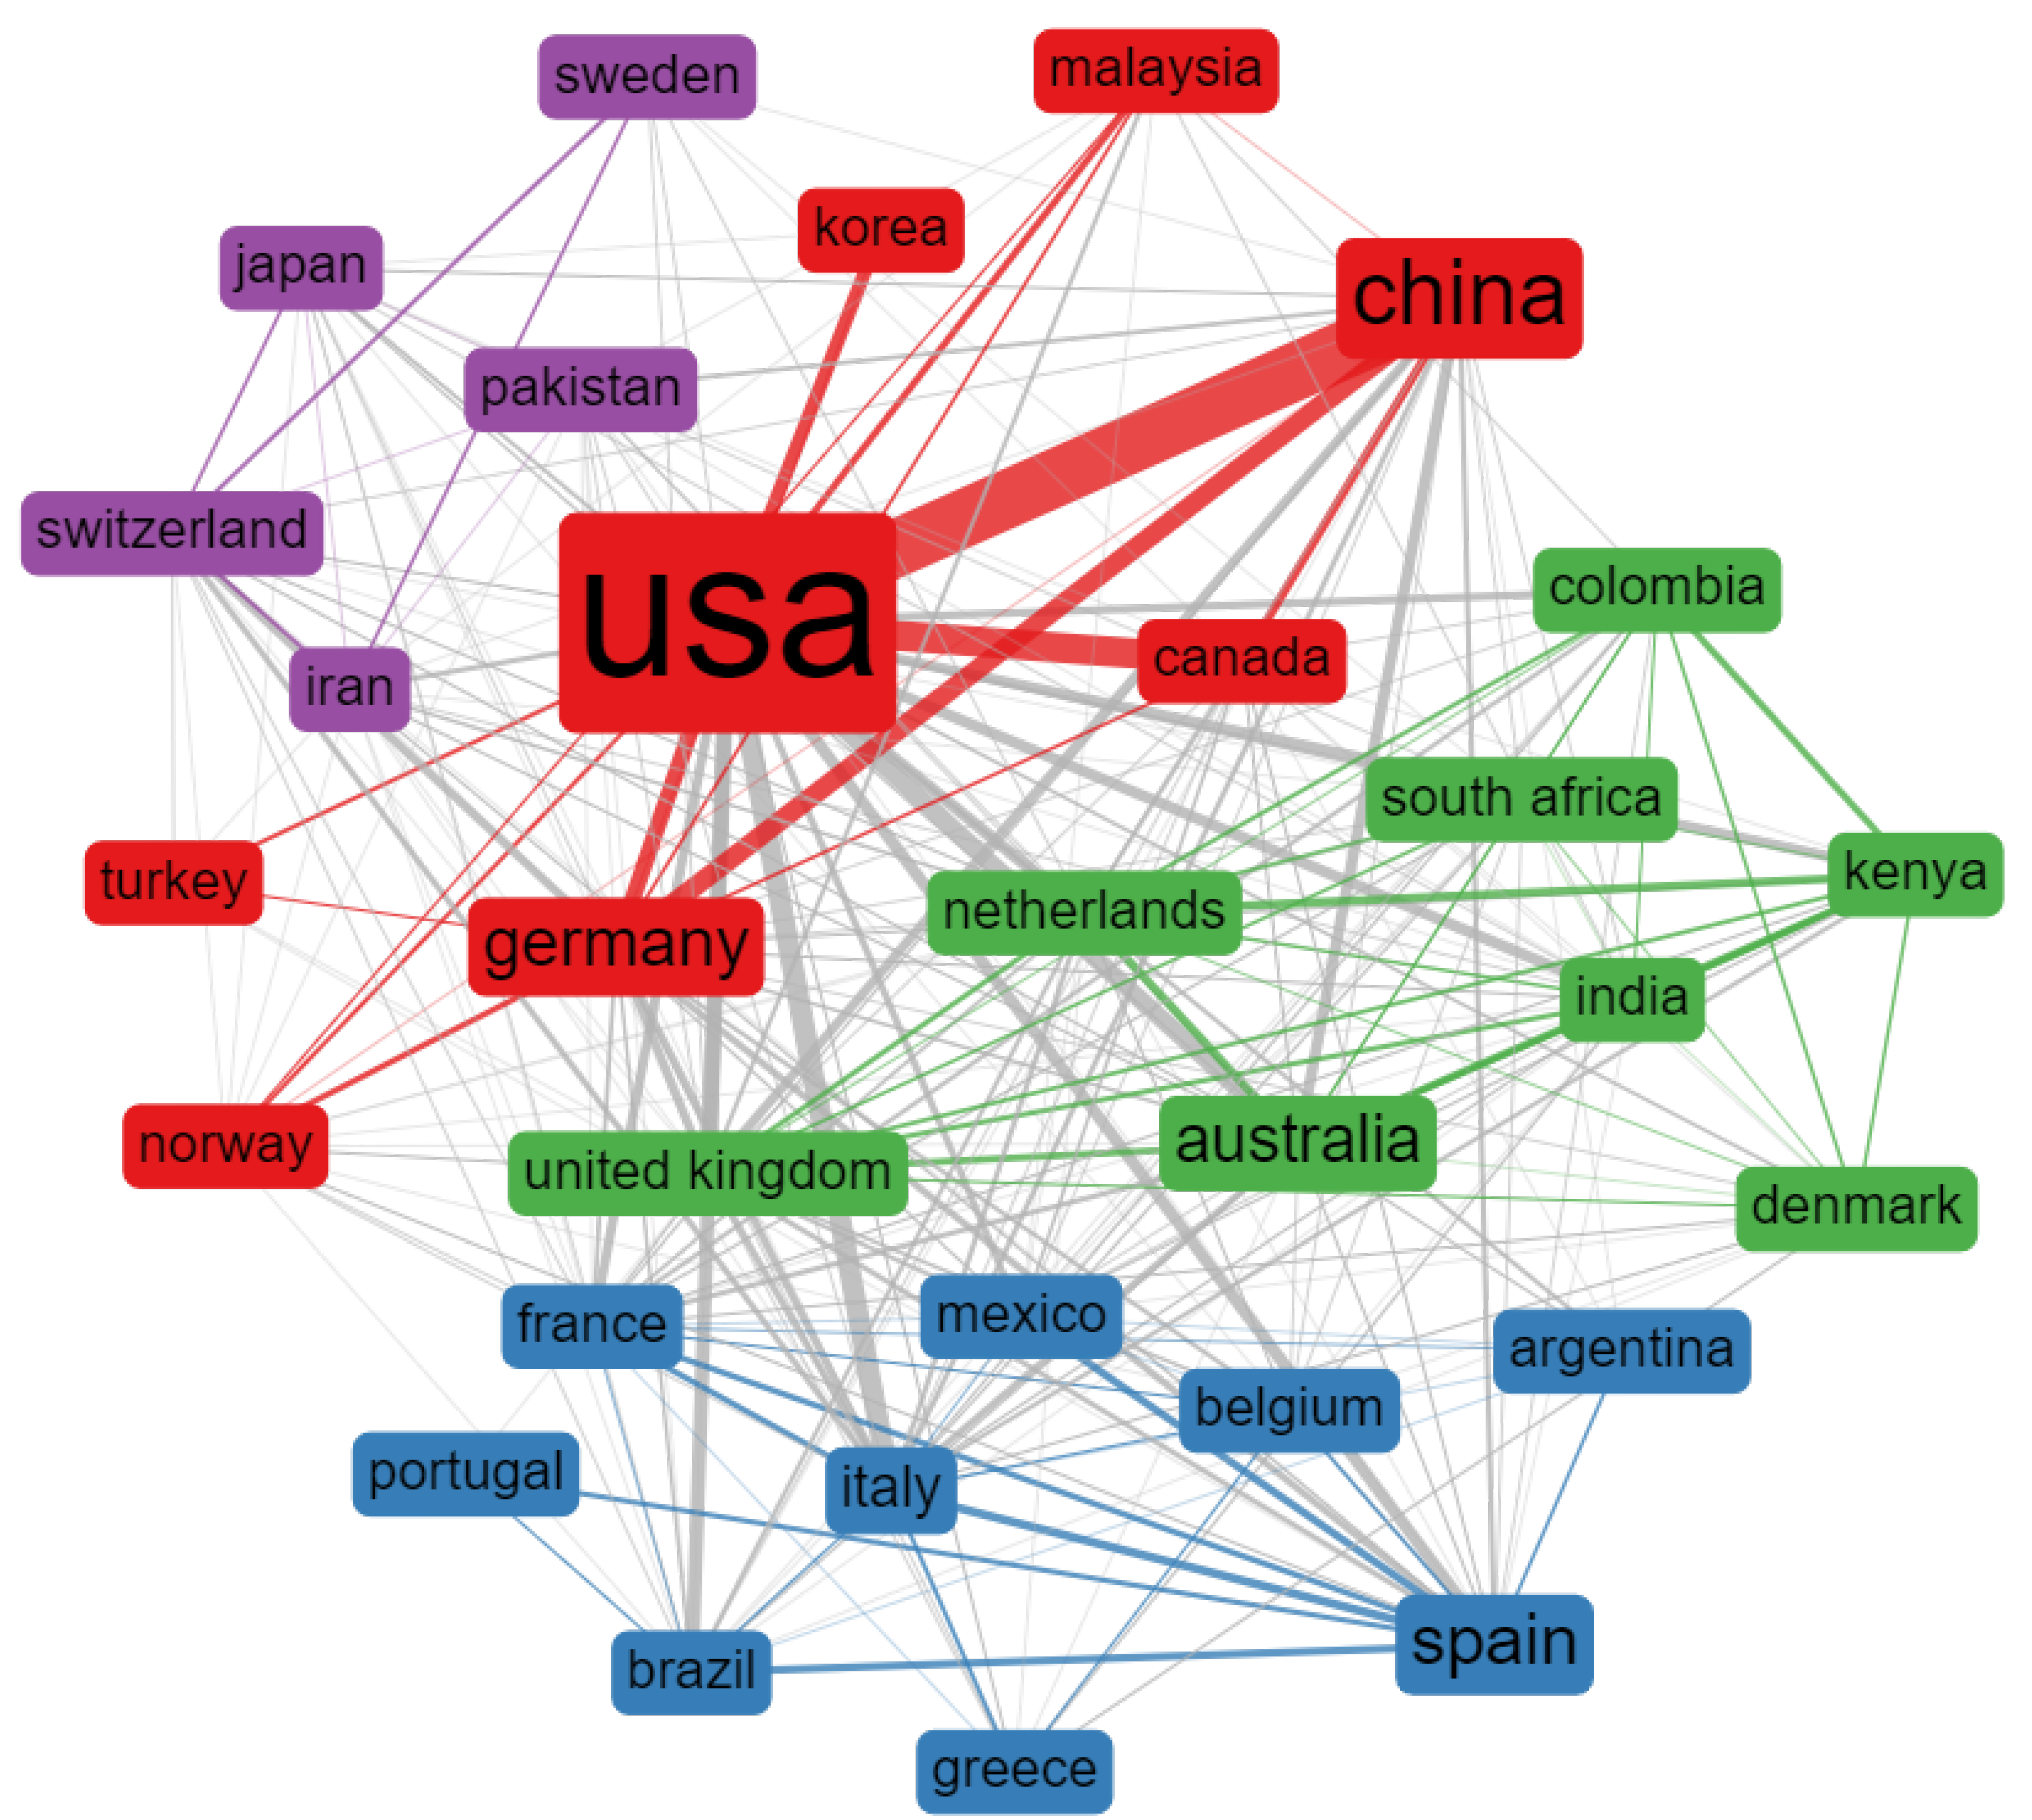
3.2.4. Country Collaboration Network

The country collaboration network was generated using the top 30 nodes (outstanding countries). Figure 9 shows the clusters in colors derived from the Louvain algorithm. The word size is proportional to a country’s collaboration and the edges to the collaboration between countries in research.
The size of the box reflects its presence in the number of papers; four main clusters are observed. In the blue group, a collaboration between countries could be facilitated by cultural and language relationships, for example, Spain with Mexico and Argentina, as well as Brazil with Portugal and France with Belgium. The red cluster shows the countries with the highest contribution in the literature associated with advanced technology agriculture may be favored by commercial and academic relations between the countries of the USA, China, Germany, and Canada. The green cluster may also be influenced by cultural and language relationships, such as those between Australia, the United Kingdom, India, and South Africa. Similarly, the purple cluster shows relations between Pakistan and Iran, Switzerland, and Sweden.
The main countries in agricultural production are China and the USA and have commercially traded for this purpose. Another strong union is between Italy and the USA; it is due to bilateral agreements. The agenda contemplates the cooperation in science and technology, specifically in ICT and Agriculture technologies for crops, fruit trees and vineyards, and Food Sciences. This kind of agreement could be boosting the cooperation between both countries in ICT in agriculture [75].
In Figure 9, the red cluster presents a dominant research collaboration; the above is due to bilateral treaties between these world powers in the agricultural area [76].

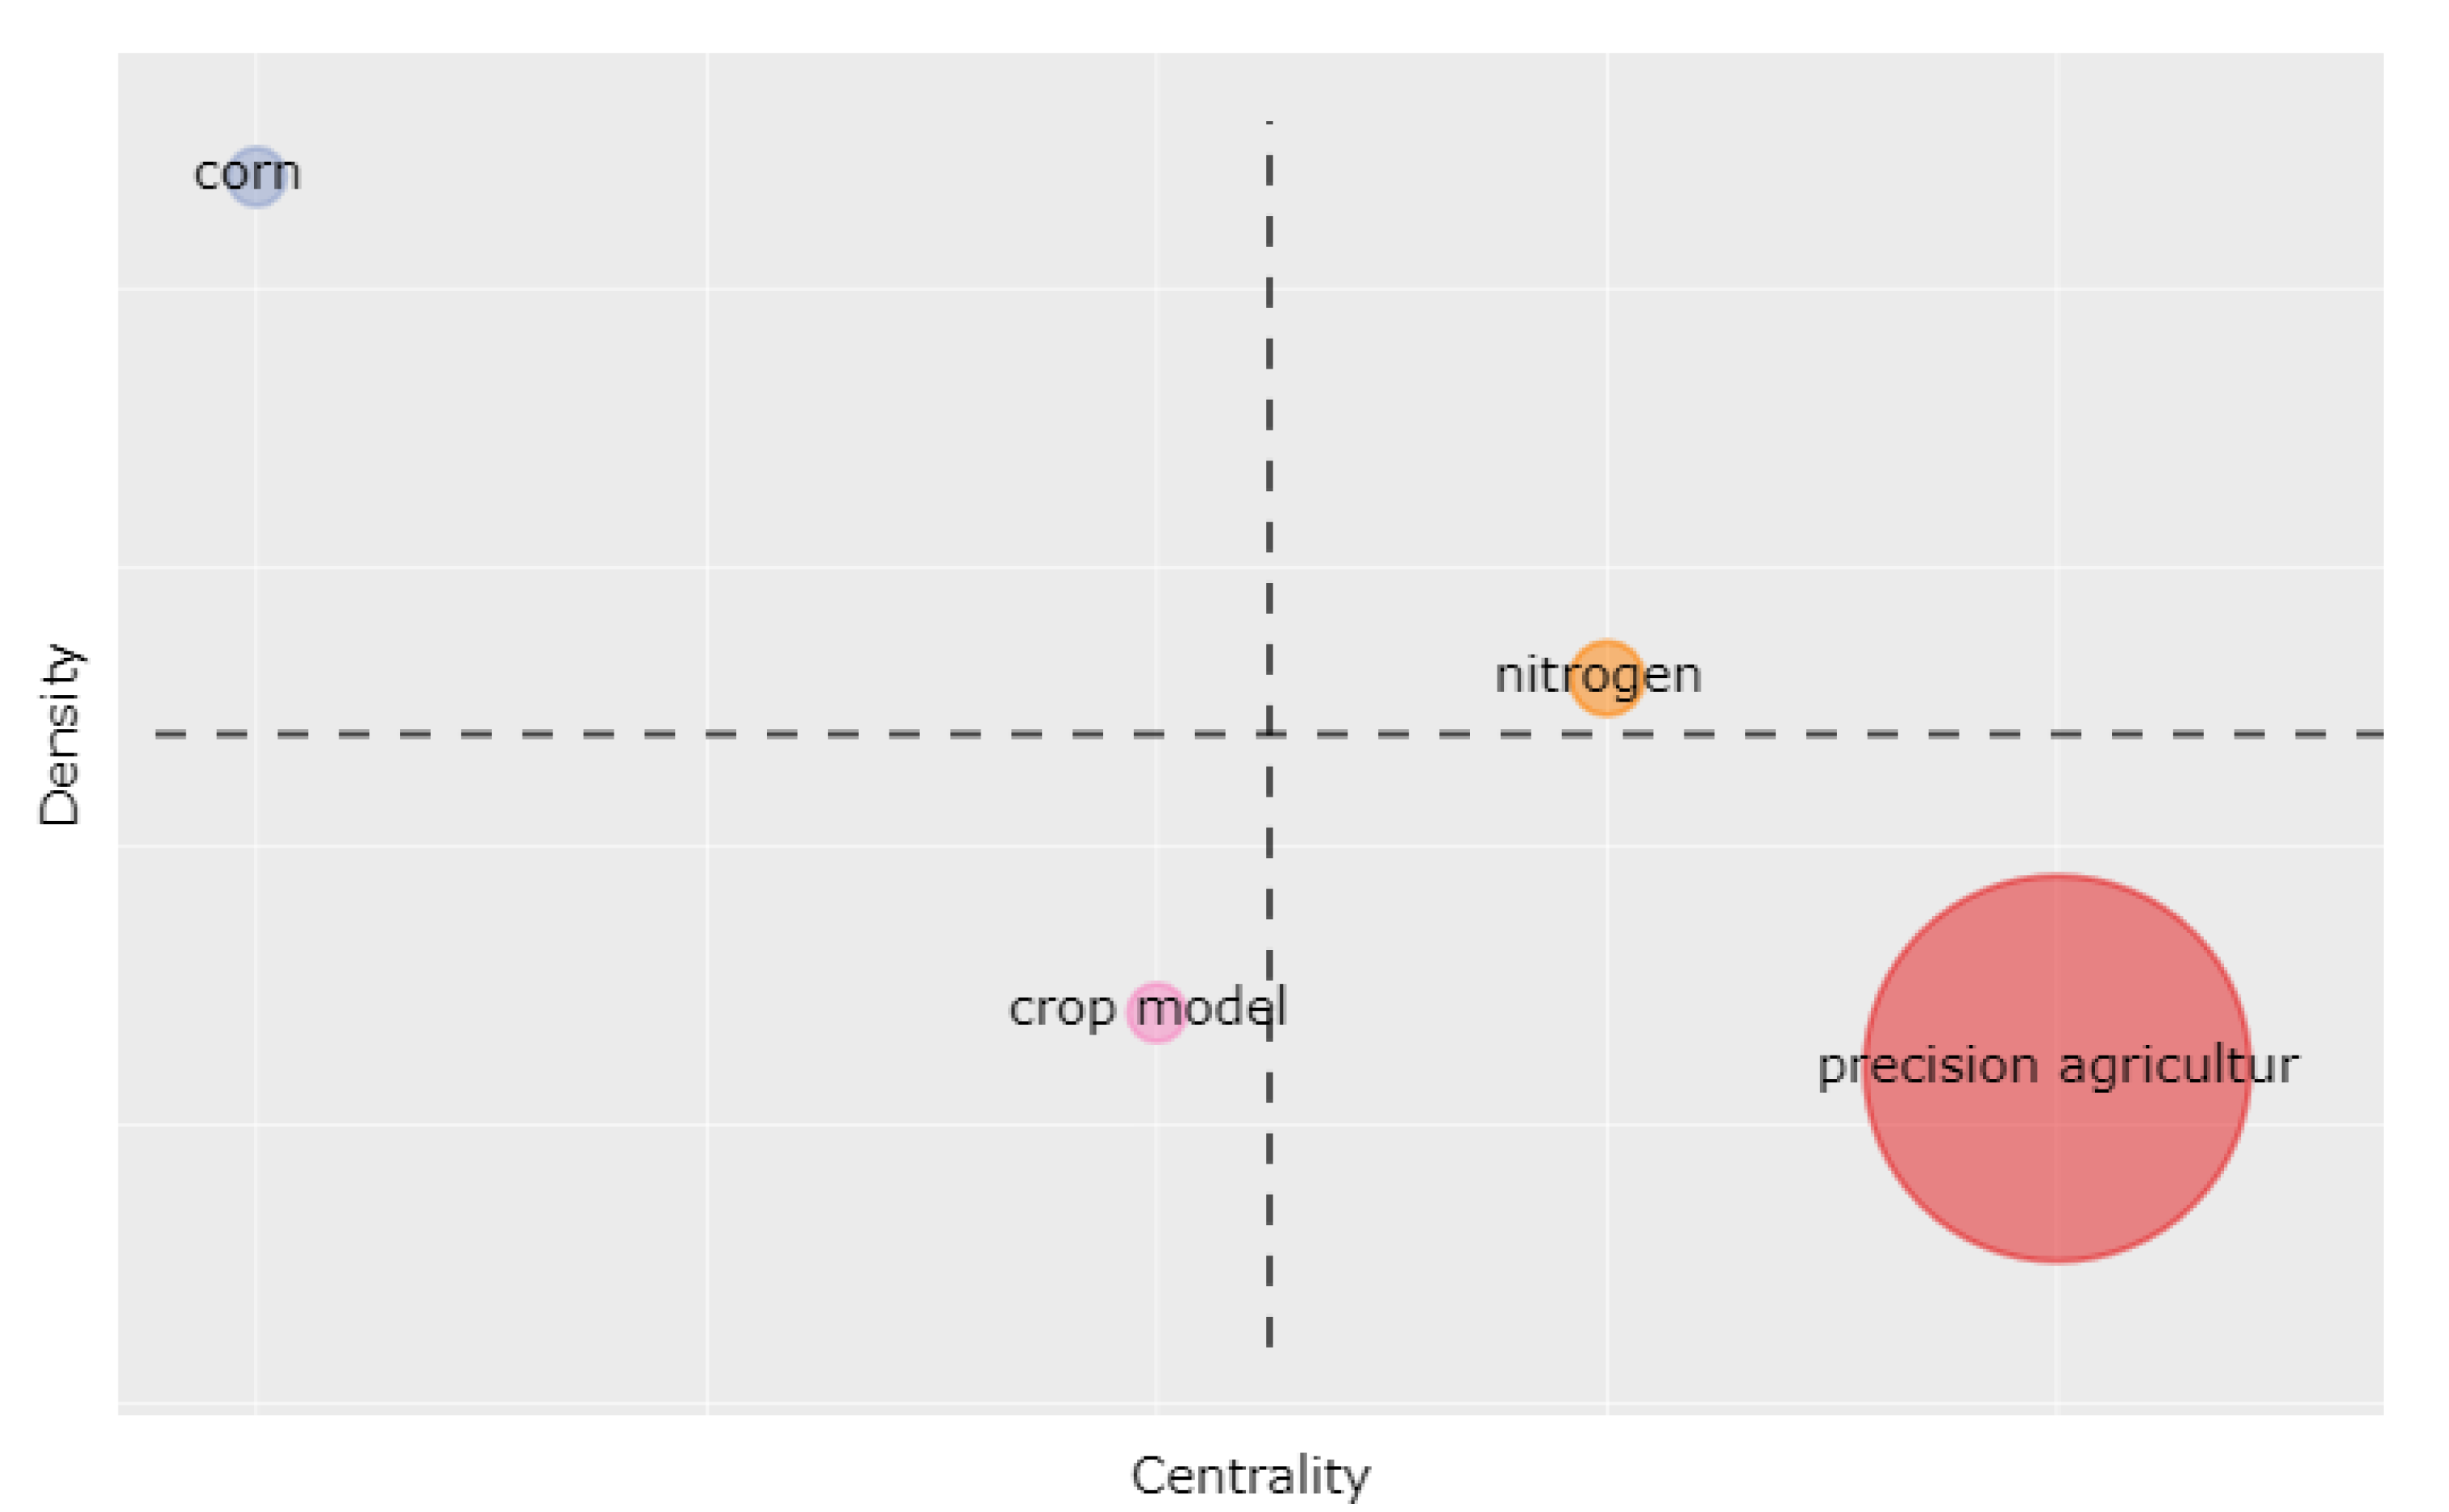
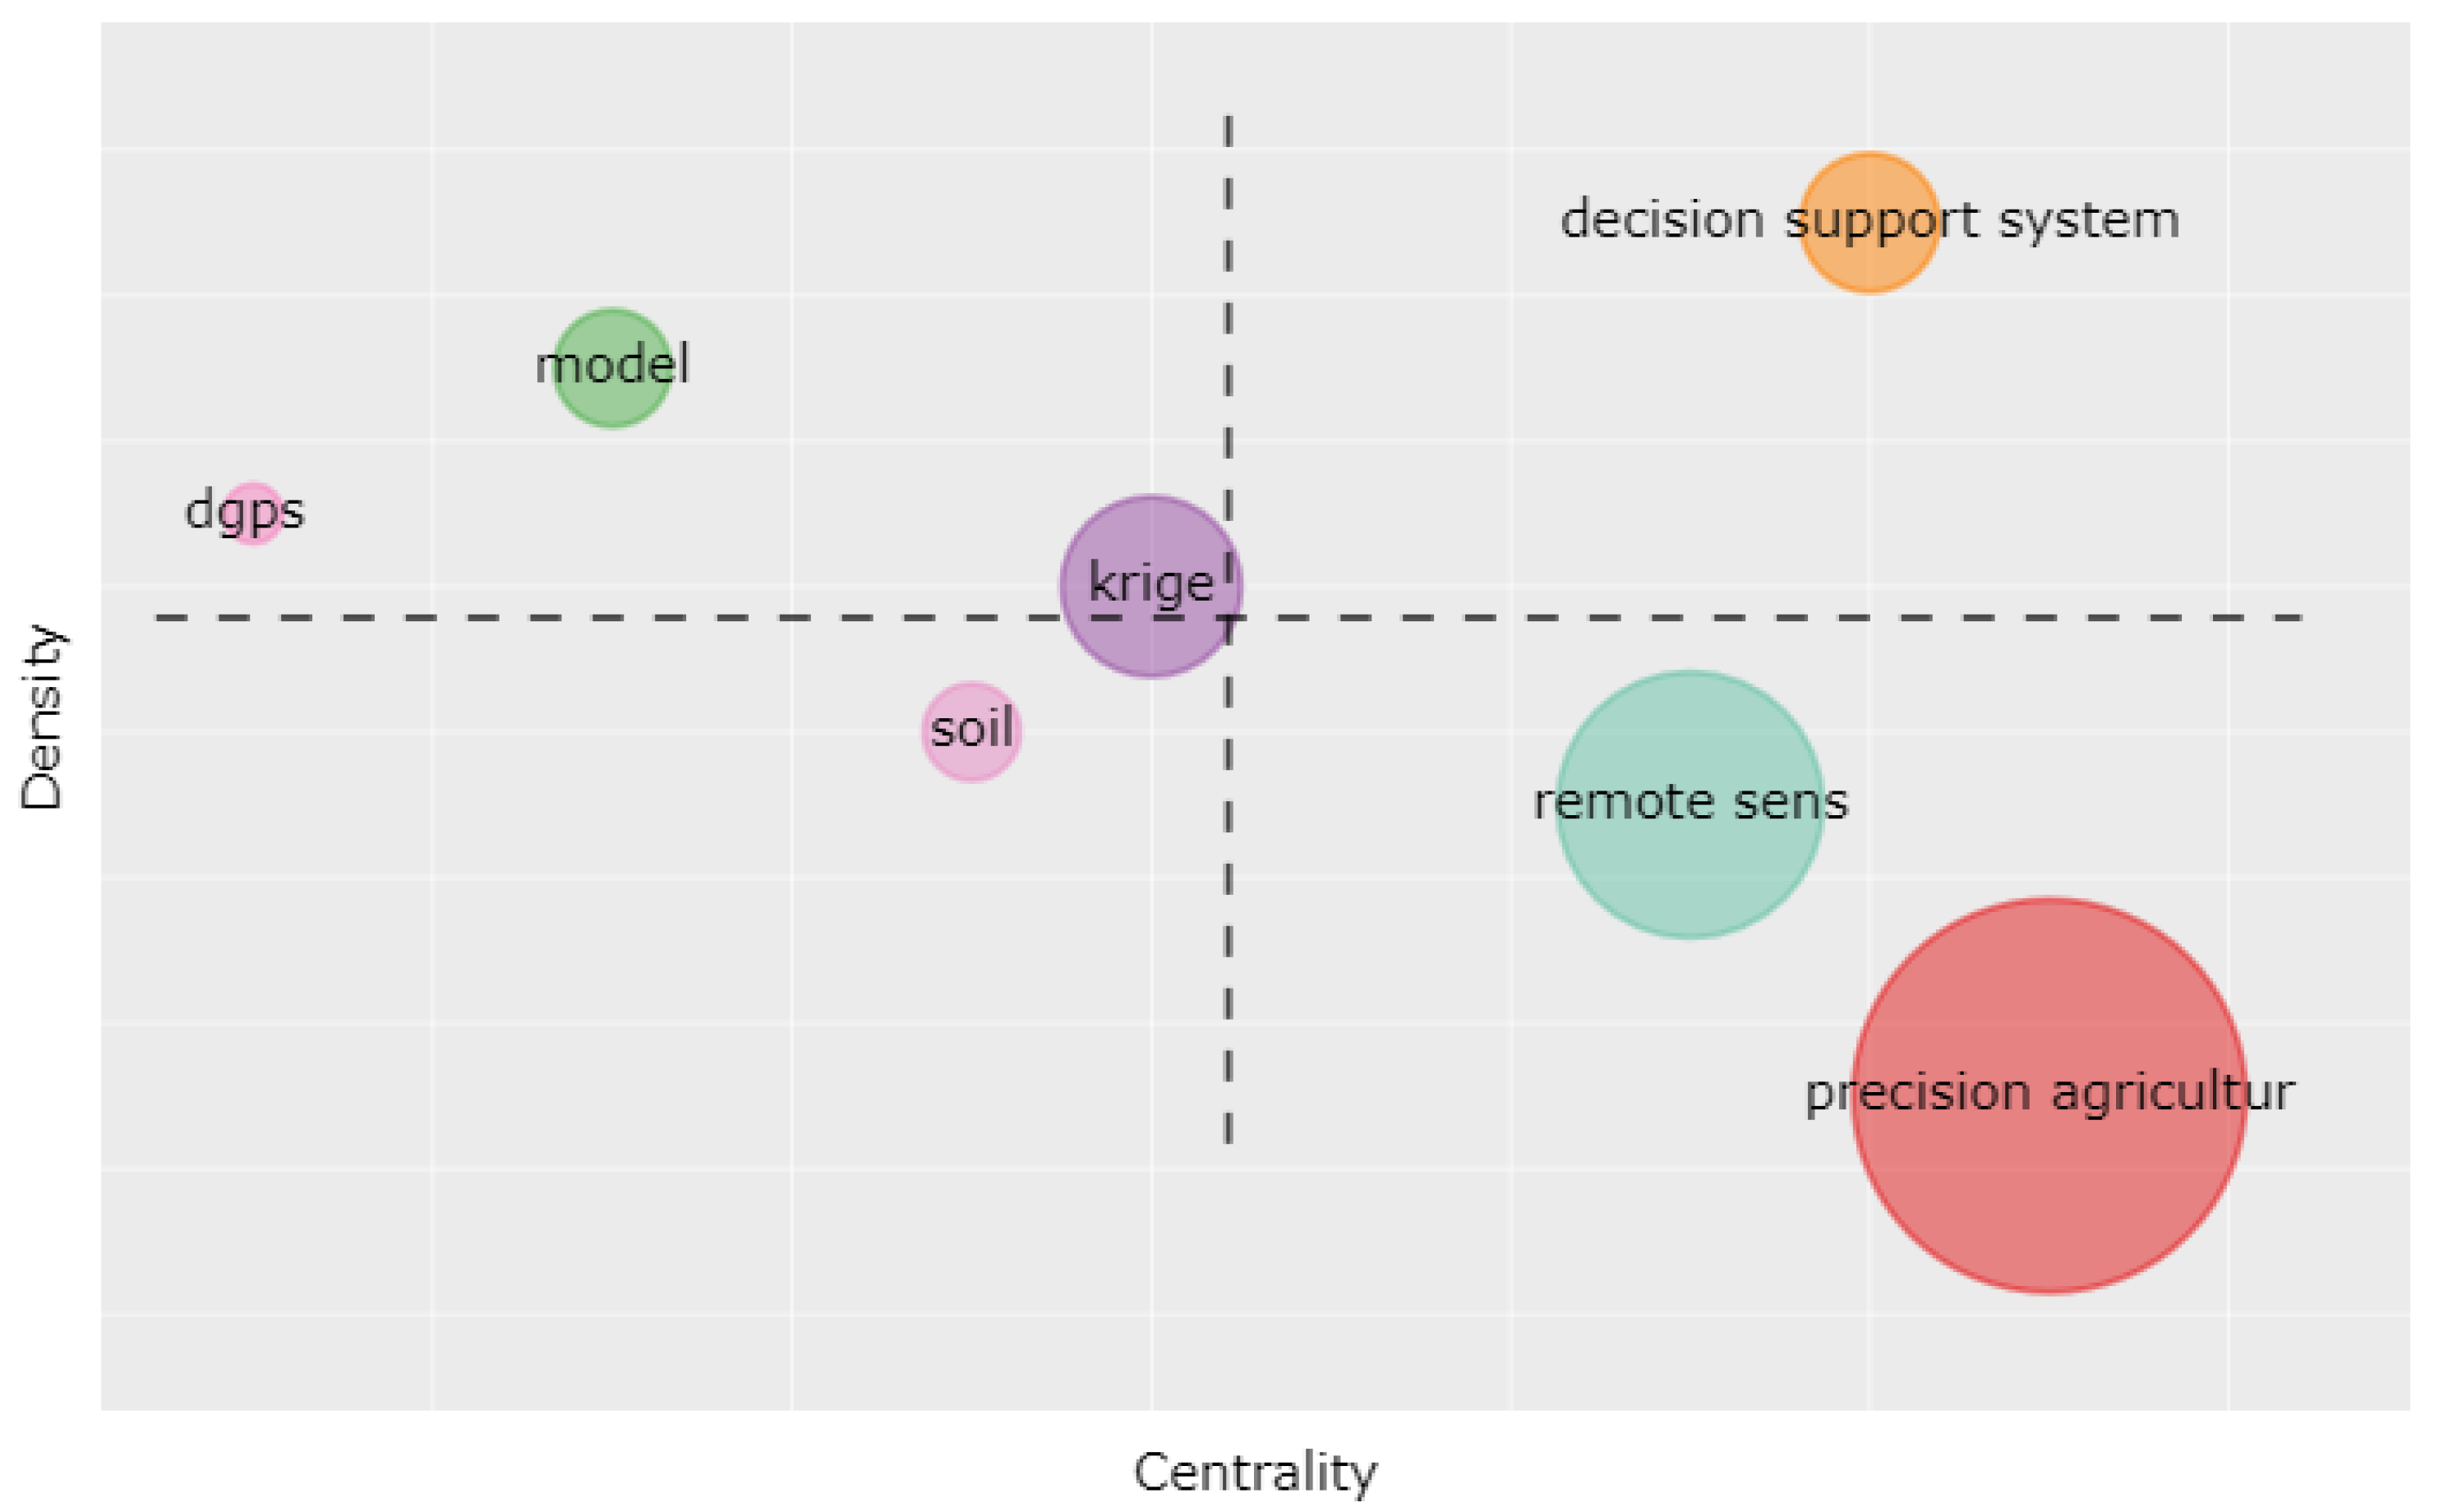
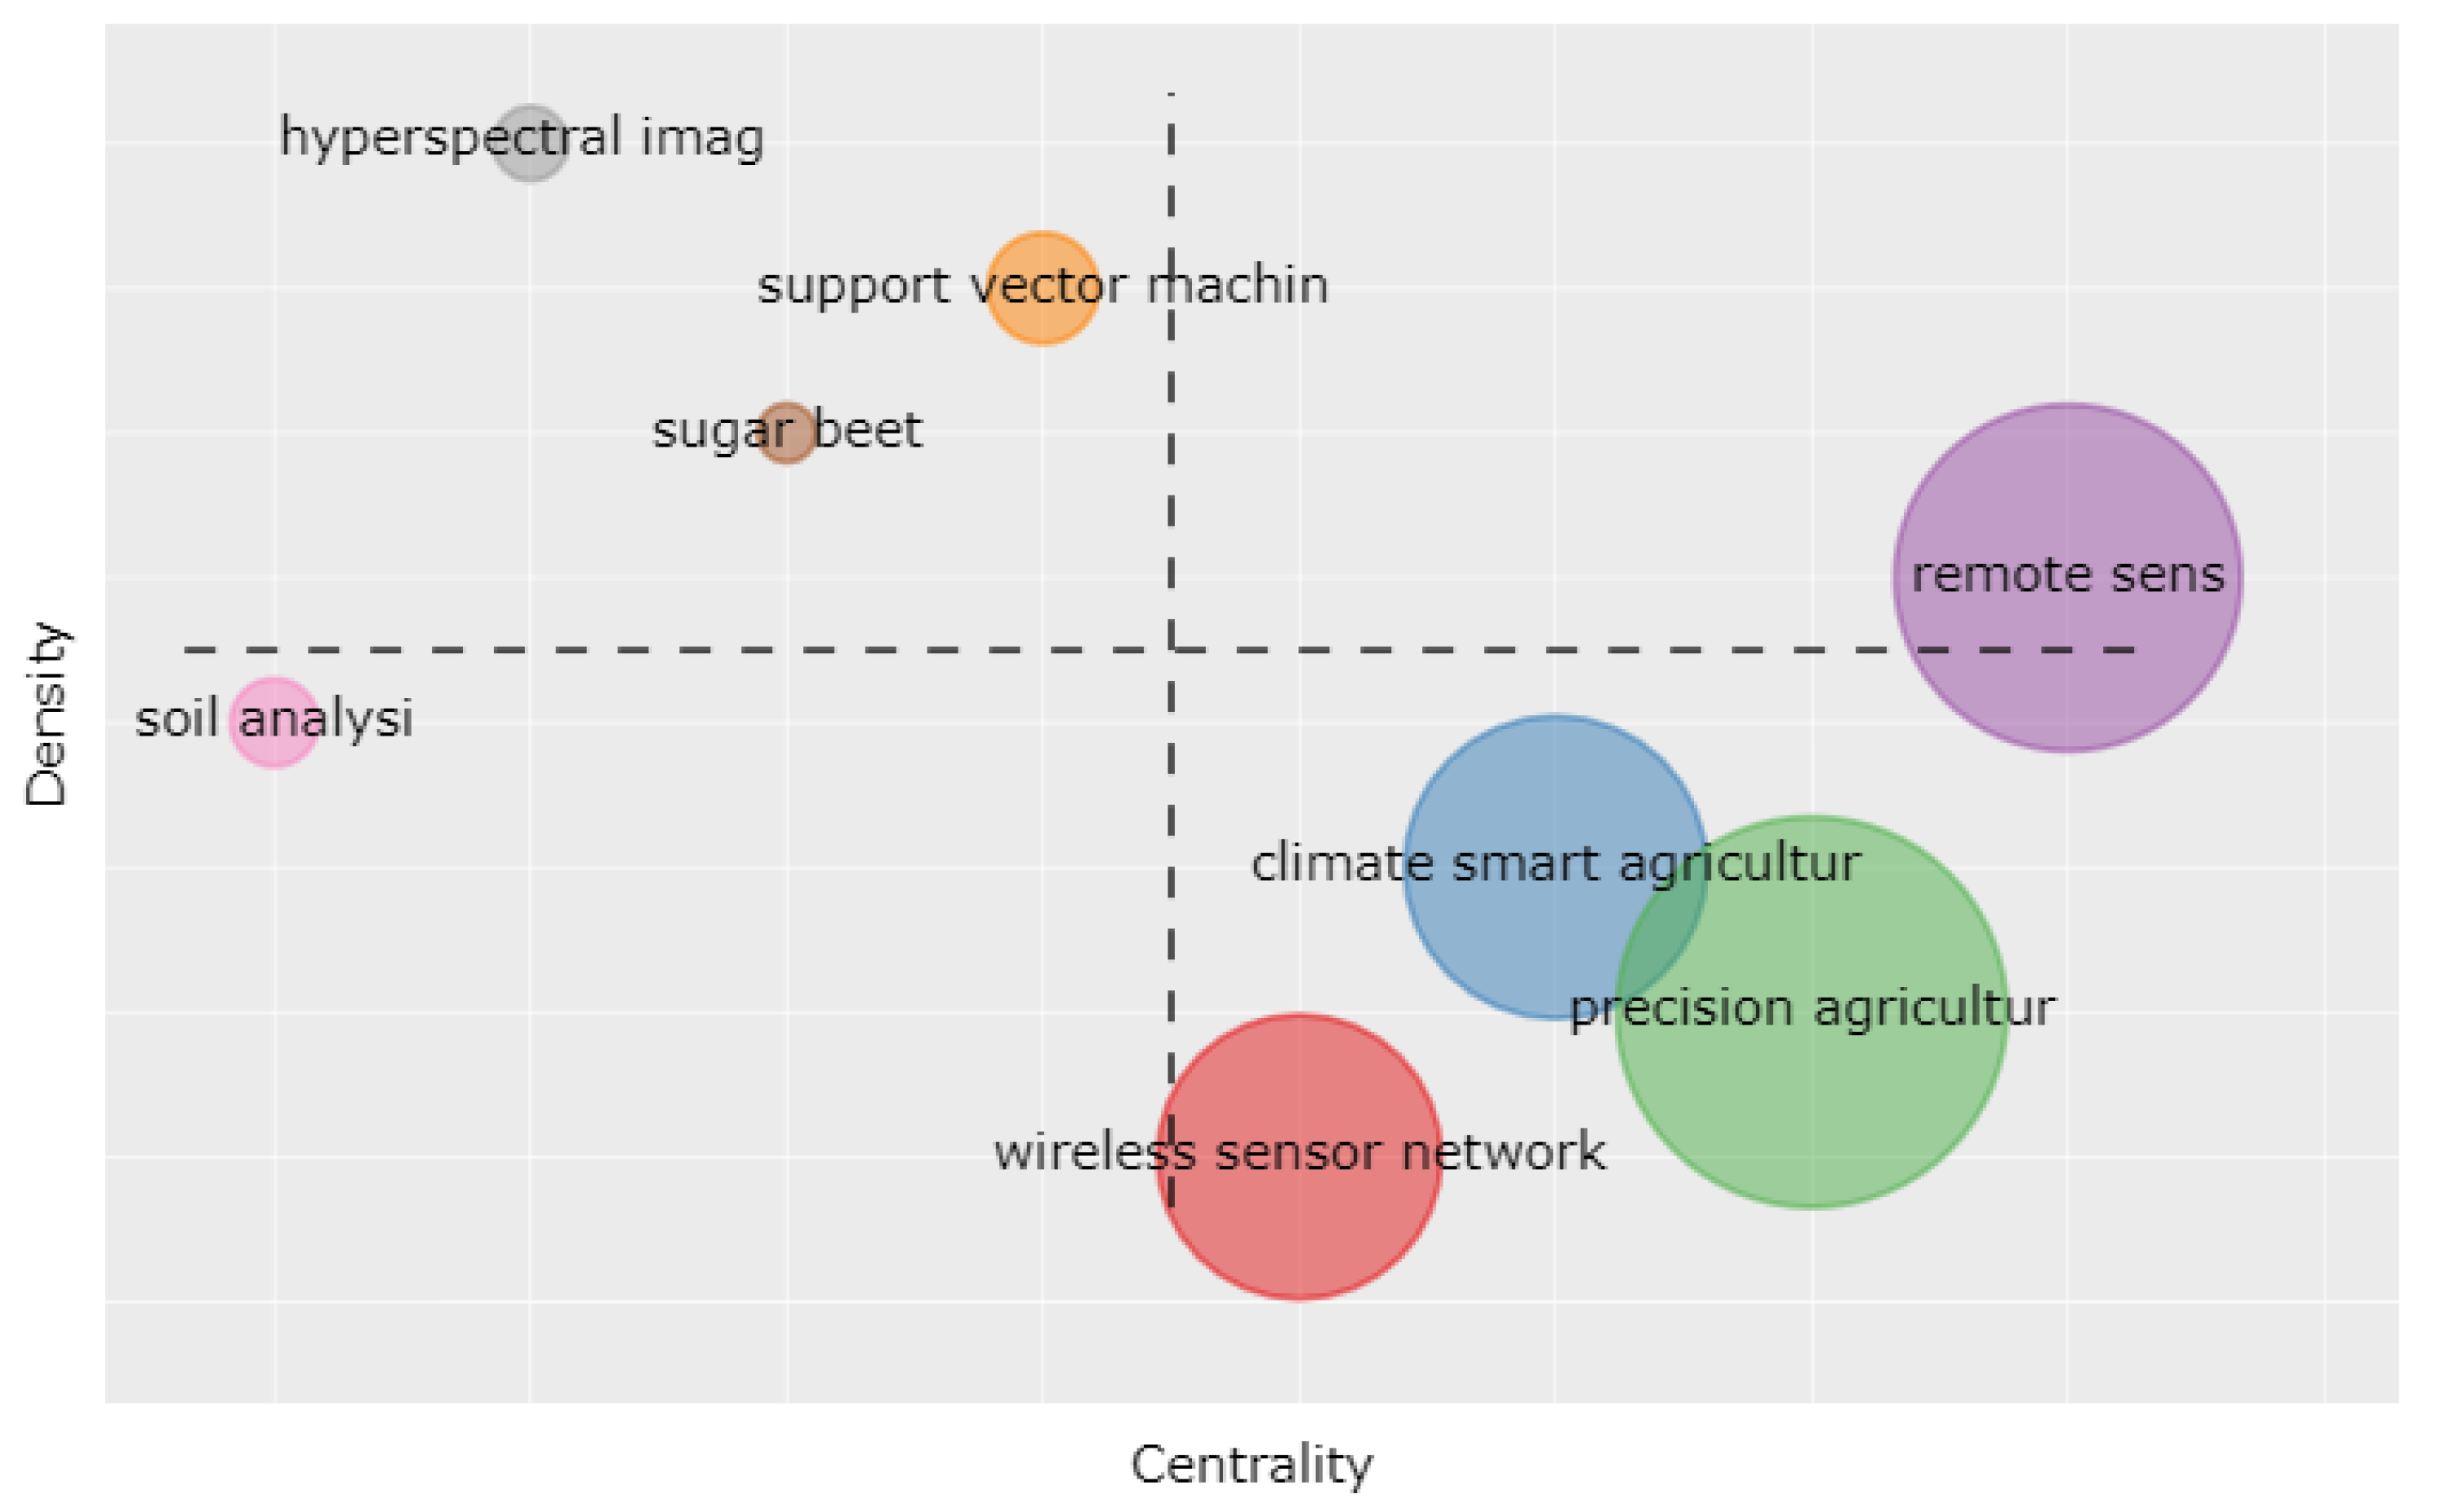
3.2.5. Strategic Diagrams by Period

The first period in Figure 10 shows the concept of nitrogen as a theme. Nitrogen is one of the most important agricultural inputs because it is indispensable fertilizer for plant growth and development [77]. Besides, nitrogen is one of the inputs that generate the most costs so that proper management and administration, facilitated by advanced ICT in agriculture, are essential for producers to generate a good profit margin [78]. The previous characteristics of nitrogen make it a central theme in the first period of advanced technology agriculture.
In the quadrant of specialized themes in Figure 10 appears the term ‘corn’, which refers to the most widespread crop in the United States [79], and where this country is a world leader in production. Therefore, it is not a surprise that, in the first stage of advanced ICT in agriculture, it remains a specialized theme. As for the lower left quadrant, themes with low centrality and density are exposed, which may be emerging or disappearing in the field, specifically ‘crop model’ is an emerging theme, where, in addition to corn, other model crops are appearing, for the exploration of new approaches associated with advanced ICT in agriculture. The lower right quadrant reflects themes with high centrality, which are of universal importance in the area, as expected, the term ‘precision agriculture’ appears, which is composed by the outstanding terms in occurrence ‘site specific’ management, ‘global position system’, and ‘spatial variation’. These terms reflect that the precision agriculture theme in the first period was focused on the specific site location variability of different properties in the agricultural fields, such as the nitrogen nutrient.
The second period shows a growth in the number of themes due to an increase in the volume of research papers associated with the area of advanced ICT in agriculture, where ‘decision support system’ appears as a major theme in Figure 11. The most relevant terms associated with this theme is ‘irrigation’ and ‘agriculture’, which suggests that decision-making systems in the management of agricultural resources, such as water, have been a central theme.
In the upper left quadrant of Figure 11 associated with specialized themes, ‘krige’ appears, which contains as outstanding terms the following words ‘map’, ‘variomap’, ‘sample’, and ‘temporal variables’, referring to geostatistical methods, which have been adopted by precision agriculture for map generation [7]. Specifically, krige method (or kriging) is an interpolation technique based on a regression of samples used to predict unknown values from known values spaced irregularly [80]. A variogram is a tool that allows analyzing the spatial behavior of a variable over a defined area, resulting in the influence of data at different distances. Based on the data provided by the theoretical variogram, the estimation by the Krige method will be carried out, which serves the farmers in estimating the distribution of variables of interest, such as nutrients throughout the crop field for proper specific site management [80].
Another specialized theme is the ‘model’ that is constituted by the term ‘wheat’, which suggests that this crop, given its importance after corn, became a model topic in the second stage of the advanced ICT in agriculture. The last theme of this quadrant is ‘dgps’, called differential GPS (DGPS) is a system in which differences between observed and computed co-ordinates ranges (known as differential corrections) at a particular known point are transmitted to users (GPS receivers at other points) to upgrade the accuracy of the user’s receivers position [7]. Unlike the first period, where most of the geolocation was given by low spatial resolution GPS, the creation of DGPS facilitated the investigation and development of devices with better spatial precision in the second stage of advanced ICT in agriculture. Additionally, the opening by the United States Department of Defense of the GPS since 2000 to the public domain [7] has facilitated a greater adoption of the DGPS theme.
In the lower-left quadrant of Figure 11, themes in emergency or disappearance are observed; in the case of advanced technology agriculture, the theme of ‘soil’ associated with the word characterization appears, referring particularly to research papers that focus on determining the characteristics of the soils by different sensing devices, which is of great interest in agricultural management. In the lower right quadrant, there are themes with high centrality and universal to the area, but without terms so closely connected due to its dynamism. Interestingly, the topic of ‘remote sensing’ is made up of outstanding terms, such as ‘vegetation index’, ‘LAI’, and ‘hyperespectrome’, the previous ones associated with indexes on characteristics of the crops taken from satellites or UAV [81]. The theme of precision agriculture remains constant concerning the first stage but with a higher number of associated terms, which indicates its enrichment with new terms, such as Geographic Information System (GIS) and apparent electrical conductivity (ECA). Electrical conductivity (EC) measurement in precision agriculture is used in 2 forms of soil bulk EC and soil ECA. This soil EC correlates with various soil properties, such as soil texture and water holding. GIS, in the strictest sense, is an information system capable of integrating, storing, editing, analyzing, sharing, and displaying geographically referenced information. As for inheritance from stage 1, in stage 2, the terms ‘specific site management’, ‘spatial variation’, ‘GPS’, and ‘nitrogen’ continue to stand out, indicating their transcendence in the area of advanced ICT in agriculture.
In the third period, remote sensing appears as a major theme in Figure 12. Unlike stage 2, this theme now contains a new and higher number of terms, such as ‘UAV’. The rise and maturation of associated technologies in the unmanned autonomous vehicles, and a higher spatial, temporal, and spectral resolution of satellites [36], have located the remote sensing theme as one of the core issues in advanced technology agriculture.
In the upper left quadrant, high-specialty themes, such as hyperspectral image stand out, which is also a consequence of the images generated by high-resolution spectral satellites, which has opened a field of studies of these images for the analysis and detection of properties of crops and soils [82]. In addition, another theme of specialty generated within this stage is the support vector machine, which is constituted by the terms ‘image classification,’ ‘plant disease’, which implies that this theme has emerged as a need to classify the vast volumes of images generated by satellites and aerial systems, to solve problems, such as the detection and characterization of diseases in plants [36,82].
Finally, the theme tagged sugar beet contains an association of the keywords ‘sugar beet’ and ‘plant phenotyping’ according to their co-occurrence within the theme cluster, appearing in the specialized themes quadrant. According to the above, the sugar beet specialized theme could suggest an emergence of remote sensing techniques in this plant’s characterization and modeling, and, moreover, evaluation and development of ICTs [83].
At this stage, the emergence of the theme of ‘soil analysis’ with the associated terms ‘spectrometric’ and ‘chemometrics’ is still observed, which suggests that this theme is related to the analysis of spectral images employing chemometric tools in the detection of soil properties and crops as the content of organic matter [81].
Finally, in the lower right quadrant of Figure 12, where the general themes of the area are concentrated, in the third period emerges two new themes ‘climate-smart agriculture’ and ‘wireless sensor network’. The climate-smart agriculture theme is composed by the most outstanding terms, such as ‘climate change’, ‘agriculture’, ‘adaptation’, ‘food security’, ‘adoption’, and ‘mitigation’. The term climate-smart agriculture was coined and first presented by the Food and Agriculture Organization (FAO) at the Hague conference on agriculture in 2010, referring to agriculture that sustainably increases productivity, favors adaptation to climate change, and mitigates possible effects of greenhouse gases through innovation, such as information and communication technology solutions [6,74].
Another theme that crystallizes in the third period of advanced technology agriculture is WSNs, which is constituted by the relevant terms, such as the ‘internet of things’, ‘neural network’, ‘smart agriculture’, ‘machine learning’, and ‘decision support system’. This theme is favored by maturation in sensor networks technologies in terms of capabilities and costs, and also in IoT field development [12]. In 1999, Kevin Ashton coined the expression of the ‘Internet of Things’ to refer to the trend toward interconnected ‘things’ that collect data through sensing and performing computations on the sensor data [84]. The enormous capacity of sense, performance, and internet connectivity of the WSNs allows covering a wide range of application and support in IoT technologies [85]. Besides, other terms that make up this theme, such as ‘neural network’, ‘smart agriculture’, ‘machine learning’, and ‘decision support system’, reflect the use of data provided by WSNs through machine learning techniques, in the classification and decision-making [9], necessary for the resolution of problems in the area of advanced ICT in agriculture.

4. Conclusions

In the dynamics of publications associated with the area of advanced ICT in agriculture, a growth trend is observed over the 25 years of study. This trend in publications has been promoted by international growth in public and private investment in agricultural research and development and the enormous development of information and communication technologies, which favor technological convergence. In addition, the use of technology allows for increased productivity and sustainability, considering climate change.
Our bibliometric approach, specifically, performance analysis, was able to detect the main actors (countries, institutions) of the 1994–2018 period associated with advanced ICT in agriculture. Countries that allocate more resources in research and development have the highest number of publications associated with the field of advanced ICT in agriculture and the highest levels of production supporting sustainable agriculture. The U.S. universities are the most productive in terms of publications, and these are associated with the states with the highest agricultural activity and manufacturing in information and communication technologies; this convergence could be favoring the scientific and technological development. Outside the United States, the institutions that stand out are the Chinese, Brazilian, and Dutch universities, following the relevance in the number of publications, agricultural production, and research and development financing of these countries.
On the side of science mapping, specifically in the collaboration networks between countries, clusters within which countries with close cultural and idiomatic relations are frequently found. Economic and academic relations could also influence the grouping of these countries. As for the co-citation networks between the different scientific journals, 3 clusters are revealed. In each cluster, the journals maintain a closer relationship of citations with each other. Precisely, one of the cluster shows journals with multidisciplinary approaches and agricultural engineering aspects.
The second cluster stands out for specializing in remote sensing, and the third cluster in generalist journals, such as science, nature, and general topics in agriculture. Regarding the collaboration networks between institutions, U.S. universities tend to be grouped in the same cluster according to their geographical proximity, which can be explained by the ease in the mobility of research resources, as well as similar climatic conditions and crops that could be representing a common research challenges to sustainable agriculture.
Regarding the grouping of terms derived from the co-occurrence of words appears 4 clusters, which represent the areas of (1) precision agriculture, (2) smart agriculture (associated with IoT application), (3) remote sensing, and (4) climate-smart agriculture.
The strategic diagrams analysis in the three periods of time reveals a transition of themes. In the first stage, the initial technologies associated with advanced ICT in agriculture, focused on precision agriculture, accurately to detect the variation of nutrients, such as nitrogen, along with the crop fields, using corn as a crop model, the world’s largest production crop. At this stage, the location of the spatial variation of nutrients occurred through immature technologies, such as GPS and satellites of low spatial and temporal resolution, which evolved in stage 2 with tools of greater spatial precision, such as DGPS and satellites of a new generation. In addition, improvements in the spectral, temporal resolution, and greater openness of satellite information are reflected in the crystallization of the remote sensing theme, generating a higher volume of data and agricultural indicators, which have favored the emergence of the ‘decision-making systems’ theme. In the transition from the second to the third stage, the WSNs theme’s emergence is highlighted, which facilitates real-time monitoring and data processing in the application of IoT technologies. New themes, such as climate-smart agriculture, indicate a trend in the application of advanced ICT in agriculture in climate change mitigation, greenhouse gas reduction, and food security. A higher spatial, temporal, and spectral resolution of the new generations of satellites, together with a higher level of development of the UAV and implementation of the WSNs, favor the generation and analysis of massive data in real-time, through techniques of machine learning and, consequently, the appearance of the theme support vector machines and its outstanding terms as ‘neural networks’ in the third stage of advanced technology agriculture. Finally, the detection of the main actors will serve as a frame of reference to establish future works, which, through interviews and information gathering with these actors, will reveal in-depth aspects about the strengths and weaknesses that influence the development and adoption of advanced ICT in agriculture for resources sustainability.
The bibliometric analysis reveals significant challenges for adopting ICT in agriculture, especially in developing countries, which do not stand out in publication numbers. One of the main strategies to overcome these challenges could be creating an environment that promotes the convergence of low-cost ICTs with agriculture through national and institutional policies that encourage farmers’ technology alphabetization. Through low-cost ICT literacy strategies in agriculture, the complexity and economic problems associated with adopting these technologies would be reduced, taking advantage of the experience and disseminating successful examples obtained in countries with technological and economic lags.

Author Contributions

Conceptualization, D.A.-M.; Data curation, D.A.-M.; Formal analysis, D.A.-M. and T.A.R.-d.; Funding acquisition, D.A.-M., T.A.R.-d. and D.V.-V.; Investigation, D.A.-M., T.A.R.-d. and D.V.-V.; Methodology, D.A.-M. and T.A.R.-d.; Project administration, D.A.-M.; Resources, D.A.-M.; Software, D.A.-M.; Supervision, D.A.-M.; Validation, D.A.-M. and T.A.R.-d.; Visualization, T.A.R.-d., D.V.-V. and C.M.-A.; Writing—original draft, D.A.-M., T.A.R.-d. and D.V.-V.; Writing—review & editing, D.A.-M., T.A.R.-d., D.V.-V. and C.M.-A. All authors have read and agreed to the published version of the manuscript.

Funding

This research received no external funding.

Acknowledgments

The authors are very grateful to the National Council of Science and Technology. Additionally, this paper was sponsored by project numbers 737, 735, 576 of the Cátedras Conacyt Program.

Conflicts of Interest

The authors declare no conflict of interest. The funders had no role in the design of the study; in the collection, analyses, or interpretation of data; in the writing of the manuscript, or in the decision to publish the results.

References

  1. Dimitri, C.; Effland, A.; Conklin, N.C. The 20th Century Transformation of U.S. Agriculture and Farm Policy; Economic Research Service; USDA: Washington, DC, USA, 2005; pp. 1–14.
  2. Khush, G.S. Green revolution: The way forward. Nat. Rev. Genet. 2001, 2, 815–822. [Google Scholar] [CrossRef] [PubMed]
  3. Pimentel, D. Green revolution agriculture and chemical hazards. Sci. Total Environ. 1996, 188, S86–S98. [Google Scholar] [CrossRef]
  4. Tilman, D. The greening of the green revolution. Nature 1998, 396, 211–212. [Google Scholar] [CrossRef]
  5. Pretty, J.N. Participatory learning for sustainable agriculture. World Dev. 1995, 23, 1247–1263. [Google Scholar] [CrossRef]
  6. Taylor, M. Climate-smart agriculture: What is it good for? J. Peasant Stud. 2018, 45, 89–107. [Google Scholar] [CrossRef]
  7. Oliver, M.A. Geostatistical Applications for Precision Agriculture; Springer Science & Business Media: New York, NY, USA, 2010. [Google Scholar]
  8. Gebbers, R.; Adamchuk, V.I. Precision agriculture and food security. Science 2010, 327, 828–831. [Google Scholar] [CrossRef] [PubMed]
  9. Dewi, C.; Chen, R.C. Decision making based on IoT data collection for precision agriculture. In Proceedings of the Asian Conference on Intelligent Information and Database Systems, Yogyakarta, Indonesia, 8–11 April 2019; pp. 31–42. [Google Scholar]
  10. Serrano, J.; Shahidian, S.; Marques da Silva, J.; Paixão, L.; Carreira, E.; Pereira, A.; Carvalho, M. Climate changes challenges to the management of Mediterranean montado ecosystem: Perspectives for use of precision agriculture technologies. Agronomy 2020, 10, 218. [Google Scholar] [CrossRef] [Green Version]
  11. Kamilaris, A.; Prenafeta-Boldú, F.X. Deep learning in agriculture: A survey. Comput. Electron. Agric. 2018, 147, 70–90. [Google Scholar] [CrossRef] [Green Version]
  12. Muangprathub, J.; Boonnam, N.; Kajornkasirat, S.; Lekbangpong, N.; Wanichsombat, A.; Nillaor, P. IoT and agriculture data analysis for smart farm. Comput. Electron. Agric. 2019, 156, 467–474. [Google Scholar] [CrossRef]
  13. Rodríguez, M.A.; Cuenca, L.; Ortiz, Á. Big Data Transformation in Agriculture: From Precision Agriculture Towards Smart Farming. In Proceedings of the Working Conference on Virtual Enterprises, Turin, Italy, 23–25 September 2019; pp. 467–474. [Google Scholar]
  14. Martinho, V.J.P.D. Agricultural Entrepreneurship in the European Union: Contributions for a Sustainable Development. Appl. Sci. 2020, 10, 2080. [Google Scholar] [CrossRef] [Green Version]
  15. Teodoro, A.; Dinis, I.; Simões, O.; Gomes, G. Success factors for small rural tourism units: An exploratory study in the Portuguese region of Serra da Estrela. Eur. J. Tour. Res. 2017, 17, 136–148. [Google Scholar]
  16. Zhuang, Y.; Liu, X.; Nguyen, T.; He, Q.; Hong, S. Global remote sensing research trends during 1991–2010: A bibliometric analysis. Scientometrics 2013, 96, 203–219. [Google Scholar] [CrossRef]
  17. Pallottino, F.; Biocca, M.; Nardi, P.; Figorilli, S.; Menesatti, P.; Costa, C. Science mapping approach to analyze the research evolution on precision agriculture: World, EU and Italian situation. Precis. Agric. 2018, 19, 1011–1026. [Google Scholar] [CrossRef]
  18. Farooq, M.S.; Riaz, S.; Abid, A.; Umer, T.; Zikria, Y.B. Role of IoT Technology in Agriculture: A Systematic Literature Review. Electronics 2020, 9, 319. [Google Scholar] [CrossRef] [Green Version]
  19. Chernyi, A. The ISI Web of Knowledge, a modern system for the information support of scientific research: A review. Sci. Tech. Inf. Process. 2009, 36, 351–358. [Google Scholar] [CrossRef]
  20. Setti, G. Bibliometric indicators: Why do we need more than one? IEEE Access 2013, 1, 232–246. [Google Scholar] [CrossRef]
  21. Aria, M.; Cuccurullo, C. bibliometrix: An R-tool for comprehensive science mapping analysis. J. Inf. 2017, 11, 959–975. [Google Scholar] [CrossRef]
  22. Tippmann, S. Programming tools: Adventures with R. Nat. News 2015, 517, 109. [Google Scholar] [CrossRef]
  23. Börner, K.; Chen, C.; Boyack, K.W. Visualizing knowledge domains. Annu. Rev. Inf. Sci. Technol. 2003, 37, 179–255. [Google Scholar] [CrossRef]
  24. Callon, M.; Courtial, J.P.; Laville, F. Co-word analysis as a tool for describing the network of interactions between basic and technological research: The case of polymer chemsitry. Scientometrics 1991, 22, 155–205. [Google Scholar] [CrossRef]
  25. Michelet, B. L’analyse des Associations. Ph.D. Thesis, Paris 7, Paris, France, 1988. [Google Scholar]
  26. De Meo, P.; Ferrara, E.; Fiumara, G.; Provetti, A. Generalized louvain method for community detection in large networks. In Proceedings of the 2011 11th International Conference on Intelligent Systems Design and Applications, Cordoba, Spain, 22–24 November 2011; pp. 88–93. [Google Scholar]
  27. Courtial, J.P.; Michelet, B. A mathematical model of development in a research field. Scientometrics 1990, 19, 127–141. [Google Scholar] [CrossRef]
  28. López-Herrera, A.G.; Cobo, M.J.; Herrera-Viedma, E.; Herrera, F. A bibliometric study about the research based on hybridating the fuzzy logic field and the other computational intelligent techniques: A visual approach. Int. J. Hybrid Intell. Syst. 2010, 7, 17–32. [Google Scholar] [CrossRef] [Green Version]
  29. Bouchet-Valat, M. SnowballC: Snowball Stemmers Based on the C Libstemmer UTF-8 Library, R Package Version 0.5. Available online: https://github.com/nalimilan/R.TeMiS/tree/master/SnowballC (accessed on 16 February 2020).
  30. Cahlik, T. Comparison of the maps of science. Scientometrics 2000, 49, 373–387. [Google Scholar] [CrossRef]
  31. Fuglie, K. The growing role of the private sector in agricultural research and development world-wide. Glob. Food Secur. 2016, 10, 29–38. [Google Scholar] [CrossRef]
  32. Mesas-Carrascosa, F.; Santano, D.V.; Meroño, J.; De La Orden, M.S.; García-Ferrer, A. Open source hardware to monitor environmental parameters in precision agriculture. Biosyst. Eng. 2015, 137, 73–83. [Google Scholar] [CrossRef]
  33. Pardey, P.G.; Alston, J.M.; Chan-Kang, C.; Hurley, T.M.; Andrade, R.S.; Dehmer, S.P.; Lee, K.; Rao, X. The shifting structure of agricultural R&D: Worldwide investment patterns and payoffs. In From Agriscience to Agribusiness; Springer: Cham, Switzerland, 2018; pp. 13–39. [Google Scholar]
  34. Kushwaha, M.; Raghuveer, V. Survey of impact of technology on effective implementation of precision farming in India. Int. J. Recent Innov. Trends Comput. Commun. 2017, 5, 1300–1310. [Google Scholar]
  35. Chen, W.; Lin, Y.; Lin, Y.; Chen, R.; Liao, J.; Ng, F.; Chan, Y.; Liu, Y.; Wang, C.; Chiu, C.; et al. AgriTalk: IoT for Precision Soil Farming of Turmeric Cultivation. IEEE Internet Things J. 2019, 6, 5209–5223. [Google Scholar] [CrossRef]
  36. Mulla, D.J. Twenty five years of remote sensing in precision agriculture: Key advances and remaining knowledge gaps. Biosyst. Eng. 2013, 114, 358–371. [Google Scholar] [CrossRef]
  37. Wu, J.Z.; Han, S.; Liu, J. Application Progress of Agricultural Internet of Things in Major Countries. J. Phys. Conf. Ser. 2018, 1087, 032013. [Google Scholar] [CrossRef]
  38. Pardey, P.G.; Alston, J.M.; Chan-Kang, C. Public agricultural R&D over the past half century: An emerging new world order. Agric. Econ. 2013, 44, 103–113. [Google Scholar]
  39. Suebsombut, P.; Sekhari, A.; Sureepong, P.; Ueasangkomsate, P.; Bouras, A. The using of bibliometric analysis to classify trends and future directions on “smart farm”. In Proceedings of the 2017 International Conference on Digital Arts, Media and Technology (ICDAMT), Chiang Mai, Thailand, 1–4 March 2017; pp. 136–141. [Google Scholar]
  40. Lakitan, B. Research and technology development in Southeast Asian economies are drifting away from agriculture and farmers’ needs. J. Sci. Technol. Policy Manag. 2019, 10, 251–272. [Google Scholar] [CrossRef]
  41. Dinçer, H.; Yüksel, S.; Adalı, Z.; Aydın, R. Evaluating the role of research and development and technology investments on economic development of E7 countries. In Organizational Transformation and Managing Innovation in the Fourth Industrial Revolution; IGI Global: Extremadura, Spain, 2019; pp. 245–263. [Google Scholar]
  42. Meo, S.A.; Al Masri, A.A.; Usmani, A.M.; Memon, A.N.; Zaidi, S.Z. Impact of GDP, spending on R&D, number of universities and scientific journals on research publications among Asian countries. PLoS ONE 2013, 8, e66449. [Google Scholar]
  43. Vinkler, P. Correlation between the structure of scientific research, scientometric indicators and GDP in EU and non-EU countries. Scientometrics 2008, 74, 237–254. [Google Scholar] [CrossRef]
  44. Schreyer, P. The Contribution of Information and Communication Technology to Output Growth: A Study of the G7 Countries; Technical Report; OECD Publishing: Paris, France, 2000. [Google Scholar]
  45. United States Department of Agriculture (USDA); Economic Research Service (ERS). U.S. Agricultural Trade Data Update. Available online: https://www.ers.usda.gov/data-products/foreign-agricultural-trade-of-the-united-states-fatus/us-agricultural-trade-data-update/ (accessed on 5 December 2020).
  46. Huang, J.k.; Wei, W.; Qi, C.; Wei, X. The prospects for China’s food security and imports: Will China starve the world via imports? J. Integr. Agric. 2017, 16, 2933–2944. [Google Scholar] [CrossRef]
  47. Qiu, Z.; He, Y.; Li, W. A note on the adoption of precision agriculture in eastern China. Outlook Agric. 2007, 36, 255–257. [Google Scholar] [CrossRef]
  48. Hopkins, M. Precision Agriculture In China—PrecisionAg. Available online: https://www.precisionag.com/market-watch/precision-agriculture-in-china/ (accessed on 16 February 2020).
  49. Guanziroli, C.E. Agronegócio no Brasil: Perspectivas e limitações. Economia Texto para Discussão 2006, 186, 1–59. [Google Scholar]
  50. Pivoto, D.; Waquil, P.D.; Talamini, E.; Finocchio, C.P.S.; Dalla Corte, V.F.; de Vargas Mores, G. Scientific development of smart farming technologies and their application in Brazil. Inf. Process. Agric. 2018, 5, 21–32. [Google Scholar] [CrossRef]
  51. Egea, F.J.; Torrente, R.G.; Aguilar, A. An efficient agro-industrial complex in Almería (Spain): Towards an integrated and sustainable bioeconomy model. New Biotechnol. 2018, 40, 103–112. [Google Scholar] [CrossRef]
  52. Robinson, D. How Spanish Bank Ibercaja Built a Precision Farming Platform to Save Water. Available online: https://www.nsagriculture.com/analysis/ibercaja-farming-iot/ (accessed on 16 February 2020).
  53. Hunt, W.; Birch, C.; Coutts, J.; Vanclay, F. The many turnings of agricultural extension in Australia. J. Agric. Educ. Ext. 2012, 18, 9–26. [Google Scholar] [CrossRef]
  54. Court, C.D.; Hodges, A.W.; Rahmani, M.; Spreen, T.H. Economic Contributions of the Florida Citrus Industry in 2015-2016. EDIS 2018, 2018. [Google Scholar] [CrossRef]
  55. United States Department of Agriculture (USDA); National Agricultural Statistics Service Information (NASS). State Agriculture Overview for Florida. Available online: https://www.nass.usda.gov/Quick_Stats/Ag_Overview/stateOverview.php?state=FLORIDA (accessed on 3 February 2020).
  56. United States Department of Agriculture (USDA); National Agricultural Statistics Service Information (NASS). State Agriculture Overview for Nebraska. Available online: https://www.nass.usda.gov/Quick_Stats/Ag_Overview/stateOverview.php?state=NEBRASKA (accessed on 3 February 2020).
  57. Herian, M.; Thomspon, E. The 2016 Nebraska Manufacturing Report; Nebraska Manufacturing Extension Partnership: Lincoln, NE, USA, 2016. [Google Scholar]
  58. Hoy, R.M.; Kocher, M.F. The Nebraska Tractor Test Laboratory: 100 Years of Service. ASABE Disting. Lect. Ser. 2020, 41, 1–14. [Google Scholar]
  59. Stackpole, A.; Michlberger, A.; Mardula, P.; Hoy, R.; Geyer, J.; Triplett, D. Farm Tractor Efficiency Gains through Optimized Heavy-Duty Diesel Engine Oils; Technical Report, SAE Technical Paper; SAE International: Heidelberg, Germany, 2018. [Google Scholar]
  60. United States Department of Agriculture (USDA); National Agricultural Statistics Service Information (NASS). State Agriculture Overview for Missouri. Available online: https://www.nass.usda.gov/Quick_Stats/Ag_Overview/stateOverview.php?state=MISSOURI (accessed on 3 February 2020).
  61. United States Department of Agriculture (USDA); National Agricultural Statistics Service Information (NASS). 2017 Census of Agriculture: State Level Data. Available online: https://www.nass.usda.gov/Publications/AgCensus/2017/ (accessed on 3 February 2020).
  62. Missouri Economic Indicator Brief: Manufacturing Manufacturig Industries. State Agriculture Overview for Nebraska. Available online: https://meric.mo.gov/media/pdf/manufacturing-industries-brief (accessed on 3 February 2020).
  63. Olmstead, A.L.; Rhode, P.W. A history of California agriculture. Giannini Found. Agric. Economics. Davis Univ. Calif. Agric. Nat. Resour. 2017, 17, 1–24. [Google Scholar]
  64. Morgan, N.; McNamee, G. California. Available online: https://www.britannica.com/place/California-state/Economy (accessed on 3 February 2020).
  65. Buzheng, W. Beijing Nongye Daxue Xiaoshi (1949–1987)(History of Beijing Agricultural University [1949–1987]); Beijing Nongye Daxue Chubanshe: Beijing, China, 1995. [Google Scholar]
  66. Borghi, E.; Avanzi, J.C.; Bortolon, L.; Luchiari Junior, A.; Bortolon, E.S. Adoption and use of precision agriculture in Brazil: Perception of growers and service dealership. In Embrapa Milho e Sorgo-Artigo em Periódico Indexado (ALICE); Canadian Center of Science and Education: Richmond Hill, ON, Canada, 2016. [Google Scholar]
  67. Hopkins, M. 25 Best Colleges for Precision Agriculture—PrecisionAg 2018. Available online: https://www.precisionag.com/market-watch/25-best-colleges-for-precision-agriculture/ (accessed on 16 February 2020).
  68. Zhang, C.; Kovacs, J.M. The application of small unmanned aerial systems for precision agriculture: A review. Precis. Agric. 2012, 13, 693–712. [Google Scholar] [CrossRef]
  69. Stagakis, S.; González-Dugo, V.; Cid, P.; Guillén-Climent, M.L.; Zarco-Tejada, P.J. Monitoring water stress and fruit quality in an orange orchard under regulated deficit irrigation using narrow-band structural and physiological remote sensing indices. ISPRS J. Photogramm. Remote Sens. 2012, 71, 47–61. [Google Scholar] [CrossRef] [Green Version]
  70. Rossel, R.V.; Walvoort, D.; McBratney, A.; Janik, L.J.; Skjemstad, J. Visible, near infrared, mid infrared or combined diffuse reflectance spectroscopy for simultaneous assessment of various soil properties. Geoderma 2006, 131, 59–75. [Google Scholar] [CrossRef]
  71. Haboudane, D.; Miller, J.R.; Pattey, E.; Zarco-Tejada, P.J.; Strachan, I.B. Hyperspectral vegetation indices and novel algorithms for predicting green LAI of crop canopies: Modeling and validation in the context of precision agriculture. Remote Sens. Environ. 2004, 90, 337–352. [Google Scholar] [CrossRef]
  72. Raitzer, D.A.; Kelley, T.G. Benefit–cost meta-analysis of investment in the International Agricultural Research Centers of the CGIAR. Agric. Syst. 2008, 96, 108–123. [Google Scholar] [CrossRef] [Green Version]
  73. Eastwood, C.; Chapman, D.; Paine, M. Networks of practice for co-construction of agricultural decision support systems: Case studies of precision dairy farms in Australia. Agric. Syst. 2012, 108, 10–18. [Google Scholar] [CrossRef]
  74. Aisenberg, Igal. EMCompass, No. 46. International Finance Corporation, Washington, DC©. Precision Farming Enables Climate-Smart Agribusiness. Available online: https://openknowledge.worldbank.org/handle/10986/30372 (accessed on 16 February 2020).
  75. Ministero degli Affari Esteri e della Cooperazione Internazionale. Joint Declaration after the 12th U.S.-Italy Joint Comission Meeting on Science and Technology Cooperation. Available online: https://www.esteri.it/mae/resource/doc/2017/02/20160114it_us_s_t12%20jdannex4_%20actionplandef.pdf (accessed on 4 December 2020).
  76. Shuai, C. Sino–US agricultural trade potential: A gravity model approach. Outlook Agric. 2010, 39, 169–176. [Google Scholar] [CrossRef]
  77. Werner, D.; Newton, W.E. Nitrogen Fixation in Agriculture, Forestry, Ecology, and the Environment; Springer Science & Business Media: Dordrecht, The Netherlands, 2005; Volume 4. [Google Scholar]
  78. Ribaudo, M.; Delgado, J.; Hansen, L.; Livingston, M.; Mosheim, R.; Williamson, J. Nitrogen in agricultural systems: Implications for conservation policy. USDA-ERS Econ. Res. Rep. 2011, 1, 127. [Google Scholar] [CrossRef] [Green Version]
  79. Ort, D.R.; Long, S.P. Limits on yields in the corn belt. Science 2014, 344, 484–485. [Google Scholar] [CrossRef] [PubMed]
  80. Ponce-Rojas, J.; Vidal-Beltrán, S.; López-Bonilla, J.L.; Jimenez-Licea, M. Krige method application for the coverage analysis of a node-B in a WCDMA network. Int. J. Commun. Netw. Syst. Sci. 2011, 4, 180. [Google Scholar] [CrossRef] [Green Version]
  81. Peng, Y.; Xiong, X.; Adhikari, K.; Knadel, M.; Grunwald, S.; Greve, M.H. Modeling soil organic carbon at regional scale by combining multi-spectral images with laboratory spectra. PLoS ONE 2015, 10, e0142295. [Google Scholar] [CrossRef] [PubMed] [Green Version]
  82. Hank, T.B.; Berger, K.; Bach, H.; Clevers, J.G.; Gitelson, A.; Zarco-Tejada, P.; Mauser, W. Spaceborne imaging spectroscopy for sustainable agriculture: Contributions and challenges. Surv. Geophys. 2019, 40, 515–551. [Google Scholar] [CrossRef] [Green Version]
  83. Mahlein, A.K.; Kuska, M.T.; Thomas, S.; Wahabzada, M.; Behmann, J.; Rascher, U.; Kersting, K. Quantitative and qualitative phenotyping of disease resistance of crops by hyperspectral sensors: Seamless interlocking of phytopathology, sensors, and machine learning is needed! Curr. Opin. Plant Biol. 2019, 50, 156–162. [Google Scholar] [CrossRef]
  84. Tzounis, A.; Katsoulas, N.; Bartzanas, T.; Kittas, C. Internet of Things in agriculture, recent advances and future challenges. Biosyst. Eng. 2017, 164, 31–48. [Google Scholar] [CrossRef]
  85. Barcelo-Ordinas, J.M.; Chanet, J.P.; Hou, K.M.; García-Vidal, J. A survey of wireless sensor technologies applied to precision agriculture. In Precision Agriculture’13; Springer: Wageningen, The Netherlands, 2013; pp. 801–808. [Google Scholar]
Figure 1. Annual evolution of published papers.
Agronomy 10 01989 g001
Figure 2. The number of papers associated with the first authors of the different countries associated with advanced information and communication technologies (ICT) in agriculture along the 25 years of the bibliometric study. In the X-axis is indicated the number of documents published. In the Y-axis, the number of first authors with country affiliation is indicated. Only the ten most outstanding countries in the first author’s number of papers are plotted. The label SCP refers to single publication country publications, and MCP corresponds to multiple publications countries.
Agronomy 10 01989 g002
Figure 3. The most relevant institutions in paper number associated with advanced ICT in agriculture for the 1994–2018 period. The relevance is measured according to the occurrence number of an affiliation of all co-authors for each paper.
Agronomy 10 01989 g003
Figure 4. Most relevant journals associated with advanced ICT in agriculture by paper number in the window of 1994 to 2018.
Agronomy 10 01989 g004
Figure 5. Summary of the five most cited papers of the last twenty-five years for the area of precision agriculture, according to the total citations per year. Besides, it presents the research summary and its main applications. Finally, Table 1 allows us to observe the main trends in technologies, such as Unmanned Aerial Vehicle (UAV), vision, and remote sensing, used in advanced ICT in agriculture.
Agronomy 10 01989 g005
Figure 6. Institution collaboration network was generated using the top 30 nodes (outstanding institutions). Clusters in colors derived from the Louvain algorithm. The word size is proportional to institution collaboration and the edges to the collaboration degree between institutions.
Agronomy 10 01989 g006
Figure 7. The co-citation network was generated using the top 30 nodes (leading journals). Clusters in colors derived from the Louvain algorithm. The word size is proportional to journal citation and the edges to the co-citation degree between journals.
Agronomy 10 01989 g007
Figure 8. Word co-occurrence network was generated using the top 30 nodes (outstanding words). Clusters in colors derived from the Louvain algorithm. The word size is proportional to word occurrences and the edges to the association strength index between words.
Agronomy 10 01989 g008
Figure 9. The country collaboration network was generated using the top 30 nodes (outstanding countries). Clusters in colors derived from the Louvain algorithm. The word size is proportional to a country’s collaboration and the edges to the collaboration between countries.
Agronomy 10 01989 g009
Figure 10. Thematic map of advanced technologies in agriculture corresponding to the 1994–2002 (first period). The circle area represents the abundance of a theme in the literature. The X-axis represents the callon’s centrality of the themes in the network, and the Y-axis the density.
Agronomy 10 01989 g010
Figure 11. Thematic map of advanced technologies in agriculture corresponding to the 2003–2010 (second period). The circle area represents the abundance of a theme in the literature. The X-axis represents the callon’s centrality of the themes in the network and the Y-axis the density.
Agronomy 10 01989 g011
Figure 12. Thematic map of advanced technologies in agriculture corresponding to the 2011–2018 (third period). The circle area represents the abundance of a theme in the literature. The X-axis represents the callon’s centrality of the themes in the network, and the Y-axis the density.
Agronomy 10 01989 g012
Table 1. Most cited papers summary.
AuthorsTitleTopicsApplications
Zhang, C., Kovacs, J.M.The application of small unmanned aerial systems for precision agriculture: a reviewUAV, vision in agriculture, and decision support system.Plant disease detection, crop monitoring, water stress detection, and vegetation index.  
Mulla, David J.Twenty five years of remote sensing in precision agriculture: Key advances and remaining knowledge gaps  Remote sensing, satellite images, UAV, and computer vision in agriculture.Crop monitoring, soil properties determination, and crop indexes determination.  
Rossel, R. V., Walvoort, D. J. J., McBratney, A. B., Janik, L. J., and Skjemstad, J. O.Visible, near infrared, mid infrared or combined diffuse reflectance spectroscopy for simultaneous assessment of various soil properties  Remote sensing, computer vision, soil study, and hyperspectral image analysis.Analysis of soil properties. 
Haboudane, D., Miller, J.R., Pattey, E., Zarco-Tejada, P.J., Strachan, I.B.Hyperspectral vegetation indices and novel algorithms for predicting green LAI of crop canopies: Modeling and validation in the context of precision agriculture  Precision agriculture, leaf area index, hyperspectral images, and vision in agriculture.Plant stress detects, detect vegetative, active and reproductive growth stages, plant stress detects, predict leaf area index, and crop canopy. 
Stagakis, S., González-Dugo, V., Cid, P., Guillén-Climent, M. L., and Zarco-Tejada, P. J.Monitoring water stress and fruit quality in an orange orchard under regulated deficit irrigation using narrow-band structural and physiological remote sensing indices  UAV, airbone imagery, remote sensing, and vision in agriculture.Water status, water stress, estimation crop evapotranspiration, and fruit quality. 
Publisher’s Note: MDPI stays neutral with regard to jurisdictional claims in published maps and institutional affiliations.

