Article

Disclosing the Nutritional Quality Diversity of Portuguese Common Beans—The Missing Link for Their Effective Use in Protein Quality Breeding Programs

1
ITQB NOVA, Instituto de Tecnologia Química e Biológica António Xavier, Universidade Nova de Lisboa, Av. da República, 2780-157 Oeiras, Portugal
2
INIAV, Instituto Nacional de Investigação Agrária e Veterinária, Av. da República, 2784-505 Oeiras, Portugal
3
FCT NOVA, Faculdade de Ciências e Tecnologia da Universidade Nova de Lisboa, 2829-516 Caparica, Portugal
4
Faculdade de Farmácia, Universidade de Lisboa, Av. das Forças Armadas, 1649-019 Lisboa, Portugal
5
IAS, Institute for Sustainable Agriculture, CSIC, Avda Menéndez Pidal s/n, 14004 Córdoba, Spain
6
iBET, Instituto de Biologia Experimental e Tecnológica, Av. da República, Apartado 12, 2781-901 Oeiras, Portugal
*
Author to whom correspondence should be addressed.
Submission received: 30 December 2020 / Revised: 20 January 2021 / Accepted: 21 January 2021 / Published: 24 January 2021
(This article belongs to the Special Issue Nutritional Quality of Crops)

Abstract

:
The common bean (Phaseolus vulgaris L.) represents a sustainable and affordable source of protein, namely, to populations with vegetarian dietary habits. Despite the national germplasm genetic diversity, little is known about the Portuguese accessions’ nutritional and protein quality, leading to their underuse in breeding programs. To fill this gap, a representative collection (106 accessions) was cropped under two contrasting environments (traditional versus heat stress) and evaluated in terms of nutritional quality by near-infrared spectroscopy. Protein quality was assessed, under the stressful environment, considering the individual amino acid contents and the activity of trypsin inhibitors through mass spectrometry (LC-MS/MS) and spectrophotometry, respectively. On top of strong genotypic control, the nutritional composition (protein, fat, fiber, moisture and ash) was also highly influenced by the environment and by genotype × environment interaction, with a clear nutritional quality ranking change for the accessions in heat stress conditions. Classified into three clusters, the accessions from the cluster with the highest individual amino acid and protein contents also showed higher trypsin inhibitor activity (TIA). Since different levels of TIA had no translation into contrasting protein digestibility, breeders focusing on common beans’ protein quality improvement, especially under challenging warming climate conditions, may take advantage of this group of accessions.

1. Introduction

According to the World Health data platform, worldwide, in 2019, 21.3% (144 million), 6.9% (47 million) and 5.6% (38 million) of all children under 5 years old were suffering from, respectively, stunting (low height for age), wasting (low weight for height) or overweight (excess weight for height) [1]. Factors such as limited natural resources and vital cropland, poor investment in affordable sustainable food systems and the lack of access to local food diversity are among the major causes of malnutrition [2,3]. To avoid malnutrition and its negative impacts at individual and social levels, populations should be aware of the importance of a healthy diet [4], and have access to affordable dietary sources of protein such as legumes.
Despite legumes’ undeniable ecological and nutritional value in food and feed systems [5,6], through enhancement of soil’s nutritional state and diversification of farming systems [5,6], in Europe, between 1961 and 2013, governmental policies encouraged farmers to produce cereals intensively, thereby reducing the legume cropland. This led to increased external dependence on vegetal protein for human and animal consumption [7,8,9]. Furthermore, at a global scale, climate change is one of the most important challenges that affect food production, including legumes. Prediction models anticipate an increase of temperature in the order of 2–4 °C over the next century, which will affect crops, especially at the reproduction stage (flowering and seedling) [10,11]. The aggravation of existing agronomic problems due to climate change will be particularly important for the Mediterranean basin [12]. Under stressful environmental conditions (e.g., water deficit, nitrogen-deficient soils) the interactions established between ureidic legume species such as Phaseolus vulgaris L. and soil bacteria will mediate crop productivity [13]. As a rhizobial, nodulated, N2-fixing legume, the symbiotic relationships of Actinobacteria, Bacteroidetes and Firmicutes facilitate nutrient uptake and seeding under challenging environments. The fixed atmospheric nitrogen is reduced by nodule bacteria into ammonia which subsequently participates in purine synthesis (e.g., uric acid) in the form of glutamine. The hydrolysis of uric acid gives rise to ureides (allantoin and allantoic acid) that represent 86% of the nitrogen in plant xylem [14]. Although the interactions of soil the microbiome and plant genotypes will require further investigation, the value of these ureides as the main forms of nitrogen transport and storage in the nodulated nitrate fed-plants is well recognized. Nevertheless, after nitrogen fertilization (nitrate fed-plants), the amides asparagine and glutamine are the major compounds responsible by the transport and storage of nitrogen [14]. Studies dedicated to the identification of genotypes capable of producing high quality seeds at supra-optimal temperatures, making use of genotype (G) × environment (E) interactions by breeding for specific adaptations, are still scarce and should be a priority for grain legume breeders to ensure viable adapted crops with nutritional quality for future generations [10,11].
Grain legumes represent a rich source of protein [5,6]. In fact for some communities, particularly those with vegetarian dietary habits, grain legumes are the main source of dietary protein. The improvement of protein yield has been one of the major breeding goals for legumes, relegating protein quality to a secondary position [15].
Protein quality, defined by Food and Agriculture Organization (FAO) as the capacity of a food protein source and diet to meet the protein and essential amino-nitrogen requirements [16], can be evaluated in terms of amino acid composition and protein digestibility. Amino acids have been traditionally classified as essential and “non-essential” (Table S1) [17].
Contrarily to “non-essential” amino acids (NEAAs), the essential amino acids (EAAs) must be provided by the diet, since their carbon skeleton cannot be synthesized in living organisms or the synthesis rate is not adequate to sustain normal growth and health. Nevertheless, the NEAAs have recently been considered indispensable for living organisms’ survival, rendering the term “non-essential” as inadequate [18]. To evaluate protein digestibility, several in vitro and in vivo methods have been described. Due to the high correlation with in vivo protein digestibility, in vitro methods have gained researchers attention due to their simpler and less expensive application [19].
In a plant genotype-dependent way, the protein quality of legumes can be impaired by the reduced content of sulfur amino acids (methionine and cysteine) and by the presence of anti-nutritional factors (such as enzymatic inhibitors, saponins and tannins) that interfere with protein digestibility. Other factors that influence legumes’ protein quality include environmental conditions during the growing season and food preparation methods (e.g., traditional cooking or microwaving) [20].
Strategies such as blending legumes and cereals in the diet to balance amino acid intake and/or selecting through breeding programs, from locally adapted legume collections, the most promising genotypes in terms of amino acid contents, represent effective approaches for protein quality improvement in foods [21]. The breeding strategy should be promoted to ensure the future access of human populations to viable legume varieties characterized by higher protein quality.
In Portugal, despite high genetic diversity among common bean accessions [22], there is a lack of information regarding their nutritional and protein quality, hampering their exploitation in national or worldwide breeding programs and their contribution to a sustainable high quality diet. The present research was conducted to overcome this gap in knowledge. The initial focus was on the overall nutritional composition of a representative collection of Portuguese common bean accessions cropped under contrasting environments (traditional versus heat stress environment) and afterwards on the protein quality (amino acid composition, trypsin inhibitor activity and in vitro protein digestibility) of the accessions cropped under the most stressful environment.
Regarding the nutritional parameters, this research was designed to characterize the existent variability among Portuguese common bean accessions, identifying for the first time the most promising common beans accessions, sources of high protein quality, in a stressful environment mimicking future climatic changes. Moreover, this research aimed to enrich the existent worldwide legume composition databases, which are currently missing a detailed characterization of the nutritional parameters and amino acid contents in the national common bean accessions [19]. By doing so, we will be also promoting consumption, preservation and the introduction of Portuguese common bean accessions into future national or worldwide breeding programs more focused on the improvement of the common bean’s protein quality.

2. Materials and Methods

2.1. Chemicals

Milli-Q® water (18.2 MΩ·cm) was obtained from a Millipore–Direct Q3 UV System (Molsheim, France). Chloride acid (HCl), formic acid (98% p.a) and acetonitrile for HPLC Plus gradient grade were purchased from Carlo Erba Reagents SAS (Val de Reuil, France). Phenol BioXtra ≥ 99.5% (GC), nonafluoropentanoic acid, bovine trypsin from bovine pancreas ≥ 10,000 BAEE units/ mg protein, calcium chloride dehydrated (CaCl2.2H2O), benzoyl-L-arginine-p-nitroanilide (L-BAPA), dimethyl sulfoxide (DMSO), tris(hydroxymethyl)aminomethane, glacial acetic acid (≥99%), sodium hydroxide (NaOH), porcine trypsin type IX-S, bovine α-chymotrypsin, type II, Streptomyces griseus protease, type XIV and casein from bovine milk were obtained from Sigma-Aldrich (St. Louis, MI, USA). Amino acids standard H was purchased from Thermo Fisher Scientific (Rockford, MA, USA).

2.2. Plant Material

A collection of 106 common bean (Phaseolus vulgaris L.) accessions was provided by the Research Unit of Biotechnology and Genetic Resources germplasm bank, located at INIAV, Oeiras, Portugal. These accessions were selected to represent varieties collected from all traditional common bean growing regions in Portugal. In order to study the impacts of genotype and environment on the general nutritional composition, meaning macronutrients (protein, carbohydrate and fat), fiber, ash and moisture contents, the different accessions were cropped in field trials using a randomized complete block design with two replicates in two different environments. Cabrela represented a standard common bean production area in Portugal (Global Positioning System, GPS, coordinates: latitude–38°52′6.816″ N and longitude–9°21′15.804″ W) and Córdoba, a heat stress prone production area in Spain (GPS coordinates: latitude–37°53′29.58″ N and longitude–4°46′21.90″ W). The two environments were characterized by different average temperature ranges (18–21 °C in Cabrela and 15–32 °C in Córdoba), different average ranges of relative humidity (66–80% in Cabrela and 31–63% in Córdoba) during the growing season [23] (Figure S2) and different soil types. In Cabrela the soil was classified as eutric cambisol and in Córdoba as fluvisol [24]. In Cabrela, the growing season extended from May to September 2014 and in Córdoba from March to July 2015. The two field trials were established under artificial irrigation and a NPK fertilizer was applied at sowing in a rate of 250 kg/ha. Mature dried seeds (from a total of 106 accessions) were collected—66 accessions from the two field trials, 12 and 28 exclusively collected from Cabrela and Córdoba, respectively. The mature seeds collected from Cabrela were artificially dried in a seed drying room under continuous air flow. Each accession’s final yield per plot was measured at harvest and expressed as kg/ha. Protein quality was evaluated only for the accessions cropped under the most stressful environment (Córdoba). Data relative to seed color and pattern, seed size, gene pool and geographical origin were detailed previously [22], and summarized in Table S2.

2.3. Sample Preparation

The mature dried seeds were milled (Falling n° 3100–Perten, Sweden) to a particle size of 0.8 mm and stored at −20 °C, until further analysis.

2.4. General Nutritional Composition

2.4.1. Total Protein, Fat, Fiber, Moisture and Ash Content

Total protein, fat, fiber, moisture and ash (%) were determined by a near-infrared (NIR) analyzer (MPA; Bruker, Billerica, MA, USA), using the flour calibrations for grain legumes provided by Bruker, as described by Serrano et al. [25].

2.4.2. Calculated Total Carbohydrate Content

As determined in FoodData Central, by USDA [26], the total carbohydrates were determined following the equation (Equation (1))
T o t a l   C a r b o h y d r a t e s   ( c a l c u l a t e d ) =   100 ( T o t a l   P r o t e i n + T o t a l   F a t + M o i s t u r e + A s h )

2.5. Protein Quality

2.5.1. Amino Acids’ Extraction

The extraction of amino acids was performed according to Jajic et al. [27]. Briefly, 0.5 g of common bean seed whole flour were hydrolyzed, in a solution of HCl 6 M with 0.1% of phenol (7 mL), during 6 h at 150 °C. After dryness in a Speedvac concentrator (Labconco®, Kansas City, MO, USA), HCl 0.1 M (5 mL) was added to each tube and vortexed. The mixture was then centrifuged at 5000× g during 15 min. The supernatant was collected and filtered using cellulose acetate filters 0.20 μm. The final extract was preserved at −20 °C, until analysis. The extraction was performed in duplicate.

2.5.2. Amino Acid Content

The LC-MS/MS system used was a Waters Alliance 2695 HPLC system coupled to a triple quadrupole mass spectrometer, Micromass® Quattro micro API (Micromass, Waters, Milford, MA, USA), equipped with an electro spray ionization source (ESI). The chromatographic separation was performed in a Mediterranean Sea 18, 5 μm 20 × 0.21 cm, 1.8 μm, (Teknokroma®, Barcelona, Spain) column at 45 °C. The eluents, an aqueous solution of 0.1% formic acid with 0.15% of nonafluoropentanoic acid (eluent A) and an acetonitrile solution of 0.1% formic acid with 0.15% of nonafluoropentanoic acid (eluent B), were applied in a gradient mode during 45 min at a flow rate of 0.3 mL/min. The gradient elution started with 2% of eluent B and kept at such concentration for three minutes. Then the percent of eluent B increased to 25% in 22 min, remaining at this concentration during two minutes. The initial conditions, 2% of eluent B, were re-established in 18 min.
The amino acids’ extracts were diluted 1:1000 in eluent A before analysis and kept in the auto sampler at 10 °C, until injection. The sample injection volume was 20.0 μL. The ionization source temperature was set at 130 °C with a cone voltage of 20.0 V and capillary voltage of 2.70 kV. Nitrogen (N2) was used as drying and nebulizing gas and Argon (Ar) as the collision gas.
Overall, 16 amino acids (Ser; Asp; Gly; Glu; Thr; Ala; Pro; Val; Met; His; Tyr; Lys; Ile; Leu; Arg and Phe) were analyzed by multiple reaction monitoring (MRM) mode, using an ESI source operating in ion positive mode, Figure S1.
Distinct MRM transitions allowed the quantification of the different amino acids. The most abundant product ion was selected for quantification and the second most abundant as the qualifier ion, Table S3.
Amino acids were identified by comparison with the amino acids’ standards retention time and corresponding m/z values. For quantification purposes, calibration curves were prepared with solutions of amino acids’ standards in eluent A at different concentrations (between 3.8 and 30 μM). The lowest concentration used for quantification was above the limit of quantification (LoQ) defined as a signal-to-noise ratio of ten [28]. MassLynx software, version 4.1, (Waters, Milford, MA, USA) was used to acquire and process data. The final amino acid content was expressed as g/16 g of nitrogen (N).

2.5.3. Trypsin Inhibitor Activity

The trypsin inhibitor activity of common bean accessions was determined according to the ISO 14902:2001(E) [29]. Briefly the activity of the trypsin inhibitors was measured against a bovine trypsin stock solution preserved at 10 °C during a maximum period of 5 days (27 mg in 100 mL of CaCl2·2H2O–735 mg: 1 L HCl 0.001 M, pH 3.0 ± 0.1) which was diluted (1:20) in CaCl2.2H2O. After preparing 100 mL of L-BAPA solution, in the assay day, with 60 mg of L-BAPA in 1 mL of DMSO and 99 mL of Tris buffer/CaCl2.2H2O (prepared by adding 6.05 g (Tris-buffer) and 735 mg CaCl2.2H2O to 900 mL Milli-Q® water, adjusted to pH 8.2 ± 0.1 with HCl 6M and diluted to 1 L with Milli-Q® water), the trypsin activity was evaluated after adding, Milli-Q® water, trypsin solution and acetic acid in a proportion of 1:0.6:0.2:0.2, and compared to a blank prepared in the same conditions, which only difference was the addition of acetic acid before the trypsin solution. Before adding the trypsin solution, the mixture was incubated at 37 ± 0.25 °C for 10 min in a water bath with a controlled temperature. After centrifugation at 1500× g, during 10 min, the absorbance of the mixtures was evaluated against Milli-Q® water, at 410 nm, in a Genesys 10UV Spectrophotometer (Thermo Scientific, Waltham, MA, USA). The enzymatic activity of the bovine trypsin was considered acceptable if,
T r y p s i n   a b s o r b a n c e B l a n k   a b s o r b a n c e = 0.380   ± 0.050
To extract the inhibitors of trypsin, 0.5 g of common bean flour was added to 25 mL of NaOH 0.01M and the pH adjusted to 9.5 ± 0.1 with HCl 1M or HCl 0.1M. The mixture was kept at 0–4 °C for 15–24 h in Milli-Q® water. On the analysis day the refrigerated water was added to the mixture to complete a final volume of 50 mL. After 15 min, a dilution range between 4 and 10 mg/g was tested, for each sample, with Milli-Q® water at the room temperature, in order to estimate a value of inhibitor trypsin activity between 40% and 60%. For each sample it was prepared a sample tube and a blank according to the following scheme: 1 mL of L-BAPA: 0.2 mL of diluted sample: 0.4 mL of Milli-Q® water: 0.2 mL of trypsin: 0.2 mL of acetic acid. In the blank the acetic acid was added before the trypsin solution, as mentioned previously. Once again the sample and the blank sample were kept at 37 °C, during 10 min, before adding the trypsin solution, remaining at such temperature during an additional period of 10 min. After centrifugation at 1500× g, during 10 min, the absorbance was measured at 410 nm and the inhibition percentage calculated according to the formula (Equation (2)):
i   ( % ) = ( Trypsin   absorbance Trypsin   blank   absorbance ) ( Sample   absorbance Sample   blank   absorbance ) Trypsin   absorbance Trypsin   blank   absorbance ×   100
Based on the inhibition percentage it was possible to determine the trypsin inhibitor activity (TIA), Equation (3):
T I A ( m g g ) = i 100 × t r y p s i n   m a s s   ( m g )   ×   ( 100 v o l u m e   o f   d i l u t e d   s a m p l e )   ×   0.00028 S a m p l e s   m a s s   ( g )
where, volume of diluted sample was the tested volume of sample (mL) responsible by 40–60% inhibition. Analyses were performed in duplicate for each sample. Values below 0.5 mg/g were below the detection limit of the method [29].

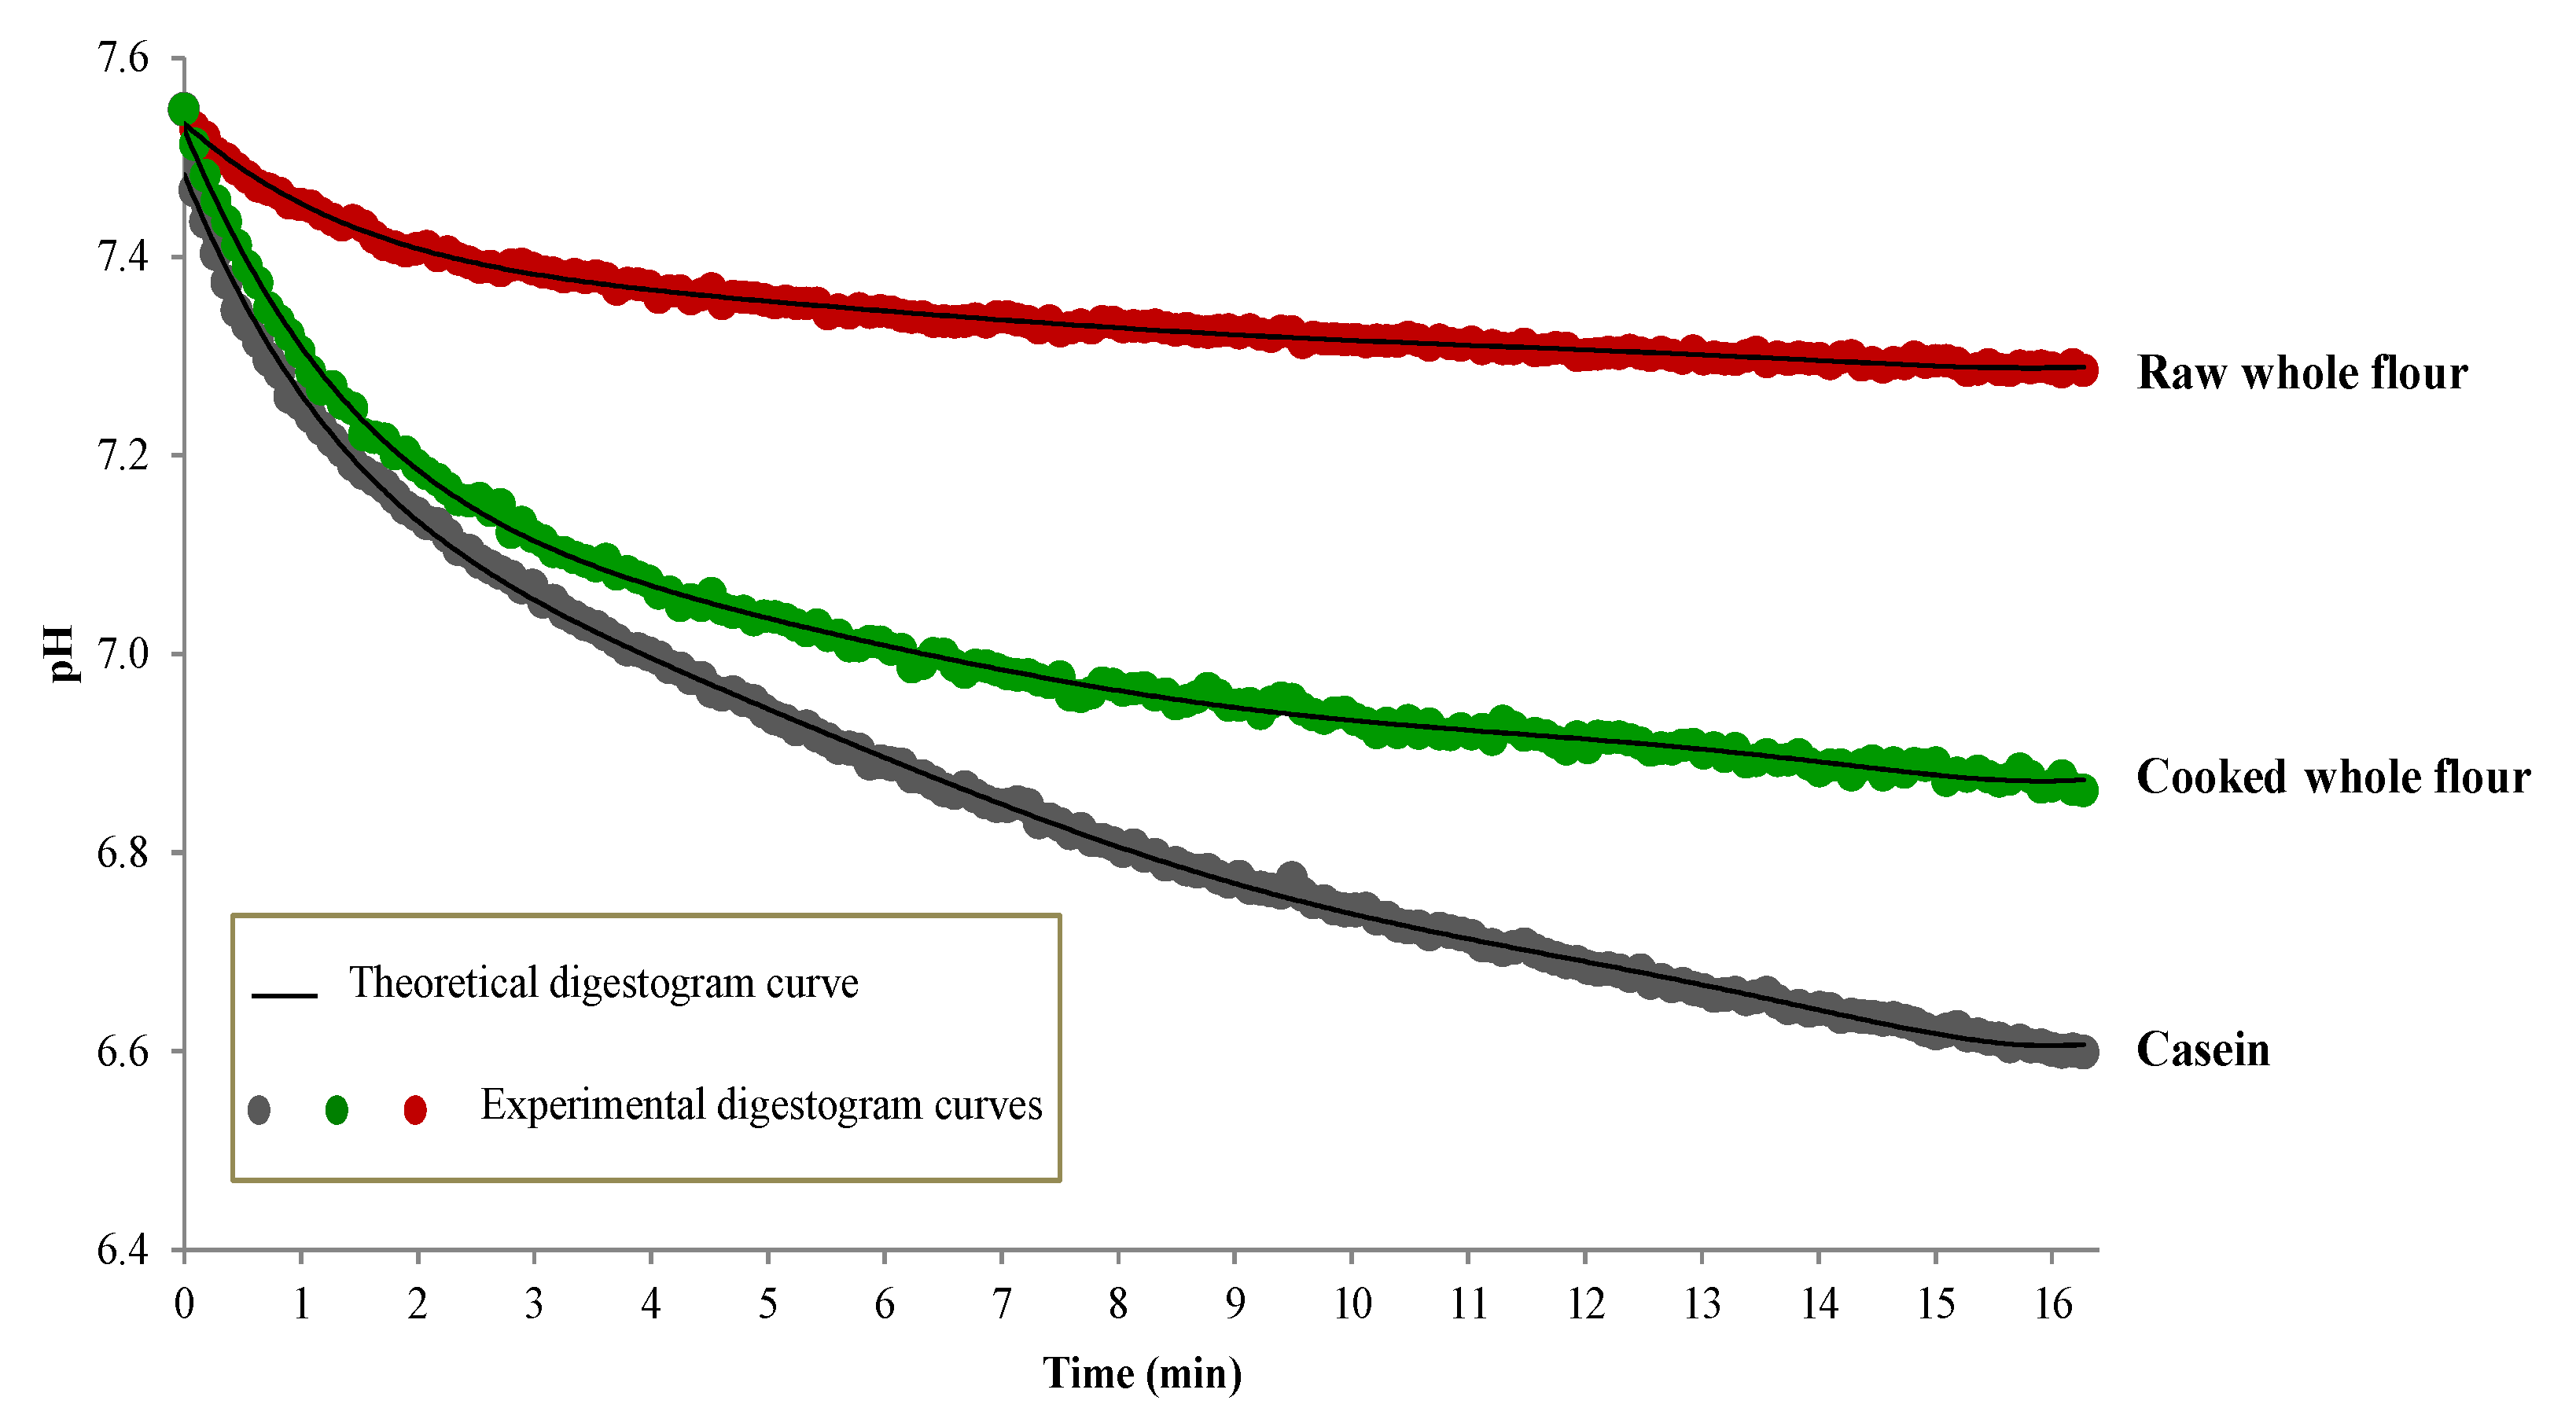
2.5.4. In Vitro Protein Digestibility

After hierarchical cluster analysis (Ward’s method) of TIA values, eight selected accessions characterized by belonging to two distinct clusters of TIA (four accessions from each TIA cluster) were evaluated in terms of in vitro protein digestibility (IVPD) according to the pH-drop procedure proposed by Tinus et al. [30] and by comparison with the in vitro digestibility of bovine casein.
Briefly, common bean raw whole flour, equivalent to 62.5 mg of protein, was weighted. Milli-Q® water (10 mL) was added to the flour and mixed with a magnetic stirrer bar. The mixture was incubated at 37 °C, during 1 h and the initial pH adjusted to 8.0 with 0.1 M NaOH and/or HCl. A multi-enzyme solution (10 mL) of porcine trypsin (16 mg), bovine chymotrypsin (31 mg) and Streptomyces griseus protease (13 mg) was prepared, on the analysis day, and kept at 37 °C. The pH of the multi enzyme solution was also adjusted to 8.0. The pH drop was automatically recorded as a digestogram, every five seconds during 15 min, after adding 1 mL of the multi-enzyme solution to the 10 mL sample dispersion, in a pH meter Metrohm 703 Ti Stand with stirrer and pump (Metrohm, Herisau, Switzerland). For the cooking process, after mixing the common bean whole flour with milli-Q® water, and before pH adjustment, samples were cooked in boiling water (100 °C) [31], during 2 h [32] in an oil bath with controlled temperature. After 2 h, the samples were left at room temperature in order to proceed with the pH adjustment at 37 °C and multi-enzyme digestion, as described above for the raw whole flour. The analyses were performed in single trials for each sample, considering raw and corresponding cooked common bean accessions, with two field replicates for each sample. The in vitro protein digestibility (IVPD%) was calculated following the equation (Equation (4)):
I V P D   ( % ) = 65.66 + 18.10   ×   ( Δ pH   10   min )

2.5.5. Calculated Protein Quality

The calculated protein quality was evaluated in terms of amino acid score by comparison of the EAAs content with the scoring pattern recommended for children from 2 to 5 years old [33]. The limiting amino acid was defined as the amino acid with the lowest score [16]. The theoretical protein efficiency ratios (PER) values were determined according to the equations described by Pastor-Cavada et al. [34].
P E R   1 =   0.684 + 0.456   ×   L e u 0.047   ×   P r o  
P E R   2 =   0.468 + 0.454   ×   L e u 0.105   ×   T y r
P E R   3 =   1.816 + 0.435   ×   M e t + 0.78   ×   L e u + 0.211   ×   H y s 0.944   ×   T y r
The in vitro protein digestibility corrected amino acid score (IVPDCAAS) was determined according to Equation (8).
I V P D C A A S   s c o r e = L o w e s t   a m i n o   a c i d   s c o r e   ×   I V P D  

2.6. Statistical Analyses

Assumptions of normality (Kolmogorov–Smirnov test and normal Q-Q plots) and variance homogeneity (Levene’s test) were tested at a significance level of 1%. The accessions final yield was transformed by square root transformation to improve the normality of residuals. The yield frequency distribution on the two environments was compared and represented by histogram plots. The main effects of G, E and G × E interactions were tested by nested ANOVA for each nutritional parameter (protein, total carbohydrates, fat, fiber, ash and moisture), at a significance level of 5%. Significant differences were defined by post-hoc Tukey HSD test. Eta2 (%), defined as a measure of the effect size (proportion of variance between explained and predictor variables, after controlling for other predictor variables) [35] was used to analyze the contribution of the different factors (G, E and G × E interaction) to nutritional parameters’ variability. The adjusted R2 associated with the ANOVA models was applied to evaluate the quality of the models used to explain the nutritional parameters’ variability. For each environment, the mean values of the different nutritional parameters were compared by one-way ANOVA considering the geographical origin, the gene pool and the morphological characteristics, namely, seed coat color and seed size of each accession, as fixed factors, at a significance level of 5%. A t-test for independent samples was performed to compare accessions’ mean yields using the environment as a grouping variable, at a significance level of 5%.
Multivariate principal component analysis (PCA) was performed with the accessions collected from both environments, considering the general nutritional parameters (protein, total carbohydrates, fat, fiber, ash and moisture) in order to establish differences in the nutritional composition between accessions and the effect of the two contrasting environments.
The accessions cropped under the heat stress environment (Córdoba) were selected for further analysis of protein quality. The PCA analysis with accessions collected from Córdoba, analyzed in terms of amino acid content, TIA and protein content, was carried out after expressing all the parameters as g/100 g, and gathering suggested genotypes’ spatial distributions, based on protein content and quality. The number of retained components was based on Kaiser’s criterion (eigenvalues higher than one), and was further used in articulation with cluster analysis. The number of clusters was defined after saving the range of solutions, K = 2 to K = 6, obtained by Ward’s hierarchical clustering analysis method, based on an explained variance (R2) higher than 50%. K-means algorithm was applied for cluster analysis’ optimization. Differences between clusters were established by ANOVA, at a significance level of 5%, and post-hoc analysis established by Scheffé’s test.

3. Results and Discussion

The nutritional and protein quality of a common bean variety influences its economic value [36], and so these criteria are gaining supporters among legume breeders for common bean selection [21], especially in developing countries where the priority should be the development of adapted nutritionally-rich legumes to supply populations’ dietary needs.
In Portugal, despite the high genetic and morphological diversity detected among traditional common bean accessions [22], indicating a promising breeding potential, the nutritional and protein quality of Portuguese accessions have been underexplored. This has hampered their effective use in breeding programs, either for wide or for specific adaptation, reducing their contribution for agriculture and food sustainability worldwide. This study aimed to overcome this gap of knowledge by characterizing the nutritional composition diversity in Portuguese common bean accessions, and the environmental effect on this diversity by cropping these accessions in two contrasting environments. The protein quality diversity of Portuguese common beans was also investigated under the most stressful environment, mimicking the expected increase in temperature due to climate change, and all the knowledge will be fundamental for efficient and effective use of this germplasm in common bean breeding programs.

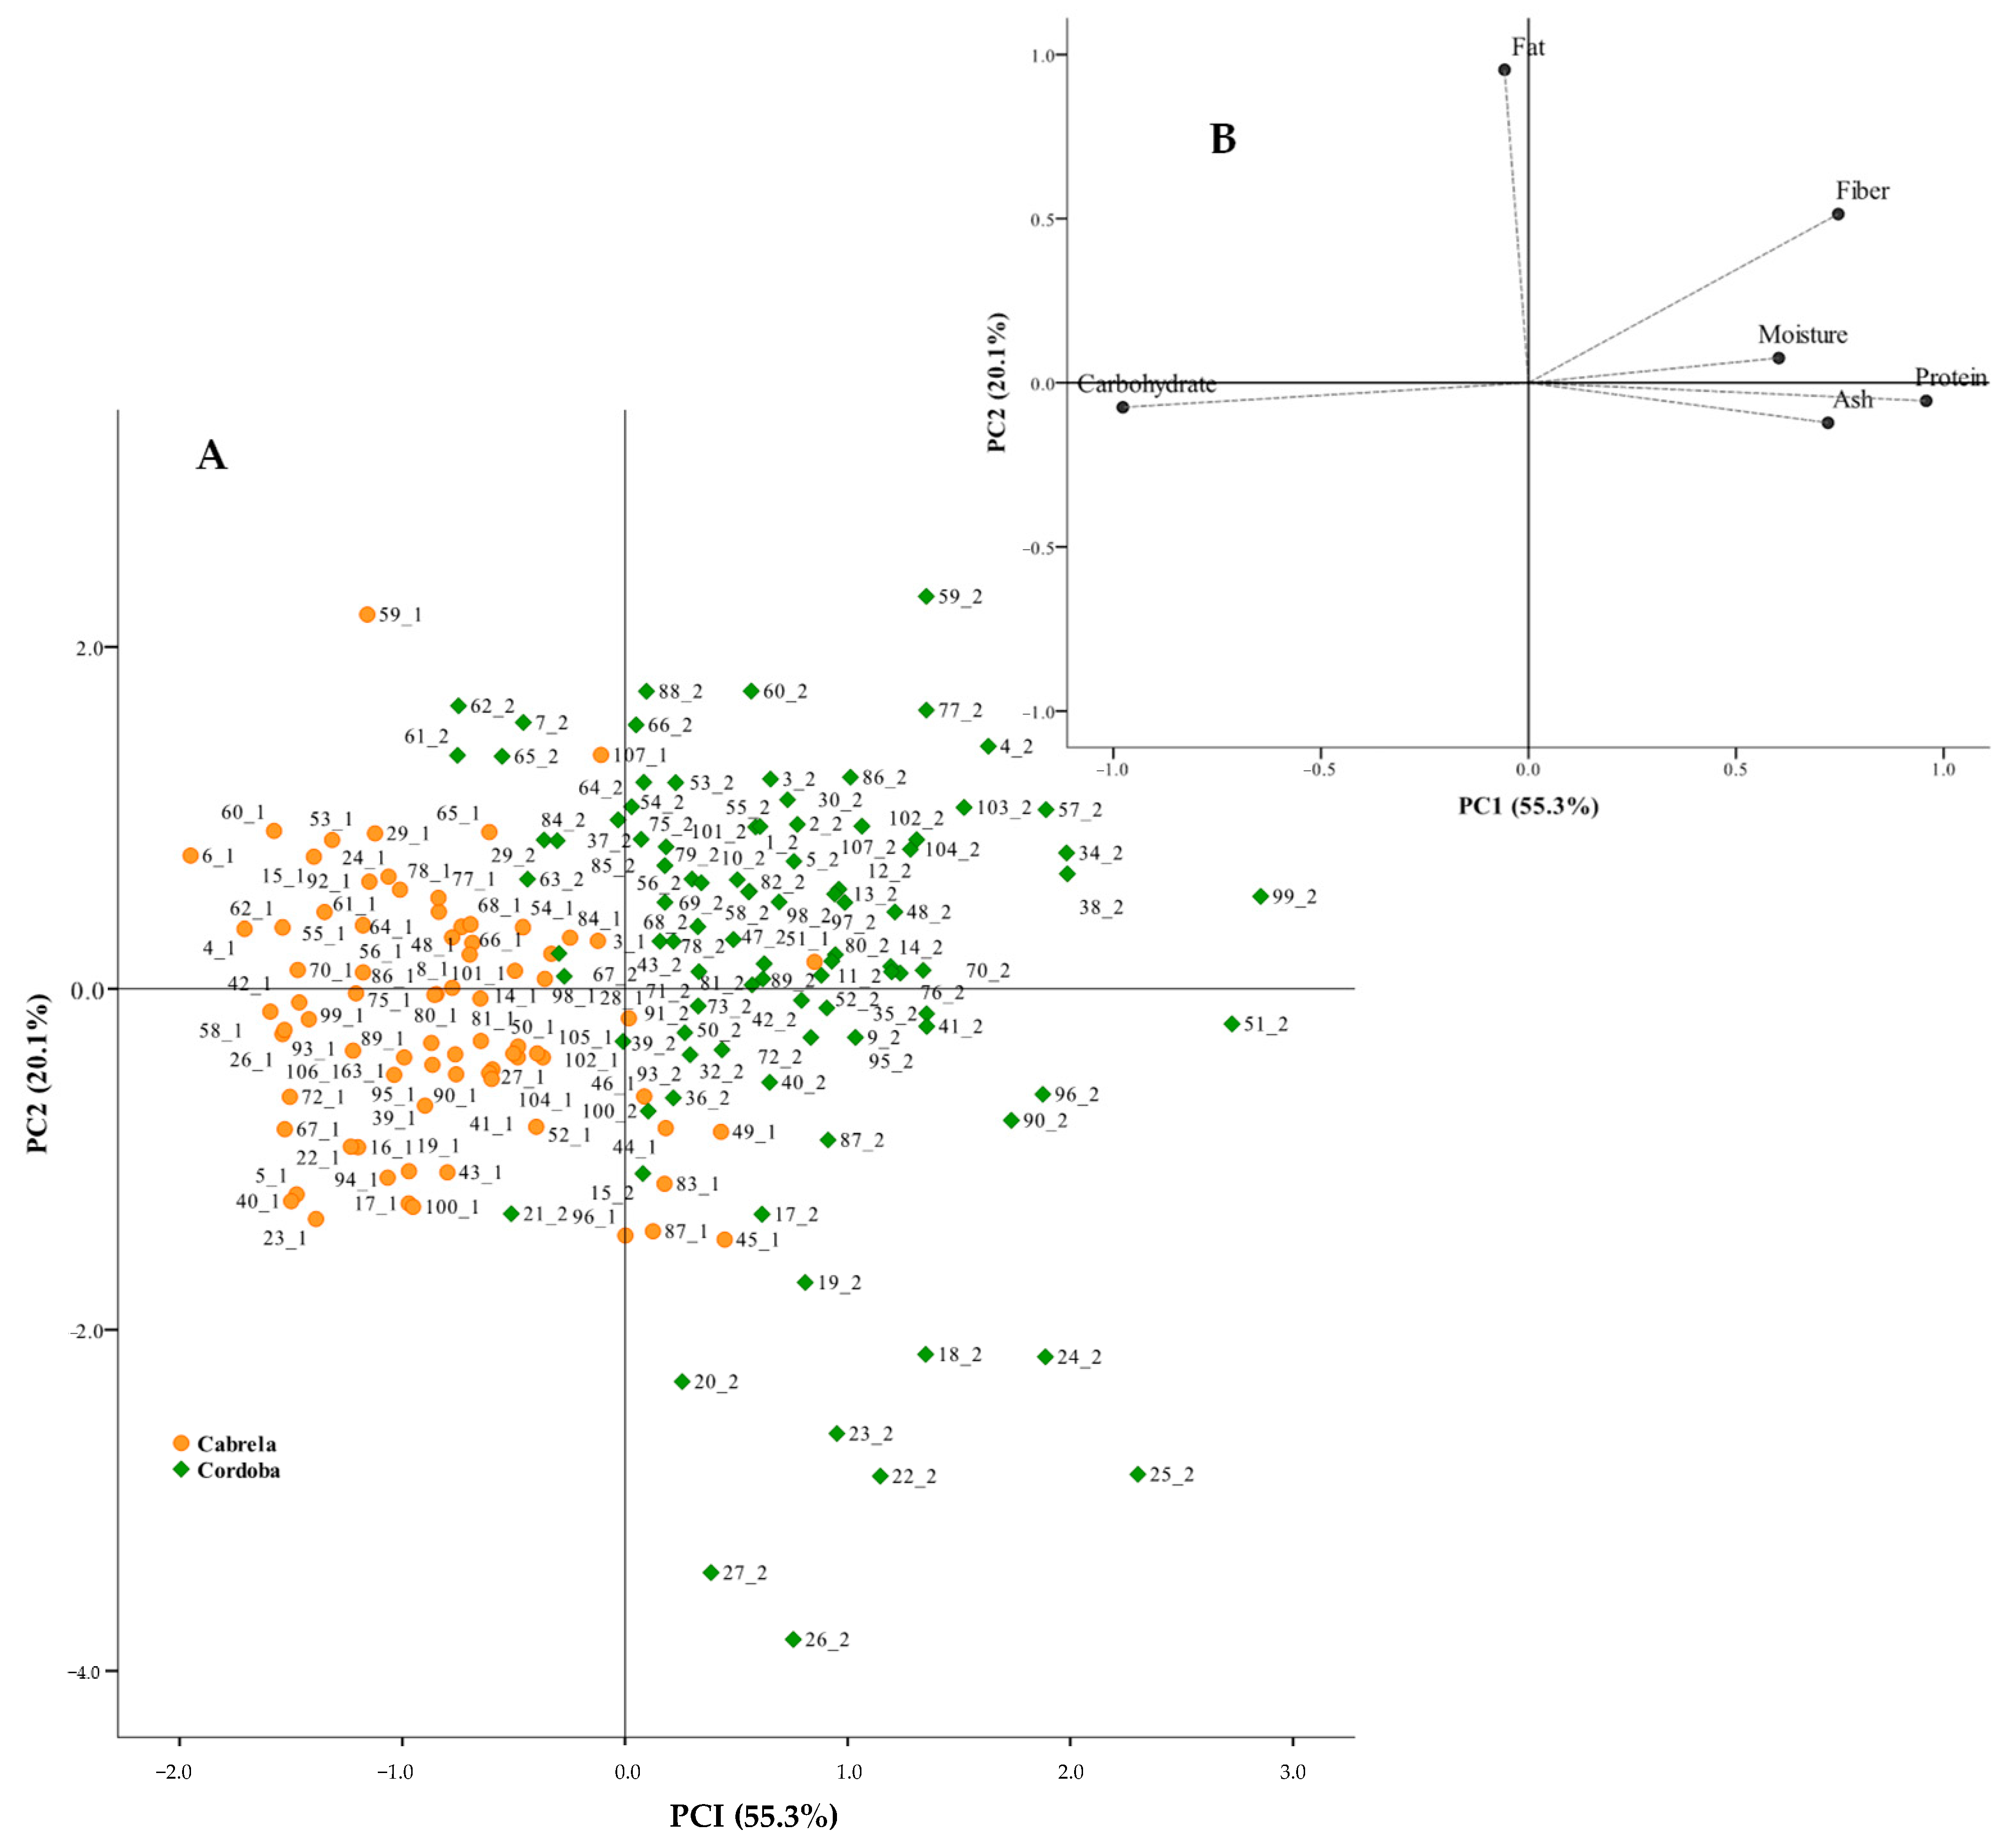
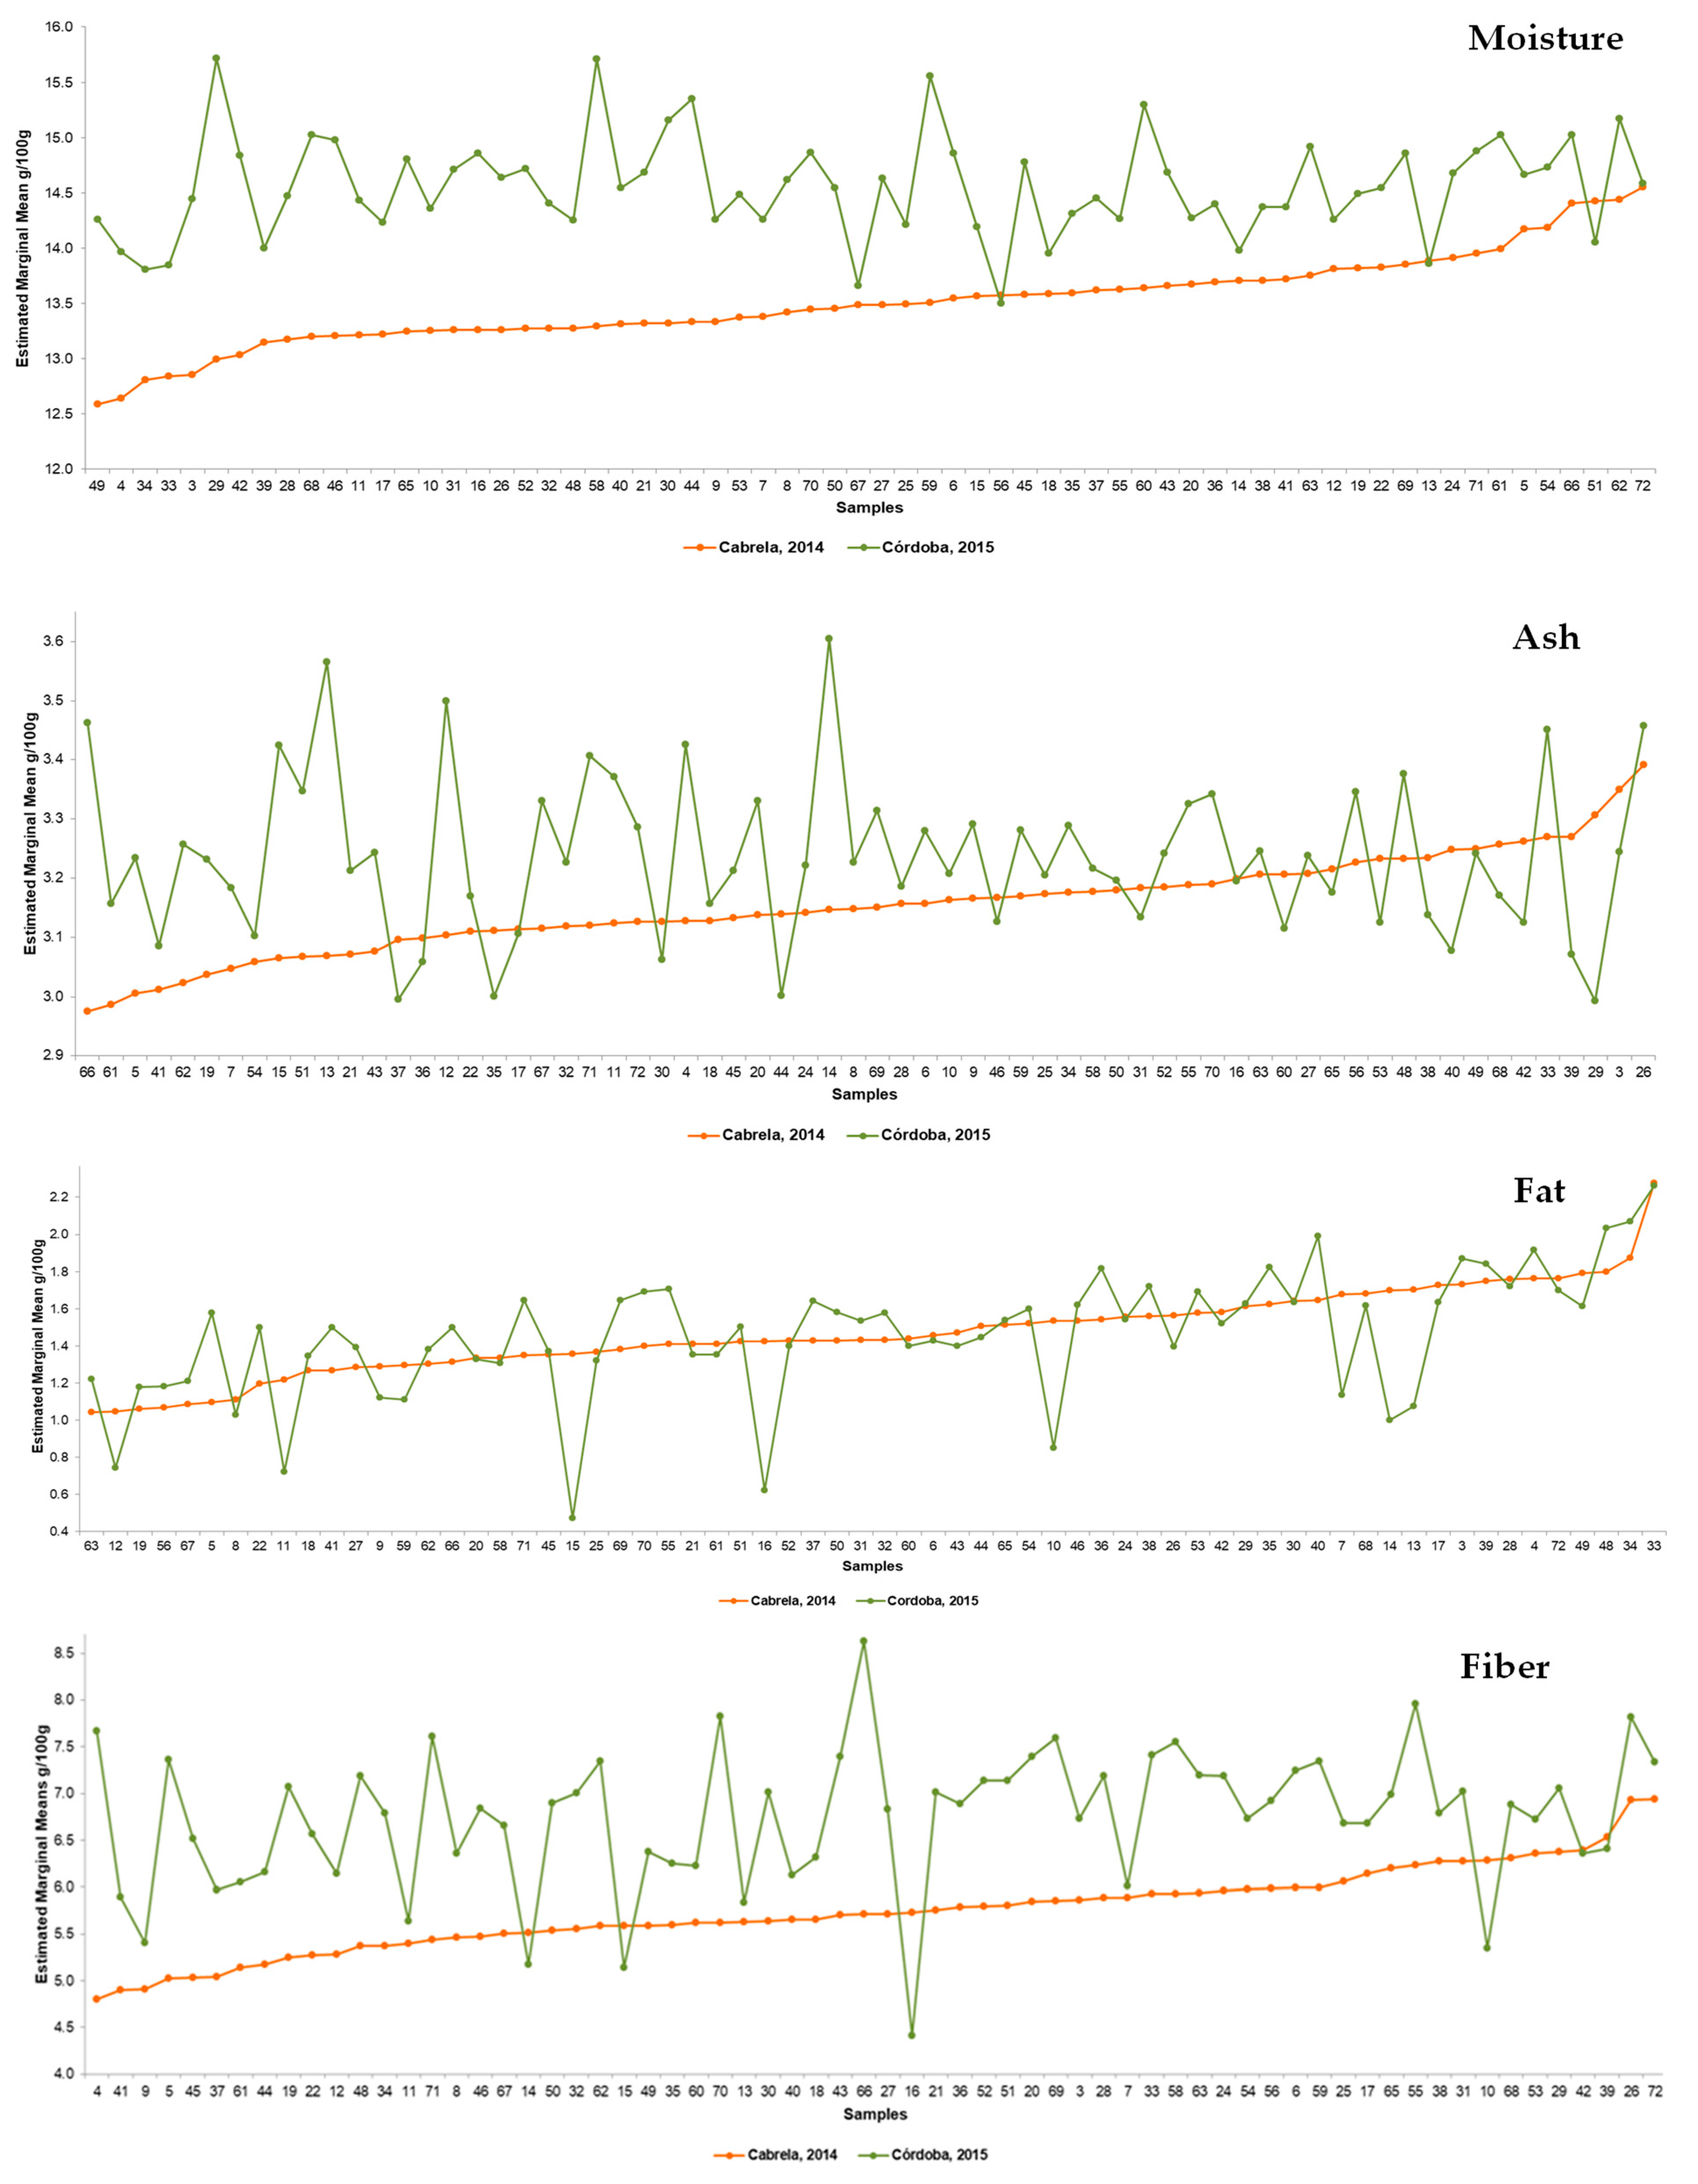
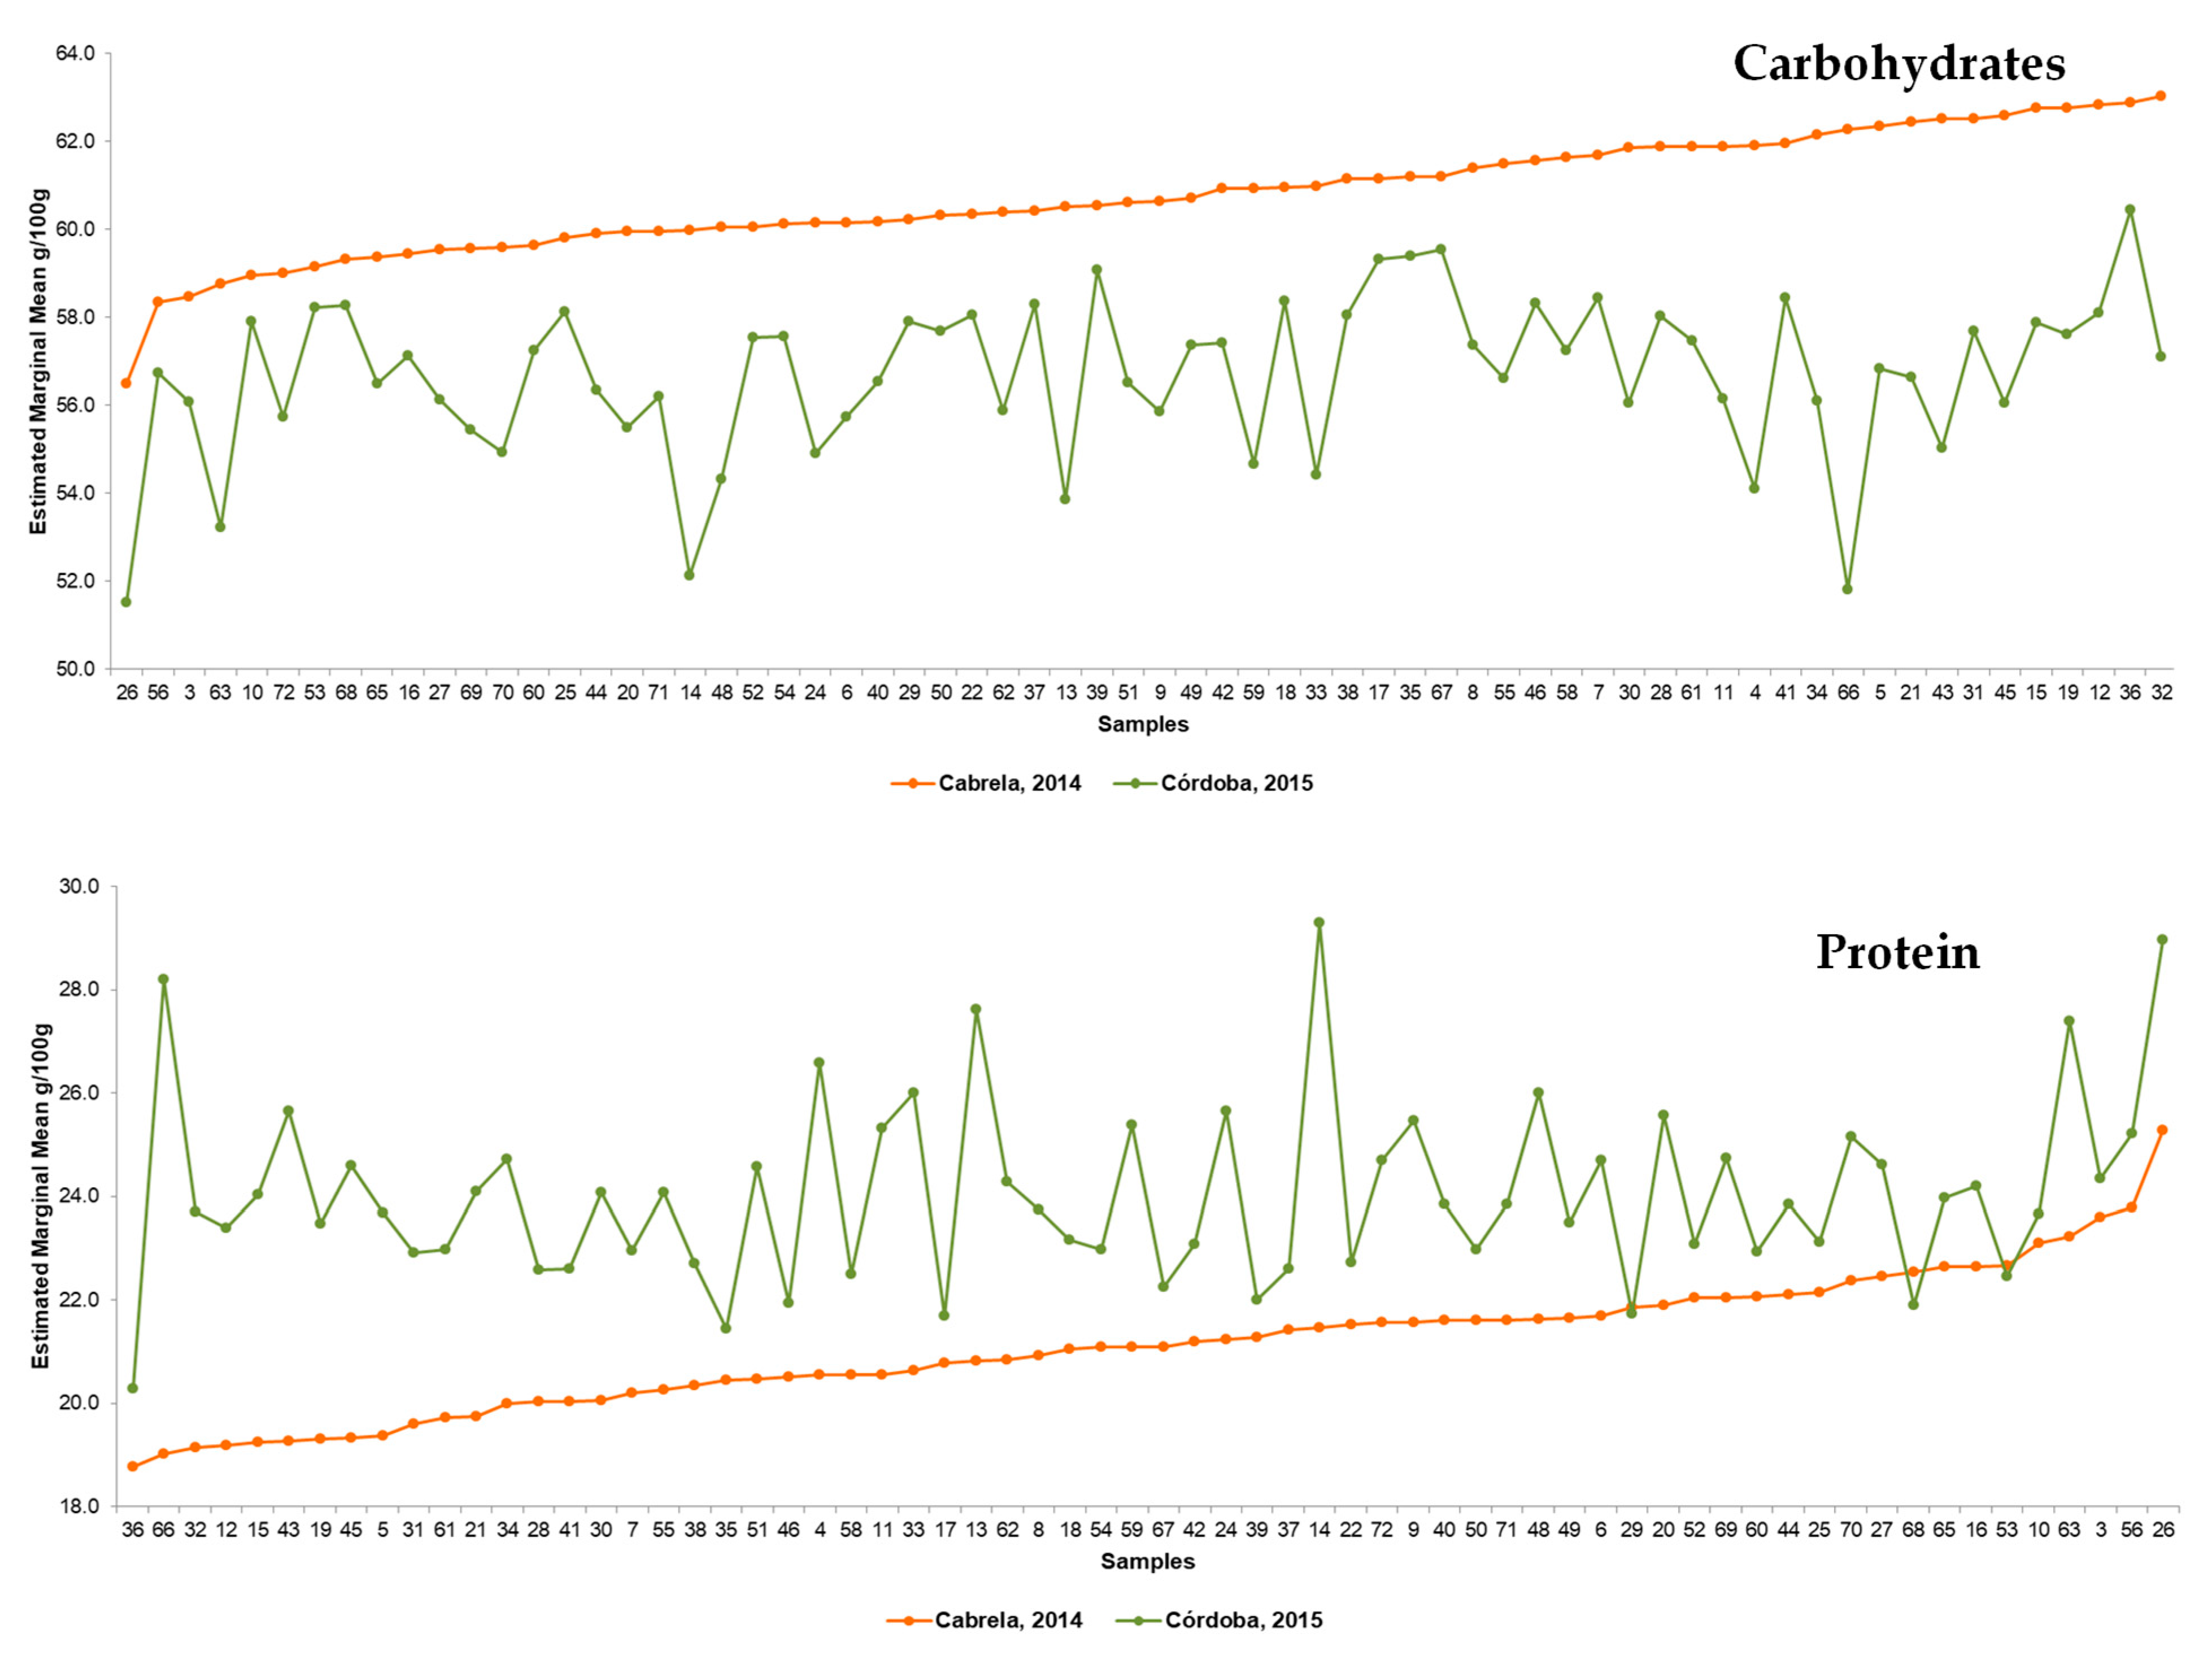
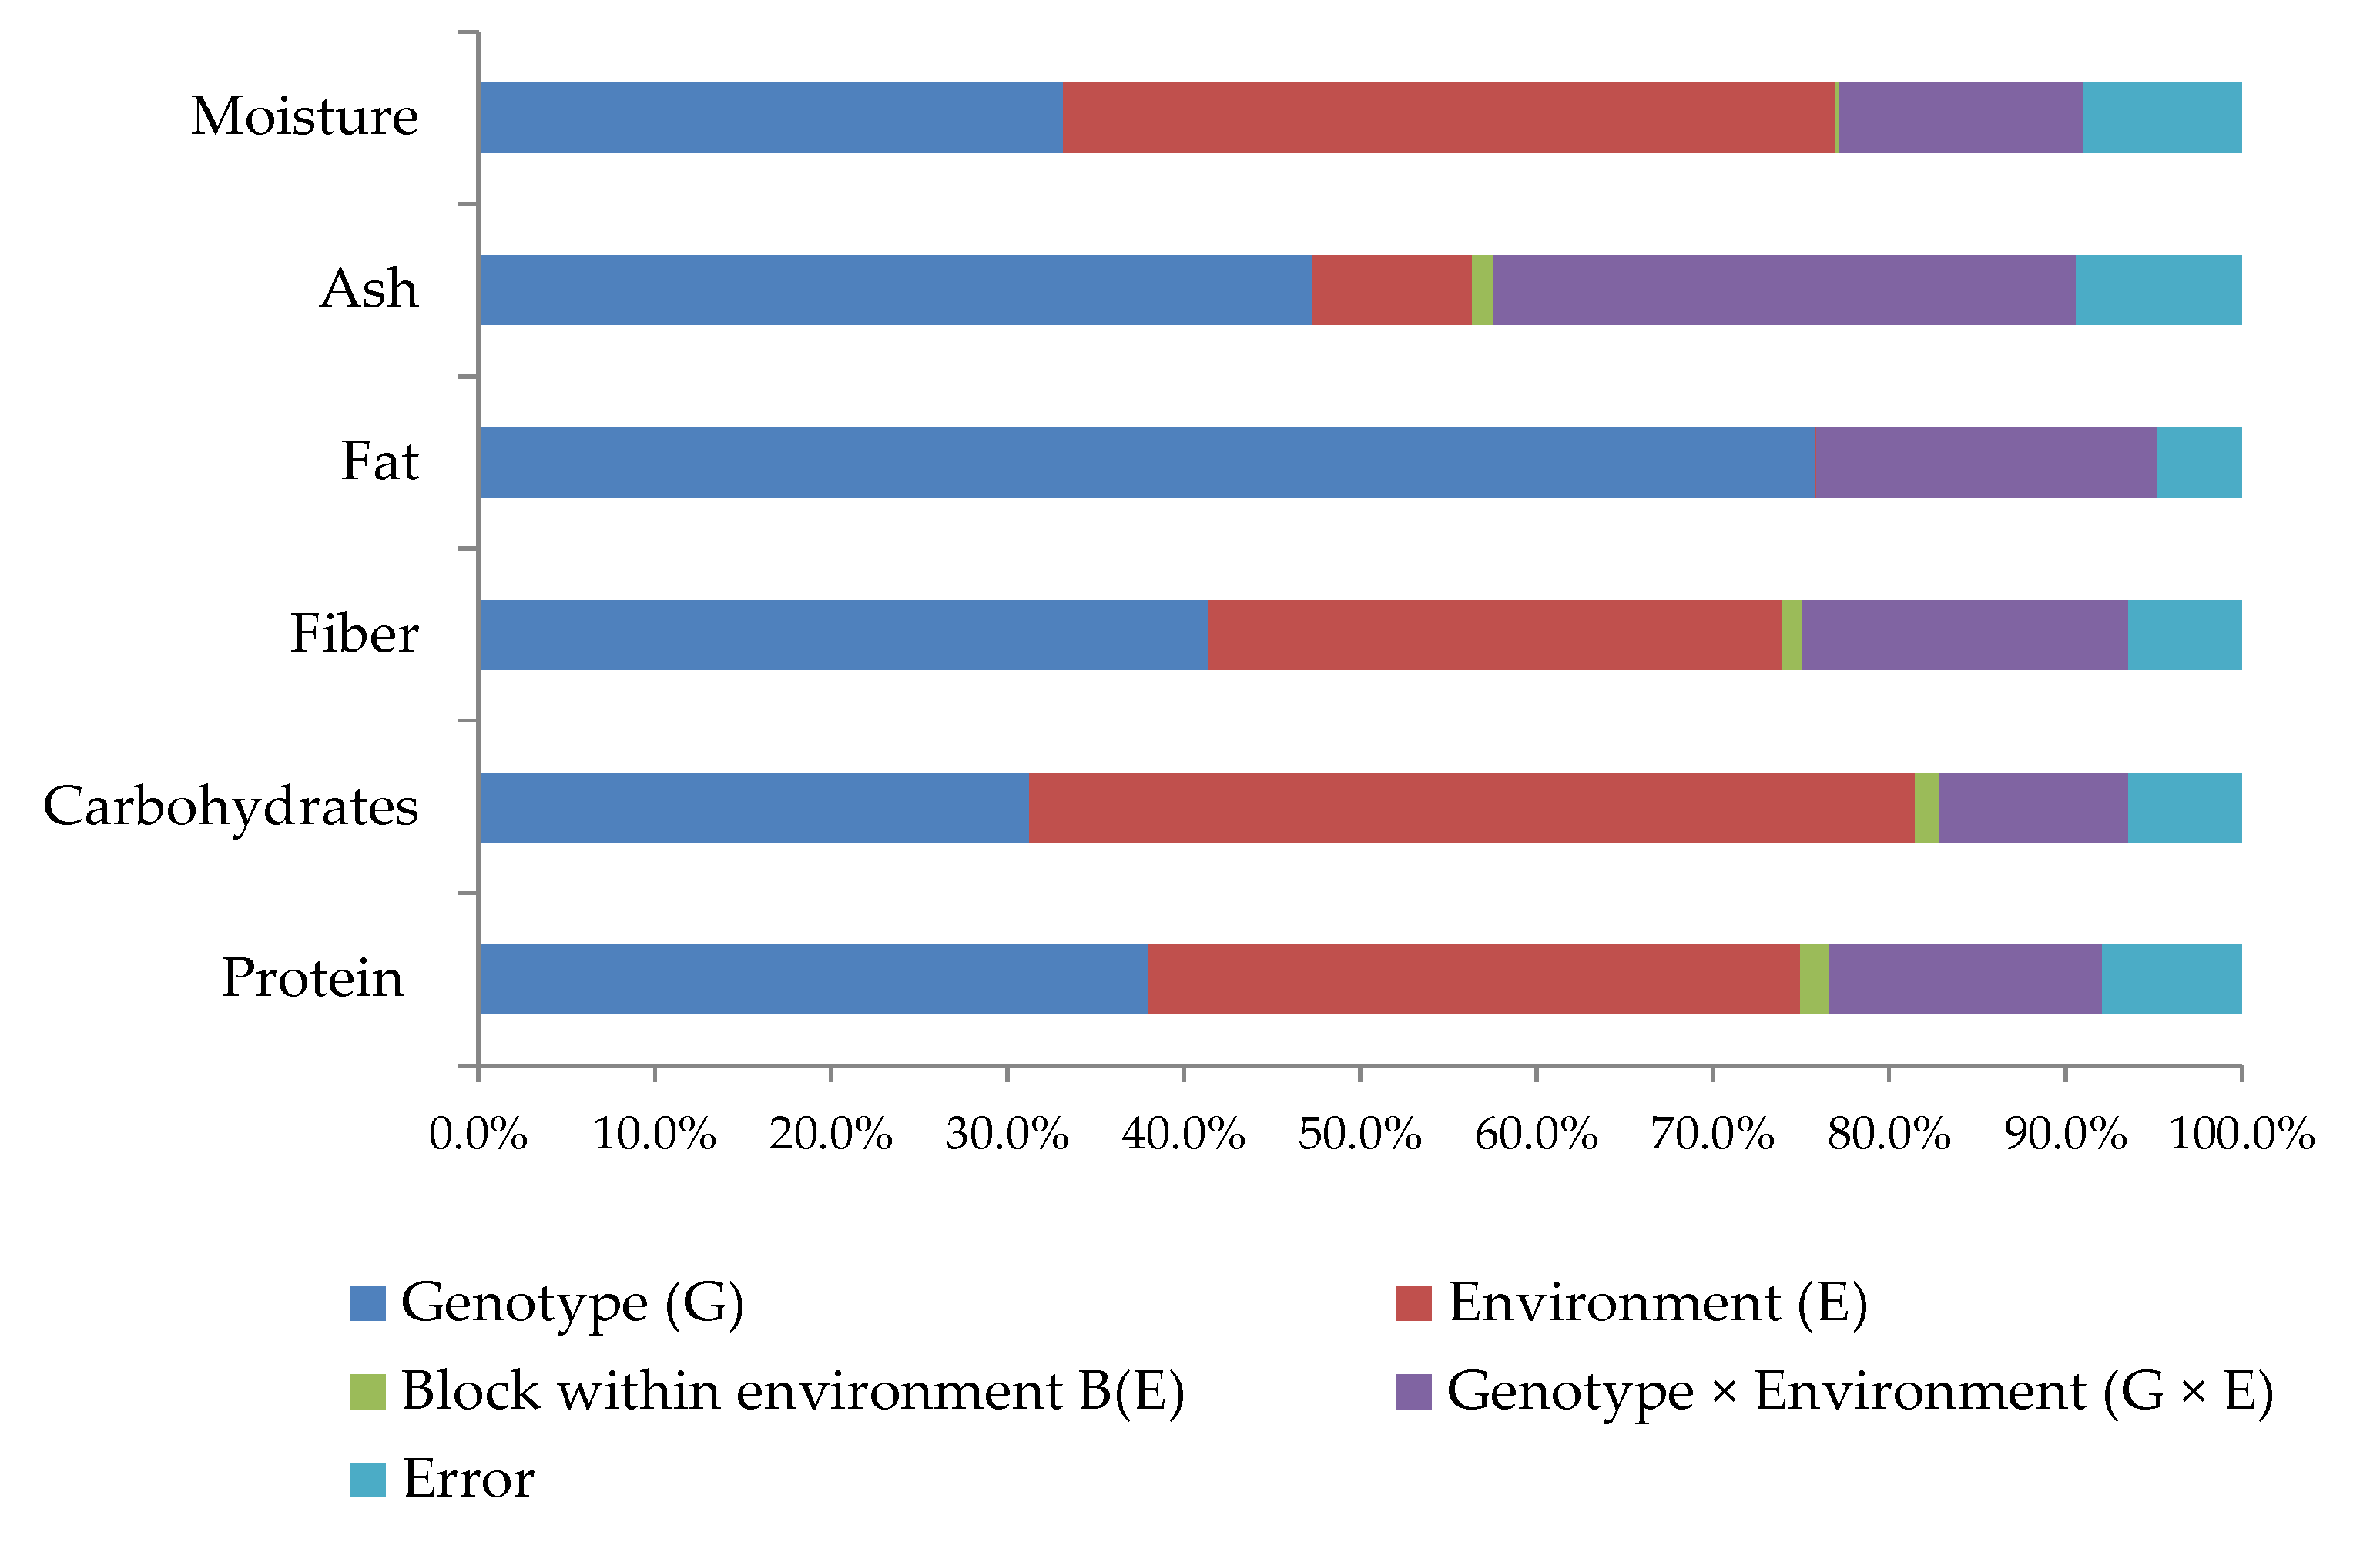
3.1. Diversity in the Nutritional Composition of Portuguese Common Beans

As shown in supplementary material, Table S4, by the number of homogeneous subsets of common bean accessions for each evaluated nutritional parameter, the Portuguese accessions were characterized by high variability in the macronutrients (protein, carbohydrates and fat), and in the fiber, ash and moisture contents. Multivariate PCA obtained with the nutritional data collected from Cabrela (milder traditional environment) and Córdoba (heat stress environment) field trials showed that 75.4% of the total variability was explained by the two first principal components; see Figure 1.
With the exception of moisture, whose variance was roughly explained by the first two principal components (communality lower than 0.4), all the remaining parameters contributed significantly to common beans’ dispersion along the two first principal components. Protein, ash and carbohydrate contents were the major nutritional parameters responsible for common bean accessions’ spatial distribution along the first principal component. By comparison with the traditional environment for growing common beans, the stressful environment of Córdoba, characterized by higher fluctuations in ambient temperature and relative humidity (Figure S2) imposed changes in common beans’ nutritional composition.
On average the common beans cropped under the heat stress environmental conditions of Córdoba were characterized by higher protein, ash, fiber and moisture contents, but also by lower carbohydrate content than the accessions collected from the milder, traditional environment of Cabrela, p < 0.05, Table 1.
Nevertheless, a significant G × E cross-over interaction led to an accession ranking change between the two environments for the evaluated nutritional traits; see Figure 2. Since no significant differences (p > 0.05) were detected for average yield productions between the two environments—although there was higher variability at Córdoba, as depicted in Figure S3—variations in seed nutritional contents between Cabrela and Córdoba could not be due to the commonly known concentration or dilution seed yield effects. Nevertheless, in both environments, moderate negative correlations between yield and protein content were detected (Pearson’s R coefficient of −0.402 in Cabrela and −0.407 in Córdoba, p < 0.05), which is in accordance with the inverse relationships found between seed yield and protein content in other legumes [37,38]. Artificial irrigation probably contributed to reduced average yield differences between both environments. Therefore, the higher contents of carbohydrates and protein, respectively, in Cabrela and Córdoba field trials, suggested that heat environmental differences could be the main factors responsible for the ratio of carbon/nitrogen in legumes seeds. A strong negative correlation between carbohydrate and protein contents was detected in both environments (Pearson’s R coefficient of −0.970 in Cabrela and −0.954 in Córdoba) in agreement with what was previously reported for Spanish varieties [39].
As shown in Figure 3, the environment was one of the most important sources of variation in carbohydrates (Eta2 = 50%). Supporting these findings, previous literature has reported the effect of rising temperature (30–35 °C) in the repression of photosynthetic enzymatic machinery and consequent carbohydrates production [39,40]. Additionally, under high ambient temperature and reduced air humidity, common bean seeds tend to accumulate soluble amino acids/proteins and/or assimilate/remobilize nitrogen from the vegetative parts of the plant in order to preserve the nutritional supply of nitrogen for the normal development of the embryo kept inside the seed [11,40]. Beyond the genotype and environmental impacts on moisture variability, the higher content determined in common bean seeds collected from Córdoba could be also attributed to the natural drying process of the mature seeds without additional artificial dryness. The fat content was not significantly different among common bean accessions cropped in the two contrasting environments. Nevertheless, this parameter allowed accessions’ dispersion along the second principal component, in response to the presence of genotypic variability among the Portuguese common bean accessions.
From all sources of variation (G, E and G × E interaction effects), G was the only one relevant for the variability of all the studied parameters, particularly of the fat content (Eta2 = 75.8%), Figure 3, Table S5.
Compared with the nutritional value of white common beans described by USDA [26], the Portuguese white accessions stood out by their higher fat content (1.79 ± 0.20 g/100 g in Cabrela and 1.74 ± 0.33 g/100 g in Córdoba, against 0.85 g/100 g in USDA database). On average, the Portuguese white accessions showed higher fat content than the colored ones (1.79 ± 0.20 g/100 g against 1.40 ± 0.20 g/100 g in Cabrela and 1.74 ± 0.34 g/100 g against 1.43 ± 0.29 g/100 g in Córdoba), the small seed accessions being characterized by higher fat content than the large-seeded ones (1.57 ± 0.15 g/100 g against 1.40 ± 0.20 g/100 g in Cabrela and 1.64 ± 0.20 g/100 g against 1.41 ± 0.32 g/100 g in Córdoba).
With exception of fat, in both environments, there were no significant differences for the remaining nutritional parameters (protein, carbohydrates, fiber, ash and moisture) among morphologically distinct accessions (different seed coat colors and seed sizes). The different gene pools or geographical origins did not differ significantly in the studied nutritional parameters’ contents measured in the two contrasting environments. The traditional seed exchange between Portuguese farmers over centuries might have contributed to a dilution of particular differences within each gene pool or each geographical origin. Indeed, the Portuguese common bean germplasm is characterized by a considerable percentage of accessions with a mixed origin between the main common bean gene pools [22].
The higher dispersion of common bean accessions collected from Córdoba field trial supported the existence of high variability among accessions obtained from the most stressful environment as a consequence of the environmental impacts on the common bean’s quality.
Grain legume breeders can take advantage of such variability and the existent G × E interaction to select accessions with interesting nutritional composition for heat stress environments. Indeed, future warming in the Mediterranean region, due to climate change, is expected to exceed worldwide rates by 20%, with summer warming surpassing the global rate’s mean by 40% [41]. Since temperature rises are causing changes in the quality ranking of common bean accessions, specifically for genotype adaptation, selection conducted in a stressful environment to achieve significant yield gains under such conditions represents the way forward for common bean quality breeding based on the systematic exploitation of G × E effects [42].

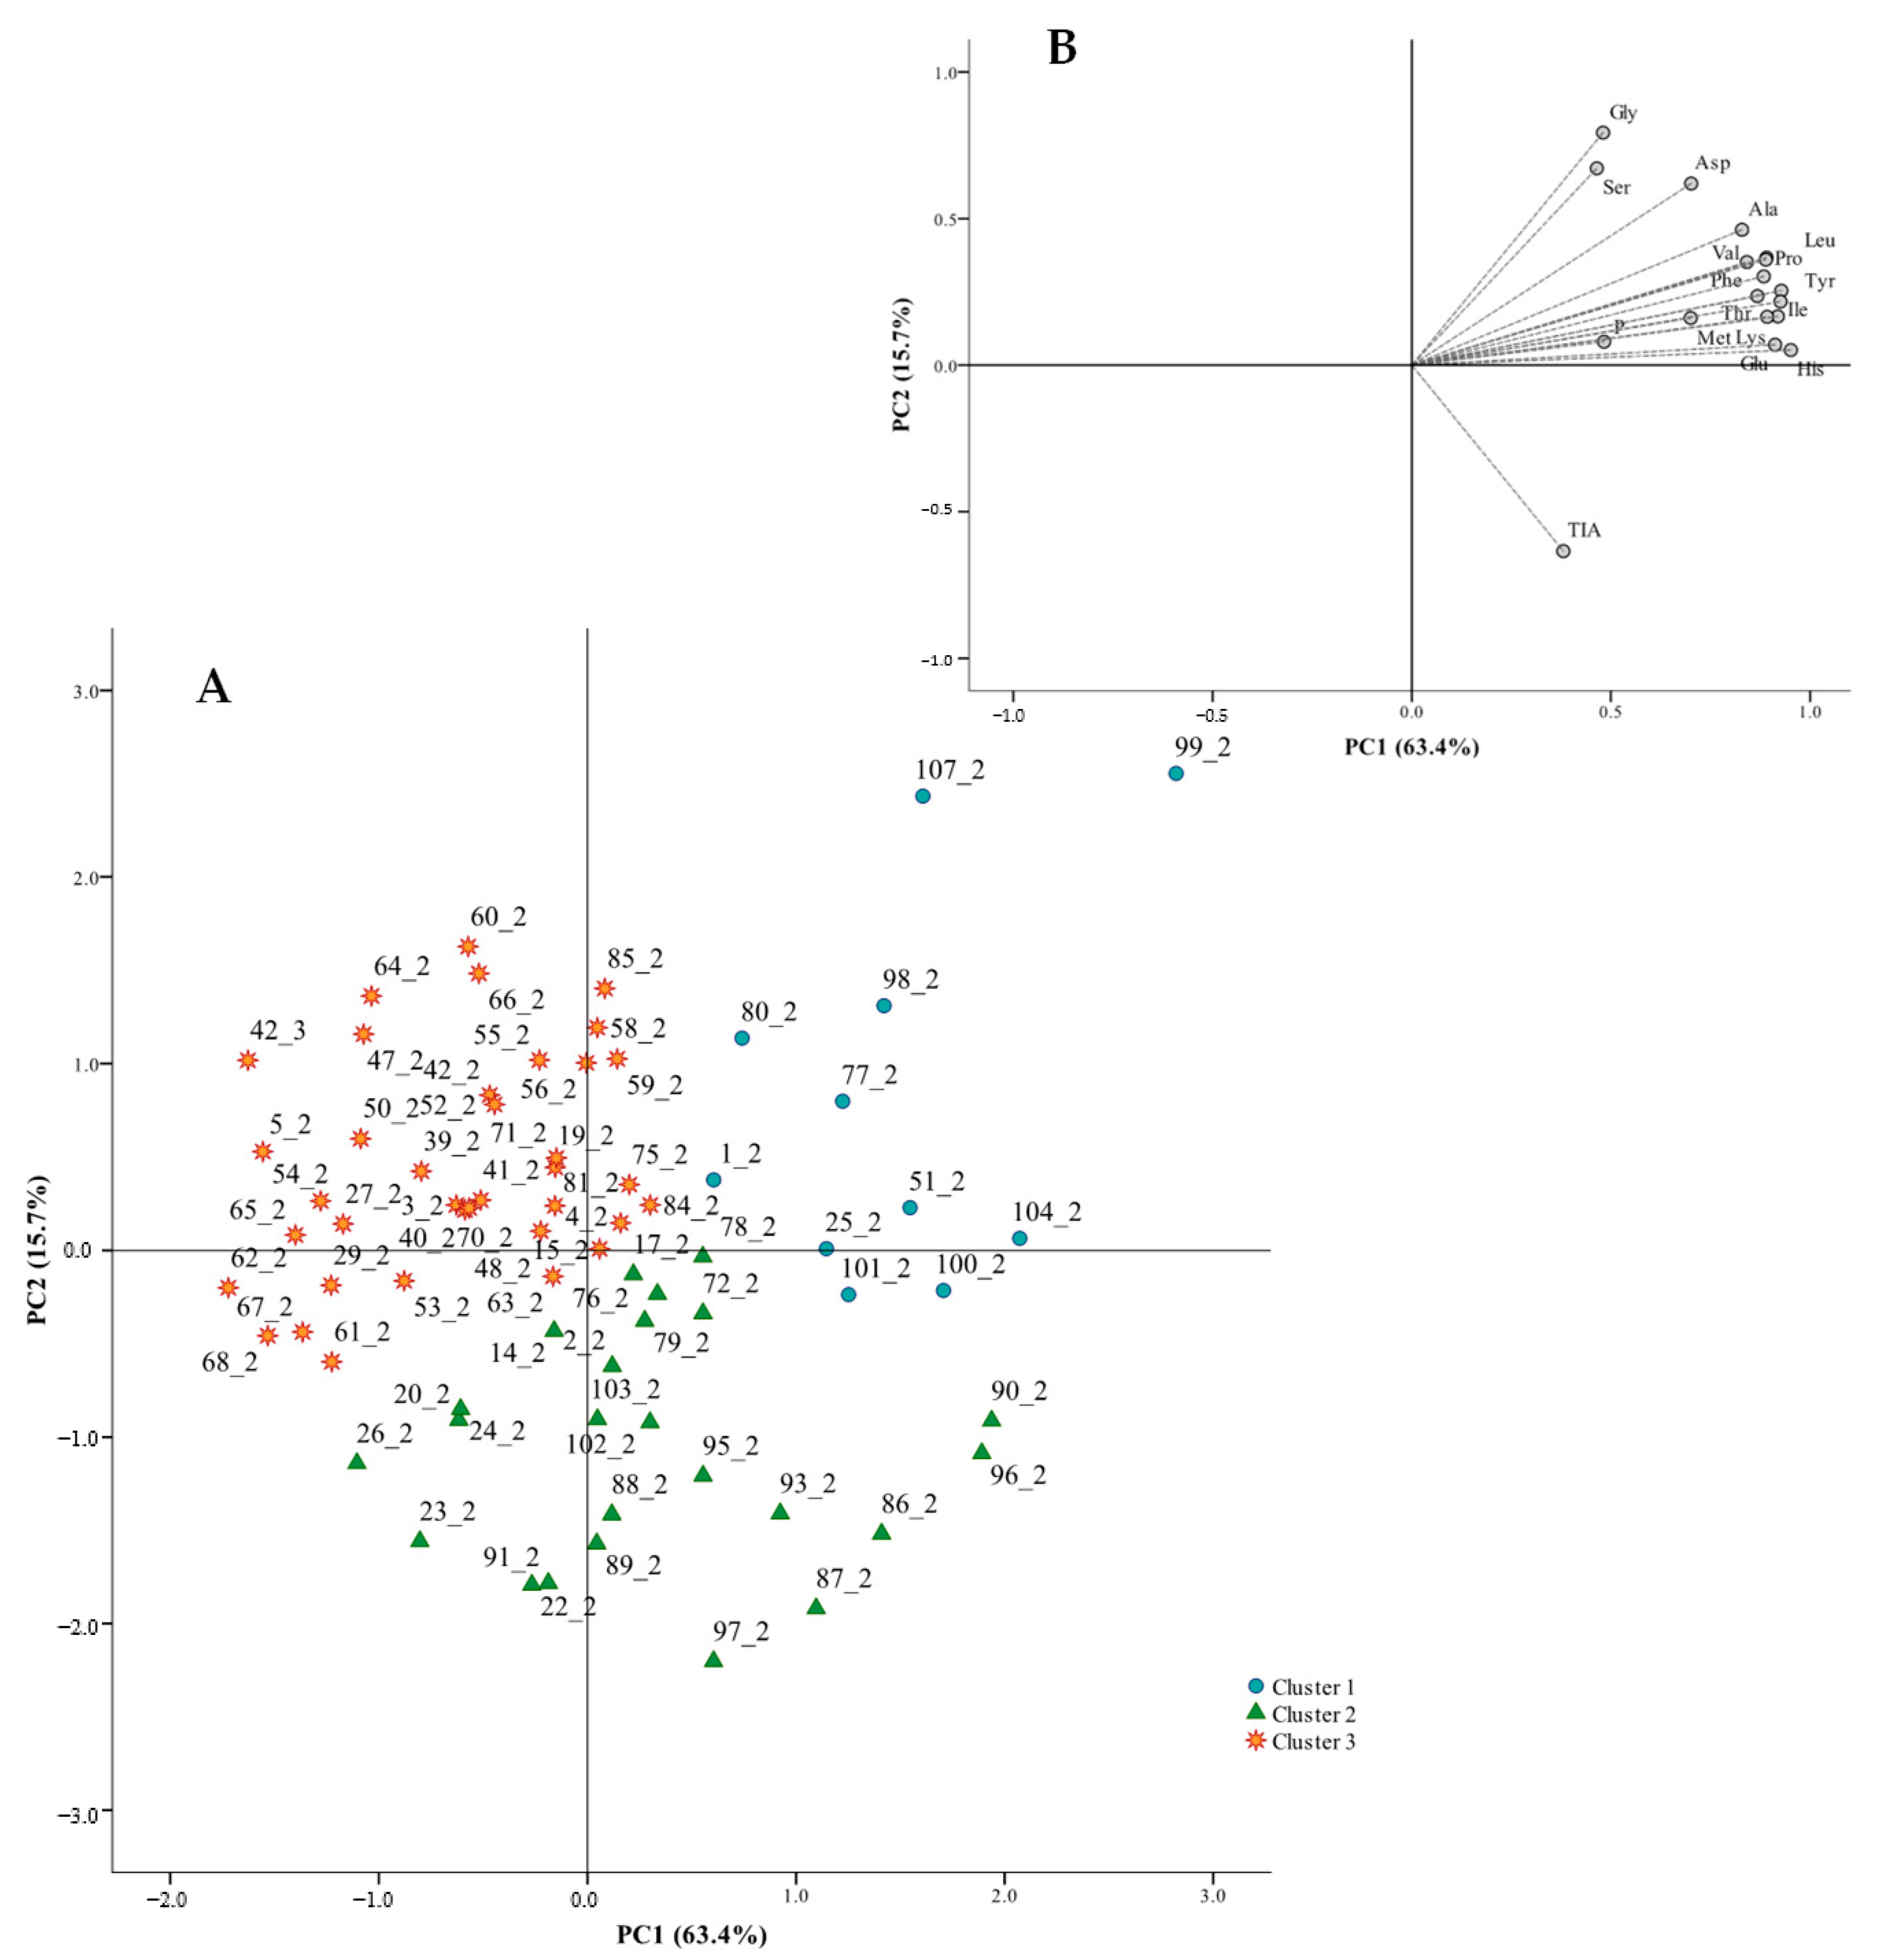
3.2. Diversity in the Protein Quality of Portuguese Common Beans

In order to mimic the expected warming in the Mediterranean region and the need to characterize the potential of the varieties under these more marginal environments to better exploit them in future specific adaptation breeding, the common bean accessions cropped under the heat stress environment (Córdoba) were chosen to be further analyzed in terms of protein quality. The protein quality was accessed considering the amino acid content, the TIA and the protein digestibility. Multivariate PCA, taking into account the amino acid contents, the trypsin inhibitor activity and the protein content, in common bean accessions collected from Córdoba, explained 79.1% of the total variance in a bi-dimensional space defined by the first two principal components; see Figure 4.
From all the parameters, protein content was the only one in this statistical model with low contribution for accessions’ variability (communality lower than 0.4). The spatial distribution along the first principal component was mostly related to amino acid contents, highlighting the presence of considerable diversity among the Portuguese accessions. The spatial distribution of common bean accessions suggested the existence of three clusters accumulating 53.9% of the total variability.
Cluster 1 included the accessions characterized by the highest content of the different evaluated amino acids, including the limiting amino acid, methionine, and the highest contents of protein and TIA. Cluster 2 grouped the samples with intermediate content of protein, sharing with cluster 1 higher TIA values and with cluster 3 lower contents for the majority of the amino acids. Cluster 3 was globally characterized by the lowest contents of protein, TIA and amino acids, with exception of Gly and Ser, which brought cluster 3 closer to cluster 1, Table 2.
This cluster analysis supports the relevance of studying the individual amino acid contents to characterize the protein quality and not only the overall protein content. As shown in Figure 4, the accessions with higher protein content and higher individual amino acid contents were also the ones with higher activity of trypsin inhibitors. Although anti-nutritional factors such as trypsin inhibitors may interfere in the breakdown of peptide bonds, influencing protein availability, trypsin inhibitors classified as proteins (serine proteases) can be inactivated during the cooking process. A breeding program focused in the improvement of common beans’ protein quality could take advantage of accessions grouped in cluster 1 since they have higher individual amino acid contents.
Considering the total quantified amino acids, the EAAs represented, on average, 40% of the total value, which was in accordance with the % of EAAs found in other legume species [34]. Leu, Lys and Phe were the most abundant ones. As described for other legumes [43,44,45,46], in the Portuguese common bean accessions, Met was the limiting amino acid of the measured ones, representing the less abundant EAAs among the different accessions, Table S6. By comparison with other authors [44,45,46], the content of Met in Portuguese accessions was similar to the reported values for other legumes spp. such as the ones from Lathyrus (0.58 ± 0.26 g/100 g protein), Pisum (0.53 ± 0.05 g/100 g protein) and Vicia (0.56 ± 0.23 g/100 g protein) genus [34]. Although Met has been considered a limiting factor for the beans protein quality, recent studies reviewed by Kitada et al. [47] regarding longevity and animal lifespan, indicate the advantage of restricting methionine on lifespan extension through several mechanisms that involve intracellular suppression of mTORC1 and removal of reactive oxygen species (ROS) [47], and in the prevention of cardiovascular diseases. In fact, a prospective cohort study, conducted by Virtanen et al. [48], during a follow-up period of 14 years, with 1981 Finnish men aged 42–60 years, concluded that low levels of Met (<1.7 g of Met/day) were associated with a reduced relative risk of developing acute coronary disease [48].
The values of protein efficiency ratio (PER3), calculated considering the amounts of Met, Leu, His and Tyr, were, on average, lower than the values determined for PER1 and PER2, Table S7. The same trend has been described by Pastor-Cavada et al. [34] for Pisum species and stemmed from the limited amount of Met in the different common bean accessions. In fact, the average PER3 value of 2.20 ± 0.50, below the standardized PER value for casein, 2.5, confirms, as expected, by comparison with casein, the lower quality of common bean protein [49].
Moreover, taking in account the recommendations of the different EAAs for pre-school children (2–5 years old) [33] Met was, in the present study, the only amino acid below the suggested pattern, representing on average 21.01 ± 3.82% of the recommended value, Table S8. This amino acid score was lower than the one determined by Khattab et al. [46] for Canadian and Egyptian beans, 39.07% and 57.04%, respectively. The difference could be attributed to the study of distinct common bean accessions but also to differences in the used hydrolysis process, which was conducted by Khattab et al. [46] for sulfur-containing amino acids only after oxidation with performic acid [46]. Such procedure is described as preserving Met in the form of methionine sulphone, reducing consequently Met losses during the acidic hydrolysis process. However, most of the amino acids are partly decomposed with the performic acid oxidation [50], and therefore in the present study to preserve the maximum amount of the different amino acids, the acidic hydrolysis was performed without previous performic acid oxidation. Regarding the NEAAs, the most abundant amino acids were Glu and Asp, and the less abundant ones were Pro and Tyr, Table S9. The use of nitrogen fertilization may have contributed to the common bean seeds’ nitrogen storage in the form of amino acids Glu and Asp [14]. Besides the amino acid content/proportion, the protein quality is influenced by protein digestibility, which depends on the anti-nutritional composition (e.g., protease inhibitors content) [51]. Legumes have been described as food products rich in dietary trypsin inhibitors [52]. Such food components correspond to serine protease inhibitors that adversely affect protein digestibility in mammals, birds and insects. These compounds present in raw seeds promote pancreas enlargement increasing the secretion of enzymes trypsin and chymotrypsin.
Once used for enzymatic synthesis, the sulfur-containing amino acids are no longer available for protein body synthesis, which slows down animal body growth [53]. Even so recent evidence suggests the beneficial chemo preventive, anti-metastatic and anti-inflammatory properties of the protease inhibitors for human health and also for crop protection against insects [54].
Despite the detected variability in the TIA content among the Portuguese common bean collection (coefficient of variation of 29.6%), Table S10, with two contrasting TIA clusters (71.8% of the total variance), Figure S4, no significant TIA differences were found among different gene pools, coat colors, seed sizes, or different geographical origins, p > 0.05. Moreover, there was no significant difference between in vitro protein digestibility (IVPD) or in vitro protein digestibility corrected amino acid score (IVPDCAAS) on the selected accessions, characterized by different TIA contents, Table 3. The values reported, herein, for IVPD, Table 3, were higher than the ones described in improved Brazilian varieties (50 ± 4–67 ± 0%) [55]. Nevertheless, similarly to Rezende et al. [55] in the present study, there was no correlation between IVPD and TIA content determined in raw seeds (Pearson’s R correlation of 0.215). This suggested that other factors (e.g., phytic acid), beyond trypsin inhibitors, may be present in concentrations that compensate TIA inter-variability, allowing constant IVPD and IVPDCAAS values among the different accessions. Trypsin inhibitors can be inactivated by thermal treatments [52]. In fact, cooking during 2 h, under controlled temperature (100 °C) allowed the common beans’ digestogram to come closer to the casein’s digestogram, Figure 5, and to increase significantly the IVPD values of the selected accessions, Table 3.
Such results could be attributed to the decrease of anti-nutritional factors such as trypsin inhibitors, tannins and saponins, during the cooking process [46,53]. The IVPD values determined in cooked samples are in alignment with the reviewed values for the fecal protein digestibility, reported for pinto beans (72–79%) [53], and represent a clear indication for adopting IVPD as a reliable, less expensive and animal friendly methodology to access food products’ protein digestibility.

4. Conclusions

Legumes represent affordable and sustainable nutritional sources of protein, especially in low-income countries, where the need for resilient and productive varieties represents a challenge for local farmers. Despite the recognized genetic diversity of the Portuguese common bean accessions, the lack of studies regarding their nutritional and protein value contributed to the downgrading and non-inclusion of this material in breeding programs. In the study reported herein, the data obtained from 106 representative Portuguese common bean accessions cropped in two contrasting environments showed that, under a heat stress prone environment the accessions have higher protein and lower carbohydrate contents, maintaining a high diversity at the nutritional composition level, when compared with a more traditional production environment. The genotype × environment cross-over interaction effect, evident by accession ranking changes in the nutritional quality between environments can be exploited for future selection of accessions with specific environmental adaptations within warming climate conditions. Taking advantage of such variability, and considering the protein content, the amino acid composition and the activity of trypsin inhibitors, three clusters of common bean accessions were defined. Cluster 1 assembled the most promising accessions for a future breeding program driven by protein quality improvement, since it gathered the accessions with higher individual amino acid contents. The most abundant EAAs in the Portuguese common bean accessions were Leu, Lys and Phe. Met, as expected, was the less abundant one, which contributed to decreasing the protein efficiency ratio and the amino acid score by comparison with the recommended requirements for pre-school children (2–5 years old). Despite this limitation, recent studies showed the importance of restricting Met in the diet as a way of extending longevity and preventing cardiovascular events, especially in developing countries where there is high prevalence of old-aged people and food availability is not a matter of concern.
The characteristics of cluster 3, with common bean accessions with lower protein contents and TIA values but with Gly and Ser contents closer to cluster 1, reinforce the importance of studying not only the overall protein content but also the individual amino acid contents to characterize protein quality.
In this study, although previous reports attributed to trypsin inhibitors most of the cause of impairing common beans’ protein digestibility, there were no significant differences in the in vitro protein digestibility of accessions characterized by contrasting TIA contents. This suggested that different anti-nutritional factors (trypsin inhibitors, saponins, tannins, phytic acid, etc.) may occur in a balanced ratio contributing to stable IVPD values among the seeds of the different Portuguese common bean accessions. Regardless of trypsin inhibitors activity, after the cooking process, the common bean’s IVPD increased to values closer to those of casein, showing the importance of the cooking process to common beans’ protein digestibility.
Taken together, the information disclosed herein will be useful to enrich food composition databases and for the development of future breeding programs guided by the goal of protein content and quality improvement, through the selection of accessions with higher contents of individual amino acids.

Supplementary Materials

The following are available online at https://0-www-mdpi-com.brum.beds.ac.uk/2073-4395/11/2/221/s1. Figure S1: Multiple reaction monitoring chromatograms of the 16 amino acids present in a standard mixture, 30 μM (conditions of analysis according to experimental section). Figure S2: Average ambient temperatures and air humidity in Cabrela and in Córdoba, during the growing season [23]. Figure S3. Frequency distribution for the average yield (kg/ha) of cropped accessions in Cabrela and Córboba. Figure S4: Dendogram obtained by hierarchical clustering (Ward’s method) for common bean accessions, based on trypsin inhibitor activity (TIA) measurements. The underlined accessions were selected for protein digestibility assays. Table S1: Amino acid (AA) classifications and molecular structures [17]. Table S2: Morphology, gene pools (Mesoamerican; Andean; mixed) and geographical origins of Portuguese common bean seeds’ accessions [22]. Table S3: Retention time, precursor ion, MRM transitions and calibration curves of the amino acid standards used for the amino acid quantification in common bean accessions. Table S4: Protein (P), total carbohydrates (CH), fat, fiber, ash and moisture in g/100 g, evaluated in the Portuguese common bean accessions cropped in contrasting environments, 1−Cabrela and 2−Córdoba. For environment, different letters per parameter (row) indicate significant differences (p < 0.05) between values. Table S5: Nested ANOVA of genotype (G), environment (E), block within environment (B(E)) and genotype × environment (G × E) interaction effects in common bean variability. Table S6: Contents of essential amino acids, average ± SD (standard deviation, g/16gN (100g of protein), in the different Portuguese common bean accessions cropped in Córdoba (n = 72). Different letters per column indicate significant differences between accessions (p < 0.05). Table S7: Protein efficiency ratio (PER) calculated for the different Portuguese common bean accessions cropped in Córdoba (n = 72). Table S8: Amino acid scores of individual amino acids for the different common bean accessions cropped in Córdoba (n = 72) by comparison with the scoring pattern recommended for children from 2to 5 years old [33]. Table S9: Contents of non-essential amino acids, average ± SD (standard deviation), g/16gN (100g of protein), in the different Portuguese common bean accessions cropped in Córdoba (n = 72). Different letters per column indicate significant differences between accessions (p < 0.05). Table S10: Trypsin inhibitor activity (TIA), mg/g, measured in the different Portuguese common bean accessions cropped in Córdoba (n = 72). Different letters indicate significant differences between accessions (p < 0.05).

Author Contributions

Conceptualization, E.M., M.E.F., M.C.V.P. and M.R.B.; funding acquisition, E.M., M.E.F., M.C.V.P. and M.R.B.; project administration, M.E.F., M.C.V.P. and M.R.B.; investigation, E.M., M.E.F., M.C.V.P. and M.R.B.; methodology, E.M., S.N., B.C., A.B.d.S., S.T.L., J.C. and M.d.F.C.; resources, C.B., M.M.V., D.R., J.C., M.d.F.C., M.C.V.P. and M.R.B.; Software, E.M. and A.B.d.S.; formal analysis, E.M.; data curation, E.M., M.C.V.P. and M.R.B.; validation, E.M., M.C.V.P. and M.R.B.; visualization, E.M.; supervision, J.C., M.d.F.C., M.C.V.P. and M.R.B.; writing—original draft preparation, E.M.; writing—review and editing, E.M., D.R., M.C.V.P. and M.R.B. All authors have read and agreed to the published version of the manuscript.

Funding

This research was funded by FCT, Portugal, through BEGEQA project (PTDC/AGR-TEC/3555/2012), E.M. PhD fellowship (SFRH/BD/89287/2012 and R&D unit, UIDB/04551/2020 (GREEN-IT–Bioresources for sustainability), PORTUGAL 2020, grant number LISBOA-01-0145-FEDER-402-022125 and PDR2020 Operação 7.8.4, Recursos genéticos (PDR2020-784-042734).

Acknowledgments

Thanks to the Research Unit of Biotechnology and Genetic Resources germplasm bank, INIAV, Oeiras, Portugal, for providing the common bean samples. The authors also acknowledge to the Portuguese Mass Spectrometry Network.

Conflicts of Interest

The authors declare no conflict of interest.

References

  1. UNICEF; WHO; World Bank Group. Levels and Trends in Child Malnutrition 2020. Available online: https://www.unicef.org/media/69816/file/Joint-malnutrition-estimates-2020.pdf (accessed on 29 September 2020).
  2. Miller, B.D.D.; Welch, R.M. Food system strategies for preventing micronutrient malnutrition. Food Policy 2013, 42, 115–128. [Google Scholar] [CrossRef] [Green Version]
  3. Klag, M.J.; Christian, P. Chapter 1.2 Population growth and malnutrition. In Good Nutrition: Perspectives for the 21st Century, 1st ed.; Eggersdorfer, M., Kraemer, K., Cordaro, J.B., Fanzo, J., Gibney, M., Kennedy, E., Labrique, A., Steffen, J., Eds.; Karger: Basel, Switzerland, 2016; pp. 31–44. [Google Scholar]
  4. Alemu, E.A. Malnutrition and its implications on food security. In Zero Hunger, 1st ed.; Leal Filho, W., Azul, A.M., Brandli, L., Özuyar, P.G., Wall, T., Eds.; Springer International Publishing: Cham, Switzerland, 2019; pp. 1–10. [Google Scholar]
  5. Courty, P.-E.; Smith, P.; Koegel, S.; Redecker, D.; Wipf, D. Inorganic nitrogen uptake and transport in beneficial plant root-microbe interactions. CRC Crit. Rev. Plant. Sci. 2015, 34. [Google Scholar] [CrossRef]
  6. Peix, A.; Ramírez-Bahena, M.H.; Velázquez, E.; Bedmar, E.J. Bacterial associations with legumes. CRC Crit. Rev. Plant Sci. 2015, 34, 17–42. [Google Scholar] [CrossRef]
  7. FAO. FAOSTAT. 2017. Available online: http://www.fao.org/faostat/en/#compare (accessed on 20 May 2020).
  8. Rubiales, D.; Mikic, A. Introduction: Legumes in sustainable agriculture. CRC Crit. Rev. Plant. Sci. 2015, 34, 2–3. [Google Scholar] [CrossRef] [Green Version]
  9. Pelzer, E.; Bourlet, C.; Carlsson, G.; Lopez-Bellido, R.J.; Jensen, E.S.; Jeuffroy, M.-H. Design, assessment and feasibility of legume-based cropping systems in three European regions. Crop Pasture Sci. 2017, 68, 902–914. [Google Scholar] [CrossRef] [Green Version]
  10. Vadez, V.; Berger, J.D.; Warkentin, T.; Asseng, S.; Ratnakumar, P.; Rao, K.P.C.; Gaur, P.M.; Munier-Jolain, N.; Larmure, A.; Voisin, A.-S.; et al. Adaptation of grain legumes to climate change: A review. Agron. Sustain. Dev. 2012, 32, 31–44. [Google Scholar] [CrossRef]
  11. Sita, K.; Sehgal, A.; HanumanthaRao, B.; Nair, R.M.; Vara Prasad, P.V.; Kumar, S.; Gaur, P.M.; Farooq, M.; Siddique, K.H.M.; Varshney, R.K.; et al. Food legumes and rising temperatures: Effects, adaptive functional mechanisms specific to reproductive growth stage and strategies to improve heat tolerance. Front. Plant Sci. 2017, 1658, 1–30. [Google Scholar] [CrossRef] [Green Version]
  12. Cramer, W.; Guiot, J.; Fader, M.; Garrabou, J.; Gattuso, J.-P.; Iglesias, A.; Lange, M.A.; Lionello, P.; Llasat, M.C.; Paz, S.; et al. Climate change and interconnected risks to sustainable development in the Mediterranean. Nat. Clim. Chang. 2018, 8, 972–980. [Google Scholar] [CrossRef] [Green Version]
  13. Izaguirre-Mayoral, M.L.; Lazarovits, G.; Baral, B. Ureide metabolism in plant-associated bacteria: Purine plant-bacteria interactive scenarios under nitrogen deficiency. Plant. Soil 2018, 428, 1–34. [Google Scholar] [CrossRef] [Green Version]
  14. Díaz-Leal, J.L.; Gálvez-Valdivieso, G.; Fernández, J.; Pineda, M.; Alamillo, J.M. Developmental effects on ureide levels are mediated by tissue-specific regulation of allantoinase in Phaseolus vulgaris L. J. Exp. Bot. 2012, 63, 4095–4106. [Google Scholar] [CrossRef]
  15. Schumacher, H.; Paulsen, H.M.; Gau, A.E.; Link, W.; Jürgens, H.U.; Sass, O.; Dieterich, R. Seed protein amino acid composition of important local grain legumes Lupinus angustifolius L., Lupinus luteus L., Pisum sativum L. and Vicia faba L. Plant Breed. 2011, 130, 156–164. [Google Scholar] [CrossRef]
  16. FAO. Dietary Protein Quality Evaluation in Human Nutrition. Available online: http://www.fao.org/ag/humannutrition/35978-02317b979a686a57aa4593304ffc17f06.pdf (accessed on 13 May 2020).
  17. Vnučec, D.; Kutnar, A.; Goršek, A. Soy-based adhesives for wood-bonding–A review. J. Adhes. Sci. Technol. 2017, 31, 910–931. [Google Scholar] [CrossRef]
  18. Hou, Y.; Yin, Y.; Wu, G. Dietary essentiality of “nutritionally non-essential amino acids” for animals and humans. Exp. Biol. Med. 2015, 240, 997–1007. [Google Scholar] [CrossRef] [PubMed] [Green Version]
  19. Urbano, G.; López-Jurado, M.; Frejnagel, S.; Gómez-Villalva, E.; Porres, J.M.; Frías, J.; Vidal-Valverde, C.; Aranda, P. Nutritional assessment of raw and germinated pea (Pisum sativum L.) protein and carbohydrate by in vitro and in vivo techniques. Nutrition 2005, 21, 230–239. [Google Scholar] [CrossRef] [PubMed]
  20. Nosworthy, M.G.; House, J.D. Factors influencing the quality of dietary proteins: Implications for pulses. Cereal Chem. 2017, 94, 49–57. [Google Scholar] [CrossRef]
  21. Vaz Patto, M.C. Grain legume protein quality: A hot subject. Arbor 2016, 192, a314. [Google Scholar] [CrossRef] [Green Version]
  22. Leitão, S.T.; Dinis, M.; Veloso, M.M.; Šatović, Z.; Vaz Patto, M.C. Establishing the bases for introducing the unexplored Portuguese common bean germplasm into the breeding world. Front. Plant. Sci. 2017, 8, 1–18. [Google Scholar] [CrossRef] [Green Version]
  23. Time and Date AS. Available online: https://www.timeanddate.com/weather/ (accessed on 13 March 2020).
  24. FAO. Key to the FAO Soil Units (1974). Available online: http://www.fao.org/soils-portal/soil-survey/soil-classification/fao-legend/key-to-the-fao-soil-units/en/ (accessed on 3 August 2020).
  25. Serrano, C.; Carbas, B.; Castanho, A.; Soares, A.; Vaz Patto, M.C.; Brites, C. Characterisation of nutritional quality traits of a chickpea (Cicer arietinum) germplasm collection exploited in chickpea breeding in Europe. Crop Pasture Sci. 2017, 68, 1031–1040. [Google Scholar] [CrossRef]
  26. USDA. Food Data Central. 2019. Available online: https://fdc.nal.usda.gov/ (accessed on 20 May 2020).
  27. Igor, J.; Krstović, S.; Glamocic, D.; Jakšić, S.; Abramović, B. Validation of an HPLC method for the determination of amino acids in feed. J. Serb. Chem. Soc. 2013, 78, 839–850. [Google Scholar]
  28. Shrivastava, A.; Gupta, V. Methods for the determination of limit of detection and limit of quantitation of the analytical methods. Chron. Young Sci. 2011, 2, 21–25. [Google Scholar] [CrossRef]
  29. ISO. ISO 14902:2001(en). Animal Feeding Stuffs—Determination of Trypsin Inhibitor Activity of Soya Products; ISO: Geneva, Switzerland, 2001. [Google Scholar]
  30. Tinus, T.; Damour, M.; van Riel, V.; Sopade, P.A. Particle size-starch–protein digestibility relationships in cowpea (Vigna unguiculata). J. Food Eng. 2012, 113, 254–264. [Google Scholar] [CrossRef]
  31. Drulyte, D.; Orlien, V. The Effect of processing on digestion of legume proteins. Foods 2019, 8, 224. [Google Scholar] [CrossRef] [PubMed] [Green Version]
  32. Institute of Agriculture and Natural Resources-University Nebraska-Lincoln Food. How to Cook Dry Beans from Scratch. Available online: https://food.unl.edu/article/how-cook-dry-beans-scratch (accessed on 4 November 2020).
  33. Young, V.R.; Pellett, P.L. Plant proteins in relation to human protein and amino acid nutrition. Am. J. Clin. Nutr. 1994, 59, 1203S–12l2S. [Google Scholar] [CrossRef] [PubMed]
  34. Pastor-Cavada, E.; Juan, R.; Pastor, J.E.; Alaiz, M.; Vioque, J. Protein and amino acid composition of select wild legume species of tribe Fabeae. Food Chem. 2014, 163, 97–102. [Google Scholar] [CrossRef] [PubMed] [Green Version]
  35. Lakens, D. Calculating and reporting effect sizes to facilitate cumulative science: A practical primer for t-tests and ANOVAs. Front. Psychol. 2013, 4. [Google Scholar] [CrossRef] [PubMed] [Green Version]
  36. Shimelis, E.A.; Rakshit, S.K. Proximate composition and physico-chemical properties of improved dry bean (Phaseolus vulgaris L.) varieties grown in Ethiopia. LWT 2005, 38, 331–338. [Google Scholar] [CrossRef]
  37. Wilcox, J.R.; Guodong, Z. Relationships between seed yield and seed protein in determinate and indeterminate soybean populations. Crop Sci. 1997, 37. [Google Scholar] [CrossRef]
  38. Solberg, S.Ø.; Yndgaard, F.; Poulsen, G.; von Bothmer, R. Seed yield and protein content in the Weibullsholm Pisum collection. Genet. Resour. Crop Evol. 2017, 64, 2035–2047. [Google Scholar] [CrossRef]
  39. Florez, A.; Pujolà, M.; Valero, J.; Centelles, E.; Almirall, A.; Casañas, F. Genetic and environmental effects on chemical composition related to sensory traits in common beans (Phaseolus vulgaris L.). Food Chem. 2009, 113, 950–956. [Google Scholar] [CrossRef]
  40. Sehgal, A.; Sita, K.; Siddique, K.H.M.; Kumar, R.; Bhogireddy, S.; Varshney, R.K.; HanumanthaRao, B.; Nair, R.M.; Prasad, P.V.V.; Nayyar, H. Drought or/and heat-stress effects on seed filling in food crops: Impacts on functional biochemistry, seed yields, and nutritional quality. Front. Plant Sci. 2018, 1705, 1–19. [Google Scholar] [CrossRef] [Green Version]
  41. Lionello, P.; Scarascia, L. The relation between climate change in the Mediterranean region and global warming. Reg. Environ. Chang. 2018, 18, 1481–1493. [Google Scholar] [CrossRef]
  42. Ceccarelli, S. Specific adaptation and breeding for marginal conditions. Euphytica 1994, 77, 205–219. [Google Scholar] [CrossRef]
  43. Gardner, C.D.; Hartle, J.C.; Garrett, R.D.; Offringa, L.C.; Wasserman, A.S. Maximizing the intersection of human health and the health of the environment with regard to the amount and type of protein produced and consumed in the United States. Nutr. Rev. 2019, 77, 197–215. [Google Scholar] [CrossRef] [PubMed]
  44. Aremu, M.O.; Olaofe, O.; Akintayo, T.E. A comparative study on the chemical and amino acid composition of some Nigerian under-utilized legume flours. Pak. J. Nutr. 2006, 5, 34–38. [Google Scholar]
  45. Baptista, A.; Pinho, O.; Pinto, E.; Casal, S.; Mota, C.; Ferreira, I. Characterization of protein and fat composition of seeds from common beans (Phaseolus vulgaris L.), cowpea (Vigna unguiculata L. Walp) and bambara groundnuts (Vigna subterranea L. Verdc) from Mozambique. Food Meas. 2017, 11, 442–450. [Google Scholar] [CrossRef]
  46. Khattab, R.Y.; Arntfield, S.D.; Nyachoti, C.M. Nutritional quality of legume seeds as affected by some physical treatments, Part 1: Protein quality evaluation. LWT 2009, 42, 1107–1112. [Google Scholar] [CrossRef]
  47. Kitada, M.; Ogura, Y.; Monno, I.; Koya, D. The impact of dietary protein intake on longevity and metabolic health. EBioMedicine 2019, 43, 632–640. [Google Scholar] [CrossRef] [Green Version]
  48. Virtanen, J.K.; Voutilainen, S.; Rissanen, T.H.; Happonen, P.; Mursu, J.; Laukkanen, J.A.; Poulsen, H.; Lakka, T.A.; Salonen, J.T. High dietary methionine intake increases the risk of acute coronary events in middle-aged men. Nutr. Metab. Cardiovasc. Dis. 2006, 16, 113–120. [Google Scholar] [CrossRef]
  49. Nosworthy, M.G.; Franczyk, A.; Zimoch-Korzycka, A.; Appah, P.; Utioh, A.; Neufeld, J.; House, J.D. Impact of processing on the protein quality of pinto bean (Phaseolus vulgaris) and buckwheat (Fagopyrum esculentum Moench) flours and blends, as determined by in vitro and in vivo methodologies. J. Agric. Food Chem. 2017, 65, 3919–3925. [Google Scholar] [CrossRef]
  50. Gabriella, P.; Csapó, J.; Varga-Visi, E. Determination of the enantiomers of methionine and cyst(e)ine in the form of methionine-sulphon and cysteic acid after performic acid oxidation by reversed phase high performance liquid chromatography. Agric. Conspec. Sci. 2003, 68, 269–273. [Google Scholar]
  51. Caire-Juvera, G.; Vázquez-Ortiz, F.A.; Grijalva-Haro, M. Amino acid composition, score and in vitro protein digestibility of foods commonly consumed in Norhwest Mexico. Nutr. Hosp. 2013, 28, 365–371. [Google Scholar] [PubMed]
  52. Avilés-Gaxiola, S.; Chuck-Hernández, C.; Serna Saldívar, S.O. Inactivation methods of trypsin inhibitor in legumes: A review. J. Food Sci. 2018, 83, 17–29. [Google Scholar] [CrossRef] [PubMed] [Green Version]
  53. Gilani, G.; Cockell, K.; Sepehr, E. Effects of antinutritional factors on protein digestibility and amino acid availability in foods. J. Aoac. Int. 2005, 88, 967–987. [Google Scholar] [CrossRef] [PubMed] [Green Version]
  54. Kobayashi, H. Prevention of cancer and inflammation by soybean protease inhibitors. Front. Biosci. 2013, 5, 966–973. [Google Scholar] [CrossRef] [PubMed]
  55. Rezende, A.A.; Pacheco, M.T.B.; da Silva, V.S.N.; de Castro Ferreira, T.A.P. Nutritional and protein quality of dry Brazilian beans (Phaseolus vulgaris L.). Food Sci. Technol. 2018, 38, 421–427. [Google Scholar] [CrossRef] [Green Version]
Figure 1. (A) Score plot of Portuguese common bean accessions (n = 66) cropped in Cabrela and Córdoba, in a bi-dimensional space (PC1 and PC2), which accounted to 75.4% of the total variance. Different common bean accessions were identified according to Table S2, followed by numbers 1 or 2 to indicate the corresponding environment. 1−Cabrela; 2−Córdoba. (B) Projection of the variables responsible for accessions’ dispersion.
Agronomy 11 00221 g001
Figure 2. Graphic representations of the genotype × environment interaction effects in the nutritional parameters analyzed. Common bean samples collected from Cabrela field trial were ranked according to increasing values of moisture, ash, fat, fiber, carbohydrates and protein contents.
Agronomy 11 00221 g002aAgronomy 11 00221 g002b
Figure 3. Genotype, environment and genotype × environment interaction’s contribution (Eta2 %) to general nutritional parameters’ variability in common bean accessions.
Agronomy 11 00221 g003
Figure 4. (A) Projection of Portuguese common bean accessions (n = 72) collected from Córdoba field trial, considering the variables directly related to protein analysis (B) P−Protein; Gly−glycine; Ala−alanine; Ser−serine; Pro−proline; Val−valine; Thr−threonine; Ile−isoleucine; Leu−leucine; Asp−aspartic acid; Glu−glutamic acid; Met−methionine; His−histidine; Phe−phenylalanine; Tyr−tyrosine; Lys−lysine; Arg−arginine; TIA−trypsin inhibitor activity, in a bi-dimensional space (PC1 and PC2), responsible by 79.1% of the total variance. The clusters were highlighted by different colors and symbols.
Agronomy 11 00221 g004
Figure 5. Example of a common bean (accession 29) digestogram obtained by in vitro multi-enzyme digestion of raw whole flour and corresponding cooked whole flour. Casein’s digestogram was also included for data comparison.
Agronomy 11 00221 g005
Table 1. Averages ± standard deviations of protein, carbohydrates, fat, fiber, ash and moisture contents (g/100 g) obtained for common bean accessions cropped in the two contrasting environments (Cabrela and Córdoba). In each row different letters indicate significant differences (p < 0.05) and equal letters the absence of differences (p > 0.05).
ParametersCabrela, 2014 (n = 79)Córdoba, 2015 (n = 93)
Protein21.26 ± 1.42 a24.10 ± 1.66 b
Carbohydrates60.58 ± 1.50 b56.68 ± 1.75 a
Fat1.44 ± 0.23 a1.49 ±0.47 a
Fiber5.75 ± 0.44 a6.77 ± 0.72 b
Ash3.15 ± 0.08 a3.25 ± 0.13 b
Moisture13.56 ± 0.45 a14.49 ± 0.51 b
Table 2. Protein quality (protein content, amino acid content, protein efficiency ratio, PER and amino acid score, AAS), and trypsin inhibitor activity, TIA, considering the clusters established for common bean accessions cropped in Córdoba (n = 72). Results were shown as the average ± standard deviation. In each row, different letters indicate significant differences between clusters (p < 0.05) and equal letters the absence of differences (p > 0.05).
ParametersCluster 1Cluster 2Cluster 3
Protein content, g/100 g25.33 ± 2.53 b24.35 ± 1.32 a,b23.48 ± 1.40 a
Amino acids composition, g/100 g (g/16 g N)
Gly1.27 ± 0.11 c (5.06 ± 0.60)1.00 ± 0.09 a (4.12 ± 0.39)1.09 ± 0.09 b (4.67 ± 0.38)
Ala1.32 ± 0.12 b (5.24 ± 0.63)1.07 ± 0.08 a (4.41 ± 0.41)1.05 ± 0.09 a (4.46 ± 0.40)
Ser1.52 ± 0.15 c (6.05 ± 0.80)1.19 ± 0.16 a (4.89 ± 0.71)1.31 ± 0.13 b (5.59 ± 0.62)
Pro1.12 ± 0.10 b (4.45 ± 0.51)0.94 ± 0.09 a (3.86 ± 0.41)0.90 ± 0.07 a (3.86 ± 0.31)
Val1.44 ± 0.13 b (5.71 ± 0.55)1.22 ± 0.12 a (5.01 ± 0.54)1.17 ± 0.11 a (4.99 ± 0.42)
Thr1.08 ± 0.14 b (4.30 ± 0.62)0.87 ± 0.12 a (3.52 ± 0.47)0.81 ± 0.10 a (3.40 ± 0.35)
Ile1.37 ± 0.12 b (5.45 ± 0.69)1.13 ± 0.13 a (4.64 ± 0.50)1.06 ± 0.10 a (4.53 ± 0.37)
Leu2.40 ± 0.22 b (9.56 ± 1.16)1.96 ± 0.22 a (8.06 ± 0.84)1.89 ± 0.19 a (8.06 ± 0.69)
Asp2.98 ± 0.21 b (11.85 ± 1.25)2.29 ± 0.23 a (9.42 ± 0.93)2.39 ± 0.23 a (10.17 ± 0.91)
Glu5.87 ± 0.50 c (23.38 ± 3.06)5.01 ± 0.50 b (20.61 ± 1.92)4.56 ± 0.39 a (19.46 ± 1.77)
Met0.15 ± 0.03 b (0.61 ± 0.10)0.13 ± 0.03 a (0.53 ± 0.10)0.12 ± 0.02 a (0.50 ± 0.07)
His0.83 ± 0.07 c (3.30 ± 0.49)0.71 ± 0.07 b (2.92 ± 0.31)0.64 ± 0.06 a (2.74 ± 0.25)
Phe1.67 ± 0.11 b (6.63 ± 0.61)1.42 ± 0.15 a (5.82 ± 0.54)1.36 ± 0.12 a (5.81 ± 0.47)
Tyr1.00 ± 0.09 b (4.00 ± 0.53)0.84 ± 0.09 a (3.46 ± 0.40)0.78 ± 0.08 a (3.34 ± 0.33)
Lys1.76 ± 0.10 b (7.01 ± 0.60)1.57 ± 0.17 a (6.45 ± 0.75)1.45 ± 0.13 a (6.19 ± 0.59)
Arg1.36 ± 0.16 b (5.39 ± 0.54)1.09 ± 0.14 a (4.47 ± 0.52)0.99 ± 0.13 a (4.22 ± 0.43)
PER
PER13.46 ± 0.50 b2.81 ± 0.37 a2.81 ± 0.30 a
PER23.45 ± 0.47 b2.83 ± 0.35 a2.84 ± 0.29 a
PER32.82 ± 0.54 b2.05 ± 0.45 a2.12 ± 0.38 a
AAS, %
AAS_Val163.07 ± 15.74 b143.13 ± 15.30 a142.50 ± 12.01 a
AAS_Thr126.38 ± 18.30 b105.11 ± 14.03 a101.44 ± 11.56 a
AAS_Ile194.60 ± 24.69 b165.70 ± 17.97 a161.84 ± 13.11 a
AAS_Leu144.78 ± 17.52 b122.12 ± 12.76 a122.14 ± 10.50 a
AAS_Met24.39 ± 4.07 b21.37 ± 4.01 a19.77 ± 2.96 a
AAS_His173.78 ± 25.85 c153.49 ± 16.11 b144.07 ± 13.29 a
AAS_Phe+Tyr168.76 ± 17.92 b147.25 ± 14.39 a145.20 ± 12.04 a
AAS_Lys120.92 ± 10.29 b111.15 ± 12.85 a106.79 ± 10.21 a
Protease inhibitors
TIA, mg/g9.68 ± 2.75 b10.95 ± 2.06 b7.47 ± 2.00 a
Table 3. In vitro protein digestibility (IVPD) and in vitro protein digestibility corrected by the limiting amino acid score (IVPDCAAS) in raw common bean accessions (n = 8). The in vitro protein digestibility (IVPD) of cooked common bean accessions (n = 4) was also presented.
#AccessionsIVPD (Raw) %IVPDCAAS (Raw) %IVPD (Cooked) %
1969869.66 ± 0.6413.0-
2070669.47 ± 0.8111.875.55 ± 1.63
25164469.22 ± 0.0110.373.52 ± 1.75
29166369.86 ± 0.1813.076.78 ± 0.21
43198469.06 ± 0.3812.1-
48217968.78 ± 0.3011.475.07 ± 0.41
64411969.61 ± 0.5211.0-
65412069.70 ± 0.1310.3-
Casein88.96 ± 1.90
Publisher’s Note: MDPI stays neutral with regard to jurisdictional claims in published maps and institutional affiliations.

