Article

Morphological and Biochemical Characterization of Wild Hop (Humulus lupulus L.) Populations from Banja Luka Area (Bosnia and Herzegovina)

1
Faculty of Agriculture, University of Banja Luka, Bulevar Vojvode Petra Bojovića 1A, 78 000 Banja Luka, Republic of Srpska, Bosnia and Herzegovina
2
Slovenian Institute of Hop Research and Brewing, Cesta Žalskega tabora 2, 3310 Žalec, Slovenia
3
Institute of Genetic Resources, University of Banja Luka, Bulevar Vojvode Petra Bojovića 1A, 78 000 Banja Luka, Republic of Srpska, Bosnia and Herzegovina
*
Author to whom correspondence should be addressed.
Submission received: 10 December 2020 / Revised: 21 January 2021 / Accepted: 25 January 2021 / Published: 28 January 2021
(This article belongs to the Special Issue Use of Wild Crop Relatives as Genetic Resources in Crop Breeding)

Abstract

:
This study aims to do a morphological and biochemical characterization of selected wild hop populations from the Banja Luka region, as plant material with potential value for introduction into plant selection. Female inflorescences (cones) from seven populations (DKH3, DKH5, DKH6, DKH8, DKH9, DKH10, and DKH11) were sampled in 2018 and 2019. Hop cones were collected in October 2018 and 2019 for morphological characterization, when 50 cones per population were analyzed, and also the cones were collected in mid-September in 2019 for biochemical characterization. Morphological parameters were carried out for: cone length (cm), number of nodes per cone spindle, cone density, and number of seeds per cone, all important agronomic characters in hop production. Also, 27 components of essential oil and 6 components of hop resins were analyzed. Statistical analysis of morphological characteristics was performed by factorial analysis of variance (year × population), and the significance of individual differences was determined by LSD test. The grouping of examined hop populations according to the manifested morphological characteristics was performed by cluster analysis. Statistical analysis for biochemical characteristics was performed by analysis of variance, and the significance of the differences was tested by Tukey’s statistical test. In order to determine similarities between different population multivariant statistical method Principal component analysis (PCA) was applied. According to morphological and biochemical analysis, DKH6 hop population is singled out as the most valuable for hop breeding.

1. Introduction

The hop (Humulus lupulus L.) is a dioecious, anemophilous, perennial climbing plant arising from a rhizome with large numbers of adventitious roots [1]. The aboveground part of the hop plant annually grows from the crown or rhizome, while the rootstock is perennial. This plant species grows spontaneously in nature in temperate climate zones, between a latitude of 35° N and 55° N [2,3]. Hops have pistillate and staminate flowers on different plants, but are cultivated only for their mature (technological maturity stage) unfertilized female inflorescence—commonly called cones (strobiles). These hop cones consist of a central axis (spindle), bracts, and bracteoles where glandular trichomes form lupulin glands, which are the most important source of secondary metabolites (resins, essential oils, and tannins) for beer production [4]. Floral meristems are arranged in pairs at each floral node along the central axis of the developing cone, and each flower is enclosed within a bracteole. Two pairs of flowers, each pair being subtended by a stipular bract, are arranged in the same plane of phyllotaxy, and each cluster of four flowers is arranged alternately along the axis [5]. The most important fraction of hop resins are alpha-bitter acids which are synthesized in the lupulin glands [6]. With hops, one of the main reasons the wort is boiled is because of the isomerization reaction of the hop alpha-acids (cohumulone, n + adhumulone) into their isomerized forms (iso-cohumulone, iso-n + adhumulone), which are responsible for the well-known beer bitterness. The duration of kettle hopping depends on the time required for the isomerization to take place [7]. Higher contents of alpha-acids result in more iso-alpha-acids after boiling and higher bitterness. Interestingly, high contents of cohumulone are not desired in the brewing industry, since iso-cohumulone is often responsible for unpleasant, harsh bitterness [8].
Hop essential oils are mostly used in beer brewing, but are also found in biological and pharmacological products [9]. The volatile aroma compounds of the hops are crucial for brewers, since they give beer its unique hoppy aroma [10]. Volatiles of hops are a very heterogeneous and complex mixture of hundreds of compounds within a certain concentration range [11], however their influences on beer aroma are not in proportion with their concentrations. In modern breeding, wild hop germplasm can provide breeders crucial new gene pools necessary for plant improvement [12,13]. Hop breeding started with clonal selections from adapted wild hops, but modern hop cultivars are obtained by hybridization [14]. Bosnia and Herzegovina (BiH) is not producing hops, although environmental conditions exist there for their production. In the nature of the Northern part of BiH—along the forest edges, along riverbeds, and amongst abandoned households—hop is a widespread plant species. Our study represents the first research on wild hop populations in Bosnia and Herzegovina in order to evaluate this plant material, and is aimed towards the detection of population with appropriate traits for breeding. The Northern and central part of the country have a temperate continental climate, while the Southern part has a Mediterranean climate. The need for hop production arises from the fact that there are four large breweries in BiH (Banja Luka Brewery, Sarajevo Brewery, Brewery Tuzla, and Bihać Brewery) and in recent years there has been a growing interest in the production of craft beer. In 1873, Trappist monks founded the first brewery in the Banja Luka region, and beside hops, various fruits and grape varieties were introduced to this region. Goals such as the effective management of plant genetic resources through carrying out field inventories and collecting, evaluating, exchanging, and conserving the germplasm are also covered by the recent establishment of The Programme for Conservation of Plant Genetic Resources in the Republic of Srpska [15].

2. Materials and Methods

2.1. Plant Material

Cones from seven wild hop populations were sampled from the area of Banja Luka (44° 46′ 19.8516″ N; 17° 11′ 27.6″ E) in Bosnia and Herzegovina. Hop populations were several kilometers apart, and since they are wild plants that are often found in inaccessible terrain, it was impossible to determine the strict number of plants. Also, as the plants were intertwined, it was impossible to determine sex per plant, and to establish a relationship between males and females. These wild hop populations were growing in groups and we could estimate that there were 5–10 plants in a group. Hop cones were sampled from female plants in the population. Hop cones were collected in mid-of September in 2019 for chemical analysis (250–300 g of fresh cones per population in three replicates), and in October (2018 and 2019) for morphological analysis, when we analyzed 50 cones per population.

2.2. Determination of Morphological Characteristics

Morphological parameters of 50 fresh cones were determined for: cone length (mm), number of nodes per cone spindle, cone density (as a ratio between number of nodes per cone length), and number of seeds per cone. Cone length was measured at the beginning of the base to the top of the cone, using a caliper. Number of nodes per cone spindle were counted after the removal of bracts and bracteoles, starting from the first scar at the spindle base to the top.

2.3. Determination of Hop Resins by HPLC

According to Analytica–EBC 7.7 method [16], high performance liquid chromatography (HPLC) was employed to determine the alpha- and beta-acids in hops. Ground hops (5 g) was added to 80 mL of the mixture of diethyl ether/methanol and 0.1 M aqueous hydrochloric acid in a ratio of 10/50/20 (v/v/v). Extracts were filtered through a disposable syringe filter, Chromafil Xtra PET-45/25 (Macherey-Nagel, Düren, Germany) and 10 µL injection loop on HPLC injector was used. The separation was achieved on Nucleodur 5–100 C18, 125 × 4 mm HPLC analysis column (Macherey-Nagel, Düren, Germany). Isocratic mobile phase constituted from distilled water, methanol (J.T.Baker, Phillipsburg, New Jersey, USA) and 85% aqueous solution of ortophosphoric acid (MERCK, Kenilworth, NJ, USA) in a ratio of 775/210/9 (v/v/v) was used and the detection was carried out with Diode array detector (DAD) set at 314 nm for alpha- and beta-acids and 370 nm for xanthohumol. The quantification was done by the external standard ICE4 (NATECO2, Wolnzach, Germany). All solvents were of analytical grade purity.

2.4. Determination of the Content and GC Analysis of Hop Essential Oils

Determinations of total essential oil content were carried out according to Analytica–EBC 7.10 method [17]. Briefly 50 g of dry and ground hop coins were mixed with 1000 mL of deionized water and steam distilled for 3 h. Identification and quantification of components of hop essential oil were carried out according to Analytica–EBC 7.12 method [18]. Then 0.2 mL of collected oil was diluted with 5 mL of hexane and separated by GC analysis. Agilent 6890 series GC system equipped with the flame ionization detector and HP-1 capillary column (30 m × 0.25 mm, 25 µm, Agilent, Santa Clara, CA, USA) and nitrogen 5.0 as a carrier gas with a flow rate 0.6 mL min−1 was used. Solution (1 µL) was injected in the injector at the temperature of 200 °C. The programmed temperature was 1 min at 60 °C, 2.5 °C min−1 to 190 °C, 1 min at 190 °C, 70 °C min−1 to 240 °C, and 11 min at 240 °C. The detection was carried out on a flame ionization detector set at 260 °C (23). All solvents were of analytical grade or higher purity purchased by Sigma-Aldrich, Germany. Following the methodology and using standards purchased at Sigma-Aldrich, the following components were determined; myrcene, trans o-cymene, linalool, methyl caprylate octanoate, geraniol, methyl-nonyl-keton (undecanon), delta-cadinene T, methyl-deca-4-enoate, methyl-deca-4-dienoate, geranyl acetate, beta-caryophyllene, alpha-humulene, farnesene, germacrene-D, beta-selinene, alpha-selinene, bisabolene, caryophyllene epoxide, humulene epoxide-2, humulene epoxide-1, Iso-butyl-iso-butyrate, limonene, 2-nonanone (methyl-heptyl-keton), alpha-pinene, beta-pinene, and farnezol. LOQ of the method was 0.1 rel.%.

2.5. Statistical Analysis

Two-factorial analysis of variance was conducted for parameters of morphological characterization, with population and years as factors. Significant differences were detected by calculating F test statistics with p < 0.05 and p < 0.01. Multiple comparisons were performed for significant F-values, by Fisher’s post-hoc Least Significant Difference (LSD) test at significance p < 0.05 p < 0.01. The grouping of examined hop populations according to the manifested morphological characteristics was performed by cluster analysis. All calculations were done using Microsoft Excel program. Principal component analysis of HPLC and GC results, together with two-pair comparisons were done by software OriginLab (Origin Lab Corporation, Northampton, MA, USA).

3. Results

3.1. Cone Shape of Hop Populations

As the cone shape is an important quality trait in hop breeding, cone shape determination based on the UPOV Descriptor from 2006 [19] was done on 50 hop cones per population. An average estimation of cone shape is detailed in Table 1.
According to Table 1, of the five shapes offered in the UPOV Descriptor from 2006, three shapes were found in our study: narrow ovate (DKH3 and DKH9), medium ovate (DKH5, DKH8 and DKH10), and broad ovate (DKH6 and DKH11). Cylindrical and globose shapes in the studied wild hop populations were not found. Otherwise the cone shape is characteristic trait of the hop cultivars.

3.2. Meteorological and Soil Conditions of the Research Area

During the experimental period (2018 and 2019) monitoring of temperature and precipitation were applied. In addition, meteorological conditions determined by the average air temperature and the total amount of precipitation on a monthly and annual level are shown in Table 2.
The average annual temperature in the area of Banja Luka in 2018 was 12.9 °C and the total annual precipitation was 1012.6 mm, while in 2019 average annual temperature was 13.4 °C and total annual precipitation was 976.6 mm (Table 2).
For the purposes of soil chemical analysis, soil samples around each population to a depth of 30 cm were taken in 2019, and the results of the basic parameters are shown in Table 3.
In the examined soil samples the obtained pH value in KCl varied from 6.15 to 7.20, which leads to the conclusion that tested soil samples ranged from slightly acidic to slightly alkaline. According to the humus content, the examined sites were mostly very humic, except for the site where DKH11 hop population was found, where the soil was slightly humic (2.7%). Phosphorus content varied from 0.5 to 84.0 mg 100 g−1, while the potassium content at all sites was high (20.2–75.0 mg 100 g−1).

3.3. Cone Length of Hop Populations

Table 4 refers to the examined trait cone length (CL) of hop populations, and the measured values are expressed in mm. In the experimental year of 2018, the hop population DKH11 had the smallest average CL (32.02 mm), while the population DKH3 had the highest average CL (51.68 mm), a similar situation occured in 2019, when population DKH11 had the smallest average CL (33.23 mm), while the population DKH3 had the highest average CL (48.26 mm). Analysis of variance shows that only effects of population were statistically significant at p < 0.01. According to the LSD-test, in 2018 the highest CL of 51.68 mm in DKH3 was not statistically different from CL in DKH9 (48.74 mm), while in relation to remaining hop populations, it had the significantly highest cone length. Also, in 2019, DKH3 population (48.26 mm) was not statistically different from DKH9 (47.45 mm), while in relation to other populations, it had the highest average cone length, but the differences related to DKH5 (43.08 mm) and DKH8 (40.40 mm) were significantly higher at p < 0.05.
Dendrogram in Figure 1 shows that based on a two-year average of cone length, hop populations can be grouped into three groups. The group with the longest cones consists of populations DKH3 (49.97 mm) and DKH9 (48.10 mm). The middle group consists of populations DKH5 (43.31 mm), DKH8 (41.01 mm) and DKH6 (38.43 mm), and the group with the smallest cone length consists of populations DKH10 (34.86 mm) and DKH11 (32.63 mm).

3.4. Number of Nodes Per Cone Spindle of Hop Populations

Table 5 refers to the number of nodes per cone spindle (NCS) of hop populations. In the examined year 2018, DKH11 population had the smallest average NCS (6.38), while DKH3 population had the highest average NCS (11.18), in 2019, DKH11 population had the smallest average NCS (6.42), while DKH3 population had the highest average NCS (10.94). Analysis of variance shows that the effects of population were statistically significant at p < 0.01. The effect of the year as well as the interaction effect (population × year) were not statistically significant. According to the LSD-test, in 2018 the highest average NCS of 11.18 in DKH3 was statistically different from DKH9 (9.94) at p < 0.05, but it was statistically significantly higher at p < 0.01 in comparison to remaining hop populations. In 2019 the highest average NCS of 10.94 in DKH3 was higher in comparison to DKH5 (8.96) and DKH9 (9.88) at p < 0.05, and significantly higher at p < 0.01 in comparison to other examined hop populations.
The dendrogram in Figure 2 shows that based on a two-year average of number of nodes per cone spindle (NCS), hop populations can be grouped into two groups. The group with a relatively larger NCS includes hop populations DKH3 (11.06), DKH9 (9.91), DKH5 (8.99), and DKH8 (8.47), and the group with a relatively smaller NCS consists of hop populations DKH6 (7.61), DKH10 (7.00), and DKH11 (6.40). The DKH3 population is a separate group with the largest number of nodes per cone spindle, which suggests that the remaining populations can be grouped into two subgroups.

3.5. Cone Density of Hop Populations

Table 6 refers to trait cone density (CD) of examined hop populations. In the experimental year of 2018, DKH6 hop population had the smallest average CD (1.90), while DKH3 population had the highest average CD (2.18). In 2019, DKH11 population had the smallest average CD (1.97), while DKH3 population had the highest average CD (2.27). Analysis of variance shows that the effects of population were statistically significant at p < 0.01, as well as the interaction effect (population × year), while the effect of the year was not statistically significant. According to the LSD-test, in 2018 the highest average CD of 2.18 in DKH3 was not statistically different from DKH5 (2.13) and DKH8 (2.13), but it was higher in comparison to remaining hop populations. In 2019 the highest average CD of 2.27 in DKH3 was higher in comparison to other examined hop populations.
The dendrogram in Figure 3 shows that based on a two-year average of cone density, hop populations can be grouped into two groups. The group with a relatively larger CD consisting of hop populations DKH3 (2.23) and DKH9 (2.08), while other populations DKH5 (2.11), DKH8 (2.07), DKH6 (2.00), DKH10 (2.02), and DKH11 (1.98) form a separate group with certain subgroups.

3.6. Number of Seeds Per Cone of Hop Populations

Table 7 refers to the trait number of seeds per cone (SC) of examined hop populations. In the examined year 2018, DKH10 hop population had the smallest average SC (5.14), while DKH8 population had the highest average SC (20.56). In 2019, DKH6 population had the smallest average SC (13.06), while DKH9 population had the highest average SC (18.78). Analysis of variance shows that the effects of population, years, as well as interaction effect (population × year) were statistically significant at p < 0.01. There are interactions in the sense that years can have a significant impact on some hop populations. According to the LSD-test, in 2018 the highest SC of 20.56 in DKH8 was statistically significantly higher at p < 0.01 in comparison to other examined hop populations, except with DKH9 (16.66) where the difference was significant at p < 0.05. In 2019 the highest SC of 18.78 in DKH9 did not differ from realized SC values of populations DKH8 (17.88) and DKH10 (17.72), while it was higher than the other examined populations.
The dendrogram in Figure 4 shows that based on a two-year average of number of seeds per cone (SC), hop populations can be grouped into the group with relatively higher SC consisting of hop populations DKH8 (19.22) and DKH9 (17.72) and the group with relatively lower SC consisting of populations DKH3 (15.39), DKH5 (14.36), DKH11 (13.85), and DKH6 (12.48). DKH10 hop population (11.43) is located between these two groups, and it is characterized by a large variation of number of seeds per cone at the year level with a difference of 12.58.

3.7. Biochemical Properties of Hop Populations Cones

In Table 8, means of all determined hop resins alpha-acids, beta-acids and xanthohumol, together with their ratios cohumulone/alpha-acids (co-alpha-acid), (colupulon/beta acids/co-beta-acids) and alpha/beta-acid are presented together with standard deviations for each population group. Further statistical treatment by two-pairs Tukey’s statistical test was performed to evaluate possible similarities between population groups regarding the particular parameters. Indication of similarities is presented with letters a, b, c, d, and e where the same letter means no significant difference and different letters mean significant difference at p < 0.05.
The projection of 21 hop samples belonging to 7 different groups, represented by 6 parameters (presented in Table 8) onto a plot defined by the PC1 (53.68%) and PC2 (33.75%) together with loadings plot for particular parameters is presented on Figure 5. Variance covered by principal components was 53.68, 33.75, 8.39, 2.83, and 0.93% for PC1, PC2, PC3, PC4, and PC5, respectively.
In Table 9 calculated coefficients for all input parameters are presented for the first two principal components PC1 and PC2. Variance covered by principal components was 53.68, 33.75, 8.39, 2.83, and 0.93 % for PC1, PC2, PC3, PC4, and PC5.
Table 10 covers the presentation of means of 27 different essential oil components for all 7 analyzed hop population groups that were determined in GC analysis after the collection of oils by steam distillation. The selected compounds were those with concentrations higher than 0.01 rel.% in the oil and were unambiguously determined with comparisons with standards by GC. The mean content of essential oils in ml 100 g−1 of hop is also presented in the last row.
For further statistical analyses, only 5 components were selected. Selection of compounds was done according to their importance for the contribution to the beer aroma and the same compounds are usually used when the aroma profile for hop varieties is presented. In Table 11, only the aforementioned 5 components, namely alpha-humulene, myrcene, beta-caryophyllene, farnesene, and linalool are presented together with the standard deviations calculated for each hop population group. Further statistical treatment by two-pairs Tukey’s statistical test was performed to evaluate possible similarities between population groups regarding the particular component. Indication of similarities is presented with letters a, b, c where the same letter means no significant difference and different letters mean significant difference at p < 0.05.
After the simple statistics we applied multivariant statistical method Principal component analysis (PCA) to see if there were any similarities between different population groups, taking into account all variables at the same time. Accordingly, we used components’ concentrations described in Table 11 as input parameters. Figure 6 shows the projection of 21 hop samples belonging to 7 different groups, represented by 5 variables (content of selected hop essential oil components) onto a plot defined by the PC1 (44.54%) and PC2 (24.88%) together with loadings plot for variables.
In Table 12 calculated coefficients for all input parameters are presented for the first two principal components PC1 and PC2. Variance covered by principal components were 44.54, 24.88, 19.31, 5.95, and 5.32% for PC1, PC2, PC3, PC4, and PC5, respectively.

4. Discussion

The vegetation period of wild hops in local conditions lasts from April to October. Hops tolerate annual temperatures of 5.6 to 21.3 °C [20]. The average annual temperature in the area of Banja Luka in 2018 was 12.9 °C and in 2019 was 13.4 °C (Table 2), which is consistent with hops’ needs. The photosynthetic activity of hops is conditioned by temperature, e.g., it has been determined that hop plants achieved maximal carbon assimilation at temperatures of 21 to 39 °C, when sufficient water is provided [21]. These temperatures in the studied area are characteristic for June, July, and August. In the northern hemisphere, sufficient rainfall for hop consists of almost 100 mm each month [22]. The total annual precipitation in the area of Banja Luka was 1012.6 mm in 2018, while in 2019 it was 976.6 mm (Table 2). It can be concluded that the total amount of precipitation in the studied area is relatively consistent with hops’ needs, however, as temperatures in the summer months can be relatively high, the occurrence of drought is possible. Hops prefer soils with a pH range of 6.0 to 6.5, but also grow on soils with pH from 4.8 to 8.0 [22]. Soil samples in this study had pH values from 6.15 to 7.20 (Table 3), which is why we conclude that pH value was not a limiting factor.
In general, the morphological characterization of agricultural plants precedes chemical as well as molecular characterization. The agronomic quality of hops is more related to the plant morphological characteristics, while the chemical characteristics of cones are more important for the brewing quality [23]. Phytochemical, genetic, and morphological properties of wild hops should be compared to commercial cultivars with the aim of detecting local germplasm that can serve as a basis in the breeding and obtaining of new hop cultivars [
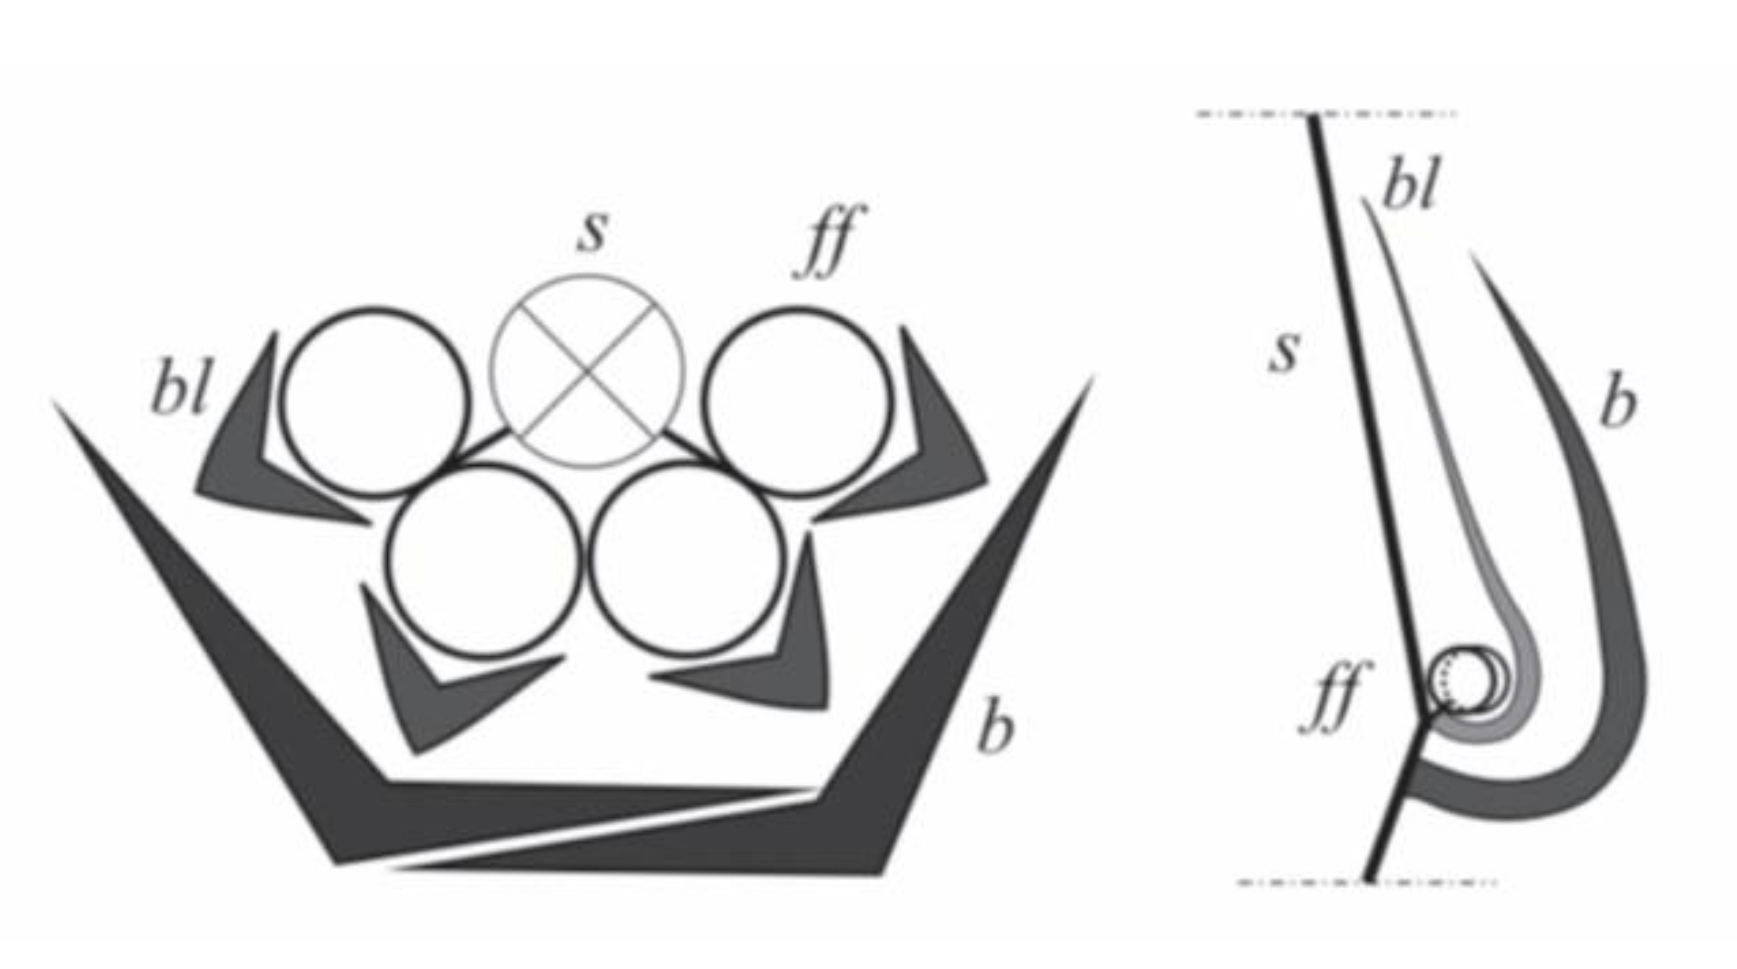
24]. In the performed study on selected wild hop populations, alongside cone chemical characterization, cone morphological characterization was also performed. Schematic presentation of the cone segment is shown in Figure 7. As is well known, the hop cone consists of bracts and bracteoles which are leaf like structures that surround the entire cone, attaching to a central axis or spindle [25]. In our conducted study the average cone length of the examined hop populations was 41.6 mm in 2018 and 40.7 mm in 2019, longer compared to the results obtained on Italian wild hop accessions, which were only up to 37.0 mm long [24]. On the other hand, investigated Norwegian and Danish hop genotypes reached up to 43.0 mm in length [
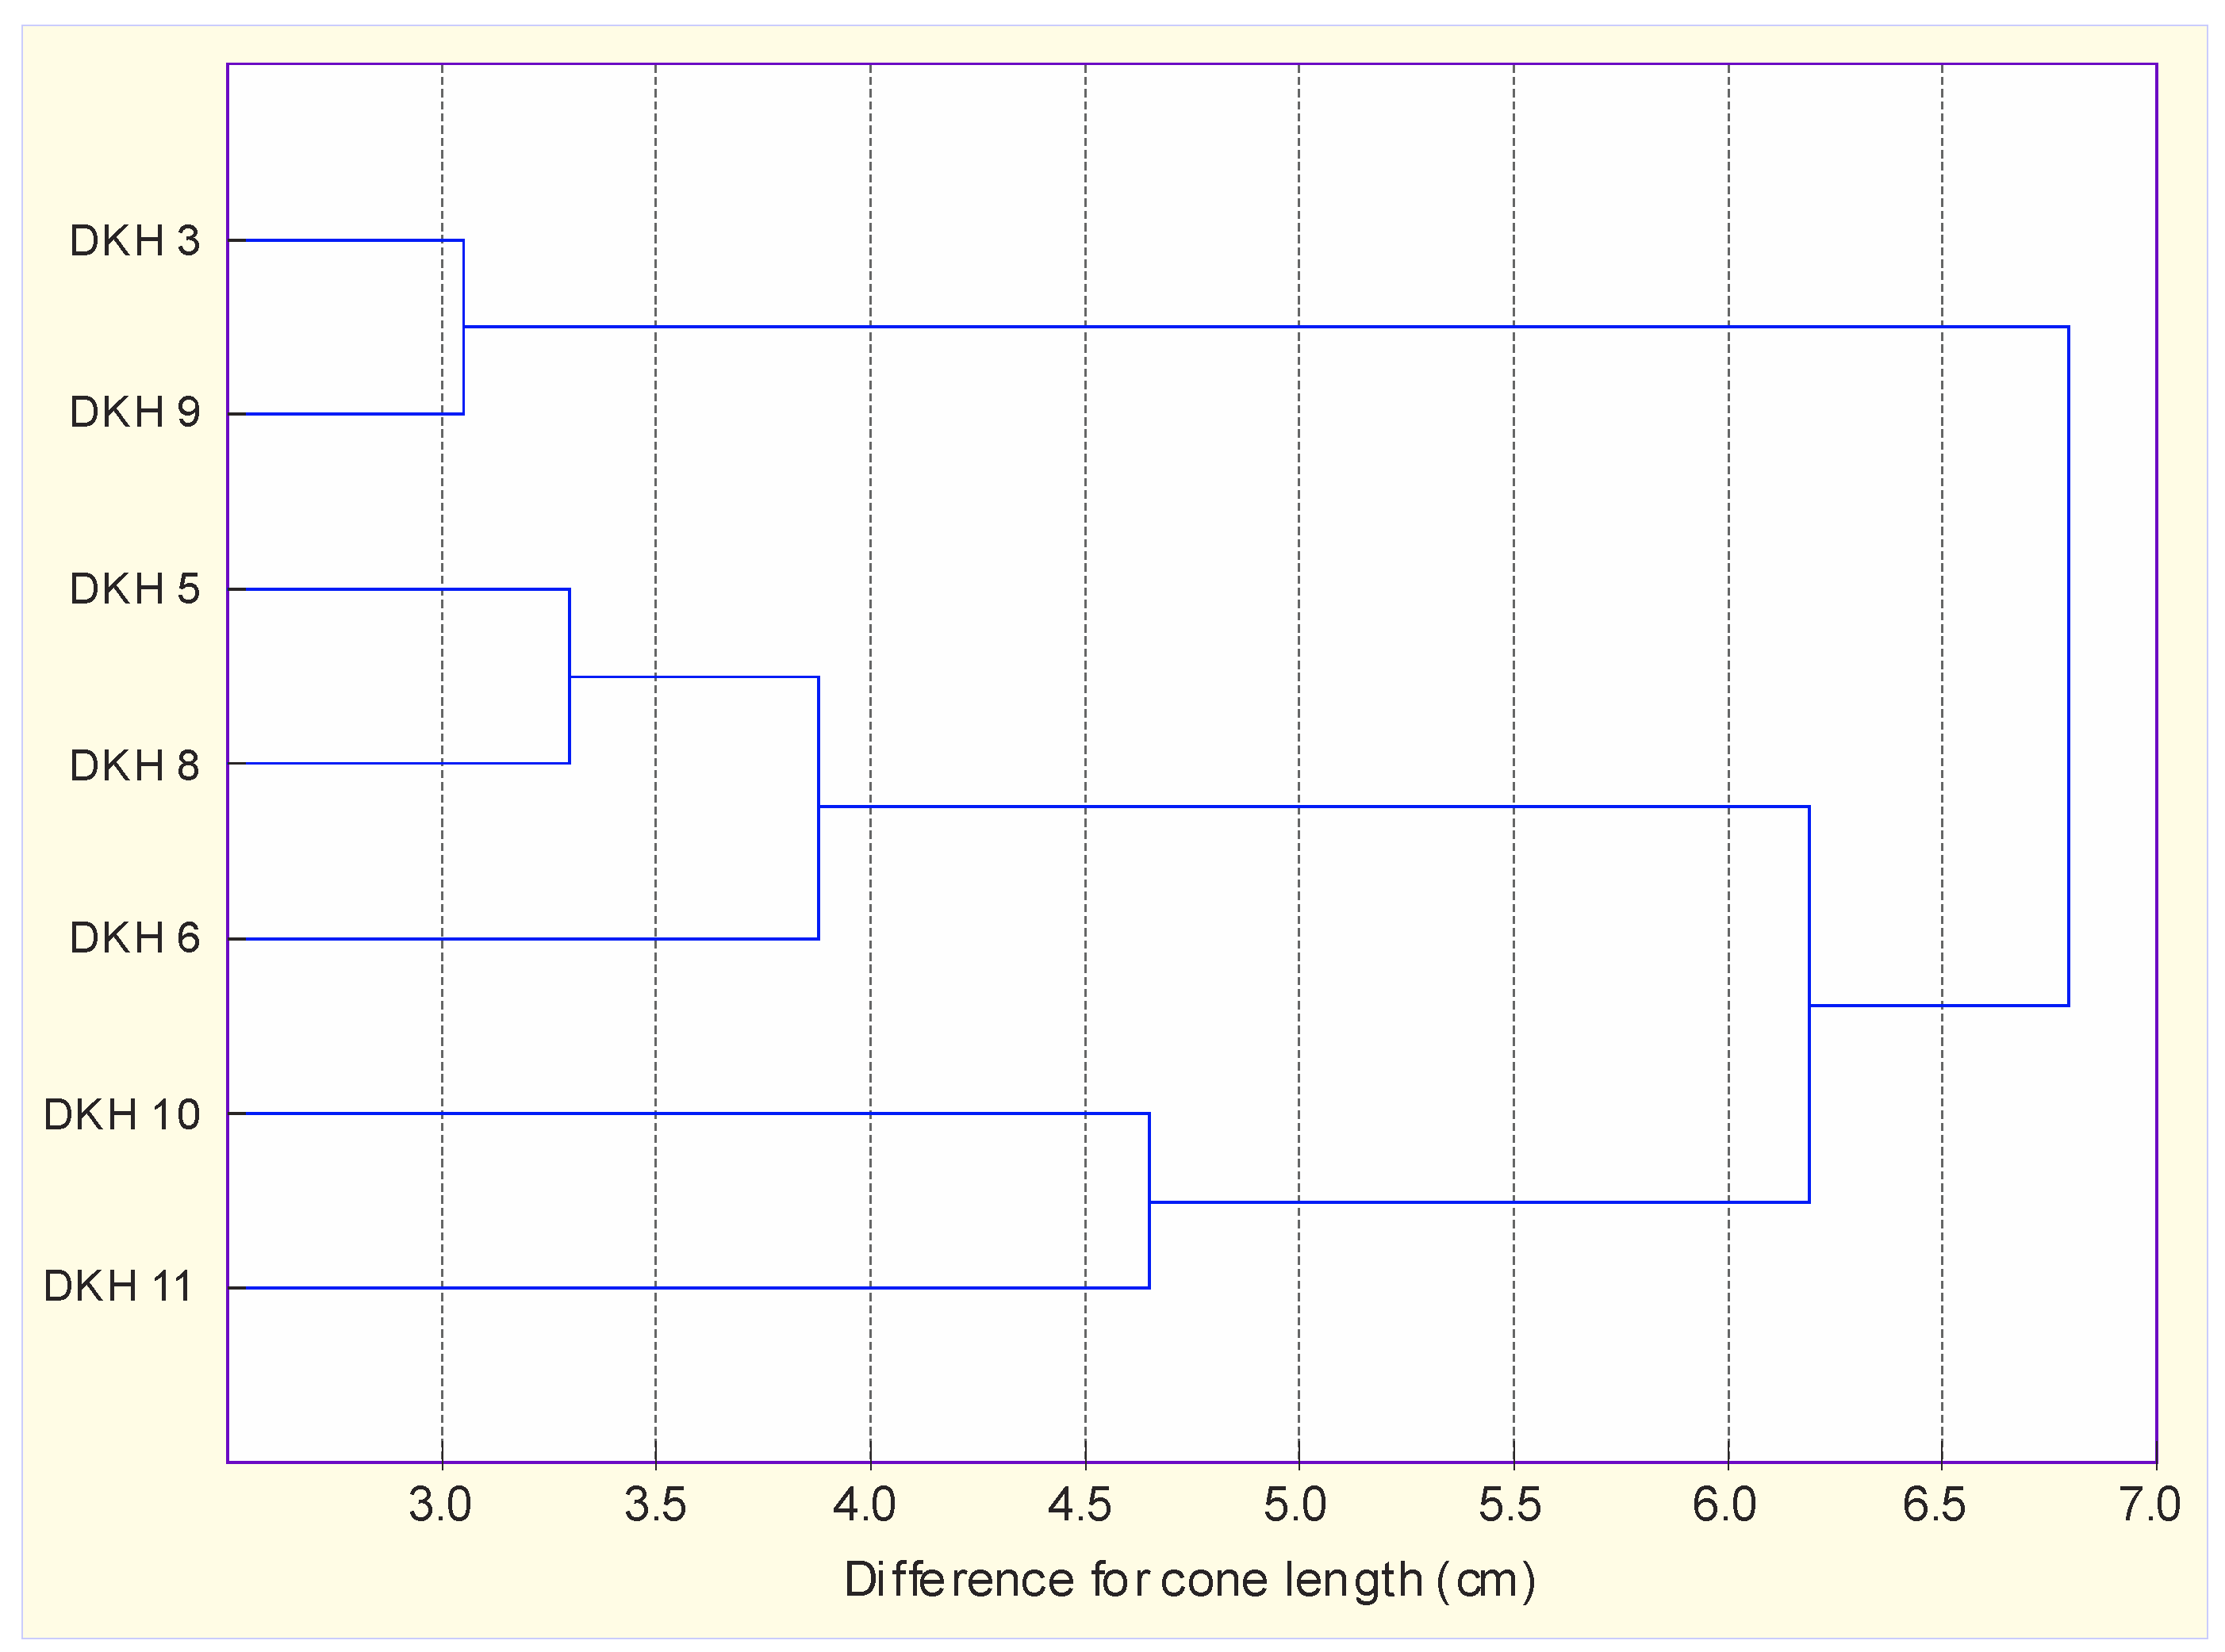
26]. Hop populations DKH3 (49.97 mm) and DKH9 (48.10 mm) stand out as the populations with the longest cones, while populations DKH10 (34.86 mm) and DKH11 (32.63 mm) represent the shortest cones. The central axis or hop spindle has a zigzag shape. The morphological characterization of the spindle is important from a breeding point of view, as a relatively larger number of nodes and shorter internodes provide cone compactness thus possibly preventing the loss of lupulin glands.
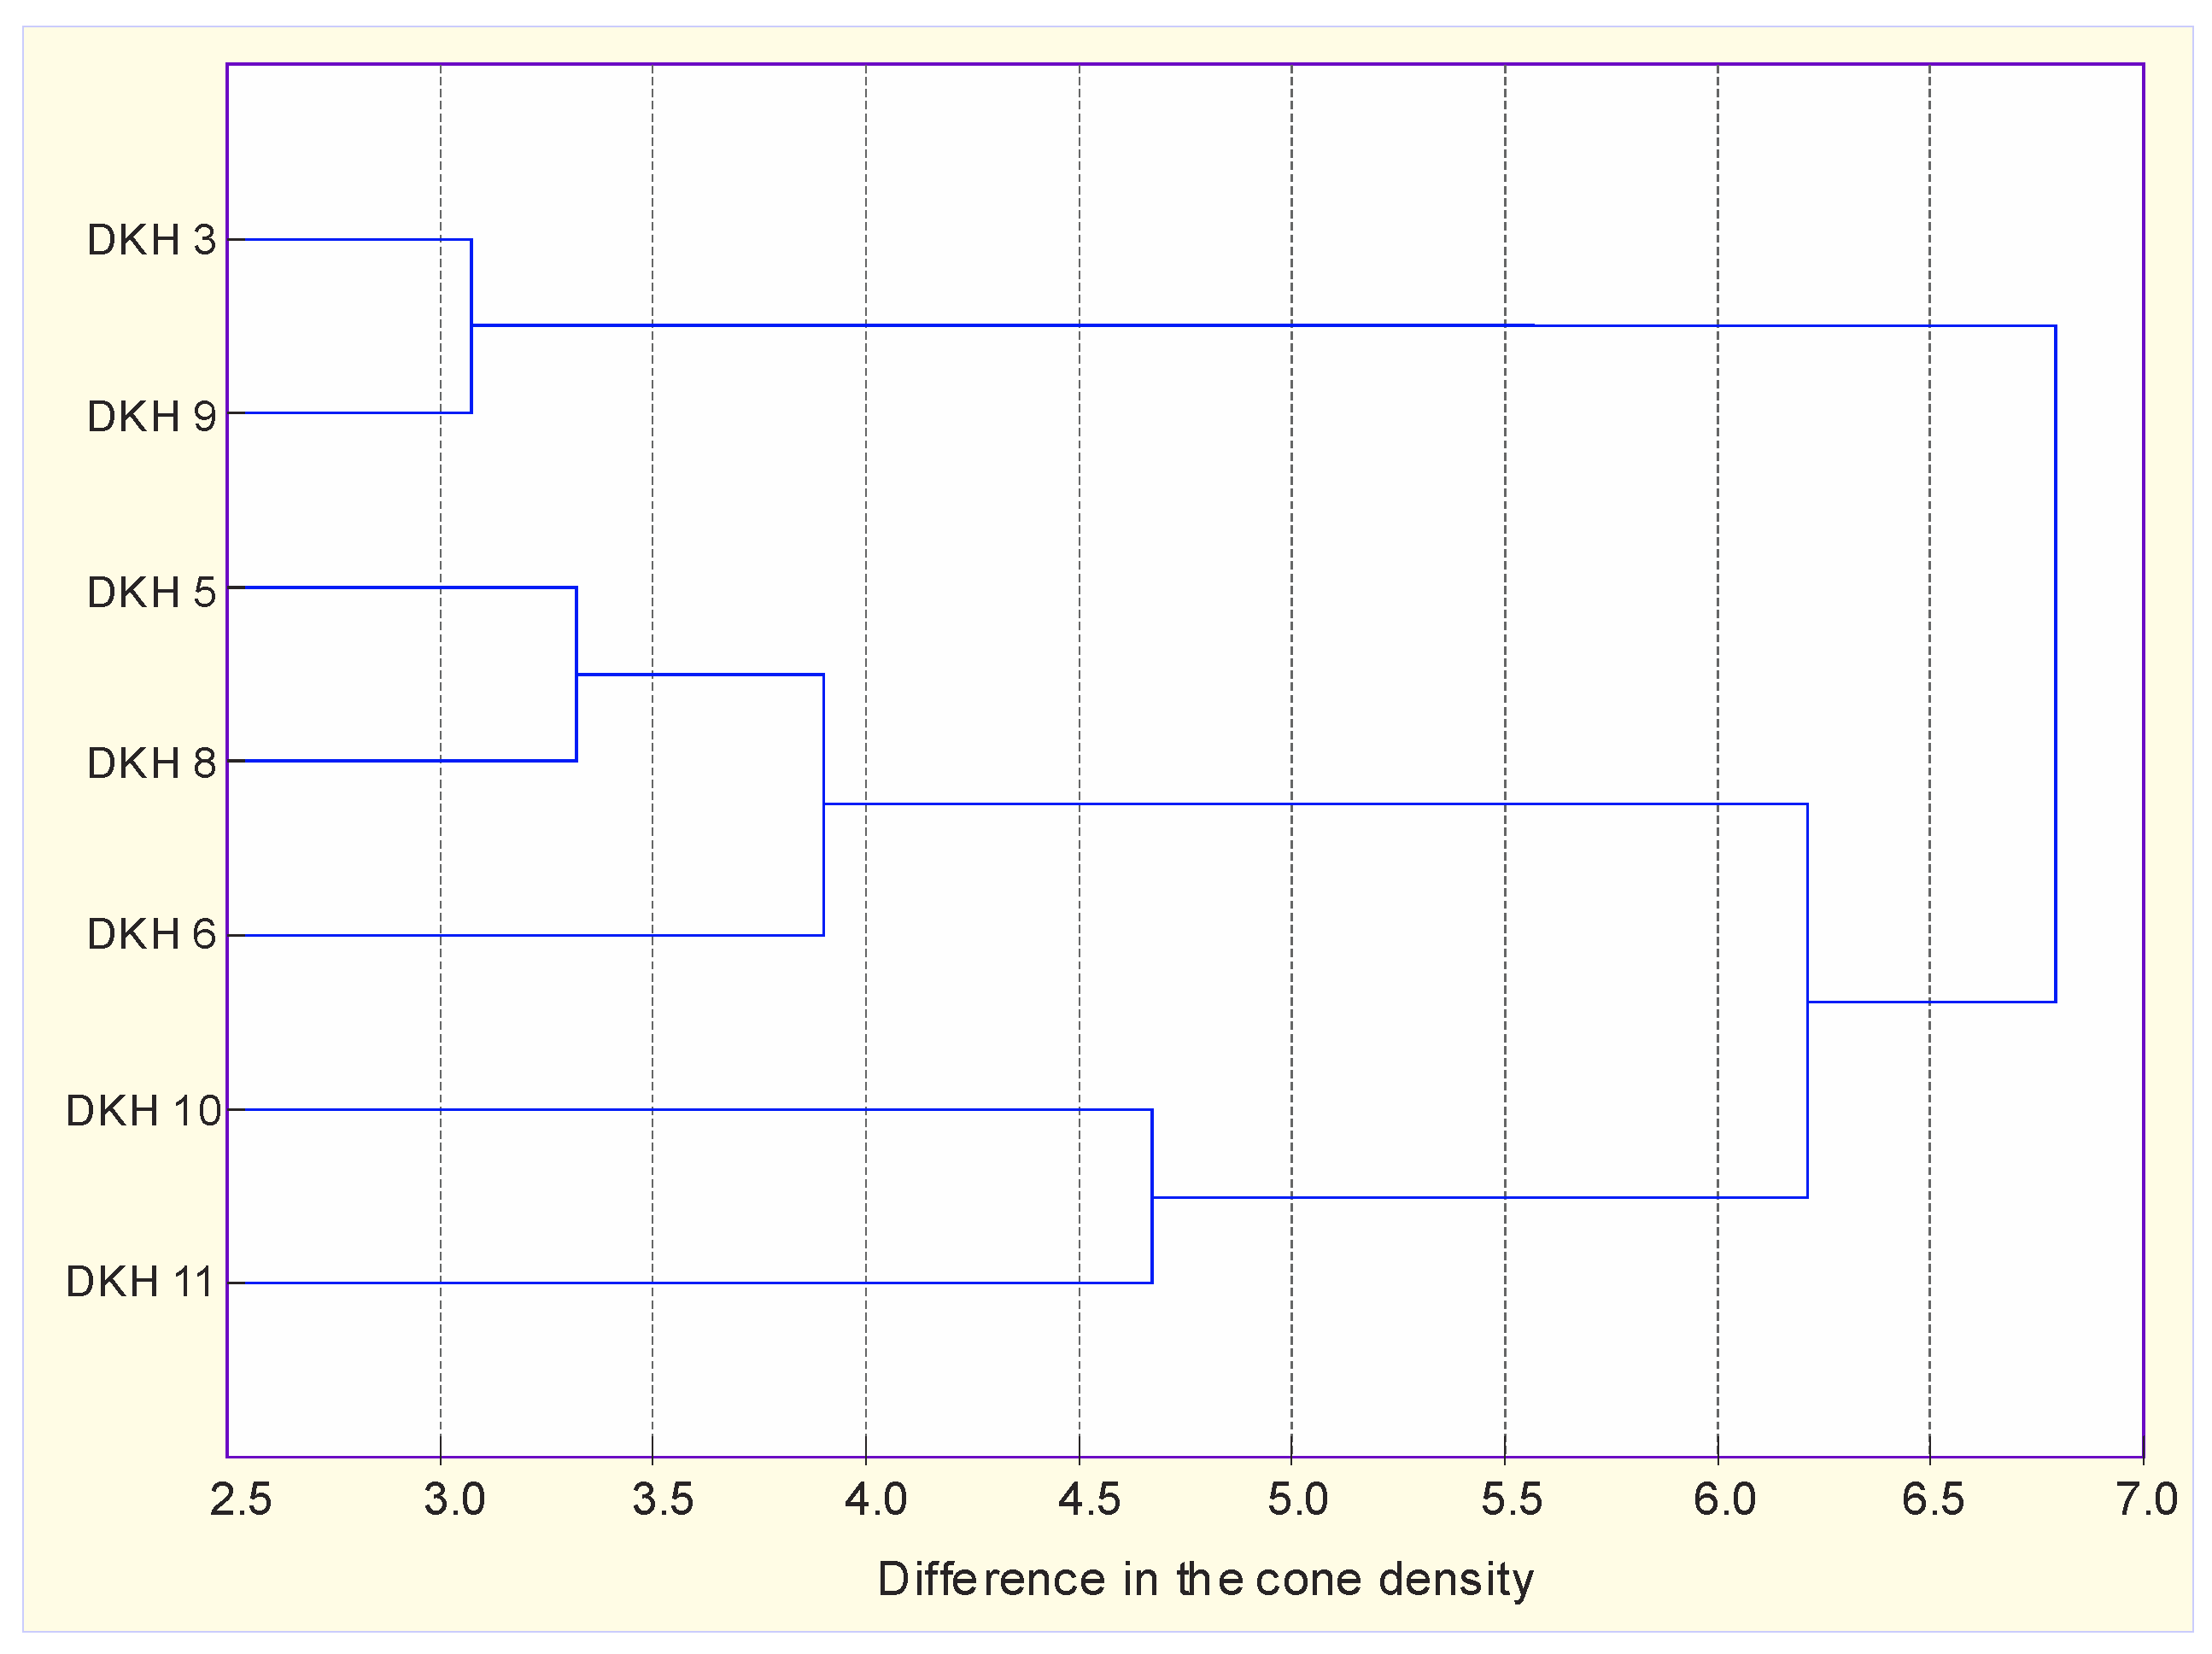
The average number of nodes per cone spindle of the examined wild hop populations was 8.5 in 2018 and 8.4 in 2019. Based on a two-year average, examined hop populations DKH3 (11.06), DKH5 (8.99), DKH8 (8.47), and DKH9 (9.91) belong to a cluster with a relatively larger number of nodes per cone spindle. The group with the relatively larger cone density consisted of hop populations DKH3 (2.23) and DKH9 (2.08). The cone density is the most useful parameter for hop breeding, indicating the best ratio between the number of nodes and cone length. In our study, the most appropriate cones for growing were DKH3 with the highest values in both examined years, followed by DKH9 based on cluster analysis (
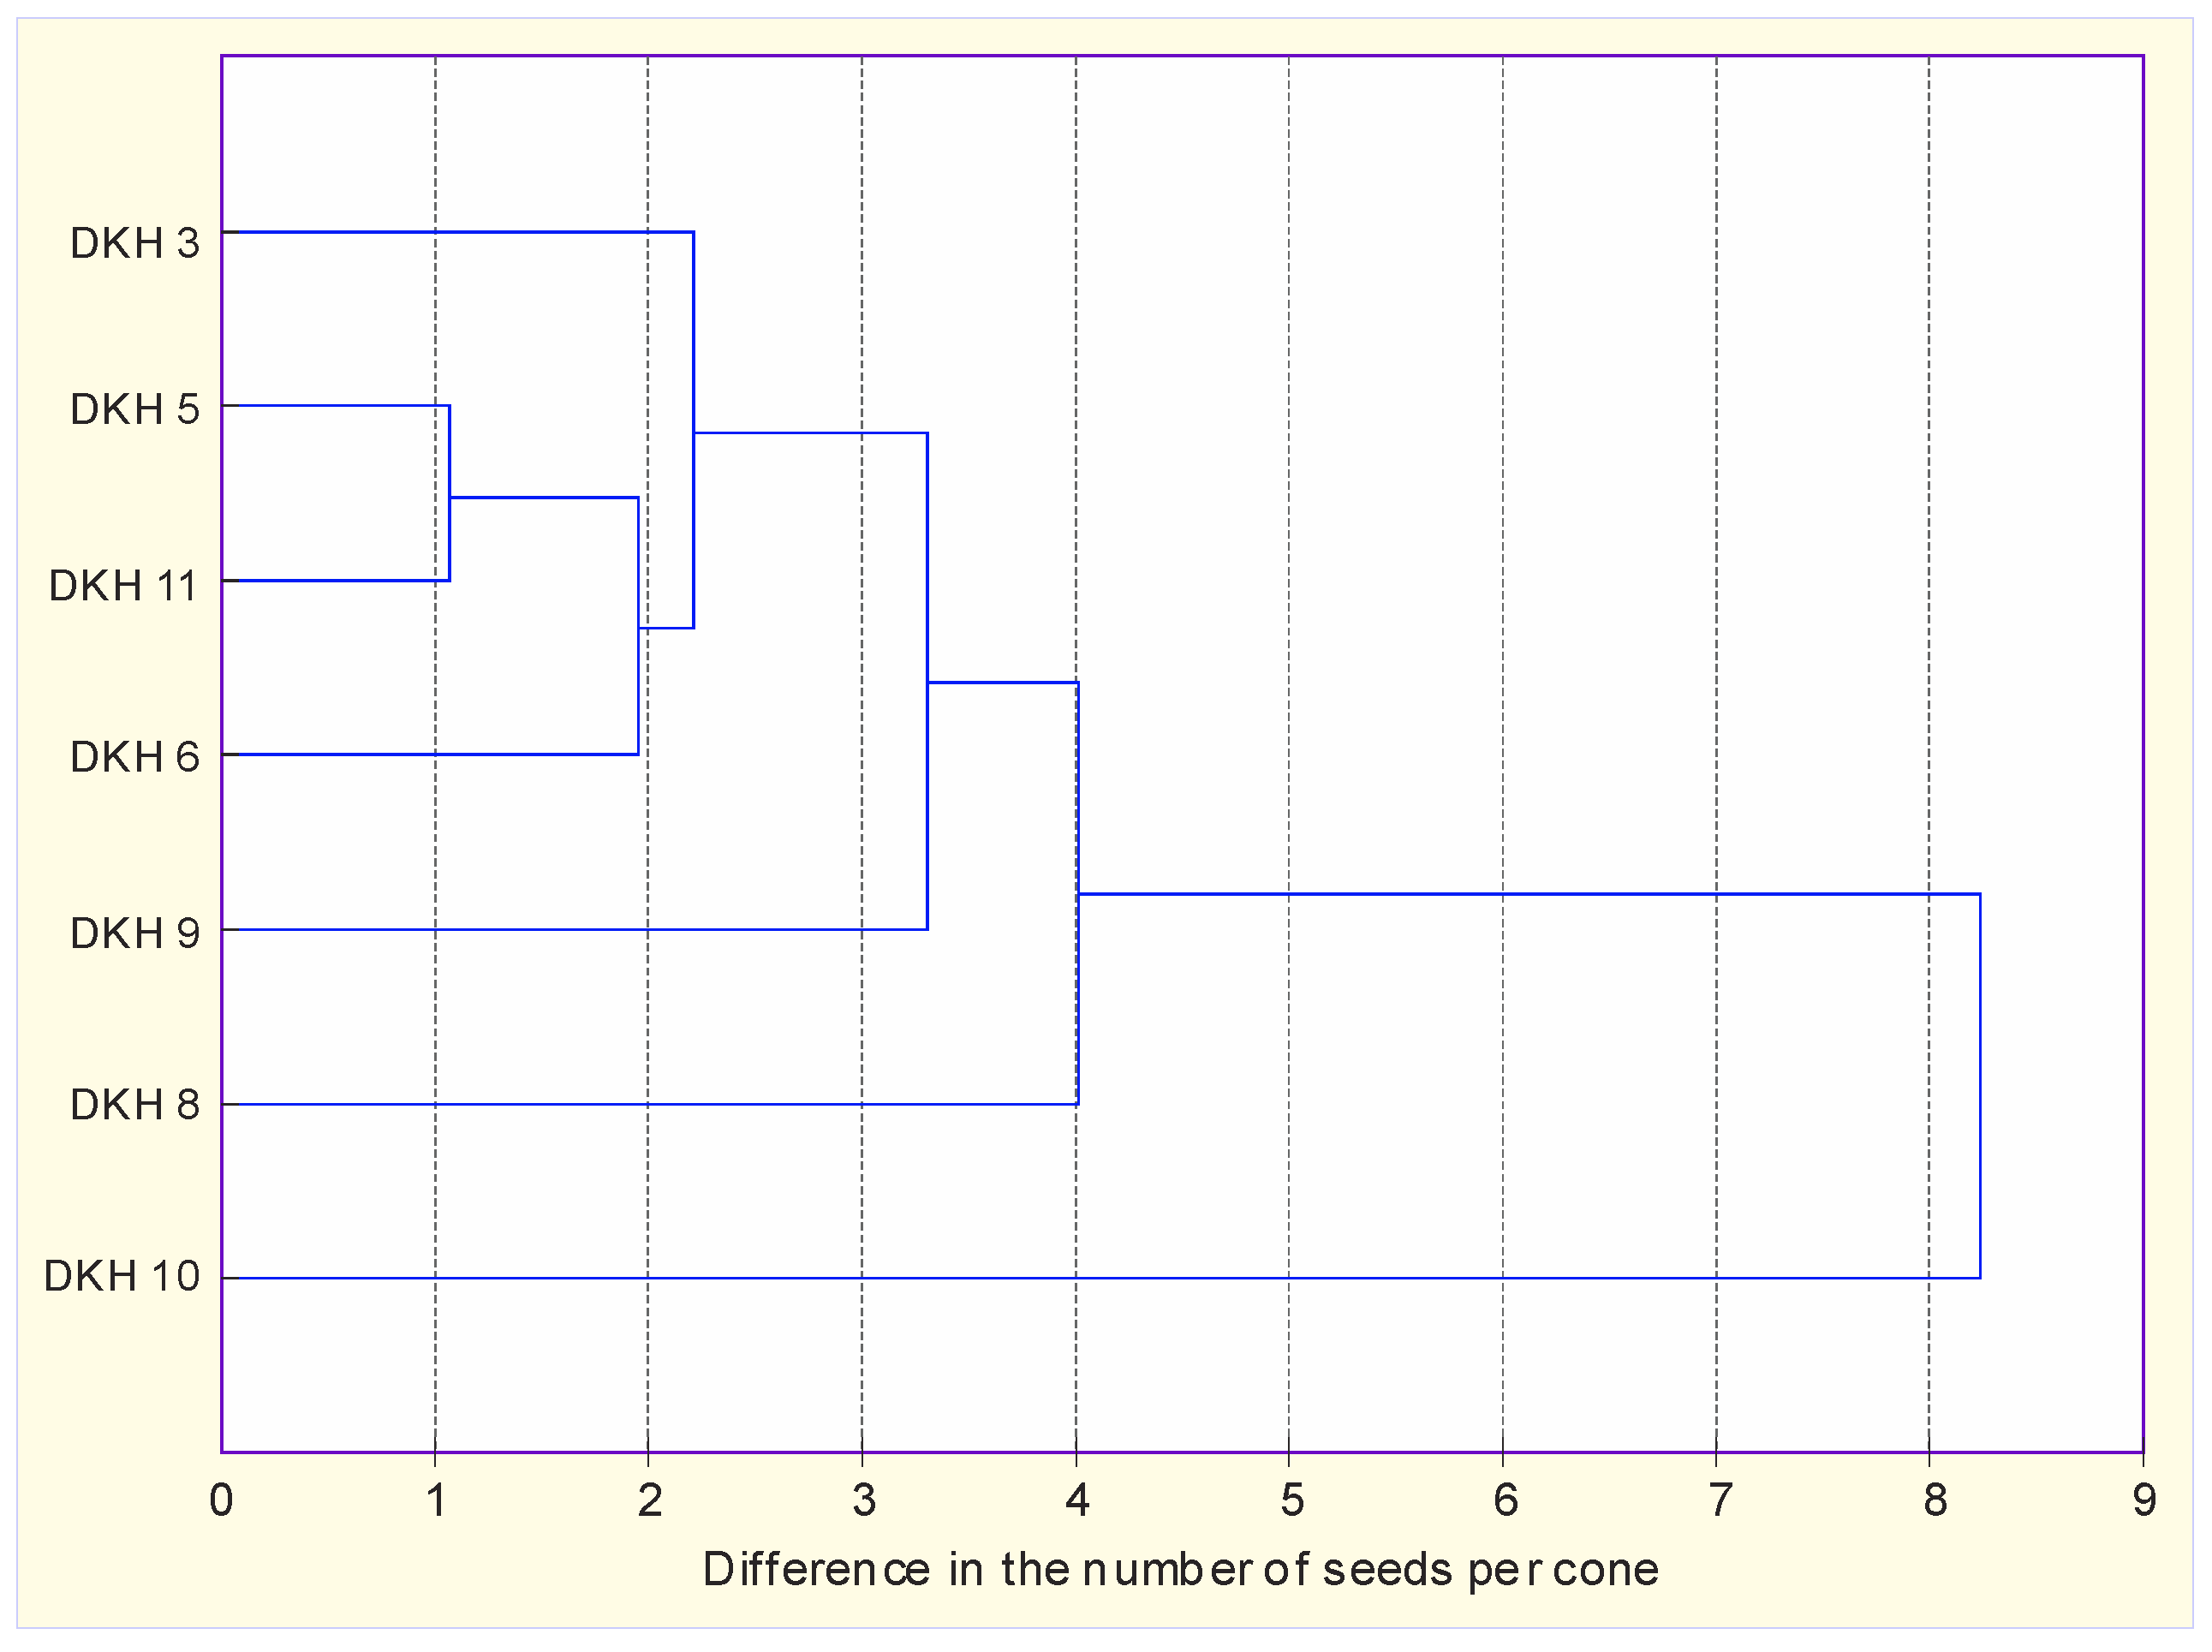
Figure 3). The true hop fruit is an achene (one-seeded fruit), but commonly simply called seed. The seed formation in the hop female inflorescences is conditioned by the presence of male plants, the flowers of which produce fertile pollen grains spread by wind. This fact demonstrates how wild hop populations are maintained in nature. Nevertheless, in both examined years, male plants with developed flowers were observed, spreading pollen by wind. Therefore, we can assume that in average all female plants were exposed in the same extent to the hop pollen. Consequently, a different number of seeds obtained per female plant could be linked to the female predisposition of developing hop seeds. The number of seeds in the cones of commercial cultivars is smaller because they are protected against open pollination by removing male plants from the plantation and its surroundings. Open pollination conditions are also used in the hybridization and development of new hop cultivars, so male plants are essential in hop breeding programs. Seed formation in cones is not desirable in hop cultivars used in the brewing industry, as it reduces the quality and quantity of hop resins [27,28]. The seed content at examined hop selections and commercial cultivars was 0.9–11.7% [29]. Seedless hop cones are desirable because they contain more essential oils and resins in relation to cones with seeds. In our study on wild hop populations the average number of seeds per cone was 13.8 in 2018, and 16.1 in 2019. Hop populations DKH8 (19.22) and DKH9 (17.72) form the group with relatively higher number of seeds per cone, while populations DKH3 (15.39), DKH5 (14.36), DKH6 (12.48), and DKH11 (13.85) belong to the group with relatively lower number of seeds per cone. The least number of seeds was observed in the DKH10 population in 2018 (5.14). Volatile compounds in hop essential oil affect aroma and flavor, non-volatile components such as carboxylic acids, hop resins, amino acids, carbohydrates, and polyphenols affect the taste of the final beer product [11].
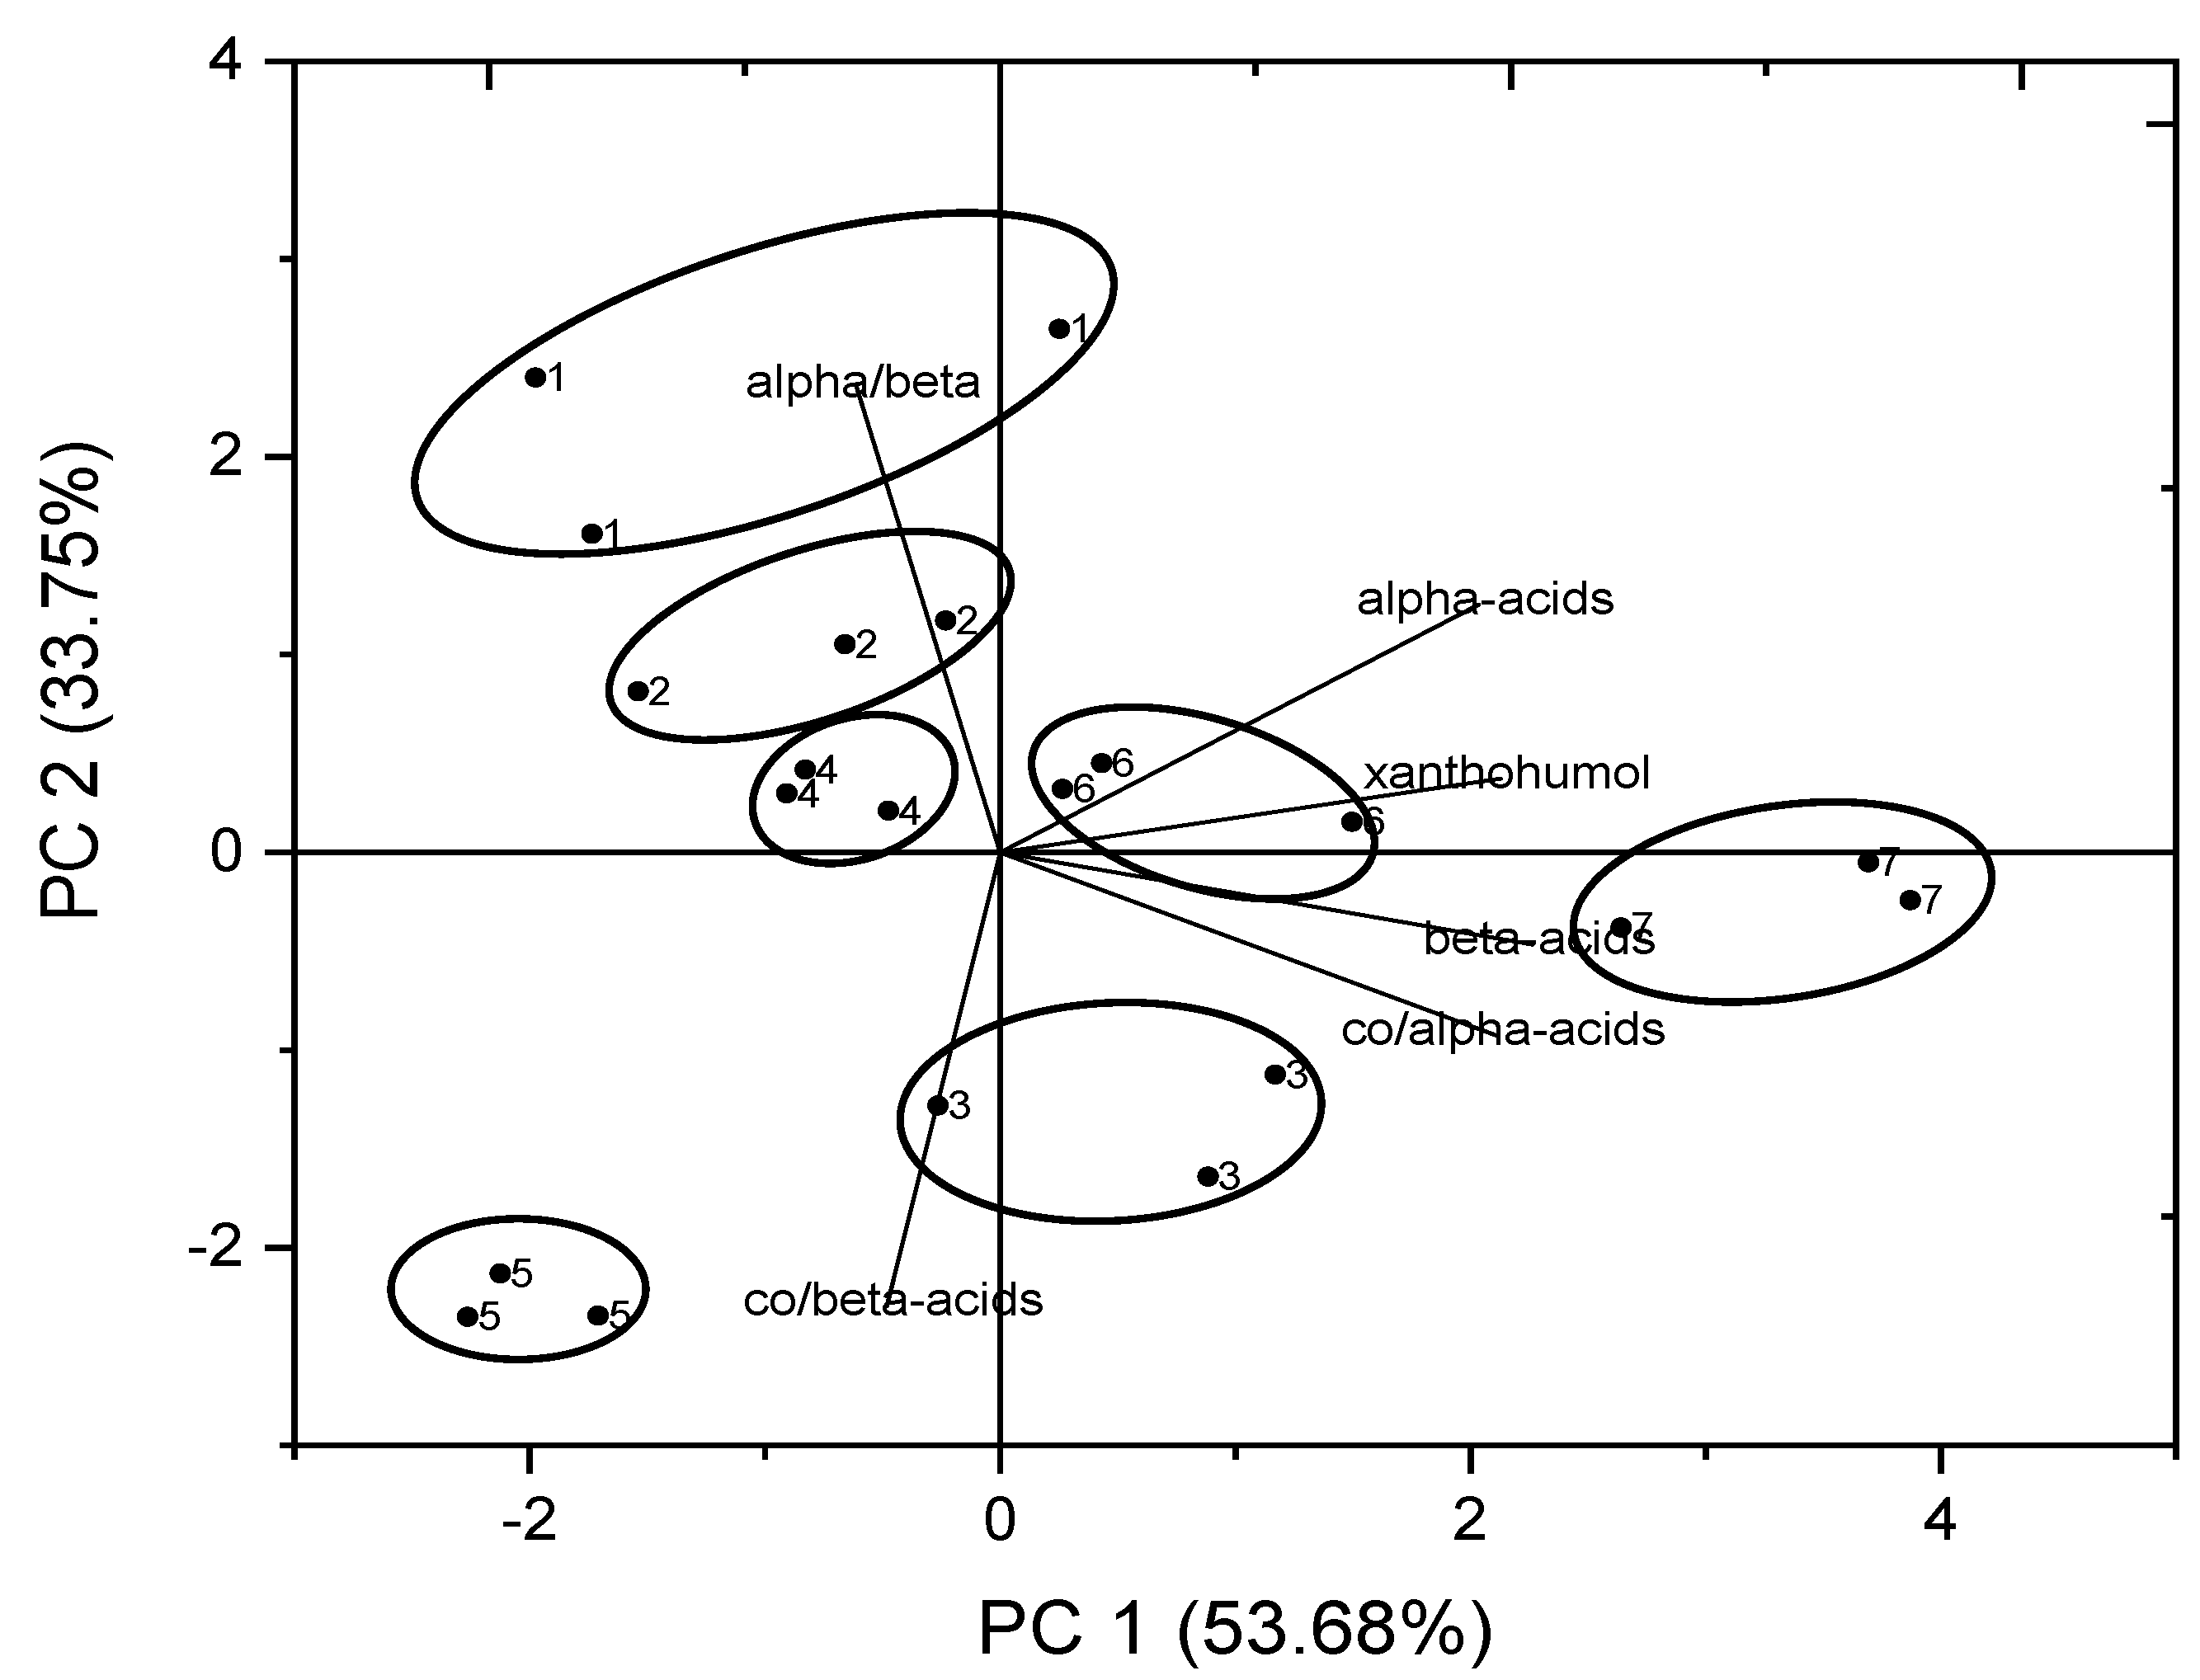
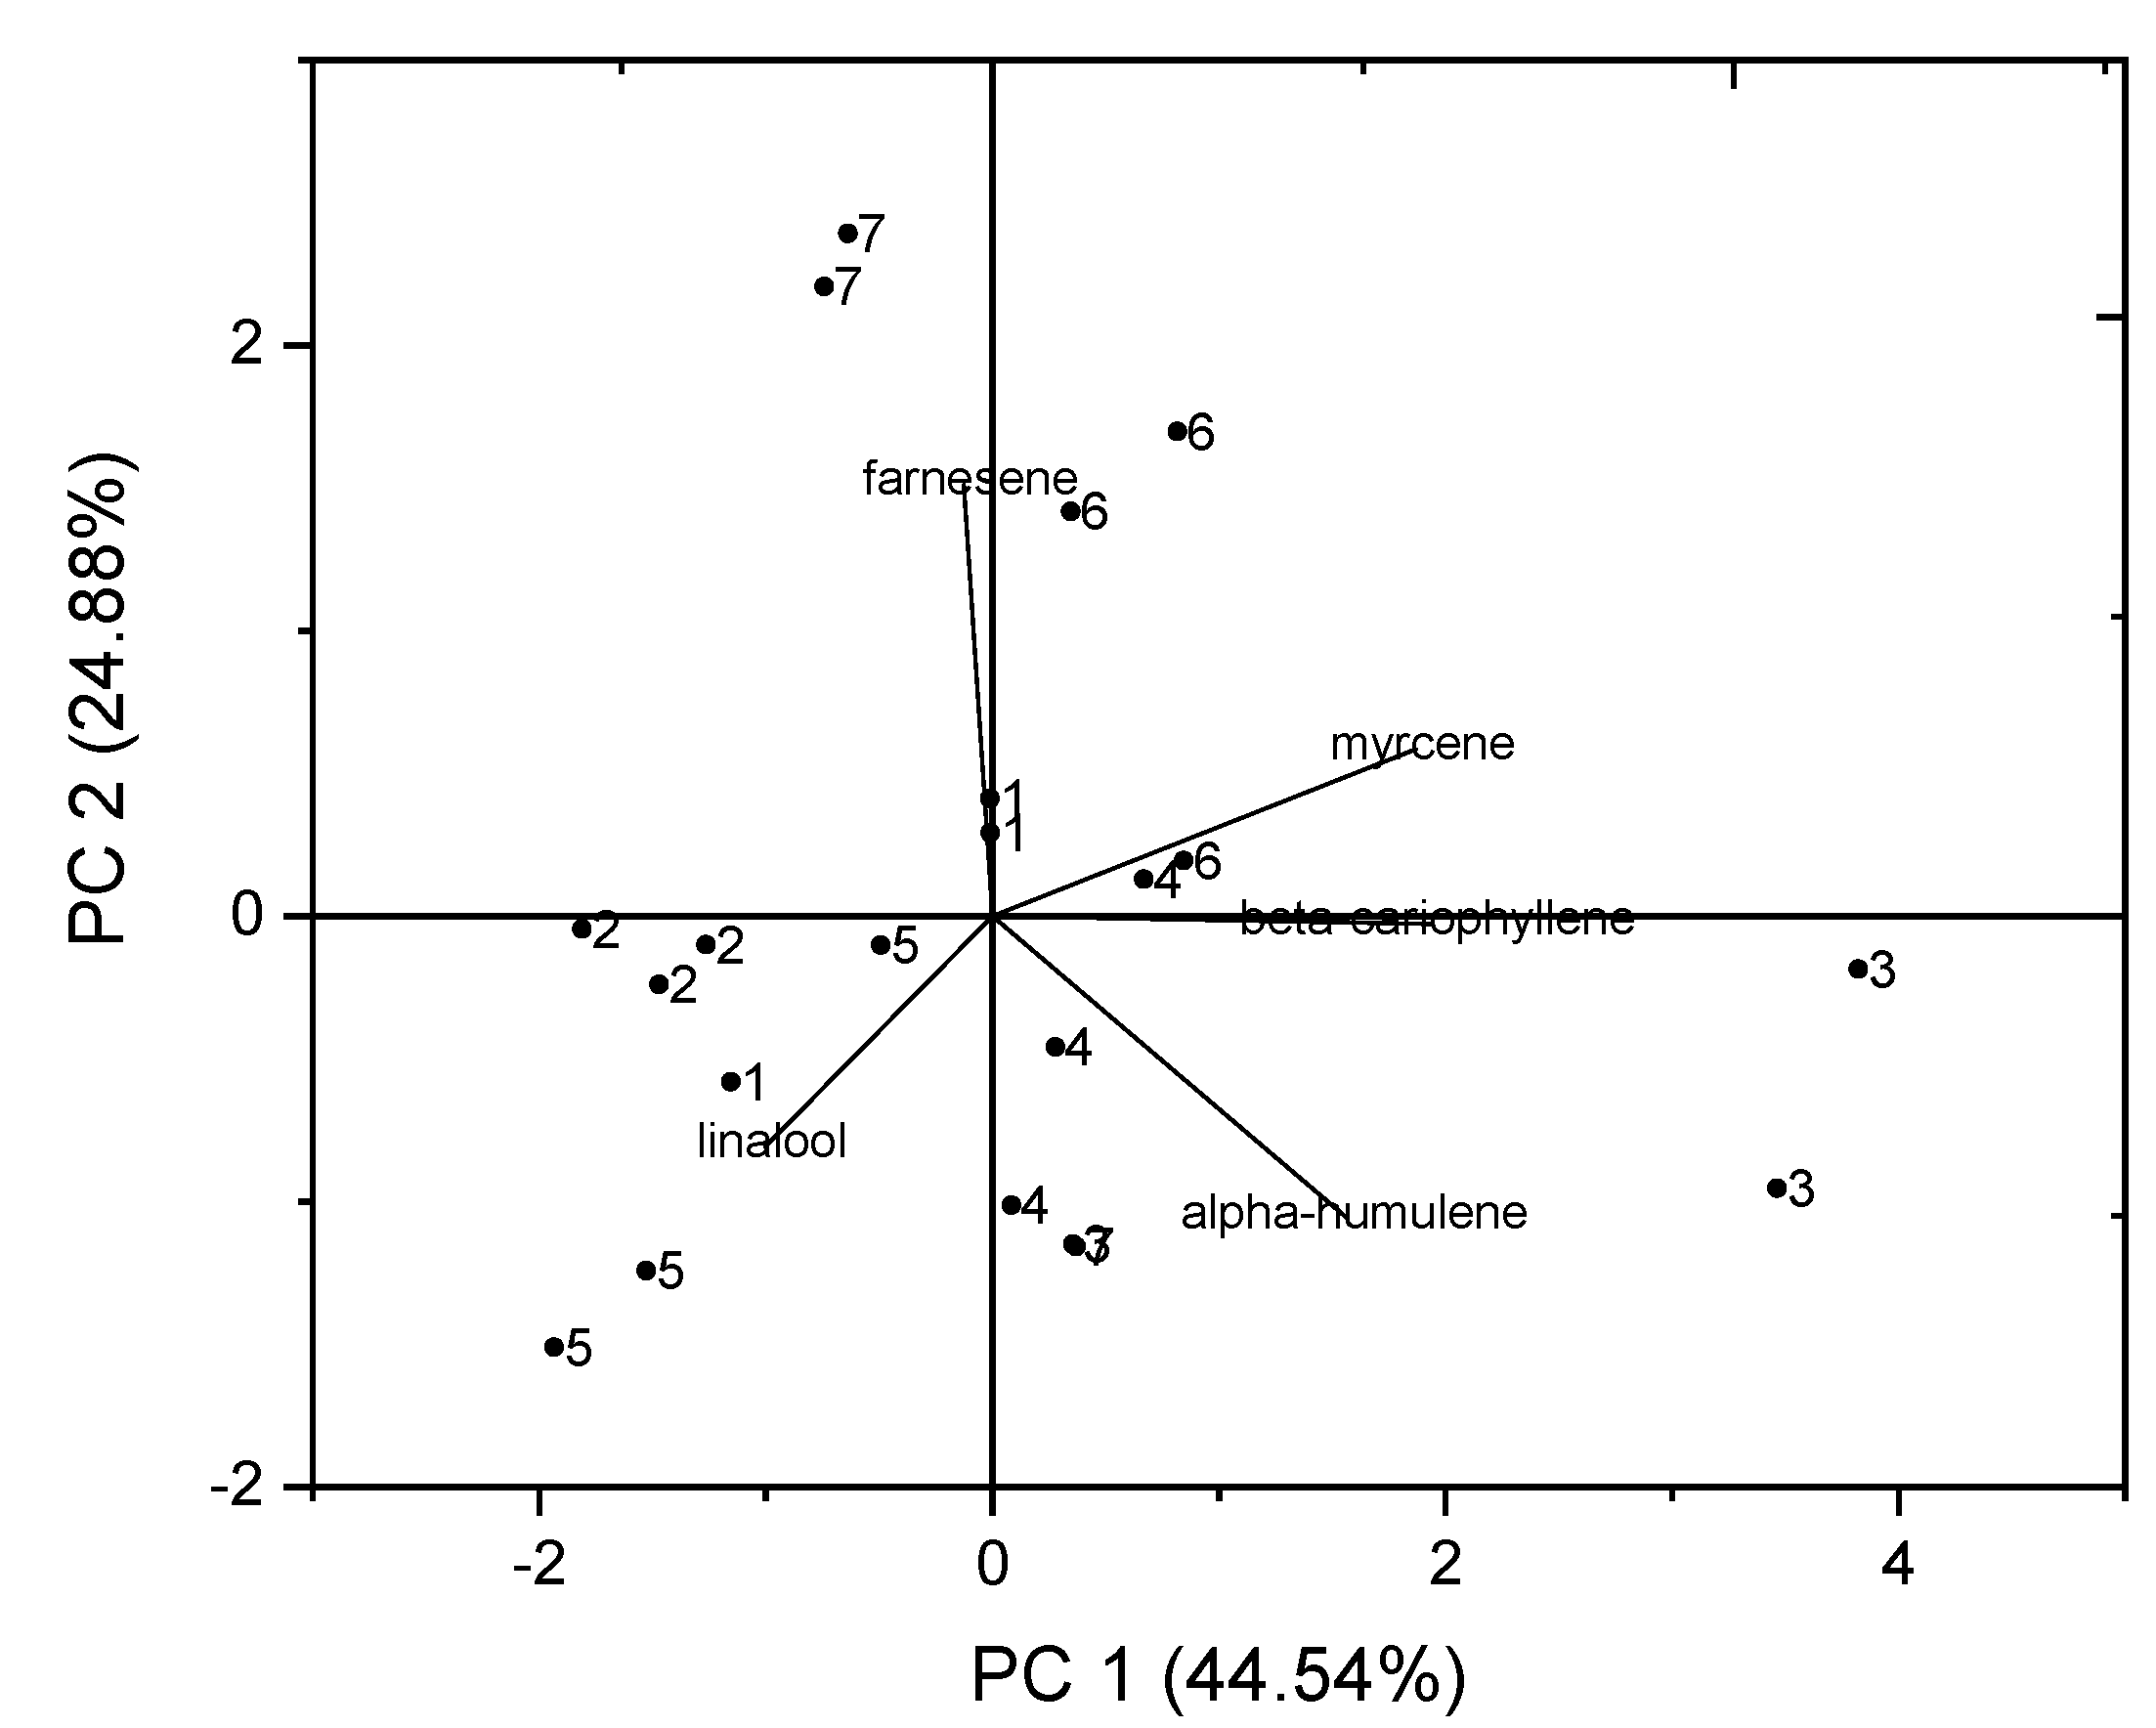
When using PCA multivariant statistical method in the plane of calculated PC1 and PC2, clear separation/grouping of samples show seven distinctive groups containing samples of the same population group. Additionally, all seven groups were clearly separated without any overlapping (Figure 5, Table 8 and Table 9). It could be concluded that samples belong to seven genetically different populations which has consequently led to the distinguishable composition of major hop resins that were analyzed. On the other hand it could be seen that samples belonging to the same group were very similar, since there were also no outliers recorded. Tukey’s comparison of pairs and calculated PC’s coefficients show that the most discriminant power have ratios Co-alpha-acids, Co-beta-acids and ratio alpha/beta-acids. However, essential oil composition did not show such a powerful discrimination/grouping of samples. There was also a grouping of samples from populations DKH5, DKH6, and DKH10 in this case. In the case of other populations, it seems that their oil composition is not as constant and that the composition is not as different between populations, thus overlapping of groups is present.
Based on analysis of hop resins, six populations out of seven had acceptable content of alpha-acids as a main parameter for beer bitterness, especially DKH11 which reached 5.9 % of alpha-acids—high for wild hops. These low values of alpha acids are also in line with other available studies. For example, in a study where wild hops from different locations around the globe were analyzed, an average value of alpha-acids was found to be 2.71% [30]. In Italian wild hops, the obtained content of alpha-acids was on average 3.82% and around 3% in dry matter [24,31]. On the other hand, some Norwegian and Danish hop genotypes reached up to 7.2% of total alpha-acid content [26], which could be the consequence of lower summer temperatures in Northern Europe comparing to our investigated region, and could positively effect the biosynthesis of hop resins [32]. The alpha/beta acid ratios were higher than 1.0 in all populations except in DKH9 and DKH6, which is in contradiction to the Patzak et al. [14] results. They discovered that obtained ratios in their research for European wild hops were typically below 1.0. However, our results are in the same range as aforementioned research regarding the low content of cohumulone. It is also interesting that the six hop populations studied had quite low content of cohumulone (co-alpha-acid) from 11.1–19.9%, with the exception of DKH11 where this parameter reached 28.8%, giving the indication that these hop populations are part of European germplasm [30,33]. Content of co-humulone is supposed to give unpleasant bitterness to the beer therefore the lower values are more acceptable in breeding selections.
In the presented study, the content of essential oil was determined to be between 0.2–0.4 mL 100 g−1, which corresponds to the results obtained in wild hops from Central Italy [31]. DKH6 population showed quite a European aroma profile with high content of alpha-humulene and beta-caryophyllene. An outstanding content of farnesene was determined in DKH11 population which could link this population to Czech (Saaz) hop cultivars [34]. Furthermore, there are rare cultivars with higher content of farnesene worldwide. Relating to the myrcene content, five populations (DKH3, DKH5, DKH8, DKH9, DKH11) have a very low percentage of it, which is rarely observed between registered hop cultivars, but similar results were obtained in Czech [14] and Italian groups [31,35]. Linalool content of the investigated populations is not outstanding in any way and is in the range of commercial hop cultivars. It is interesting that relative concentration of alpha- and beta-selinene is high in all populations in the range of 5.2 to 9.7 rel.% in the case of alpha-selinene and 6.6 to 9.3 in the case of beta-selinene. At the same time, a higher content of alpha-selinene has been described as potentially linked to resistance to powdery mildew Podosphaera macularis (Wallr.) U. Braun & S. Takam [36]. DKH9 population is the only exception, where both selinenes are present at four times lower range (3.1 and 2.4 rel.% of alpha-and beta-selinene) (Table 10). The concentration of beta-selinene in DKH5 population is similar with only 2.2 rel.%.
To follow up, taking into consideration the data gathered from morphological and biochemical analysis done on seven different hop populations, the most valuable for hop breeding could be the population labeled DKH6, since it has average hop cone parameters with pleasant European hoppy aroma and bitterness known for noble hop aroma cultivars. The presented results are the first indication that in the region of Bosnia and Hercegovina, collecting wild hops could be valuable for obtaining genetic base for hop breeding programs.

5. Conclusions

For the first time, the morphological and chemical analyses were done on collected hop cones in Bosnia and Hercegovina. The cone length of examined wild hop populations ranged from 32.02 mm to 51.68 mm. Cone density is an important agronomic trait in hop production considered as a characteristic for quality assessment from the brewing point of view. According to cone density, DKH3, DKH5, DKH8, and DKH9 are populations that had relatively larger number of nodes per cone spindle, and population DKH3 stands out in particular, because in both experimental years it had the highest value. Seed formation in cones is not a desirable trait, but only in the case of commercial cultivars. In breeding activities that involve crossing, the formation of a large number of seeds is a very desirable feature. In this case the more favorable feature would be the higher number of seeds observed in the DKH8 and DKH9 populations. Bitterness is one of the key traits used to assess the sensory quality of beer. In this sense, the DKH11 population reached 5.9% of alpha-acids which is high for wild hops. However, considering the morphological and biochemical analysis, DKH6 hop population is singled out as the most valuable for hop breeding. Based on the obtained chemical results we can conclude that wild hops from Northern part of Bosnia and Hercegovina are part of European hop germplasm.

Author Contributions

D.K. designed the experiments. T.K. performed measurements of morphological parameters on plant material. D.K., M.O., A.Č., I.J.K. and G.Đ. performed biochemical analyses and analyzed the data and constructively discussed the obtained results and conclusions during the writing of this manuscript. All authors have read and agreed to the published version of the manuscript.

Funding

The financial support for this study was provided by the Ministry of Scientific and Technological Development, Higher Education and Information Society of the Republic of Srpska, the Ministry of Civil Affairs of Bosnia and Herzegovina and Slovenian Research Agency.

Institutional Review Board Statement

Not applicable.

Informed Consent Statement

Not applicable.

Data Availability Statement

Not applicable.

Acknowledgments

We are thankful to the Institute of Genetic Resources, University of Banja Luka, for their support during the study.

Conflicts of Interest

The authors declare no conflict of interest.

References

  1. Miller, R.H. Morphology of Humulus lupulus. I. developmental anatomy of the primary root. Am. J. Bot. 1958, 5, 418–431. [Google Scholar] [CrossRef]
  2. Biancardi, E.; Wagner, T. Il luppolo da birra in Italia. Ann. dell’Istituto Sper. Colt. Ind. 1989, 21, 1–59. (In Italian) [Google Scholar]
  3. Barth, H.J.; Klinke, C.; Schmidt, C. Der Grosse Hopfenatlas Geschichte und Geographie Einer Kulturpflanze; Carl, Getranke-Fachverl: Nurnberg, Germany, 1994; ISBN 3-418-00744-9. [Google Scholar]
  4. Nagel, J.; Culley, L.K.; Lu, Y.; Liu, E.; Matthews, P.D.; Stevens, J.F.; Page, J.E. EST analysis of hop glandular trichomes identifies an O-methyltransferase that catalyzes the biosynthesis of xanthohumol. Plant. Cell 2008, 20, 186–200. [Google Scholar] [CrossRef] [PubMed] [Green Version]
  5. Shephard, H.L.; Parker, J.S.; Darby, P.; Ainsworth, C.C. Sexual development and sex chromosomes in hop. Res. New Phytol. 2000, 148, 397–411. [Google Scholar] [CrossRef]
  6. Okada, Y.; Ito, K. Cloning and analysis of valerophenone synthase gene expressed specifically in lupulin gland of hop (Humulus lupulus L.). Biosci. Biotechnol. Biochem. 2001, 65, 150–155. [Google Scholar] [CrossRef] [PubMed]
  7. Malowicki, M.G.; Shellhammer, T.H. Isomerization and degradation kinetics of hop (Humulus lupulus) acids in a model wort-boiling system. J. Agric. Food Chem. 2005, 53, 4434–4439. [Google Scholar] [CrossRef]
  8. Ocvirk, M.; Košir, I.J. Dynamics of isomerization of hop alpha-acids and transition of hop essential oil components in beer. Acta Chim. Slov. 2020, 673, 720–728. [Google Scholar] [CrossRef]
  9. Gonçalves, J.; Figueira, J.; Rodrigues, F.; Câmara, J.S. Headspace solid-phase microextraction combined with mass spectrometry as a powerful analytical tool for profiling the terpenoid metabolomic pattern of hop-essential oil derived from Saaz variety. J. Sep. Sci. 2012, 35, 2282–2296. [Google Scholar] [CrossRef] [Green Version]
  10. Pistelli, L.; Ferri, B.; Cioni, P.L.; Koziara, M.; Agacka, M.; Skomra, U. Aroma profile and bitter acid characterization of hop cones (Humulus lupulus L.) of five healthy and infected Polish cultivars. Ind. Crop. Prod. 2018, 124, 653–662. [Google Scholar] [CrossRef]
  11. Rettberg, N.; Biendl, M.; Garbe, L.A. Hop Aroma and Hoppy Beer Flavor: Chemical backgrounds and analytical tools—A Review. J. Am. Soc. Brew. Chem. Sci. Beer 2018, 76, 1–20. [Google Scholar] [CrossRef]
  12. Štajner, N.; Šatović, Z.; Čerenak, A.; Javornik, B. Genetic structure and differentiation in hop (Humulus lupulus L.) as inferred from microsatellites. Euphytica 2008, 161, 301–311. [Google Scholar] [CrossRef]
  13. Peredo, E.L.; Angeles Revilla, M.; Reed, B.M.; Javornik, B.; Cires, E.; Prieto, J.A.F.; Arroyo-Garcıa, R. The influence of European and American wild germplasm in hop (Humulus lupulus L.) cultivars. Genet. Res. Crop. Evol. 2010, 57, 575–586. [Google Scholar] [CrossRef]
  14. Patzak, J.; Nesvadba, V.; Henychová, A.; Krofta, K. Assessment of the genetic diversity of wild hops (Humulus lupulus L.) in Europe using chemical and molecular analyses. Biochem. Syst. Ecol. 2010, 38, 136–145. [Google Scholar] [CrossRef]
  15. Đurić, G.; Radun, M.; Todorović, V.; Kondić, D.; Pećanac, D.; Cvetković, T.J.; Mandić, D.; Pašalić, N.; Radić, V. Implementation of the Programme for Conservation of Plant Genetic Resources in the Republic of Srpska from 2009 to 2012. Agro-Knowl. J. 2012, 13, 563–571. [Google Scholar] [CrossRef] [Green Version]
  16. European Brewery Convention. Analytica-EBC, Section 7—Hops, Method 7.7 α- and β-Acids in Hops and Hop Products by HPLC; Fachverlag Hans Carl: Nürnberg, Germany, 2005. [Google Scholar]
  17. European Brewery Convention. Analytica-EBC, Section 7—Hops, Method 7.10 Hop Oil Content of Hops and Hop Products; Fachverlag Hans Carl: Nürnberg, Germany, 2002. [Google Scholar]
  18. European Brewery Convention. Analytica-EBC, Section 7—Hops, Method 7.12 Hop Essential Oils by Capillary Gas Chromatography Flame Ionization Detection; Fachverlag Hans Carl: Nürnberg, Germany, 2006. [Google Scholar]
  19. International Union for the Protection of New Varieties of Plants, HOP UPOV Code: HUMUL_LUP Humulus lupulus L. Guidelines for the Conduct of Tests for Distinctness, Uniformity and Stability, TG/227/1; International Union for the Protection of New Varieties of Plants (UPOV): Geneva, Switzerland, 2006; p. 14.
  20. Duke, J.A. Ecosystematic data on economic plants. Quart. J. Crude Drug Res. 1979, 17, 91–110. [Google Scholar] [CrossRef]
  21. Eriksen, R.L.; Rutto, L.K.; Dombrowski, J.E.; Henning, J.A. Photosynthetic Activity of Six Hop (Humulus lupulus L.) Cultivars under Different Temperature Treatments. HortScience 2020, 55, 403–409. [Google Scholar] [CrossRef] [Green Version]
  22. Biendl, M.; Engelhard, B.; Forster, A.; Gahr, A.; Lutz, A.; Mitter, W.; Schmidt, R.; Schonberger, C. Hops. Their Cultivation, Composition and Usage; Fachverlag Hans Carl GmbH: Nuremberg, Germany, 2014; ISBN 9783418008233. [Google Scholar]
  23. McAdam, E.L.; Vaillancourt, R.E.; Koutoulis, A.; Whittock, S.P. Quantitative genetic parameters for yield, plant growth and cone chemical traits in hop (Humulus lupulus L.). BMC Genet. 2014, 15, 22. [Google Scholar] [CrossRef]
  24. Mongelli, A.; Rodolfi, M.; Ganino, T.; Marieschi, M.; Dall’Asta, C.; Bruni, R. Italian hop germplasm: Characterization of wild Humulus lupulus L. genotypes from Northern Italy by means of phytochemical, morphological traits and multivariate data analysis. Ind. Crop. Prod. 2015, 70, 16–27. [Google Scholar] [CrossRef]
  25. Olsovska, J.; Bostikova, V.; Dusek, M.; Jandovska, V.; Bogdanova, K.; Cermak, P.; Bostik, P.; Mikyska, A.; Kolar, M. Humulus lupulus l. (hops)—A valuable source of compounds with bioactive effects for future therapies. Mil. Med. Sci. Lett. 2016, 85, 19–30. [Google Scholar] [CrossRef] [Green Version]
  26. Solberg, S.Ø.; Brantestam, A.K.; Kylin, M.; Bjørn, G.K. Genetic variation in Danish and Norwegian germplasm collections of hops. Biochem. Syst. Ecol. 2014, 52, 53–59. [Google Scholar] [CrossRef]
  27. Thomas, G.G.; Neve, R.A. Studies on the effect of pollination on the yield and resin content of hops (Humulus lupulus). J. Inst. Brew. 1976, 82, 41–45. [Google Scholar] [CrossRef]
  28. Čerenak, A.; Kolenc, Z.; Sehur, P.; Whittock, S.P.; Koutoulis, A.; Beatson, R.; Buck, E.; Javornik, B.; Škof, S.; Jakše, J. New Male Specific Markers for Hop and Application in Breeding Program. Sci. Rep. 2019, 9, 14223. [Google Scholar] [CrossRef] [PubMed]
  29. Beatson, R.A.; Ansell, K.A.; Graham, L.T. Breeding, development, and characteristics of the hop (Humulus lupulus) cultivar ‘Nelson Sauvin’. N. Z. J. Crop. Hortic. Sci. 2003, 31, 303–309. [Google Scholar] [CrossRef] [Green Version]
  30. Patzak, J.; Nesvadba, V.; Krofta, K.; Henychová, A.; Inalovic Marzoev, A.; Richards, K. Evaluation of genetic variability of wild hops (Humulus lupulus L.) in Canada and the Caucasus region by chemical and molecular methods. Genome 2010, 53, 545–557. [Google Scholar] [CrossRef] [PubMed]
  31. Riccioni, C.; Belfiori, B.; Sileoni, V.; Marconi, O.; Perretti, G.; Bellucci, M.; Rubini, A. High genetic and chemical diversity of wild hop populations from Central Italy with signals of a genetic structure influenced by both sexual and asexual reproduction. Plant Sci. 2020, 110794. [Google Scholar] [CrossRef]
  32. Srečec, S.; Čeh, B.; Ciler, T.S.; Rus, A.F. Empiric mathematical model for predicting the content of alpha-acids in hop (Humulus lupulus L.) cv. Aurora. SpringerPlus 2013, 2, 59–67. [Google Scholar]
  33. Krofta, K. Comparison of quality parameters of Czech and foreign hop varieties. Plant Soil Environ. 2003, 49, 261–268. [Google Scholar] [CrossRef] [Green Version]
  34. Neve, R.A. Hops; Chapman and Hall: London, UK, 1991; ISBN 978-94-010-5375-4. [Google Scholar]
  35. Mongelli, A.; Rodolfi, M.; Ganino, T.; Marieschi, M.; Caligiani, A.; Dall’Asta, C.; Bruni, R. Are Humulus lupulus L. ecotypes and cultivars suitable for the cultivation of aromatic hop in Italy? A phytochemical approach. Ind. Crop. Prod. 2016, 83, 693–700. [Google Scholar] [CrossRef]
  36. Čerenak, A.; Kralj, D.; Javornik, B. Compounds of essential oils as markers of hop resistance (Humulus lupulus) to powdery mildew (Podosphaera macularis). Acta Agric. Slov. 2009, 93, 267–273. [Google Scholar] [CrossRef] [Green Version]
Figure 1. Cluster analysis based on average cone length of examined hop populations.
Agronomy 11 00239 g001
Figure 2. Cluster analysis based on average number of nodes per cone spindle of examined hop populations.
Agronomy 11 00239 g002
Figure 3. Cluster analysis based on average cone density of examined hop populations.
Agronomy 11 00239 g003
Figure 4. Cluster analysis based on average number of seeds per cone of examined hop.
Agronomy 11 00239 g004
Figure 5. Projection of 21 hop samples belonging to 7 different groups, represented by 6 variables (content of hop resins) onto a plot defined by the PC1 (53.68%) and PC2 (33.75%) together with loadings plot for variables. Numbers correspond as follows; 1 = DKH3, 2 = DKH5, 3 = DKH6, 4 = DKH8, 5 = DKH9, 6 = DKH10, 7 = DKH11.
Agronomy 11 00239 g005

Hop ResinsHop Populations
DKH3DKH5DKH6DKH8DKH9DKH10DKH11
Alpha-acid4.4 ± 1.8 a,b3.4 ± 0.7 b,c3.5 ± 0.8 a,b,c3.4 ± 0.3 a,b,c1.4 ± 0.3 c4.6 ± 0.6 a,b5.9 ± 0.7 a
Beta-acid1.8 ± 0.9 c1.4 ± 0.3 c3.5 ± 0.6 a,b2.0 ± 0.2 c1.5 ± 0.4 c2.4 ± 0.4 b,c4.8 ± 0.4 a
Co-alpha-acid11.1 ± 0.3 e15.2 ± 0.1 d19.3 ± 2.3 b,c15.4 ± 1.2 d16.1 ± 0.3 c,d19.9 ± 1.1 b28.8 ± 1.2 a
Co-beta-acid41.2 ± 2.6 d50.1 ± 1.4 b,c55.0 ± 2.1 a,b49.0 ± 1.8 c60.4 ± 1.6 a52.5 ± 3.3 b,c47.2 ± 0.8 c
Alpha-/beta-acid2.4 ± 0.2 a2.4 ± 0.1 a1.0 ± 0.1 c1.7 ± 0.1 b0.9 ± 0.1 c1.9 ± 0.1 b1.2 ± 0.1 c
Xanthohumol0.10 ± 0.04 d,e0.19 ± 0.04 a,b,c0.17 ± 0.02 b,c,d0.14 ± 0.01 c,d,e0.07 ± 0.01 e0.23 ± 0.05 a,b0.25 ± 0.03 a
Different letters (a,b,c,d) in the same row indicate significant differences (p < 0.05, Tukey’s tests). Only p-values lower than 0.05 are reported.
Figure 6. Projection of 21 hop samples belonging to 7 different groups, represented by 5 variables (content of selected hop essential oil components) onto a plot defined by the PC1 (44.54%) and PC2 (24.88%) together with loadings plot for variables. Numbers correspond as follows; 1 = DKH3, 2 = DKH5, 3 = DKH6, 4 = DKH8, 5 = DKH9, 6 = DKH10, 7 = DKH11.
Agronomy 11 00239 g006
Figure 7. Schematic presentation of spindle (s), female flower (ff), bracteole (bl), and bract (b) of hop.
Agronomy 11 00239 g007
Table 1. Accession numbers and cone shape of examined hop populations.
Population CodeAccession NumbersCone Shape
1.DKH3GB 01328Narrow ovate
2.DKH5GB 01329Medium ovate
3.DKH6GB 01330Broad ovate
4.DKH8GB 01331Medium ovate
5.DKH9GB 01332Narrow ovate
6.DKH10GB 01333Medium ovate
7.DKH11GB 01334Broad ovate
Table 2. The average monthly and annual air temperatures (°C) and total monthly and annual precipitation (mm) for the area of Banja Luka.
Year/MonthIIIIIIIVVVIVIIVIIIIXXXIXIIYear Level
2018°C5.30.75.416.219.220.922.223.317.413.78.02.012.9
mm80.0146.2117.319.7136.6103.183.982.070.328.259.585.81012.6
2019°C1.35.310.012.614.123.523.424.017.713.610.45.113.4
mm84.621.143.0104.7224.7123.058.749.082.923.889.971.2976.6
Source: Republic Hydrometeorological Institute of the Republic of Srpska.
Table 3. Results of soil chemical analysis from the habitat of wild hop populations (2019).
SamplepH ReactionHumusP2O5K2O
H2OKCl(%)(mg 100 g−1)(mg 100 g−1)
DKH37.597.207.984.075.0
DKH57.477.047.35.720.2
DKH67.016.409.019.056.5
DKH87.416.944.565.029.6
DKH97.106.707.67.526.8
DKH107.356.814.817.348.2
DKH116.826.152.70.527.2
Table 4. Average cone length (mm) of examined hop populations in 2018 and 2019.
Year20182019
Population X ¯ ± S X ¯ Cv% X ¯ ± S X ¯ Cv%
DKH351.68 ± 1.70823.3748.26 ± 1.64523.96
DKH543.54 ± 1.19219.3643.08 ± 1.72928.38
DKH639.97 ± 0.91916.2536.89 ± 1.10121.10
DKH841.62 ± 0.87514.8640.40 ± 1.09819.21
DKH948.74 ± 1.55022.4947.45 ± 1.57623.49
DKH1033.87 ± 0.67314.0435.84 ± 0.67813.38
DKH1132.02 ± 0.52611.6133.23 ± 0.69114.07
Analysis of Variance: FAexp = 57.199 **; FBexp = 1.763 ns; FABexp =1.298 ns; Lsd0.05 = 3.364; Lsd0.01 = 8.664. Cv: Coefficient of variation. **: significant at p < 0.01; ns: not significant
Table 5. Difference in the number of nodes per cone spindle of hop populations in 2018 and 2019.
Year20182019
Population X ¯ ± S X ¯ Cv% X ¯ ± S X ¯ Cv%
DKH311.18 ± 0.43727.6210.94 ± 0.35723.09
DKH59.02 ± 0.35027.478.96 ± 0.38130.08
DKH67.60 ± 0.20218.797.62 ± 0.24819.93
DKH88.82 ± 0.24819.938.12 ± 0.27924.33
DKH99.94 ± 0.30421.649.88 ± 0.36726.23
DKH106.82 ± 0.16817.457.18 ± 0.16115.84
DKH116.38 ± 0.13715.156.42 ± 0.14616.07
Analysis of Variance: FAexp = 67.683 **; FBexp = 0.366 ns; FABexp = 0.654 ns Lsd0.05 = 0.784; Lsd0.01 = 2.019. **: significant at p < 0.01; ns: not significant.
Table 6. Average cone density of examined hop populations in 2018 and 2019.
Year20182019
Population X ¯ ± S X ¯ Cv% X ¯ ± S X ¯ Cv%
DKH32.18 ± 0.05818.862.27 ± 0.03510.79
DKH52.13 ± 0.04314.302.08 ± 0.0289.78
DKH61.90 ± 0.02710.072.10 ± 0.04615.46
DKH82.13 ± 0.05217.582.00 ± 0.03010.71
DKH92.08 ± 0.05819.972.07 ± 0.0238.03
DKH102.02 ± 0.03713.082.02 ± 0.04515.88
DKH111.99 ± 0.03612.761.97 ± 0.03713.57
Analysis of Variance: FAexp = 8.295 **; FBexp = 0.155 ns; FABexp = 3.379 **; Lsd 0.05 = 0.115; Lsd 0.01 = 0.296. **: significant at p < 0.01; ns: not significant.
Table 7. Average number of seeds per cone of examined hop populations in 2018 and 2019.
Year20182019
Population X ¯ ± S X ¯ Cv% X ¯ ± S X ¯ Cv%
DKH314.30 ± 0.90844.8816.48 ± 0.80934.70
DKH514.44 ± 0.66732.6414.28 ± 0.74136.70
DKH611.90 ± 0.45927.2813.06 ± 0.66836.16
DKH820.56 ± 0.74325.5517.88 ± 0.75429.82
DKH916.66 ± 0.81534.5718.78 ± 0.63623.94
DKH105.14 ± 0.44361.0217.72 ± 0.60224.02
DKH1113.38 ± 0.44623.5814.32 ± 0.60830.10
Analysis of Variance: FAexp =33.414 **; FBexp = 40.422 **; FABexp =25.295 **; Lsd0.05 = 1.881; Lsd0.01 = 4.844. **: significant at p < 0.01; ns: not significant.
Table 8. Mean hop resins component contents of hop populations in 2019 (%) with standard deviations together with the results of grouping of the samples.
Hop ResinsHop Populations
DKH3DKH5DKH6DKH8DKH9DKH10DKH11
Alpha-acid4.4 ± 1.8 a,b3.4 ± 0.7 b,c3.5 ± 0.8 a,b,c3.4 ± 0.3 a,b,c1.4 ± 0.3 c4.6 ± 0.6 a,b5.9 ± 0.7 a
Beta-acid1.8 ± 0.9 c1.4 ± 0.3 c3.5 ± 0.6 a,b2.0 ± 0.2 c1.5 ± 0.4 c2.4 ± 0.4 b,c4.8 ± 0.4 a
Co-alpha-acid11.1 ± 0.3 e15.2 ± 0.1 d19.3 ± 2.3 b,c15.4 ± 1.2 d16.1 ± 0.3 c,d19.9 ± 1.1 b28.8 ± 1.2 a
Co-beta-acid41.2 ± 2.6 d50.1 ± 1.4 b,c55.0 ± 2.1 a,b49.0 ± 1.8 c60.4 ± 1.6 a52.5 ± 3.3 b,c47.2 ± 0.8 c
Alpha-/beta-acid2.4 ± 0.2 a2.4 ± 0.1 a1.0 ± 0.1 c1.7 ± 0.1 b0.9 ± 0.1 c1.9 ± 0.1 b1.2 ± 0.1 c
Xanthohumol0.10 ± 0.04 d,e0.19 ± 0.04 a,b,c0.17 ± 0.02 b,c,d0.14 ± 0.01 c,d,e0.07 ± 0.01 e0.23 ± 0.05 a,b0.25 ± 0.03 a
Different letters (a,b,c,d) in the same row indicate significant differences (p < 0.05, Tukey’s tests). Only p-values lower than 0.05 are reported.
Table 9. Calculated coefficients for input parameters in PC1 and PC2.
Coefficients of PC1Coefficients of PC2
Alpha-acids0.468730.33994
Beta-acids0.5212−0.12636
Co/alpha-acids0.48611−0.25198
Co/beta-acids−0.11109−0.62278
Alpha-acids/beta-acids−0.140630.63789
Xanthohumol0.490120.10107
Table 10. Mean essential oil content of hop populations in 2019 (rel.%).
Essential Oil ComponentHop Populations
DKH3DKH5DKH6DKH8DKH9DKH10DKH11
Delta-cadinene0.61.81.51.31.21.00.7
Methyl-nonyl-keton1.01.22.01.41.01.41.5
Myrcene2.80.418.93.40.413.15.7
Methyl caprylate octanoate˂0.1˂0.10.1˂0.1˂0.1˂0.1˂0.1
Germacrene-D4.43.62.02.31.44.34.5
Beta-selinene6.92.26.68.62.48.19.3
Humulene epoxide-10.51.11.62.23.60.40.4
Linalool0.40.30.30.60.60.30.4
Iso-butyl-iso-butyrate˂0.1˂0.1˂0.1˂0.1˂0.1˂0.1˂0.1
Methyl-deca-4-dienoate0.20.20.50.40.30.10.5
Limonene˂0.1˂0.10.1˂0.1˂0.10.10.1
Humulene epoxide-22.73.12.46.02.82.43.0
Caryophyllene epoxide0.82.41.31.92.11.21.3
Alpha-humulene1.21.122.716.38.21.20.4
Geranyl acetate0.10.20.30.20.20.20.2
Methyl-deca-4-enoate0.30.20.40.50.20.10.3
Beta-caryophyllene7.02.310.67.42.25.84.7
Geraniol0.30.20.80.40.20.40.3
Alpha-selinene8.68.38.99.73.16.85.2
Farnesene3.01.00.77.70.79.621.1
Trans o-cymene˂0.1˂0.10.6˂0.1˂0.10.30.1
Bisabolene9.50.81.10.91.20.50.8
2-nonanone (methyl-heptyl-keton)0.2˂0.10.50.1˂0.10.30.4
Alpha-pinene˂0.1˂0.1˂0.1˂0.1˂0.1˂0.1˂0.1
Beta-pinene0.10.10.20.10.10.20.1
Farnezol2.04.71.63.51.71.61.6
Essential oil amount (mL 100 g−1)0.30.20.30.20.20.40.4
Table 11. Selected hop essential oils components mean values and standard deviation in hop populations in 2019 (rel.% ± standard deviation (SD) (%)) together with the results of grouping of the samples.
Essential Oil
Compound
Hop Populations
DKH3DKH5DKH6DKH8DKH9DKH10DKH11
Alpha-humulene1.2 ± 0.6 b1.1 ± 0.3 b22.7 ± 6.4 a16.3 ± 1.8 a,b8.2 ± 1.8 a,b1.2 ± 0.6 b0.4 ± 0.1 a,b
Myrcene2.8 ± 2.1 a,b0.4 ± 0.1 b18.9 ± 3.0 a3.4 ± 0.2 a,b0.4 ± 0.1 b13.1 ± 2.1 a5.7 ± 0.5 a,b
Beta-caryophyllene7.0 ± 1.2 b2.3 ± 0.3 c10.6 ± 2.4 a7.4 ± 0.3 a,b2.2 ± 1.0 c5.8 ± 0.3 b4.7 ± 0.2 b,c
Farnesene3.0 ± 1.4 a,b1.0 ± 0.6 b0.7 ± 0.2 b7.7 ± 2.0 a,b0.7 ± 0.5 b9.6 ± 0.3 ab21.1 ± 0.5 a
Linalool0.43 ± 0.18 a0.34 ± 0.16 a0.28 ± 0.16 a0.55 ± 0.33 a0.57 ± 0.48 a0.26 ± 0.03 a0.45 ± 0.03 a
Different letters (a,b,c) in the same row indicate significant differences (p < 0.05, Tukey’s tests). Only p-values lower than 0.05 are reported.
Table 12. Calculated coefficients for input parameters in PC1 and PC2.
Coefficients of PC1Coefficients of PC2
Alpha-humulene0.47894−0.50471
Myrcene0.571000.27882
Beta-caryophyllene0.59080−0.01344
Farnesene−0.038560.72023
Linalool−0.30668−0.38551
Alpha-humulene0.47894−0.50471
Publisher’s Note: MDPI stays neutral with regard to jurisdictional claims in published maps and institutional affiliations.

