
Effect of Growing Media pH on Performance of Huanglongbing-Affected Young Citrus Trees


1
Horticultural Sciences Department, Citrus Research and Education Center, 700 Experiment Station Road, Lake Alfred, FL 33850, USA
2
Soil and Water Sciences Department, Citrus Research and Education Center, 700 Experiment Station Road, Lake Alfred, FL 33850, USA
*
Author to whom correspondence should be addressed.
Agronomy 2021, 11(3), 439; https://0-doi-org.brum.beds.ac.uk/10.3390/agronomy11030439
Submission received: 13 January 2021
/
Revised: 16 February 2021
/
Accepted: 19 February 2021
/
Published: 27 February 2021
(This article belongs to the Special Issue Mineral Nutrition of Fruit Trees)
Abstract
:Since the advent of Huanglongbing (HLB) disease, Florida’s citrus production has dropped by 70%. HLB-affected trees decline rapidly under high pH growing conditions. Limited nutrient availability at high soil pH has been speculated to be the cause of such rapid decline in HLB-affected trees; however, such decline is not observed in healthy citrus trees. Therefore, the objective of this study was to understand the nutrient uptake, physiological, and molecular responses of healthy (HLY) and HLB-affected (HLB) sweet orange (Citrus sinensis (L.) Osbeck) trees when grown in media maintained at different pH levels 6.0, 7.0, or 8.0. Overall, the performance of HLY and HLB trees decreased with the increase in pH conditions. HLB trees showed a significant inverse correlation between growth parameters (leaf number, shoot growth, SPAD value, stem water potential) and growing media pH whereas no such correlation was observed for HLY trees. Interesting, superior performance of HLB trees at pH 6.0 coincided with higher accumulation of Fe, Mn, and N in whole plant body as compared to high pH treatments. In contrast, HLY tree performance was significantly better at pH 7.0 compared to other pH conditions. At pH 7.0, stress related genes were upregulated in HLB leaves as compared to HLY leaves, indicating the stress response in terms of leaf abscission, reduced growth, and natural aging process was exacerbated in HLB trees at higher pH treatments. Altogether, all the physiological and molecular observations supports an interaction between HLB trees and pH, where HLB trees at pH 6.0 perform better than at higher pH.
1. Introduction
Huanglongbing (HLB; aka citrus greening), a bacterial disease caused by Candidatus Liberibacter asiaticus (CLas) and spread by an insect vector, Asian citrus psyllid (Diaphorina citri Kuwayama), has become the biggest challenge for the Florida citrus industry [1,2]. Currently, about 90% of citrus trees in Florida are estimated to be infected with CLas, and Florida citrus production has dropped from 13.0 million tons in 2003–2004 (pre-HLB) to approximately 3.4 million tons in 2018–2019 [3]. Following the CLas infection, callose deposition, phloem plugging, starch accumulation, and chloroplast disruption occurs in the leaves [4,5]. Later in the CLas infection, visible symptoms such as blotchy mottle on the leaves, feeder root loss, nutrient deficiency, stunted growth, fruit drop, and yield decline can be observed [1,6,7].
Recent research indicates that the decline in HLB-affected trees is positively correlated to the pH of irrigation water and soil pH [8,9]. The optimum soil pH range for citrus in Florida is 6.0–6.5 [10]; therefore, any variation from the optimum range is expected to affect citrus growth. However, when HLB and healthy trees are irrigated with high pH water, the decline is more rapid and significant in HLB trees than healthy trees, suggesting there is an interaction between HLB and irrigation water pH [9]. Recently, soil in Florida citrus groves was reported as alkaline due to high bicarbonate accumulation [8] paired with irrigation water pH above 7.0 [11], indicating that prolonged irrigation with high pH water can raise the soil pH. However, why HLB-affected trees are more susceptible to high pH growing conditions than healthy trees remains unknown.
Depending on the severity of HLB, up to 70% of feeder root loss can be observed in HLB-affected trees [8]. Severely compromised feeder roots limit water [12,13] and nutrient uptake [14] resulting in tree decline. On the other hand, nutrient availability and uptake are highly dependent on soil pH. Under field conditions, factors influencing the nutrient uptake pattern are complex partly due to changing pH dynamics in citrus. Results from previous research suggest that the availability of micronutrients such as Zn, Mn, Fe, and Cu decreases with the increase in pH however, K, Ca, Mg, S, and P availability reduces at lower pH conditions [15]. Therefore, it is likely that any slight change in the growing media can have a significant impact on HLB-affected trees. Thus, our objective was to better understand the effect of different growing media pH on mineral nutrient uptake and growth of HLB and healthy trees. The experiment was setup in a 100% hydroponic system as this system offered two advantages (1) precise regulation of growing media pH; and (2) precise evaluation of nutrient uptake in HLB and healthy trees grown under different pH conditions.
2. Materials and Methods
2.1. Plant Material and Growing Conditions
Two-year-old Midsweet sweet orange (Citrus sinensis (L.) Osbeck) scion grafted on Kuharske Carrizo citrange [Citrus sinensis (L.) Osbeck × Poncirus trifoliata (L.)] rootstock potted (pot dimensions:10.2 × 10.2 × 35.6 cm) in commercial citrus growing media (mixture of peat/perlite/vermiculite at 3:1:1 by volume) were used for this study. For HLB positive, trees were bud-grafted with CLas positive buds and healthy (HLY) trees were mock-inoculated with healthy buds. Both sets of trees were kept in greenhouse for infection development under natural day light conditions. The temperature and relative humidity of the greenhouse fluctuated between 23 °C to 27 °C and 60% to 80%, respectively. Three months after inoculation, trees were confirmed for CLas infection by quantitative real time PCR (qRT-PCR) [16]. Once the trees were confirmed for CLas, both HLY and HLB trees were withheld from fertilizer application for 6 months in order to create nutrient limited conditions. After 6 months, HLY and HLB trees were transferred to a 100% hydroponic system (in deionized water) equipped with continuously running air pumps to keep system aerated. The buckets used for hydroponic setup were black, 5 L volume with lids; the lids of the buckets were cut out to fit the trees and the trees were suspended in the buckets with the help of a trellis. Trees were given 1 week for acclimatization to hydroponic system before execution of the experiment. After 1 week, Hoagland (fertilizer) solution was added to both HLY and HLB trees. Hoagland solution was prepared by mixing the reagents as follows: (Group A (macronutrients): 5 mM Ca(NO3)2.4H2O, 5 mM KNO3, 2 mM MgSO4.7H2O and 1 mM KH2PO4; Group B (micronutrients): 46 µm H3BO3, 9 µm MnCl2.4H2O, 0.8 µm ZnSO4.7H2O, 0.4 µm CuSO4.7H2O, 0.02 µm (NH4)6MoO4.4H2O, 0.02 µm FeSO4.7H2O and 0.02 µm EDTA-Na2). Group A and B solutions were diluted 1:100 and 1:1000 (v:v) respectively, in the deionized water and the solution pH was 4.96. Growing media pH treatments were 6.0, 7.0, and 8.0; and disease had two levels: HLY and HLB trees. The experiment was a complete factorial design, where growing media pH and disease were the two factors. The pH of the hydroponic solution was measured and adjusted (in situ) to respective pH every other day using 5M HCl or 1M KOH solutions. The water level was maintained at 3.5 L mark in the bucket throughout the experiment (measured every 7 days). Trees were setup in a completely randomized block design (n = 4). This point onwards treatment combinations will be referred in the form of ‘pH range-tree health status (HLY or HLB)’, e.g., HLB trees in hydroponic solution at pH 6.0 will be expressed as pH 6.0-HLB trees. All the six treatments were evaluated during the course of 5 weeks (35 days), the day of Hoagland solution addition was considered as Day (D) 0 of the experiment. This experiment was executed for 35 days to minimize undesirable effects of a 100% hydroponic system on the performance of feeder roots. To capture of effect of pH on growth and nutrient uptake in the trees, both HLY and HLB trees were nutrient-deprived for 6 months prior to the start of experiment. HLB trees are known to be low or deficient in many nutrients as compared to healthy trees [14]; therefore, evaluating the effect of pH on nutrient uptake in nutrient-deficient trees (HLB) to a healthy tree was not ideal. Hence, an effort was made to acclimatize the trees to the same nutrient condition before starting the experiment.
2.2. Tree Growth
Tree shoot growth, number of leaves, trunk diameter, and SPAD value were measured on D 0, 7, 14, 28, and 35 in order to monitor the growth over time. A metric ruler was used to measure the shoot growth and tree height, graft union was considered as the base of tree for measuring the height. Number of leaves were counted manually at each time point. A Vernier caliper was used to measure the trunk diameter just 1 cm above the graft union. The shoot growth, number of leaves, and trunk diameter at each time point are expressed as percentage increase or decrease in each parameter from time of start of experiment. SPAD value was measured on five leaves of same age using the MC—100 chlorophyll concentration meter (Apogee Instruments, Inc., Logan, UT, USA) as the indicator of total leaf chlorophyll content. Fresh and dry weight (g) of leaves, shoot and root were measured at the end of the experiment. Fresh weight was measured immediately after the breakdown of the experiment and dry weight was measured after dehydrating the samples at 68 °C for approximately 72 h in a convection oven (Thermo Fisher Scientific, Waltham, MA, USA).
2.3. Midday Stem Water Potential
Midday stem water potential (SWP) was measured on D 0, 14, and 28 of the experiment using a portable plant water status console (Model 3115; Soil moisture Equipment Crop, Santa Barbara, CA, USA) using the method described [17]. Briefly, one leaf per replicate was randomly selected and covered for 2 h with a thin film of aluminum foil to allow the water potential of the leaf and stem to equilibrate. After 2 h, a sharp razor blade was used to cut the leaf petiole close to stem and immediately after the cut the leaf was placed into the pressure chamber to minimize any physical or biological changes. Then, compressed nitrogen gas was used to pressurize the chamber at 1 MPa/30 s until the discharge of water from the petiole was visible and the required pressure was recorded in MPa.
2.4. Physical, Chemical, and Nutrient Profile of Hydroponic Solution and Trees
A digital Orion Star A215 pH/conductivity meter (Thermo Fisher Scientific, Waltham, MA, USA) was used to measure the pH and electrical conductivity (µS/cm) of the hydroponic solution. pH of the hydroponic solution was monitored and maintained on alternate days, and EC was measured on D 0, 7, 14, 28, and 35 of the experiment.
Twenty (20-) mL of hydroponic solution was collected to evaluate the mineral nutrient concentration in response to treatments on D 0 and 14. For nutrient analysis, leaves were collected at the start (D 0) and the end of the experiment (D 35), and the shoots and roots were collected on D 35. Collected tissues were washed using 1% (v/v) Liqui-Nox anionic detergent (AlcoNox Inc., White Plains, NY, USA) followed by rinsing with deionized water, drying at 68 °C for 48 h, and then milled using a grinder (Fex IKA A11; IKA-Werke, Staufen, Germany). The ground leaves, shoots, roots, and hydroponic solution were sent to a commercial testing laboratory (Waters Agricultural Laboratories, Camilla, GA, USA) to perform standard nutrient analysis.
2.5. Feeder Root Characteristics
At the end of the experiment, feeder roots from HLY and HLB trees were collected using a fine pair of sharp scissors. The collected feeder roots were scanned at 2400 DPI using Epson Perfection V37 flatbed scanner (Epson America, Inc., Long Beach, CA, USA) using dark blue background, and the images were saved as TIFF file. The photographs were analyzed using WinRhizo Pro (Regent Instrument Inc., Quebec City, QC Canada). Color classes were set as follows: white to light brown color for new feeder roots, and brown to dark brown color for the older feeder roots. Different variables such as length, diameter, volume, and surface area of HLY and HLB roots were studied based on the pixels of each color using WinRhizo (version 2012b; Regent Instruments).
2.6. RNA Extraction and Gene Expression Analysis
Fully expanded, mature leaves (same age) were collected on D 0, 14, and 28 of the experiment. Immediately after the collection, leaves were flash-frozen in liquid nitrogen and stored at −80 °C until further analysis. Total RNA was isolated using Qiagen RNeasy Mini Plant RNA Extraction kit (Qiagen Inc., Valencia, CA, USA). The quantity and quality of extracted RNA was evaluated using a spectrophotometer (Epoch 2 Microplate; BioTek Instruments, Winooski, VT, USA) and denaturing formaldehyde 1.2% agarose gels [18], respectively.
The relative expression of nine genes relating to hormones, ROS scavenging enzymes, senescence, and nutrients were determined using quantitative real-time PCR (qPCR). The selected genes were senescence associated gene 13 (SAG13), 2-oxoglutarate and Fe dependent oxygenase superfamily protein (OG-Fe), ethylene response factor 1 (ERF1), jasmonic methyl transferase (JMT), calmodulin 8 (CAM8), auxin response factor 8 (ARF8), ethylene responsive element binding factor 5 (ERF5), dormancy/auxin associated family protein (DRM2), and copine family (BON). Gene-specific primers were designed using Primer Blast (National Center for Biotechnology Information [NCBI]; https://0-www-ncbi-nlm-nih-gov.brum.beds.ac.uk/tools/primer-blast and Integrated DNA technologies (IDT; https://www.idtdna.com). The list of genes, GeneBank accession number, and primer sequence used are presented in Supplementary Table S1.
For cDNA synthesis, 1 µg of total RNA was first treated with the RQ1 RNase-Free DNase (Promega, Madison, WI, USA), and used in first strand synthesis using Oligo (dT)15 Primer, dNTP mix, and ImProm-IITM Reverse Transcriptase (Promega) in a 20- µL reaction according to the manufacture’s protocol. A 7500 Fast real-time PCR-system (Applied Biosystems, Foster City, CA, USA) was used to carry out all qPCR reactions. A 10- µL reaction system contained 10 ng of RNA, 300 nM forward and reverse primers, and PowerUPTMSYBRTMGreen Master mix (2X) (Applied Biosystems). Each reaction was run at 50 °C for 2 min and 95 °C for 2 min followed by 40 cycles of 95 °C for 3 s and 60 °C for 30 s. Dissociation-curve analysis ranging from 60 to 95 °C was run at the end of each qPCR run to confirm that nonspecific products were not formed. Using quantification cycle (Ct), the relative expression (fold change) levels of genes for interest were calculated using Pfaffl method as described in [14] with Actin (ACT) and DIM1 homolog /YLS8 (DIM1) as the reference genes [19,20]. Gene expression analysis for each sampling data were the mean of three biological replicates.
2.7. Statistical Analysis
All the data was analyzed in Sigma Plot version 12 (Systat Software version 13, San Jose, CA, USA). To determine the effect of nutrient starvation on HLY and HLB trees (as baseline), Student t test was performed for the leaf mineral nutrient concentration and gene expression analysis on D 0. Two-way ANOVA was used for all other variables including plant growth, SWP, hydroponic solution EC and nutrient concentration, nutrient analysis of leaf, and the whole tree status for nutrient concentration, feeder root characteristics, and gene expression on D 14 and 28. When ANOVA results indicated statistically differences, means were separated by multiple comparison procedures using Tukey’s honestly significant difference procedure (HSD) at α ≤ 0.1. Pearson’s correlation test was used to assess correlations between pH treatments and plant physio-chemical attributes.
3. Results
3.1. Plant Growth
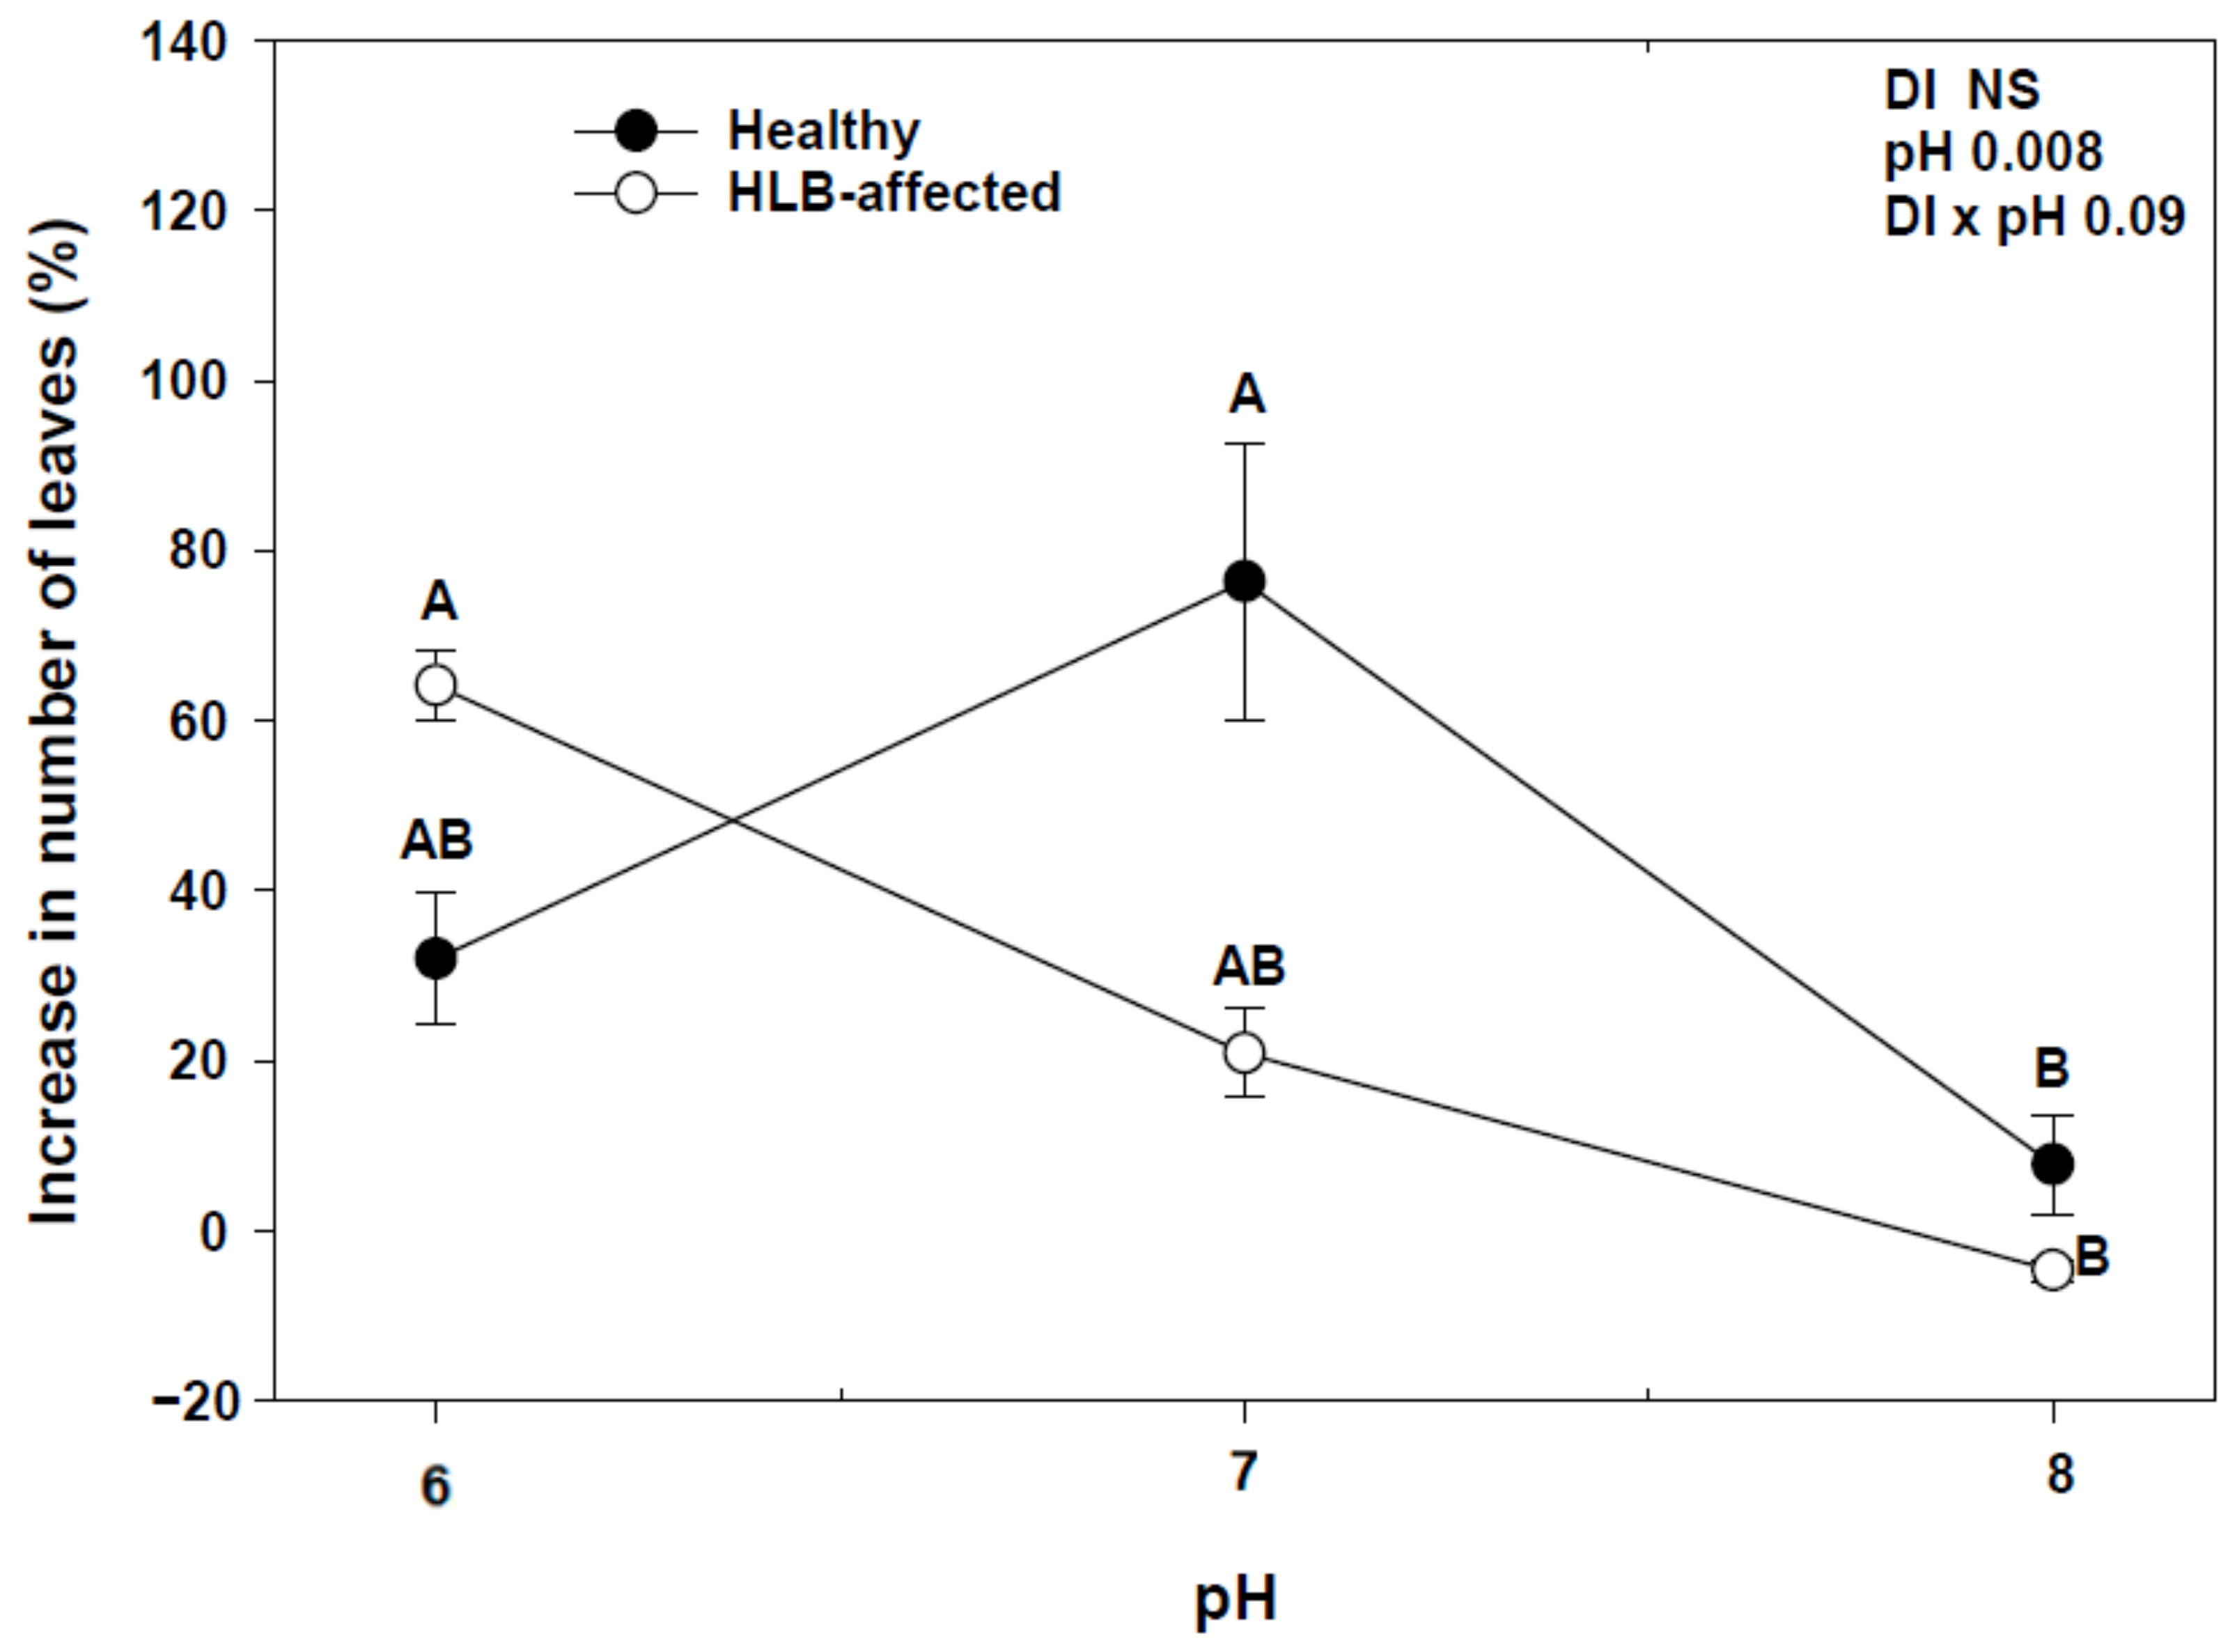
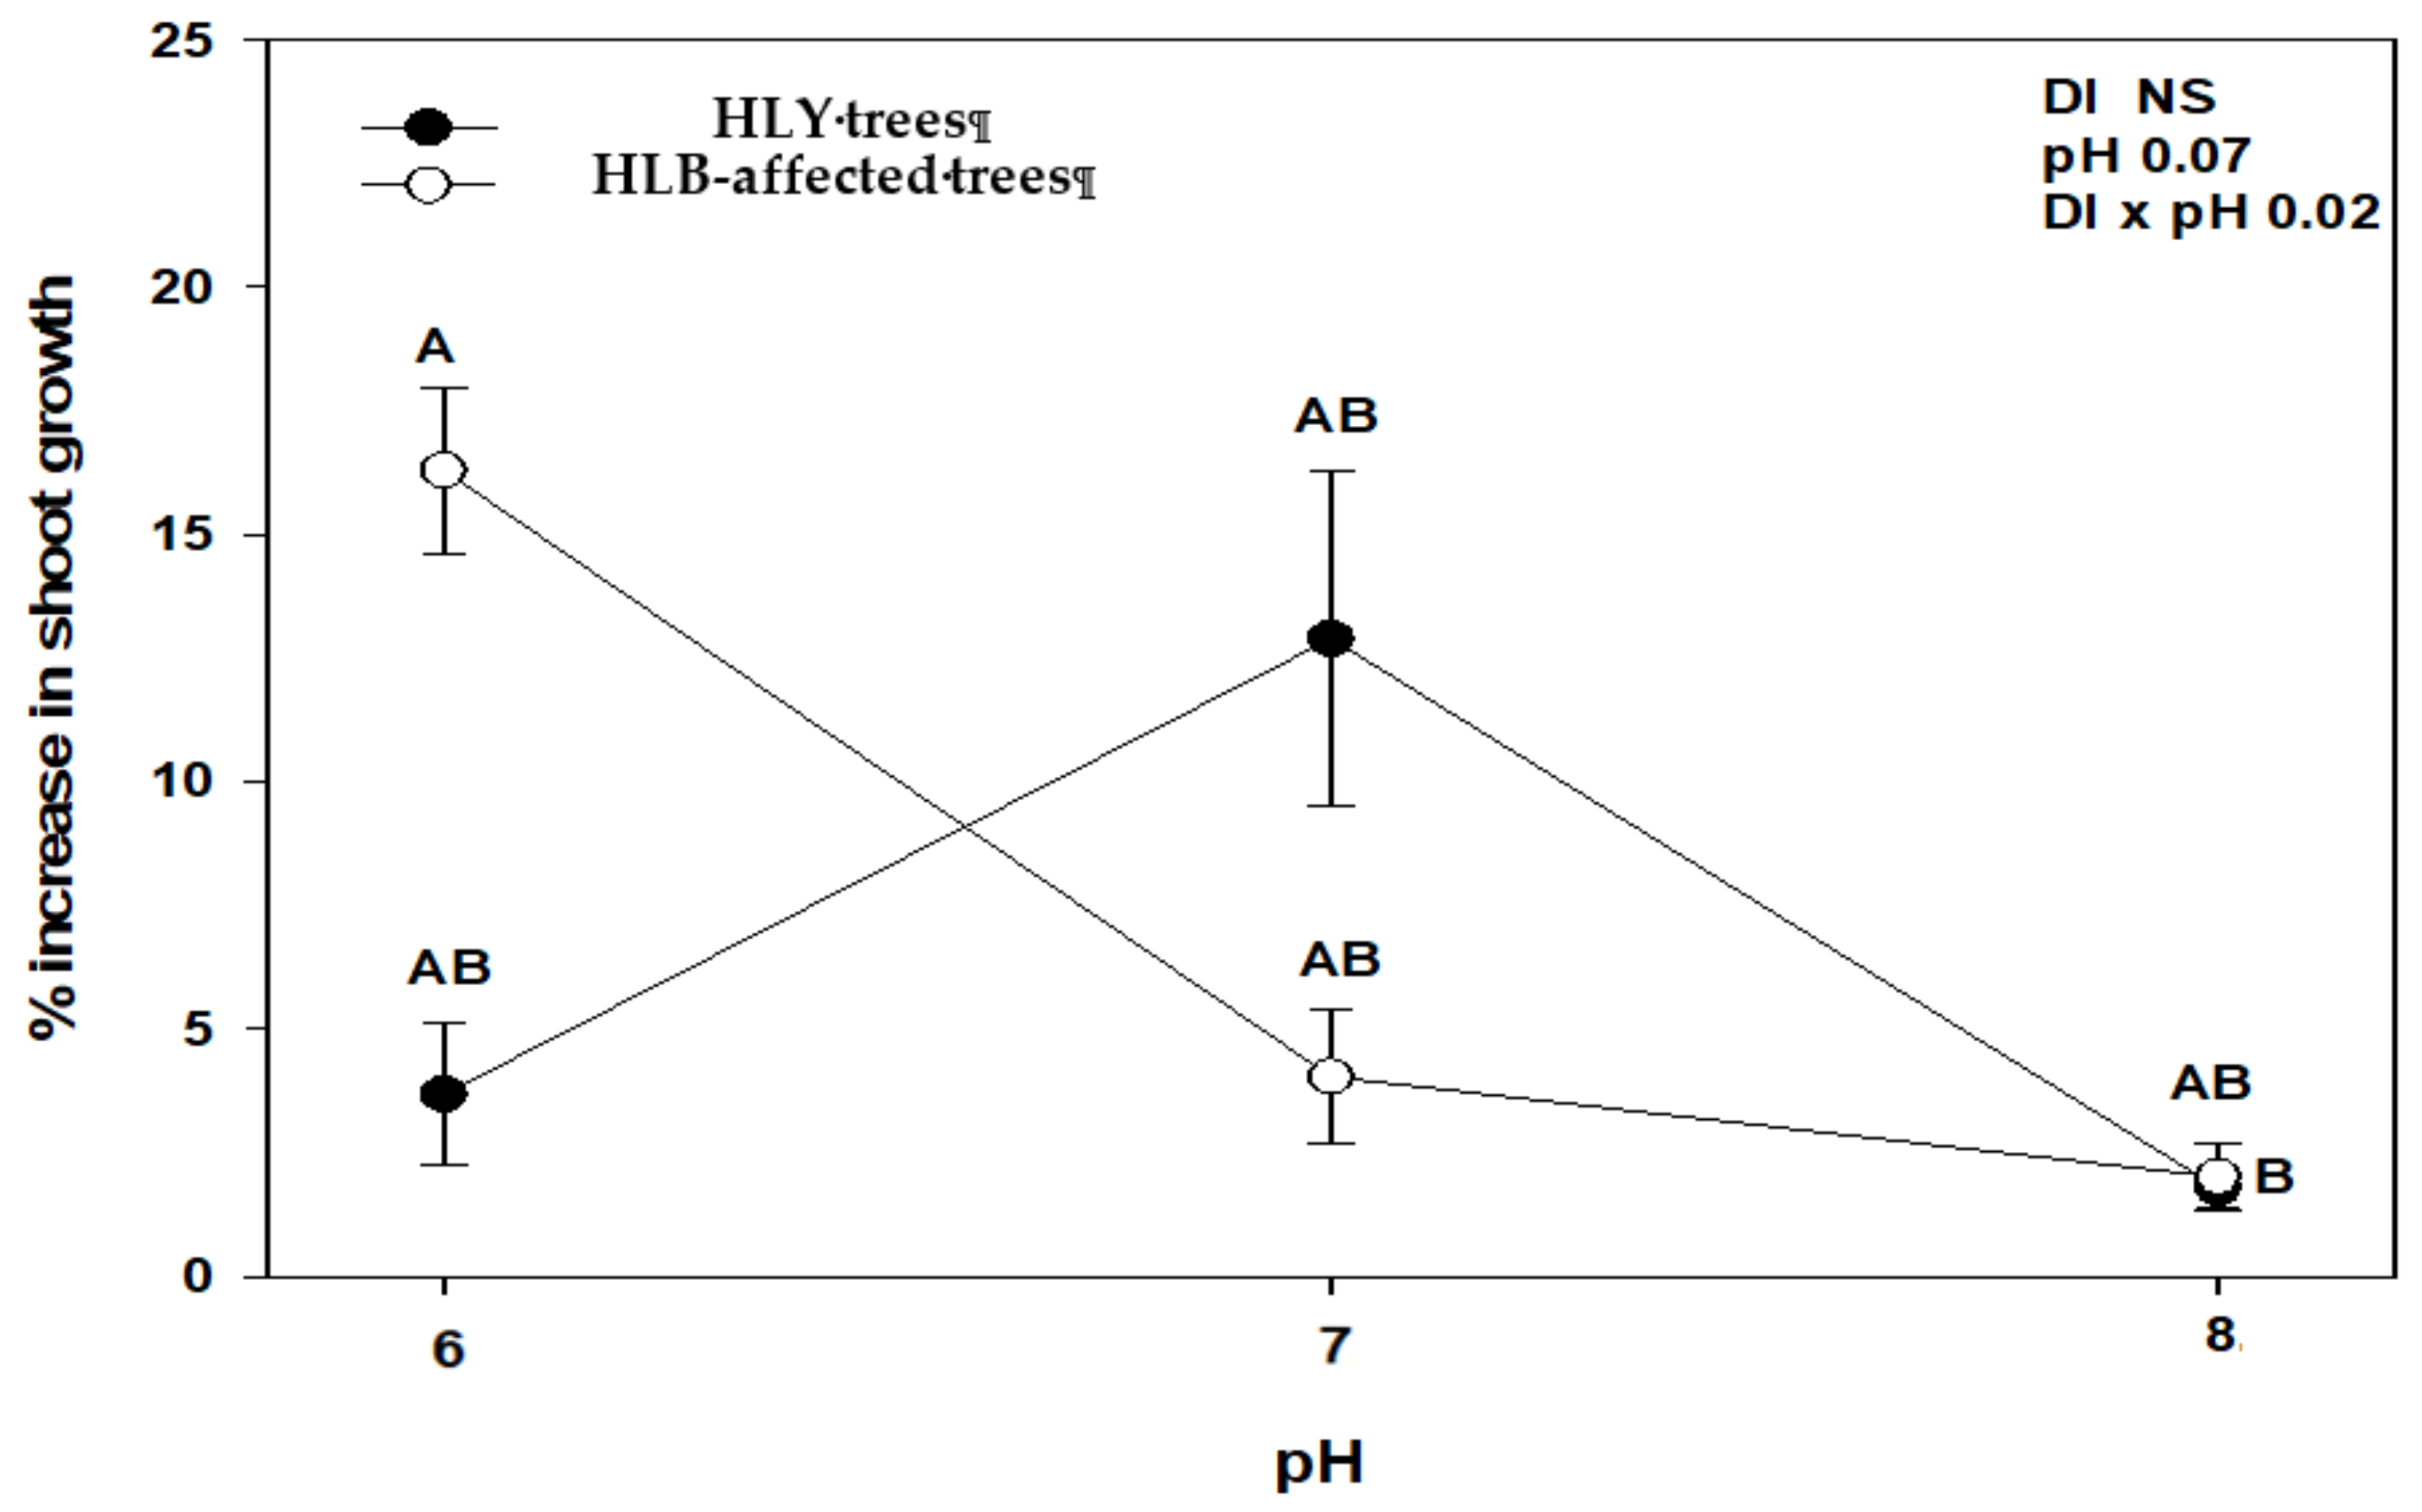
At the end of the experiment, we found a significant interaction between disease (DI) and pH (DI × pH) with an increase in number of leaves and shoot growth (Figure 1 and Figure 2). HLY trees had a significant increase in the number of leaves at pH 7.0 compared to pH 8.0, whereas in HLB-pH 6.0 trees showed a higher increase in the number of leaves than HLB trees at pH 7.0 and pH 8.0. There was a strong negative correlation between change in number of leaves and pH treatments in HLB trees (r = −0.79, p < 0.05), whereas HLY trees did not show such correlation (r = −0.18, p > 0.05). In the case of shoot growth, pH 6.0-HLB trees had a 16% increase in shoot growth, whereas pH 7.0- and 8.0-HLB trees increased 3%. Conversely, pH 7.0-HLY trees had the highest increase (13%) in shoot growth and about 2.5% increase at pH 6.0 and pH 8.0, although it was not statistically different at any pH treatment. A negative correlation (r = −0.75, p < 0.05) was found between increase in shoot growth and pH treatments in HLB trees however, again HLY trees did not show such correlation (r = −0.08, p > 0.05). SPAD values were similar for HLB and HLY trees at the start of the experiment. After 5 weeks of pH treatment, a significant pH effect on SPAD value was observed, though no interaction (DI × pH) was found (Table 1). Both HLB and HLY had the highest increase in SPAD values (42%) at pH 6.0. A negative correlation was found between increase of SPAD value and pH treatments in both HLY trees (r = −0.57, p < 0.05) and HLB trees (r = −0.66, p < 0.05). No difference in trunk diameter, fresh shoot biomass, dry shoot and root biomass were observed among all six treatment combinations at the end of the experiment (Table 1).
3.2. Midday Stem Water Potential
At the start of the experiment, no differences were found in the SWP in HLY and HLB trees. After applying pH treatments, a significant interaction (DI × pH) was found for SWP on D 14 and 28 (Table 1). On D 14, pH 6.0-HLB trees had the highest SWP (−0.96 MPa) compared to pH 7.0-HLB trees (−1.98 MPa) and pH8.0-HLY trees (−1.66 MPa). A similar trend in SWP was observed on D 28. There was a positive correlation between decrease in SWP and pH treatments in HLB trees (r = 0.65, p < 0.05), whereas no correlation was found in HLY trees (r = 0.19, p > 0.05). HLY trees among all the three pH treatments had similar SWP with highest numerical value of SWP was observed for pH 7.0 (on D 14 and 28).
3.3. Physical, Chemical, and Nutrient Profile of Hydroponic Solution and Trees
A significant interaction (DI × pH) was observed for EC of the hydroponic solution (Table 1). The pH 8.0-HLB trees had the highest EC (1602 µS/cm) among all the treatments; however, it was not significantly different from pH 8.0-HLY trees. In HLY trees, EC values were the same for all the pH treatments. Irrespective of the pH treatment, an increase in pH of the hydroponic solution was observed for both HLB and HLY trees (Supplementary Table S2).
On D 0, the concentration of all mineral nutrients in hydroponic solution was the same for HLY and HLB trees. On D 14, a significant interaction (DI × pH) was found for P and Fe in hydroponic solution (Figure 3). The concentration of P and Fe decreased significantly in hydroponic solution with an increase in pH treatments. At pH 7.0, HLY trees had lower P and Fe concentrations than HLB trees. Additionally, for pH 7.0-HLY trees P concentration was significantly lower than pH 6.0-HLY trees, whereas HLB trees at pH 6.0 and 7.0 had similar concentrations to each other. Similarly, pH 7.0 and pH 6.0 HLB trees had similar Fe concentrations; however, pH 7.0-HLY trees had significantly lower Fe concentrations than pH 6.0 trees. Significant effect of pH treatment, irrespective of the disease, was found for N, K, Ca, Mg, and S concentrations in the hydroponic solution. Significant effect of the disease, irrespective of pH treatments, on nutrient concentrations in the hydroponic solution was observed for B. Its concentration was lower in the growing media of HLB trees than HLY trees. Zn, Mn, and Cu were found at very low concentrations (<0.003 mg·L−1) in both HLY and HLB trees under all pH treatments.
At the start of the experiment, eight out of eleven leaf nutrients were significantly different among HLY and HLB trees (Supplementary Table S3). On D 35, a significant interaction (DI × pH) was found for nutrients P, Ca, S, Zn, Mn, and Fe (Table 2). Interestingly, pH 7.0-HLY trees had significantly higher leaf P than pH 6.0-HLY and pH 8.0-HLB trees; pH 7.0-HLY trees had greater leaf Ca concentration than pH 7.0-HLB trees. The pH 6.0-HLY trees had higher leaf Zn and Mn compared to HLB trees at pH 6.0. The pH treatments had a significant effect on N where both trees at pH 7.0 had higher concentrations compared with pH 6.0 or 8.0. HLY trees had higher Mg concentration than HLB trees under all pH treatments, and no differences were found for leaf K and B concentrations in all treatments. For whole tree body nutrient analysis (Table 2), a significant interaction (DI × pH) was found for N, P, K, Ca, S, and Zn. To summarize, pH 6.0-HLB trees had significantly higher N among all treatments except for pH 7.0-HLB trees; pH 6.0-HLB trees had higher K compared to pH 6.0-HLY trees; pH 8.0-HLY trees had the highest S among all treatments but was not different to pH 7.0-HLY trees; P and Ca were higher in pH 7.0-HLY trees among all the treatments; pH 8.0-HLB trees had the lowest Zn concentration among the treatments. Both HLY and HLB trees, irrespective to disease, had higher Fe and Mn concentrations at pH 6.0 compared to pH treatments 7.0 or 8.0. It is noteworthy that whole tree Fe and Mn concentrations decreased with an increase in pH treatments.
3.4. Feeder Root Characteristics
A significant effect of pH treatment was found for the feeder root of HLB and HLY trees, whereas disease and interaction effects were non-significant (Table 3). Both HLY and HLB trees had significantly smaller root diameter at pH 6.0 than pH 7.0, whereas the average root diameter values were intermediate at pH 8.0. At pH 6.0, both HLY and HLB trees showed greater root length, surface area, and older root growth area compared to pH 7.0. New root growth area was unaffected by any of the treatments.
3.5. Gene Expression Analysis
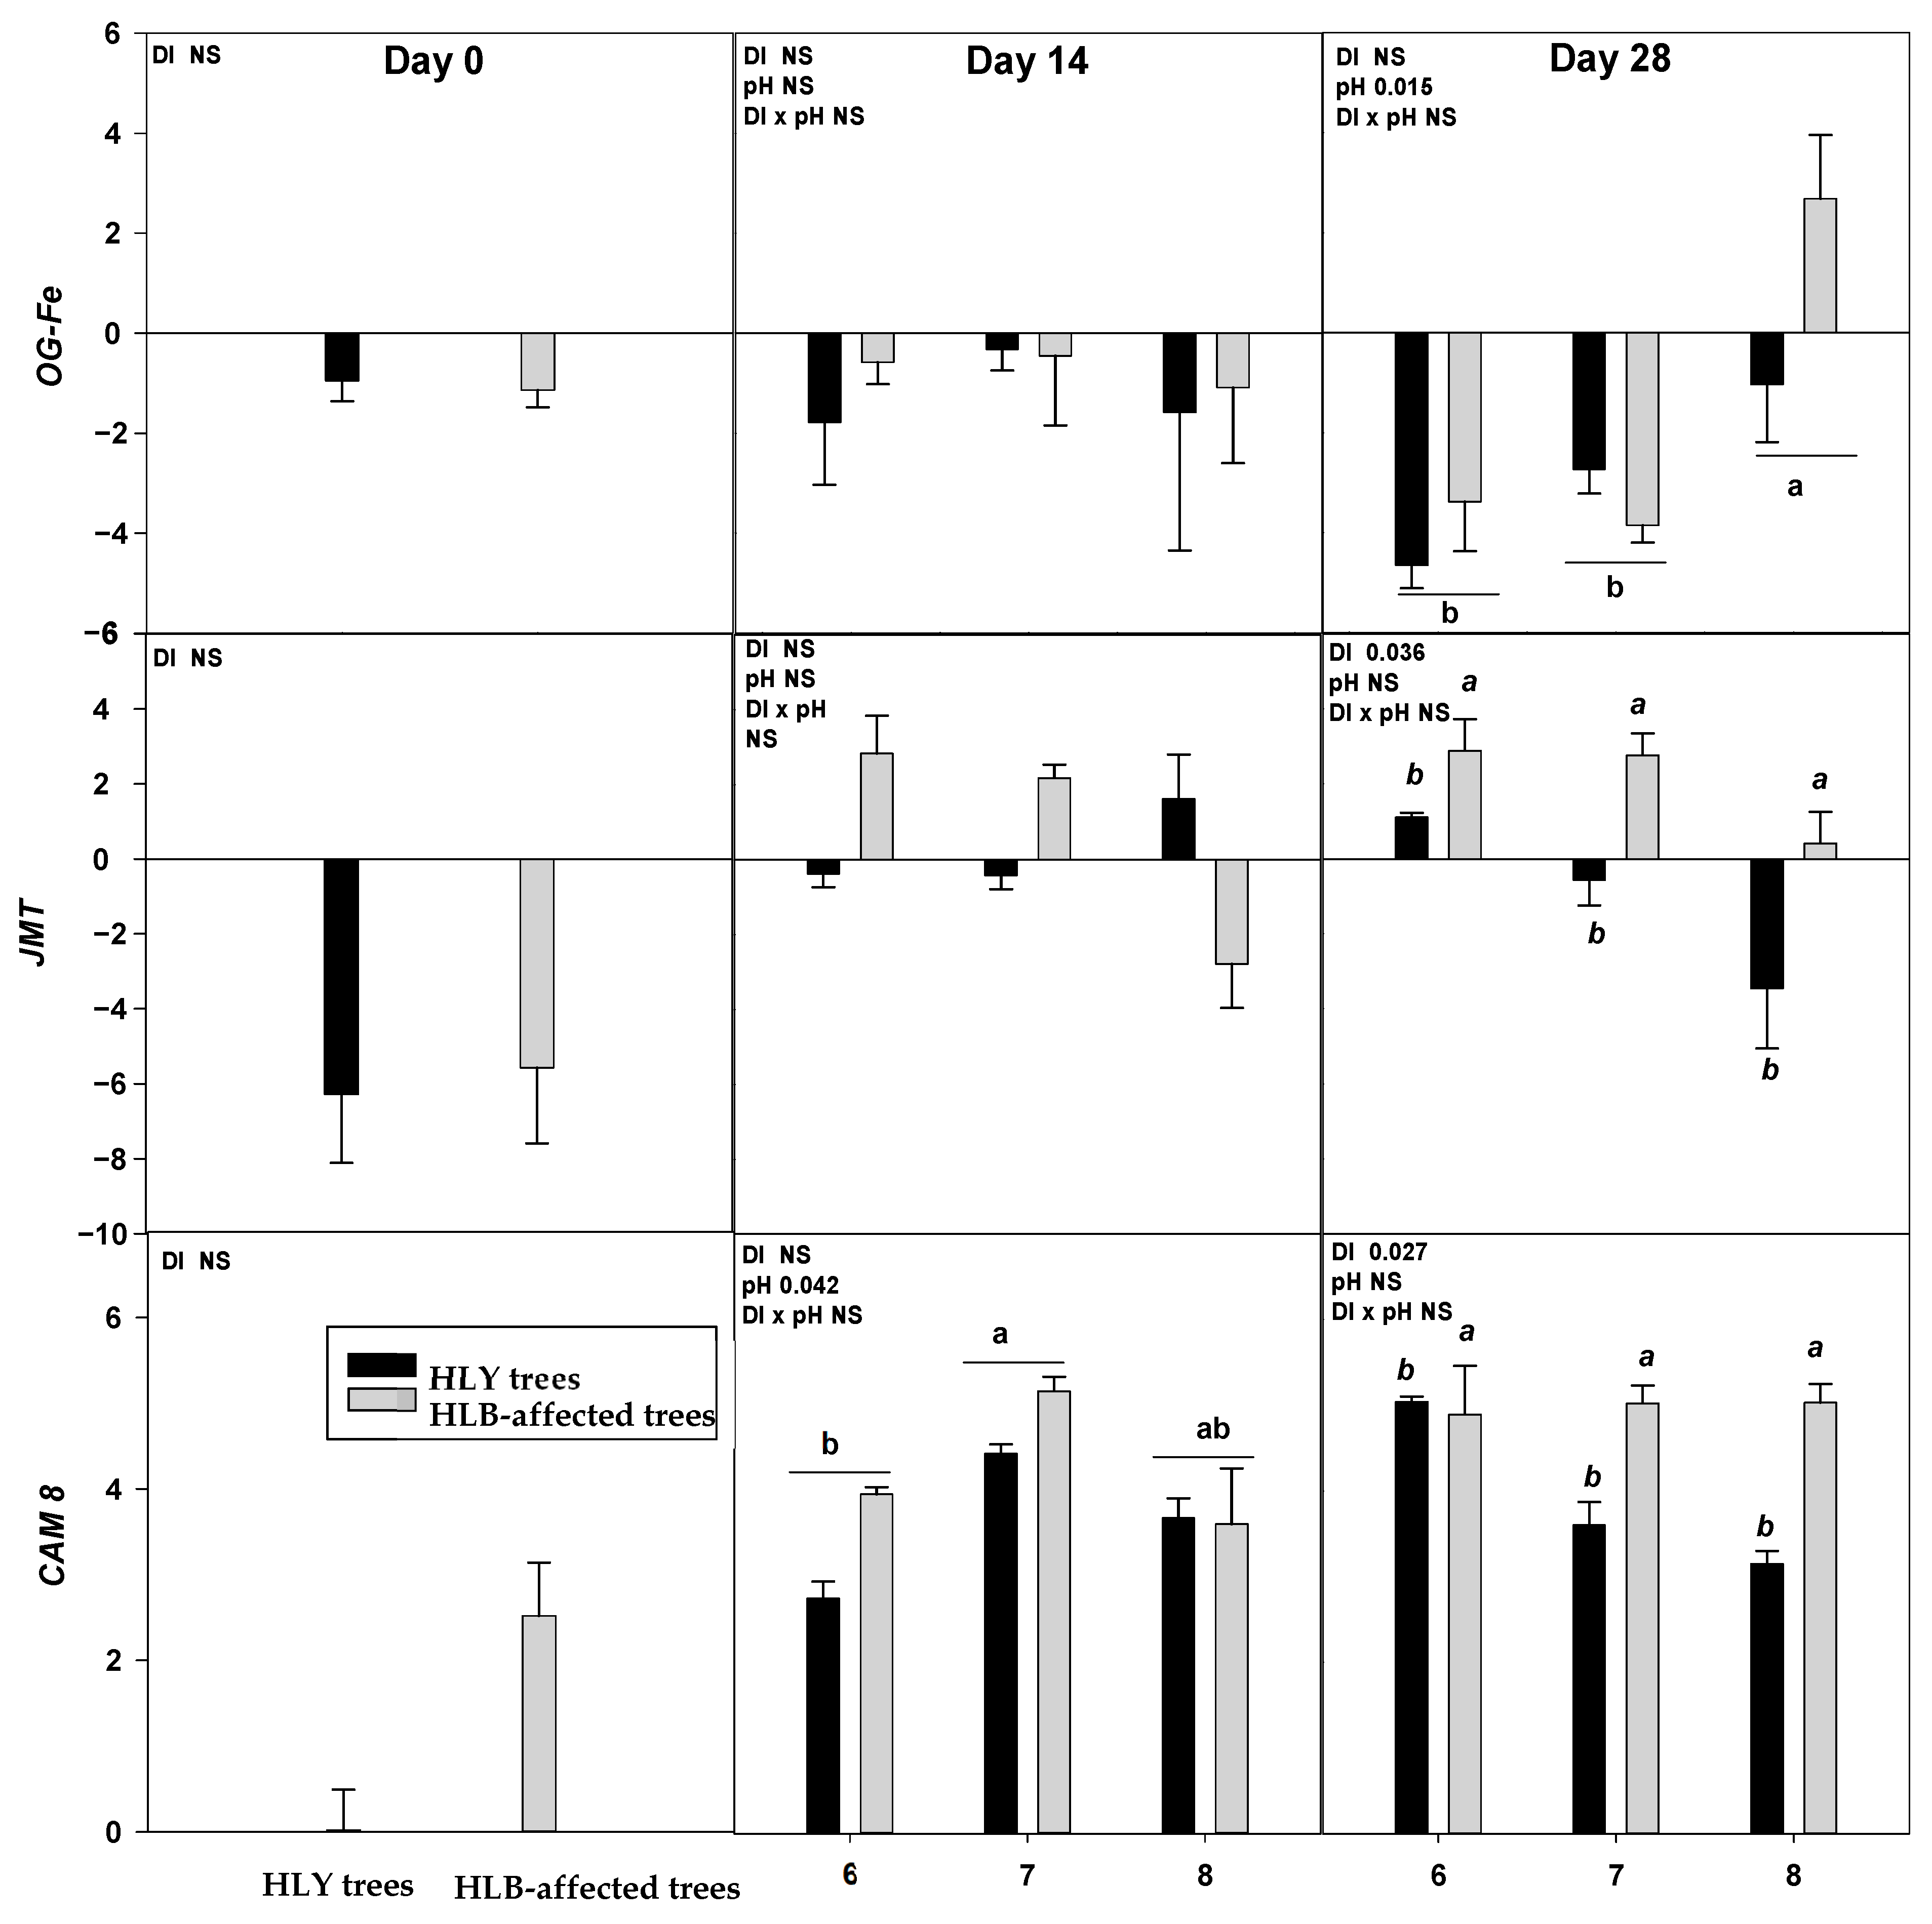
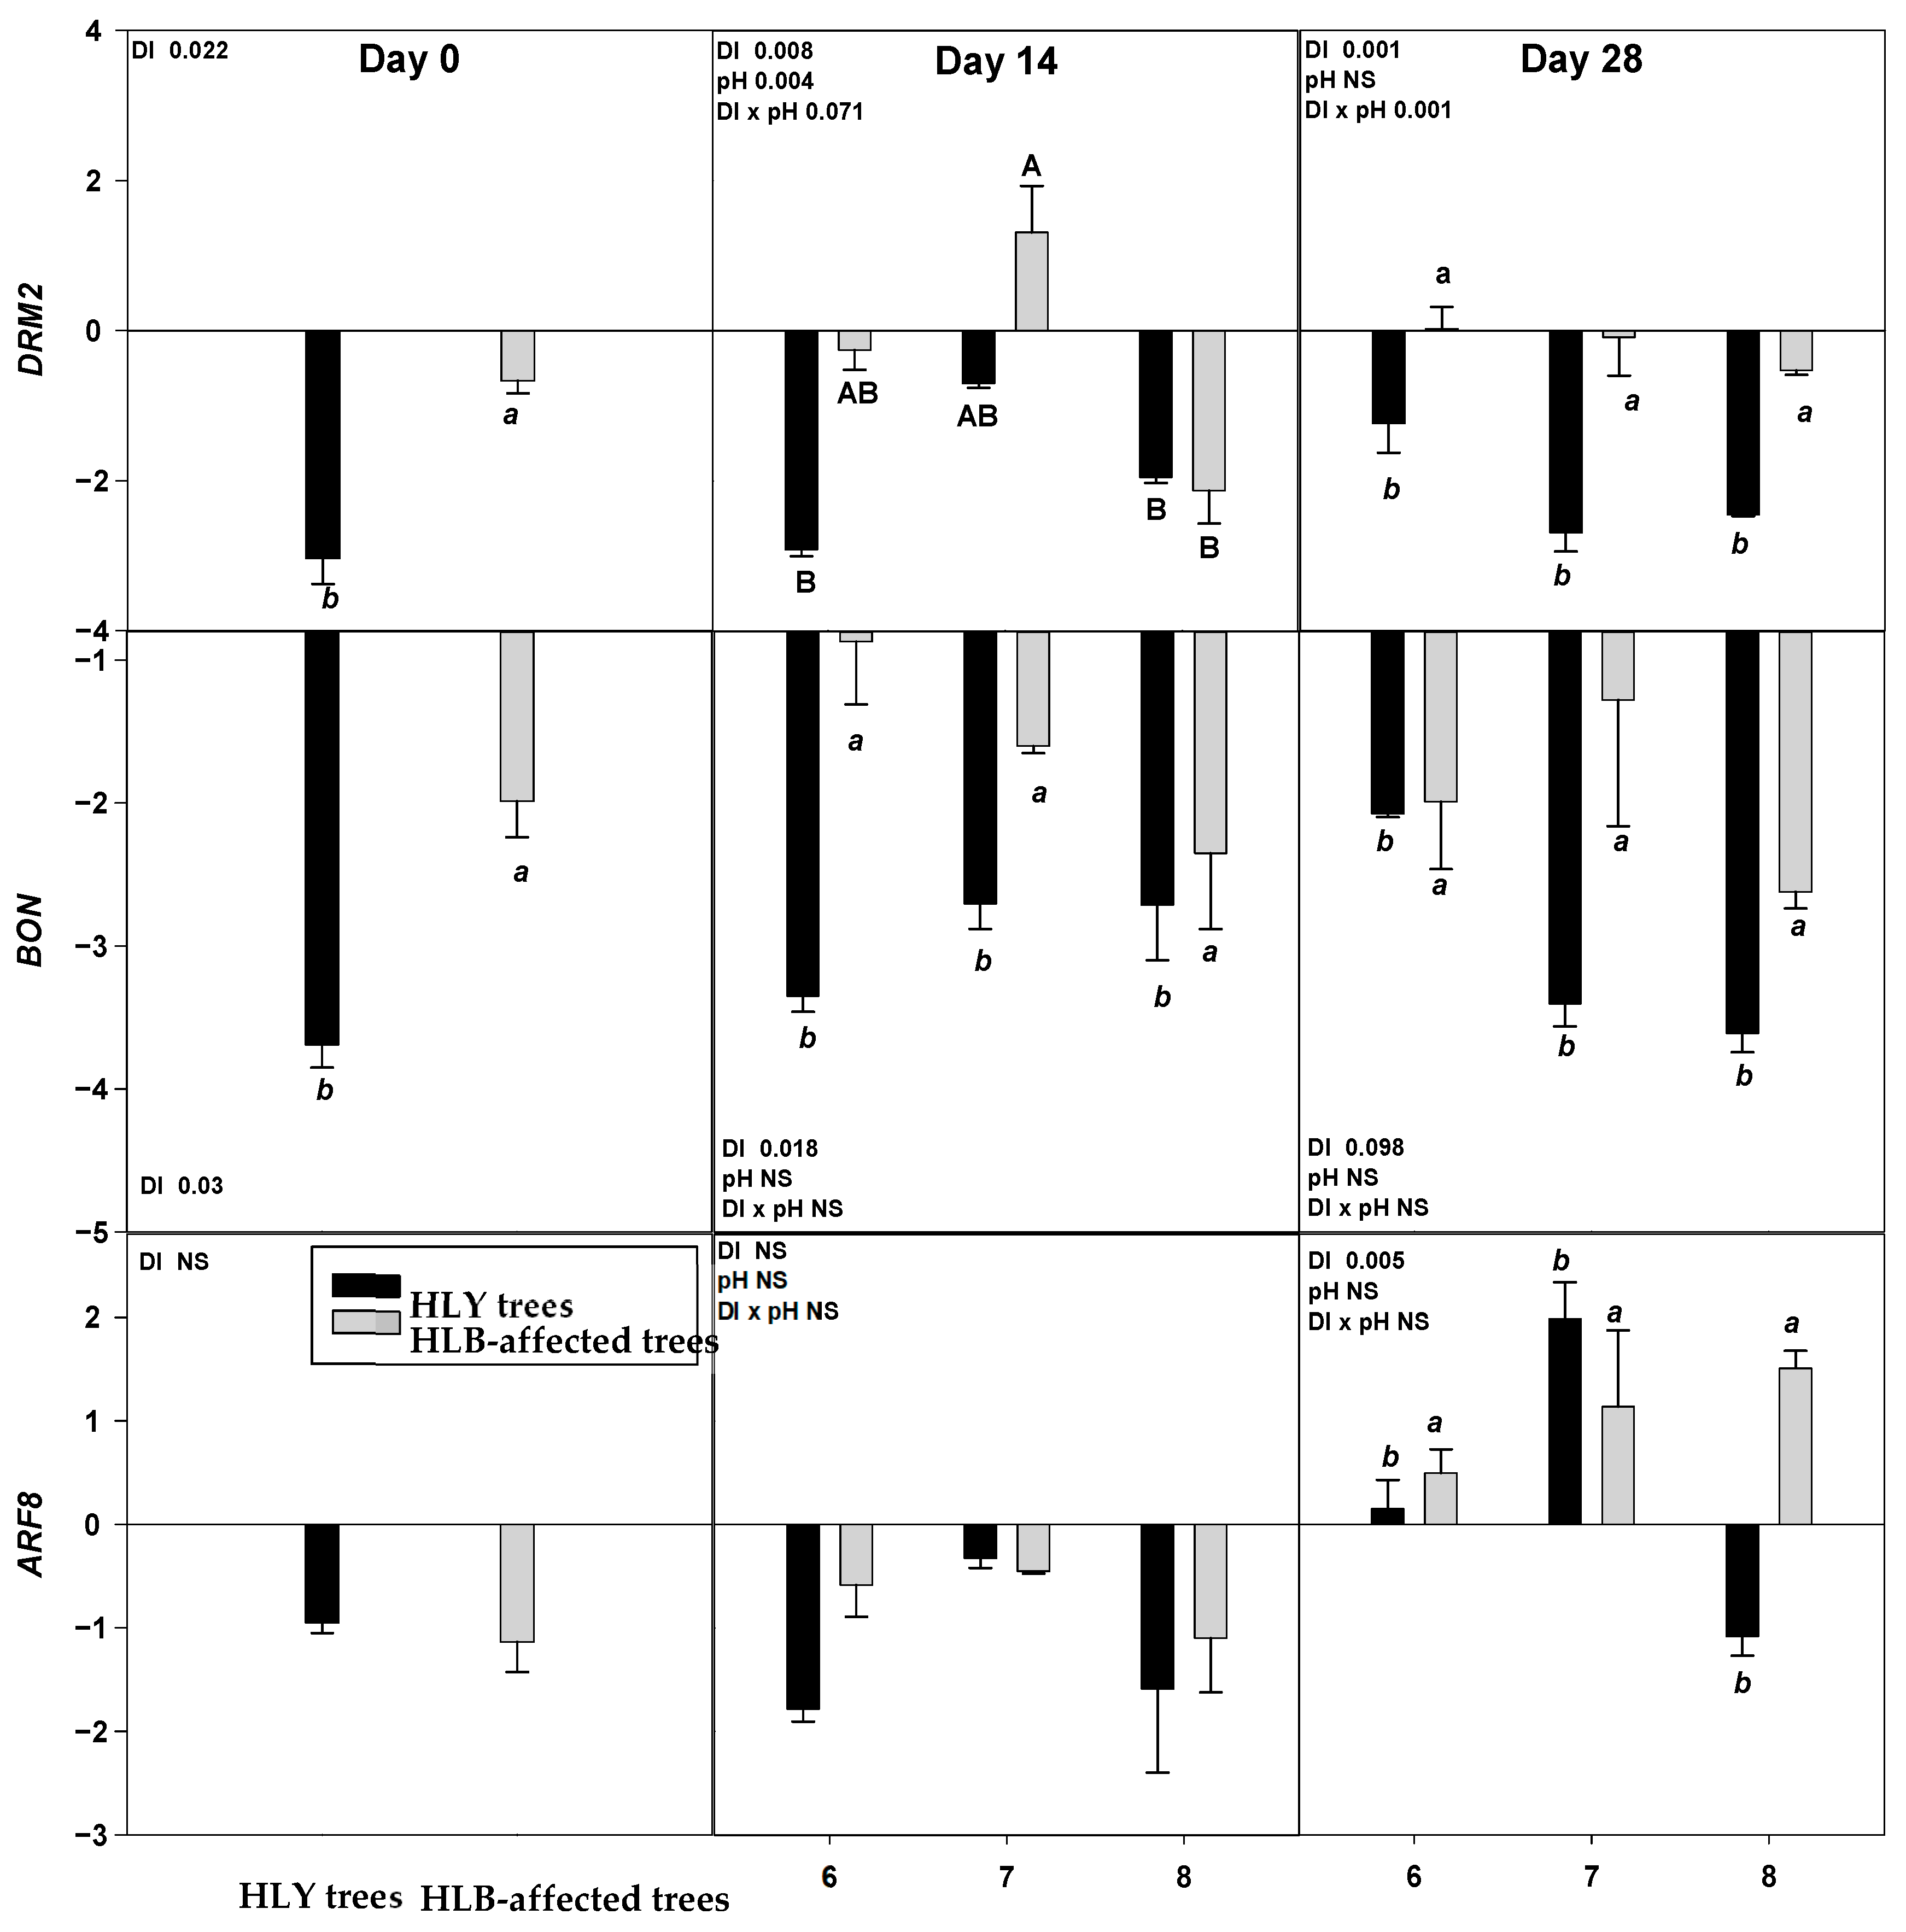
On D 0, two out of nine genes, DRM2 and BON were significantly upregulated in HLB trees compared to HLY trees (Figure 4).
On D 14, a significant interaction (DI × pH) effect was found on ERF1 which was significantly upregulated in pH 7.0-HLB trees than pH 7.0-HLY trees yet not different in HLY and HLB trees at pH 6.0 and 8.0. A significant effect of disease, irrespective of pH treatments, was found for BON, SAG13, and DRM2; these three genes were upregulated in HLB trees compared to HLY trees.
On D 28, ERF1 was significantly upregulated in pH 7.0-HLB trees compared to pH 7.0-HLY trees; no difference in expression was observed at pH 6.0 and pH 8.0 for HLY and HLB trees. Significant effects of pH treatment, irrespective to disease, was found for OG-Fe which was upregulated in trees at pH 8.0 than pH 6.0 and pH 7.0. Significant effect of disease, irrespective of pH treatments, was observed in the expression of ERF5, JMT, CAM8, DRM2, BON, and ARF8. All six genes were significantly upregulated in HLB trees compared to HLY trees. DRM2 and BON were found to be significantly upregulated in HLB trees than HLY trees on all days (i.e., D 0, 14, and 28).
4. Discussion
In the present study, the effects of growing media pH on growth, nutrient uptake, and molecular response were evaluated in HLY and HLB trees. At the end of the experiment, growth attributes such as change in leaf number, shoot growth, and SPAD value showed a negative correlation with pH treatments in HLB trees, and no such correlation were observed in HLY trees. Similar results of negative impacts of high pH on plant growth such as biomass, chlorophyll content, and yield have been previously reported [8,9,21,22,23]. A positive correlation was found between pH treatment and decrease in SWP in HLB trees, but no correlation was found in HLY trees. SWP is an indicator of water status in plants. Greater growth rates in pH 6.0-HLB trees and pH 7.0-HLY trees were accompanied with higher SWP, which suggest a combined effect of growth- and efficient water uptake. HLB-affected ‘Hamlin’ and ‘Valencia’ citrus trees had SWP less than -1 MPa under normal (non-stressed) plant water conditions [24]. However, under water-stressed conditions, citrus trees had SWP close to −2 MPa [25]. In this study, in pH 8.0-HLY and HLB tree SWP was close to -2 MPa. Thus, it is reasonable to speculate that at higher pH, the water uptake was reduced, inducing water stress, which limited photosynthesis in the citrus leaves (in addition to reduced chlorophyll content) thereby reducing growth.
Root analysis showed that both HLY and HLB trees had higher root length, surface area, and older root area at pH 6.0 compared to higher pH treatments; this implies a pronounced effect of pH conditions on feeder roots which are responsible for nutrient uptake. Biomass differences in feeder roots of HLY and HLB trees subjected to different irrigation water pH treatments have been previously reported [9]. Additionally, HLB trees are also reported to have lower root biomass leading to overall less nutrient uptake than HLY trees [14]. At pH 6.0-HLB trees showed better performance compared to higher pH treatments, so it is reasonable to correlate this observation with acid growth theory. Plant cells decrease the apoplastic pH by excreting an enhanced number of protons when exposed to auxin, thereby cell wall modification and expansion occurs in the particular cells [26].
At the start of the experiment, eight out of eleven mineral nutrients were lower in HLB tree leaves than HLY trees, even though all trees were grown in the same nutrient-deficient conditions for 6 months. This baseline result suggests that nutrients were rapidly utilized in HLB trees, possibly to overcome the biotic (CLas infection) stress conditions [14]. At the end of the experiment, both HLY and HLB trees had higher whole tree Mn and Fe concentrations at pH 6.0 than pH 7.0 or 8.0. Three to four times higher than recommended rates of Mn had therapeutic effects on CLas reduction, thereby improving tree health and productivity of HLB-affected sweet orange trees [27]. In a field trial, applying high rates of micronutrients (e.g., Mn and Fe) along with soil acidification improved tree canopy, yield, and fruit quality for HLB-affected ‘Valencia’ trees [28]. A transcriptomic study showed that HLB trees actively uptake micronutrients to correct for low levels of micronutrients in the leaves [14]. Our results (growth and nutrient analysis) /and existing literature suggest that HLB trees (CLas infected) benefit from micronutrient availability. Micronutrients are likely involved in combating infection, therefore, micronutrients availability at low pH improves the growth of HLB plants [9].
Hydroponic results showed a decrease in K absorption with high pH treatment. K increases water uptake, boosts uptake of nutrients such as Fe and sugar translocation [29]. Plants that are K deficient show reduced growth and root development and become susceptible to disease and insect infestation [30]. Leaf N concentration was higher at pH 7.0 for both trees compared to other pH treatments whereas pH 6.0-HLB trees had the highest whole plant N concentration among the treatments. Under abiotic stresses such as salinity, leaf N is reduced in citrus cultivars leading to reduced water use and growth [31]. This suggests that the limited nutrient availability at high pH contributes to poor performance of the trees, especially for HLB trees that are already nutrient deficient.
Relative gene expression results showed that two genes, DRM2 and BON, were significantly upregulated in HLB trees on D 0, 14, and 28, suggesting a significant role of these genes in regulating physiological and developmental processes under HLB conditions. DRM2, belonging to the DRM/ARP family, is involved in plant response to a diverse range of abiotic factors, including salinity, heat, drought, and oxidative stress [32,33]. BON belongs to the copine protein family involved in calcium dependent signal transduction protein and membrane trafficking [34,35]. Ca is an important secondary messenger in response to stimuli such as pathogens, drought, and oxidative stress [36]. BON also regulates the cell death associated defense response by reducing the number of copine genes and activating resistance (R) genes [37].
On D 14, both HLY and HLB trees had higher CAM8 expression at pH 7.0 than pH 6.0. Whereas, on D 28, HLB trees had higher CAM8 expression than HLY trees in the three pH treatments. CAM8 modulates numerous target protein activities, which are important in Arabidopsis abiotic stress tolerance [38]. CAM8 is one of the Ca signal receptors involved in signal transmission that regulates plant growth and developmental processes [39]. In Arabidopsis and tomato (Solanum lycopersicum), endogenous ethylene plays a key role in accelerating leaf abscission by activating cell wall hydrolytic enzymes to dissolve middle lamella [40,41,42,43,44]. ERF1 and ERF5 are transcription factors that regulate ethylene [45]. ERF1 on D 14 and 28 was significantly upregulated in HLB trees compared to HLY trees at pH 7.0 Interestingly, ERF1 expression in HLY trees decreased with pH on D 28, whereas in HLB trees ERF1 expression remained the same among the three pH treatments. ERF5 was found to be upregulated in HLB trees compared to HLY trees on D 28 regardless of pH. SAG13 is considered a good marker for leaf senescence conditions such as drought [46], pathogen infection [47], and oxidative stress [48]. For both HLY and HLB trees, SAG13 and OG-Fe were significantly upregulated at pH 7.0 and pH 8.0, compared to pH 6.0. Under iron-deficient conditions, OG-Fe transcript expression acts as iron responsive genes in an ethylene dependent manner [49]. Overall, the majority of differences were observed in HLB and HLY trees at pH 7.0, whereas at pH 6.0 and pH 8.0 the trees responded in similarly. Altogether these results suggest that at under high pH conditions stress-related genes were upregulated, potentially resulting in leaf loss and reduced growth plants that were observed in HLB plants. It is noteworthy that HLB tree performance was better at pH 6.0 when compared to the higher pH treatments. Thus, considering all the presented data it is reasonable to say that at pH 6.0, HLB trees were able to grow comparably to HLY trees. Therefore, soil acidification seems to be promising management tool for optimal performance of HLB-affected groves. During the experiment, pH of the growing media was maintained on alternate days, both HLY and HLB trees increased growing media pH. A more pronounced rise in pH increment/change was found at lower pH conditions i.e., pH 6.0, where the pH of hydroponic media was consistently changing towards neutral pH whereas higher pH treatments (pH 7.0 and pH 8.0) did not change noticeably. This observation suggests that growing media pH adjustment, such as soil acidification, should be rigourously monitored and managed.
5. Conclusions
The presented greenhouse study reported an interaction between growing media pH, growth attributes, and nutrients accumulation for HLB-affected trees. At the end of the experiment, a negative correlation was found between pH treatments and growth parameters (i.e., leaf number, shoot growth, SPAD value) in HLB trees whereas no such correlation was found in HLY trees (except for weak correlation in SPAD value). In addition, a positive correlation was found between a decrease in SWP and HLB trees, implying detrimental effects of high growing media pH in HLB trees. Hydroponic nutrient analysis showed that P and Fe absorption were less in HLB trees than HLY trees at pH 7.0; results also indicated uptake of certain nutrients (i.e., K) was compromised at pH 8.0. Significantly better performance of HLB trees at pH 6.0 could be attributed to higher whole tree Fe, Mn, and N concentrations, also highlighting an improved efficiency of feeder roots yielding greater nutrient uptake and nutrient accumulation. Genes, such as ethylene response factors (ERF1) were upregulated in HLB leaves at higher pH treatments (7.0); dormancy/auxin associated gene (DRM2), and copine family (BON) were also upregulated in HLB at all three pH treatments, altogether showing the genes role in alleviating stress response by regulating cell death associated defense response, compromised development, and abscission involved processes. Growing media pH 6.0 improved growth, feeder root density, whole tree nutrient status, and downregulating the stress responsive genes in HLB-affected trees; therefore, maintaining growing media pH at 6.0 would be recommended and needed to be a continuous process under HLB prevalent conditions. Further studies of the whole tree nutrients accumulation with changing in soil pH under field conditions and role of nutrient accumulation are needed to better understand better performance of HLB trees at low soil pH.
Supplementary Materials
The following are available online at https://0-www-mdpi-com.brum.beds.ac.uk/2073-4395/11/3/439/s1, Table S1: Gene-specific sequences for relative gene expression analysis in healthy (HLY) and Huanglongbing (HLB)-affected tree leaves using quantitative real-time polymerase chain reaction (qPCR), Table S2: Average pH value with standard deviation in the Hoagland solution of healthy (HLY) and Huanglongbing (HLB)-affected trees at the start (Day 0) and on alternate day (Day 2) grown at pH 6.0, 7.0, and 8.0 respectively, during the course of experiment, Table S3. Average nutrient concentration (mg·kg−1) with standard deviation in the leaves of healthy (HLY) and Huanglongbing (HLB)-affected trees at the start of the experiment (Day 0). Significant differences were calculated at P < 0.1 using Student t test, means followed by different letters are different from each other. Italic lower case letters correspond to the disease incidence.
Author Contributions
Conceptualization, T.V.; formal analysis, F.S.; funding acquisition, T.V.; investigation, F.S.; methodology, F.S.; supervision, T.V. and D.M.K.; writing—original draft preparation, F.S. and T.V.; writing—review and editing, D.M.K. and T.V. All authors have read and agreed to the published version of the manuscript.
Funding
Funding for this project was made possible by State Legislative funding for the UF/IFAS Citrus Initiative.
Institutional Review Board Statement
Not applicable.
Informed Consent Statement
Not applicable.
Data Availability Statement
Not applicable.
Conflicts of Interest
The authors declare no conflict of interest.
References
- Halbert, S.E.; Manjunath, K.L. Asian citrus psyllids (Sternorrhyncha: Psyllidae) and greening disease of citrus: A literature review and assessment of risk in Florida. Fla. Entomol. 2004, 87, 330–353. [Google Scholar] [CrossRef]
- Jagoueix, S.; Bové, J.M.; Garnier, M. PCR detection of the two«Candidatus»liberobacter species associated with greening disease of citrus. Mol. Cell. Probes 1996, 10, 43–50. [Google Scholar] [CrossRef]
- US. Department of Agriculture (USDA). Florida Citrus Fruit Size and Drop, 2018–2019; Department of Agriculture: Washington, DC, USA, 2019.
- Kim, E.H.; Kim, Y.S.; Park, S.-H.; Koo, Y.J.; Choi, Y.D.; Chung, Y.-Y.; Lee, I.-J.; Kim, J.-K. Methyl Jasmonate Reduces Grain Yield by Mediating Stress Signals to Alter Spikelet Development in Rice. Plant Physiol. 2009, 149, 1751–1760. [Google Scholar] [CrossRef] [Green Version]
- Etxeberria, E.; Gonzalez, P.; Achor, D.; Albrigo, G. Anatomical distribution of abnormally high levels of starch in HLB-affected Valencia orange trees. Physiol. Mol. Plant Pathol. 2009, 74, 76–83. [Google Scholar] [CrossRef]
- Bové, J.M. Huanglongbing: A destructive, newly-emerging, century-old disease of citrus. J. Plant Pathol. 2006, 1, 7–37. [Google Scholar]
- Tang, L.; Chhajed, S.; Vashisth, T. Preharvest fruit drop in Huanglongbing-affected ‘Valencia’ sweet orange. J. Am. Soc. Hortic. Sci. 2019, 144, 107–117. [Google Scholar] [CrossRef] [Green Version]
- Morgan, K.T.; Graham, J.H. Nutrient Status and Root Density of Huanglongbing-Affected Trees: Consequences of Irrigation Water Bicarbonate and Soil pH Mitigation with Acidification. Agronomy 2019, 9, 746. [Google Scholar] [CrossRef] [Green Version]
- Ghimire, L.; Kadyampakeni, D.; Vashisth, T. Effect of Irrigation Water pH on the Performance of Healthy and Huanglongbing-affected Citrus. J. Am. Soc. Hortic. Sci. 2020, 145, 1–10. [Google Scholar] [CrossRef]
- Obreza, T.A.; Zekri, M.; Hanlon, E.W. Soil and leaf tissue testing. In Nutrition of Florida Citrus Trees, 2nd ed.; Obreza, T.A., Morgan, K.T., Eds.; Fla. Coop. Ext. Publ. Florida, IFAS, University of Florida: Florida, FL, USA, 2008; pp. 24–32. [Google Scholar]
- Graham, J.; Johnson, E.; Morgan, K. What growers need to know about bicarbonates and root health? Citrus Ind. 2014, 95, 6–9. Available online: https://crec.ifas.ufl.edu/extension/trade_journals/2014/2014_January_root_health.pdf (accessed on 2 December 2020).
- Kadyampakeni, D.M. Citrus advanced production system: Understanding water and NPK uptake and leaching in Florida Flatwoods and Ridge soils. Ph.D. Thesis, University of Florida, Florida, FL, USA, 2012. [Google Scholar]
- Kadyampakeni, D.M.; Morgan, K.T.; Schumann, A.W.; Nkedi-Kizza, P. Effect of Irrigation Pattern and Timing on Root Density of Young Citrus Trees Infected with Huanglongbing Disease. HortTechnology 2014, 24, 209–221. [Google Scholar] [CrossRef]
- Shahzad, F.; Chun, C.; Schumann, A.; Vashisth, T. Nutrient uptake in Huanglongbing-affected sweet orange: Tran-scriptomic and physiological analysis. J. Am. Soc. Hortic. Sci. 2020, 145, 349–362. [Google Scholar] [CrossRef]
- Lucas, R.E.; Davis, J.F. Relationships between pH values of organic soils and availabilities of 12 plant nutrients. Soil Sci. 1961, 92, 177–182. [Google Scholar] [CrossRef]
- Vashisth, T.; Livingston, T. Assessment of Pruning and Controlled-release Fertilizer to Rejuvenate Huanglongbing-affected Sweet Orange. HortTechnology 2019, 29, 933–940. [Google Scholar] [CrossRef] [Green Version]
- Morgan, K.T.; Barkataky, S.; Kadyampakeni, D.; Ebel, R.; Roka, F. Effects of Short-term Drought Stress and Mechanical Harvesting on Sweet Orange Tree Health, Water Uptake, and Yield. HortScience 2014, 49, 835–842. [Google Scholar] [CrossRef] [Green Version]
- Rio, D.C. Denaturation and Electrophoresis of RNA with Formaldehyde. Cold Spring Harb. Protoc. 2015, 2, 219–222. [Google Scholar] [CrossRef] [PubMed]
- Mafra, V.; Kubo, K.S.; Alves-Ferreira, M.; Ribeiro-Alves, M.; Stuart, R.M.; Boava, L.P.; Rodrigues, C.M.; Machado, M.A. Reference Genes for Accurate Transcript Normalization in Citrus Genotypes under Different Experimental Conditions. PLoS ONE 2012, 7, e31263. [Google Scholar] [CrossRef]
- Mafra, V.; Martins, P.K.; Francisco, C.S.; Ribeiro-Alves, M.; Freitas-Astúa, J.; A Machado, M. Candidatus Liberibacter americanus induces significant reprogramming of the transcriptome of the susceptible citrus genotype. BMC Genom. 2013, 14, 247. [Google Scholar] [CrossRef] [PubMed] [Green Version]
- Valdez-Aguilar, L.A.; Reed, D.W. Influence of potassium substitution by rubidium and sodium on growth, ion accumulation, and ion partitioning in bean under high alkalinity. J. Plant Nutr. 2008, 31, 867–883. [Google Scholar] [CrossRef]
- Ksouri, R.; Debez, A.; Mahmoudi, H.; Ouerghi, Z.; Gharsalli, M.; Lachaâl, M. Genotypic variability within Tunisian grapevine varieties (Vitis vinifera L.) facing bicarbonate-induced iron deficiency. Plant Physiol. Biochem. 2007, 45, 315–322. [Google Scholar] [CrossRef]
- Khunaw, A.R.; Radziah, O.; Nusaibah, S.A.; Hanafi, M.M. Effect of ph on growth of oil palm seedlings and basal stem rot disease incidence in ganoderma inoculated plants. J. Kirkuk Univ. Agric. Sci. 2019, 2018, 75–81. [Google Scholar]
- Hamido, S.A.; Morgan, K.T.; Ebel, R.C.; Kadyampakeni, D.M. Improved Irrigation Management of Sweet Orange with Huanglongbing. HortScience 2017, 52, 916–921. [Google Scholar] [CrossRef]
- Gasque, M.; Martí, P.; Granero, B.; González-Altozano, P. Effects of long-term summer deficit irrigation on ‘Navelina’ citrus trees. Agric. Water Manag. 2016, 169, 140–147. [Google Scholar] [CrossRef] [Green Version]
- Rayle, D.L.; Cleland, R. Enhancement of Wall Loosening and Elongation by Acid Solutions. Plant Physiol. 1970, 46, 250–253. [Google Scholar] [CrossRef] [PubMed] [Green Version]
- Zambon, F.T.; Kadyampakeni, D.M.; Grosser, J.W. Ground Application of Overdoses of Manganese Have a Therapeutic Effect on Sweet Orange Trees Infected with Candidatus Liberibacter asiaticus. HortScience 2019, 54, 1077–1086. [Google Scholar] [CrossRef] [Green Version]
- Vashisth, T. Nutrition: No one size fits all. Citrus Ind. 2000. Available online: https://citrusindustry.net/2020/03/05/nutrition-no-one-size-fits-all/ (accessed on 2 December 2020).
- Ishizuka, Y. Nutrient Deficiencies of Crops; Asian and Pacific Council: Taipei, Taiwan, 1978; p. 102. [Google Scholar]
- Williams, J.; Smith, S.G. Correcting potassium deficiency can reduce rice stem diseases. Better Crops 2001, 85, 7–9. [Google Scholar]
- Lea-Cox, J.D.; Syvertsen, J.P. Salinity reduces water use and nitrate-N-use efficiency of citrus. Ann. Bot. 1993, 72, 47–54. [Google Scholar] [CrossRef]
- Stafstrom, J.P. Regulation of growth and dormancy in pea axillary buds. In Dormancy in Plants; Viémont, J.D., Crabbé, J., Eds.; CAB International: Wallingford, UK, 2000; pp. 331–346. [Google Scholar]
- Govind, G.; Harshavardhan, V.T.; Patricia, J.K.; Dhanalakshmi, R.; Kumar, M.S.; Sreenivasulu, N.; Udayakumar, M. Identification and functional validation of a unique set of drought induced genes preferentially expressed in response to gradual water stress in peanut. Mol. Genet. Genom. 2009, 281, 607. [Google Scholar] [CrossRef] [Green Version]
- Yang, S.; Yang, H.; Grisafi, P.; Sanchatjate, S.; Fink, G.R.; Sun, Q.; Hua, J. The BON/CPN gene family represses cell death and promotes cell growth in Arabidopsis. Plant J. 2006, 45, 166–179. [Google Scholar] [CrossRef]
- Lee, T.-F.; McNellis, T.W. Evidence that the BONZAI1/COPINE1 protein is a calcium- and pathogen-responsive defense suppressor. Plant Mol. Biol. 2008, 69, 155–166. [Google Scholar] [CrossRef] [PubMed]
- Reddy, A.S. Calcium: Silver bullet in signaling. Plant Sci. 2001, 160, 381–404. [Google Scholar] [CrossRef]
- Shirasu, K.; Schulze-Lefert, P. Regulators of cell death in disease resistance. In Programmed Cell Death in Higher Plants; Lam, E., Fukuda, H., Greenberg, J., Eds.; Springer: Dordrecht, The Netherlands, 2000; Volume 44, pp. 127–141. [Google Scholar]
- Perochon, A.; Aldon, D.; Galaud, J.-P.; Ranty, B. Calmodulin and calmodulin-like proteins in plant calcium signaling. Biochimie 2011, 93, 2048–2053. [Google Scholar] [CrossRef] [PubMed]
- Reddy, A.; Ben-Hur, A.; Day, I.S. Experimental and computational approaches for the study of calmodulin interactions. Phytochemistry 2011, 72, 1007–1019. [Google Scholar] [CrossRef]
- Patterson, S.E. Cutting Loose. Abscission and Dehiscence in Arabidopsis. Plant Physiol. 2001, 126, 494–500. [Google Scholar] [CrossRef] [PubMed] [Green Version]
- González-Carranza, Z.H.; Whitelaw, C.A.; Swarup, R.; Roberts, J.A. Temporal and spatial expression of a polygalac-turonase during leaf and flower abscission in oilseed rape and Arabidopsis. Plant Physiol. 2002, 128, 534–543. [Google Scholar] [CrossRef] [PubMed]
- González-Carranza, Z.H.; Elliott, K.A.; Roberts, J.A. Expression of polygalacturonases and evidence to support their role during cell separation processes in Arabidopsis thaliana. J. Exp. Bot. 2007, 58, 3719–3730. [Google Scholar] [CrossRef] [Green Version]
- Kim, H.J.; Hong, S.H.; Kim, Y.W.; Lee, I.H.; Jun, J.H.; Phee, B.-K.; Rupak, T.; Jeong, H.; Lee, Y.; Hong, B.S.; et al. Gene regulatory cascade of senescence-associated NAC transcription factors activated by ETHYLENE-INSENSITIVE2-mediated leaf senescence signalling in Arabidopsis. J. Exp. Bot. 2014, 65, 4023–4036. [Google Scholar] [CrossRef] [PubMed] [Green Version]
- Patharkar, O.R.; Walker, J.C. Advances in abscission signaling. J. Exp. Bot. 2018, 69, 733–740. [Google Scholar] [CrossRef]
- Guo, H.; Ecker, J.R. The ethylene signaling pathway: New insights. Curr. Opin. Plant Biol. 2004, 7, 40–49. [Google Scholar] [CrossRef]
- Weaver, L.M.; Gan, S.; Quirino, B.; Amasino, R.M. A comparison of the expression patterns of several senescence-associated genes in response to stress and hormone treatment. Plant Mol. Biol. 1998, 37, 455–469. [Google Scholar] [CrossRef]
- Espinoza, C.; Medina, C.; Somerville, S.; Arce-Johnson, P. Senescence-associated genes induced during compatible viral interactions with grapevine and Arabidopsis. J. Exp. Bot. 2007, 58, 3197–3212. [Google Scholar] [CrossRef] [PubMed]
- Navabpour, S.; Bagherieh-Najjar, M.B.; Soltanloo, H. Identification of novel genes expressed in Brassica napus during leaf senescence and in response to oxidative stress. Int. J. Plant Prod. 2012, 1, 35–44. [Google Scholar]
- Jeong, J.; Connolly, E.L. Iron uptake mechanisms in plants: Functions of the FRO family of ferric reductases. Plant Sci. 2009, 176, 709–714. [Google Scholar] [CrossRef]
Figure 1.
Average increase in the number of leaves with standard deviation in healthy (HLY) and Huanglongbing (HLB)-affected trees grown at pH 6.0, 7.0, and 8.0, respectively, at the end of experiment (D 35). Significant differences were calculated at p < 0.1 using Tukey test. Different letters indicate significant differences in the increase in number of leaves to the treatment combinations.

Figure 2.
Average increase in shoot growth with standard deviation in healthy (HLY) and Huanglongbing (HLB)-affected trees grown at pH 6.0, 7.0, and 8.0, respectively, at the end of experiment (D 35). Significant differences were calculated at p < 0.1 using Tukey test. Different letters indicate significant differences in shoot growth.

Figure 3.
Average nutrient concentration (mg·kg−1) with standard deviation in the growing media of healthy (HLY) and Huanglongbing (HLB)-affected trees grown at pH 6.0, 7.0, and 8.0, respectively, after 14 days of experiment (D 14). Significant differences were calculated at p < 0.1 using Tukey test. Upper case letters correspond to the treatment combinations, while lower case letters correspond to the respective pH treatment and italic lower case letters corresponds to the tree health status.

Figure 4.
Relative expression (log2 fold change) of nine genes on D 0, 14, and 28 days (since giving the Hoagland solution with different pH treatments) in healthy (HLY) and Huanglongbing (HLB)-affected trees grown at pH 6.0, 7.0, and 8.0, respectively. Data are means of three biological replicates. Different letters in each panel indicate significant difference among each other based on Tukey’s honestly significant difference test at p < 0.1. NS = not significantly different. Upper case letters correspond to the treatment combinations, while lower case letters correspond to the respective pH treatment and italic lower case letters corresponds to the tree health status. Genes are as follows ERF5 (ethylene response factor 5), ERF1 (ethylene responsive element binding factor 1), SAG13 (senescence associated gene 13), OG-Fe (2-oxoglutarate and Fe dependent oxygenase superfamily protein), JMT ((Jasmonic methyl transferase), CAM8 (calmodulin), DRM2 (Dormancy/auxin associated family protein), BON (copine family) and ARF8 (auxin response factor 8).


Table 1.
Plant growth parameters and physical/chemical properties with standard deviation of the growing media (Hoagland solution) of healthy (HLY) and Huanglongbing (HLB)-affected trees grown at pH 6.0, 7.0, and 8.0, respectively, at the end of experiment (Day 35). Significant differences were calculated at p < 0.1 using Tukey test, means followed by different letters are different from each other. Upper case letters correspond to the treatment combinations, while lower case letters correspond to the respective pH treatment and italic lower case letters corresponds to the tree health status.
| Parameters | p Value | Disease | pH 6.0 | pH 7.0 | pH 8.0 |
|---|---|---|---|---|---|
| Increase in SPAD value | DI NS pH 0.049 DI × pH NS | HLY | 52.6 ± 27.5 a | 19.1 ± 10.7 ab | 8.15 ± 11.5 b |
| HLB | 42.0 ± 21.8 a | 22.9 ± 12.9 ab | 12.6 ± 13.7 b | ||
| Increase in trunk diameter | DI NS pH NS DI × pH NS | HLY | 5.29 ± 4.74 | 8.42 ± 3.00 | 8.47 ± 2.97 |
| HLB | 4.62 ± 5.46 | 6.32 ±3.99 | 3.35 ± 10.0 | ||
| D 14, stem water potential (MPa) | DI NS pH 0.033 DI × pH 0.015 | HLY | −1.5 ± 0.24 AB | −1.4 ± 0.33 AB | −1.7 ± 0.24 B |
| HLB | −0.96 ± 0.21 A | −1.98 ± 0.30 B | −1.5 ± 0.24 AB | ||
| D 28, stem water potential (MPa) | DI NS pH 0.025 DI × pH 0.033 | HLY | −1.6 ± 0.50 AB | -1.3 ± 0.40 A | −1.8 ± 0.50 AB |
| HLB | −1.1 ± 0.39 A | −1.9 ± 0.63 AB | −2.3 ± 0.78 B | ||
| Biomass | |||||
| Fresh shoot biomass (g) | DI NS pH NS DI × pH NS | HLY | 20.6 ± 2.79 | 25.2 ± 4.02 | 21.6 ± 3.87 |
| HLB | 19.8 ± 1.80 | 20.6 ± 3.63 | 19.0 ± 3.60 | ||
| Fresh root biomass (g) | DI 0.04 pH NS DI × pH NS | HLY | 23.0 ± 2.85 a | 30.0 ± 2.67 a | 22.5 ± 4.14 a |
| HLB | 13.6 ± 4.80 b | 16.5 ± 5.55 b | 20.8 ± 4.08 b | ||
| Dry shoot biomass (g) | DI NS pH NS DI × pH NS | HLY | 13.7 ± 0.87 | 14.2 ± 0.63 | 14.3 ± 1.04 |
| HLB | 11.2 ± 0.59 | 13.2 ± 0.73 | 12.3 ± 0.95 | ||
| Dry root biomass (g) | DI NS pH NS DI × pH NS | HLY | 12.5 ± 0.74 | 13.0 ± 0.61 | 12.0 ± 1.12 |
| HLB | 6.0 ± 0.68 | 10.8 ± 0.77 | 7.60 ± 1.04 | ||
| Hoagland solution | |||||
| Electrical conductivity (µS/cm) | DI NS pH 0.001 DI × pH 0.009 | HLY | 1488 ± 141 B | 1189 ± 107 B | 1401 ± 203 AB |
| HLB | 1503 ± 32.3 B | 1173 ± 98.8 B | 1602 ± 144 A | ||
Table 2.
Average nutrient concentration (mg·kg−1) with standard deviation in the leaves and the whole tree (combination of leaves, stem, and feeder roots) of healthy (HLY) and Huanglongbing (HLB)-affected trees grown at pH 6.0, 7.0, and 8.0, respectively, at the end of experiment (Day 35). Optimum value for each nutrients in citrus leaves are provided [10]. Significant differences were calculated at p < 0.1 using Tukey test, means followed by different letters are different from each other. Upper case letters correspond to the treatment combinations, while lower case letters correspond to the respective pH treatment and italic lower case letters corresponds to the tree health status.
| Nutrient (mg·kg−1) | Tree Part | HLY | HLB | Optimum Range | p Value | ||||
|---|---|---|---|---|---|---|---|---|---|
| pH 6.0 | pH 7.0 | pH 8.0 | pH 6.0 | pH 7.0 | pH 8.0 | (mg·kg−1) | |||
| N | Leaf | 25500 ± 100 b | 29250 ± 1150 a | 24900 ± 200 b | 26400 ± 100 b | 28700 ± 3300 a | 22150 ± 2250 b | 25,000−27,000 | DI NS pH 0.001 DI × pH NS |
| Whole tree | 60700 ± 1242 D | 66500 ± 245 BC | 63150 ± 911 DC | 72167 ± 3966 A | 70650 ± 1516 AB | 60225 ± 2727 D | DI 0.001 pH 0.001 DI × pH 0.001 | ||
| P | Leaf | 3500 ± 600 B | 5050 ± 50 A | 4700 ± 200 AB | 4050 ± 350 AB | 3650 ± 1150 AB | 3550 ± 450 B | 1200–1600 | DI 0.032 pH NS DI × pH 0.027 |
| Whole tree | 8650 ± 481.3 D | 16183 ± 2697 A | 11775 ± 263 B | 9133 ± 455 DC | 11500 ± 1128 BC | 11600 ± 642 B | DI 0.011 pH 0.001 DI × pH 0.001 | ||
| K | Leaf | 31600 ± 400 | 32450 ± 650 | 34650 ± 1150 | 30200 ± 1700 | 31950 ± 3650 | 32300 ± 2900 | 12000–17000 | DI NS pH NS DI × pH NS |
| Whole tree | 52325 ± 1037 B | 57233 ± 818 AB | 59625 ± 674 A | 61383 ± 3331 A | 57750 ± 4109 AB | 56350 ± 3687 AB | DI 0.07 pH NS DI × pH 0.001 | ||
| Ca | Leaf | 28550 ± 2950 AB | 31600 ± 400 A | 30100 ± 300 AB | 30650 ± 1650 AB | 26650 ± 1850 B | 29400 ± 2500 AB | 30000–49000 | DI NS pH NS DI × pH 0.022 |
| Whole tree | 49750 ± 2339 C | 68183 ± 5958 A | 56425 ± 775 BC | 59133 ± 2590 B | 54775 ± 3570 BC | 58675 ± 3468 B | DI NS pH 0.003 DI × pH 0.001 | ||
| Mg | Leaf | 4550 ± 250 a | 4350 ± 150 a | 3850 ± 250 a | 3500 ± 700 b | 3450 ± 450 b | 3750 ± 250 b | 3000–4900 | DI 0.003 pH NS DI × pH NS |
| Whole tree | 8250 ± 402 | 8500 ± 81.6 | 8475 ± 359 | 8883 ± 706 | 8150 ± 255 | 8075 ± 260 | DI NS pH NS DI × pH NS | ||
| S | Leaf | 4700 ± 800 B | 5900 ± 100 AB | 6850 ± 150 A | 4850 ± 50 B | 4550 ± 1150 B | 5150 ± 450 AB | DI 0.005 pH 0.014 DI × pH 0.048 | |
| Whole tree | 9900 ± 596 C | 11500 ± 81.6 AB | 12325 ± 176 A | 10900 ± 294 BC | 9800 ± 979 C | 10475 ± 614 BC | DI 0.001 pH 0.005 DI × pH 0.001 | ||
| B | Leaf | 70.8 ± 5.20 | 68.8 ± 7.40 | 79.8 ± 1.80 | 72.8 ± 10.6 | 66.9 ± 17.6 | 72.1 ± 9.90 | 36.0–100 | DI NS pH NS DI × pH NS |
| Whole tree | 101.2 ± 4.0 | 101.7 ± 6.9 | 112.6 ± 1.30 | 109.2 ± 10.0 | 99.5 ± 14.5 | 105.2 ± 7.8 | DI NS pH NS DI × pH NS | ||
| Zn | Leaf | 22.4 ± 1.0 A | 20.4 ± 0.40 AB | 17.5 ± 1.30 ABC | 13.1 ± 1.50 C | 16.6 ± 3.20 BC | 17.9 ± 2.80 ABC | 25–100 | DI 0.001 pH NS DI × pH 0.004 |
| Whole tree | 229.7 ± 54.5 BC | 226.4 ± 3.10 BC | 347.8 ± 19.2 A | 272.8 ± 80.9 AB | 331.8 ± 35.9 A | 143.7 ± 7.5 C | DI NS pH NS DI × pH 0.001 | ||
| Mn | Leaf | 8.5 ± 0.90 A | 4.1 ± 0.10 BC | 6.9 ± 0.40 AB | 3.8 ± 1.60 C | 5.7 ± 0.80 ABC | 3.8 ± 1.30 C | 25–100 | DI 0.001 pH NS DI × pH 0.001 |
| Whole tree | 1470 ± 368 a | 1254 ± 151 b | 580.8 ± 10.7 c | 1997 ± 50.2 a | 983.9 ± 72.4 b | 500.9 ± 64.9 c | DI NS pH 0.001 DI × pH NS | ||
| Fe | Leaf | 44.0 ± 6.10 AB | 44.1 ± 1.30 AB | 46.4 ± 6.60 AB | 53.3 ± 4.5 A | 36.3 ± 4.1 B | 51.5 ± 3.0 A | 60–120 | DI NS pH 0.010 DI × pH 0.020 |
| Whole tree | 933.2 ± 199 a | 684.6 ± 55.7 b | 473.6 ± 4.0 c | 966.6 ± 23.7 a | 815.0 ± 25.0 b | 510.0 ± 28.7 c | DI 0.07 pH 0.001 DI × pH NS | ||
| Cu | Leaf | 31.9 ± 17.5 | 31.2 ± 2.7 | 30.7 ± 1.0 | 36.1 ± 7.1 | 28.1 ± 9.0 | 34.1 ± 1.80 | 5.00–6.0 | DI NS pH NS DI × pH NS |
| Whole tree | 84.6 ± 3.10 a | 88.9 ± 7.40 a | 84.5 ± 1.80 a | 82.3 ± 6.3 b | 77.8 ± 12.0 b | 78.9 ± 2.30 b | DI 0.029 pH NS DI × pH NS | ||
Table 3.
Feeder root characteristics with standard deviation of healthy (HLY) and Huanglongbing (HLB)-affected trees grown at pH 6.0, 7.0, and 8.0, respectively, at the end of experiment (Day 35). Significant differences were calculated at p < 0.1 using Tukey test, means followed by different letters are different from each other. Lower case letters correspond to the respective pH treatment.
| Parameters | p Value | Disease | pH 6.0 | pH 7.0 | pH 8.0 |
|---|---|---|---|---|---|
| Average root diameter (mm) | DI NS pH 0.028 DI × pH NS | HLY | 0.68 ± 0.03 b | 0.72 ± 0.03 a | 0.65 ± 0.03 ab |
| HLB | 0.62 ± 0.03 b | 0.70 ± 0.03 a | 0.65 ± 0.06 ab | ||
| Root length < 2 mm (cm) | DI NS pH 0.07 DI × pH NS | HLY | 2959 ± 9.87 a | 1632 ± 489 b | 1360 ± 249 ab |
| HLB | 2805 ± 321 a | 989 ± 212 b | 950 ± 516 ab | ||
| Surface area < 2 mm (cm) | DI NS pH 0.09 DI × pH NS | HLY | 573 ± 309 a | 336 ± 297 b | 331 ± 139 ab |
| HLB | 511 ± 266 a | 197 ± 109 b | 254 ± 132 ab | ||
| Older root area (cm3) | DI NS pH 0.09 DI × pH NS | HLY | 168 ± 87.3 a | 95.9 ± 78.3 b | 103 ± 47.4 ab |
| HLB | 145 ± 74.4 a | 53.9 ± 30.0 b | 67.7 ± 35.1 ab | ||
| New root area (cm3) | DI NS pH NS DI × pH NS | HLY | 33.3 ± 22.5 | 21.6 ± 18.8 | 13.3 ± 3.75 |
| HLB | 32.0 ± 18.6 | 15.0 ± 8.40 | 20.6 ± 11.8 |
Publisher’s Note: MDPI stays neutral with regard to jurisdictional claims in published maps and institutional affiliations. |
© 2021 by the authors. Licensee MDPI, Basel, Switzerland. This article is an open access article distributed under the terms and conditions of the Creative Commons Attribution (CC BY) license (http://creativecommons.org/licenses/by/4.0/).
Share and Cite
MDPI and ACS Style
Shahzad, F.; M. Kadyampakeni, D.; Vashisth, T. Effect of Growing Media pH on Performance of Huanglongbing-Affected Young Citrus Trees. Agronomy 2021, 11, 439. https://0-doi-org.brum.beds.ac.uk/10.3390/agronomy11030439
AMA Style
Shahzad F, M. Kadyampakeni D, Vashisth T. Effect of Growing Media pH on Performance of Huanglongbing-Affected Young Citrus Trees. Agronomy. 2021; 11(3):439. https://0-doi-org.brum.beds.ac.uk/10.3390/agronomy11030439
Chicago/Turabian StyleShahzad, Faisal, Davie M. Kadyampakeni, and Tripti Vashisth. 2021. "Effect of Growing Media pH on Performance of Huanglongbing-Affected Young Citrus Trees" Agronomy 11, no. 3: 439. https://0-doi-org.brum.beds.ac.uk/10.3390/agronomy11030439
Note that from the first issue of 2016, this journal uses article numbers instead of page numbers. See further details here.