1. Introduction
Agri-food trade in the European Union (EU) is one of the most important in the world economy [
1]. In 2019, the EU positioned itself as the world’s largest exporter and the second largest importer of agri-food products. The value of exports increased to 14.7 billion euros in 2019 compared to 2018, while import values increased to 10.7 billion euros [
2]. Both imports and exports have been growing since 2002, contributing to a monthly trade surplus in the agri-food sector of 4.0 billion euros.
According to EUROSTAT data, the demographic situation in the EU reflects an upward growth; since 2008, the population has increased by 13 million inhabitants [
3]. Alongside this population growth, an increase in needs and consumption is associated, especially in the agri-food sector, given the basic need for population feeding, but also in the energy field, as discussed below.
The agri-food industry comprises activities from all economic sectors [
1]. The food supply chain (FSC) begins with stages of the primary sector (agriculture and livestock), which generates by-products (i.e., manure, waffle, cornstalk) and food waste and food loss in the form of low-quality products, damaged production, or products with no commercial value [
4,
5]. In response to the first part of FSC, and primary sector activities, the main crop in the EU is cereal (including rice), which in 2018 was 295.1 million tons, corresponding to 11.3% of global production [
6]. That is why cereal production is particularly influential at European level. In Spain, one of the main producers of the agricultural sector in Europe, an average of 6 million hectares of cereals are grown These are distributed in 38.7% corresponding to barley, 28.9% soft wheat, 15.8% maize, 6.2% oat, 5.7% for durum wheat, 2.9% triticale, 1.7% rye and 0.1% sorghum [
7].
Agricultural activities, as well as livestock and forestry activities, generate in their various stages variable quantities of by-products and waste whose storage, disposal or disposal represents an additional task and source of costs for the producer [
8], as well as constituting an environmental problem by the increasing generation of waste associated with human consumption and population growth. These wastes are considered an under-utilized source of resources as they are produced continuously and renewably [
9]. These residues are, in a very small part, partially valued at different levels (production of biofuel, food and animal bed, composting or building materials) [
10]; however, a significant volume of them is not reused and constitutes a serious problem that negatively affects the overall sustainability of the agricultural sector [
10]. The agricultural waste known as industrial, those that must be eliminated because they are not usable in the area in which they are generated, are in the case of cereal and grain crops, straw [
11]. In Spain, 35.7% of all agricultural waste produced consists of residues from cereal crops (mostly barley, followed by wheat and maize), with annual quantities exceeding 9 million tons [
12].
Within the production of barley in Spain, an important part is intended for its processing into malt. Malting is a process applied to cereal grains, by which they germinate by submerging them in water, then being quickly dried by injection of hot air. During this process, malted grains develop enzymes that convert grain starch into sugar. Barley is the most commonly used cereal for malting because of this reason [
13].
According to the results of the authors, in Spain 320,000 hectares of barley are allocated to the production of malt. This means that 18.850% of barley production (See
Section 3.10.1) is destined for this purpose and is therefore a potential source of straw waste generation, which can be harnessed in some way.
Taking up the problem of population growth previously introduced, it is also associated with an increase in energy consumption (
Figure 1). This growth rate is expected to continue over time. In fact, the International Energy Outlook [
14] predicts a 28% increase in energy consumption for the period 2015–2040. Other agencies such as the International Energy Agency estimate this growth by 35% for the period 2010–2035 [
15]. Of all the energy consumed in Europe in 2017, approximately 80% came from fossil sources [
16] such as coal, oil, natural gas and derivatives. Finding new forms of energy to reduce this dependence on foreign and fossil fuels is strategic. Moreover, given that fossil fuels are known emitters of greenhouse gases, the reduction in their use is not only strategic, but also necessary. In fact, of the 4.66 gigatons of equivalent CO
2 emitted by the EU, 82.8% of emissions came from the energy sector [
16]. These two reasons mark the roadmap for a more renewable energy model [
17].
Both growth in cereal consumption and production, as well as growth in energy consumption, lead to several environmental problems such as increased waste generation, and the possible increase in greenhouse emissions when fossil fuels are used for energy production [
18]. A joint solution for both problems can be provided by Anaerobic Digestion (AD) [
19]. Anaerobic digestion allows the bioconversion of the organic matter present in organic substrates, such as a residue, into biogas (a renewable energy source) via microbiological degradation [
20]. AD also generates a digestate that can be used as fertilizer. In this way, an energy source is obtained by reducing the waste generated and it also creates a circular economy in that process, solving both environmental problems [
21].
AD is a very complex process in which different stages occur simultaneously with different microorganisms [
22], each producing the substrates necessary for the next stage to take place, depending on the substrate composition. It is then important to perfectly know the composition of the substrate to be digested, so that the process development can be determined. In addition, because of the complexity of the AD process, in which different stages occur simultaneously with different microorganisms, a medium in which all influential parameters are controlled is required to ensure a stable environment [
23]. One of the novelties of this study is the use as development of the process indicator, typical variables such as pH combined with the study of the evolution of the hydrogen content generated and consumed during the process. H
2 is intermediate gas that marks with its appearance the beginning of the stages of hydrolysis, acidogenesis and acetogenesis, and with its reduction the development of methanogenesis since it is transformed into methane via hydrogenotrophic methanogenesis, so that monitoring its evolution can also monitor the development of the process.
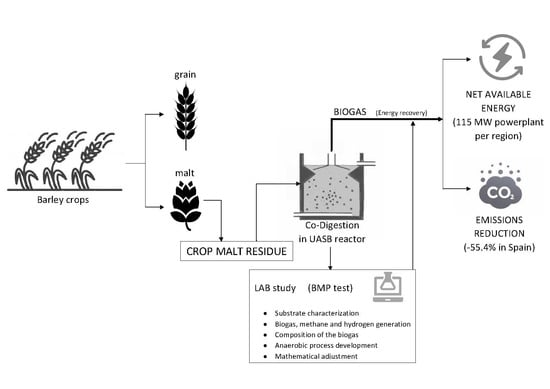
For all of the above, the main objective of this research is to propose and study the feasibility and process development of treatment by anaerobic digestion of crop residues generated during harvest of barley that is intended for malt production (barley straw).
To this end, the substrate is completely characterized, the anaerobic digestion process is analyzed through all phases and processes, focusing on the inhibitions and alterations of the process and the potential for biogas and methane generation is determined. Finally, the amount of energy that can be obtained through this route is estimated, against with the reduction of equivalent CO2 emissions that comes when using this renewable energy source to replace a conventional energy source.
2. Materials and Methods
2.1. Test Samples
The studied substrate is the residue from barley intended for malt production, hereinafter CrM. To avoid variability in the composition of the substrate, a laboratory-generated residue was used. For this purpose, barley of the Hordeum distichon type was used, which undergoes a malting process, keeping the grains moist for 5 days, dried at 40 °C for 24 h and then at 60 °C for one night.
As an inoculum, and therefore the source that provides methane-based and anaerobic biomass to trigger the biomethanization process, sewage sludge from a Wastewater Treatment Plant (WWTP) from Madrid, Spain. To perform the Biochemical Methane Potential (BMP) tests it is recommended to use a stable and easily accessible inoculum [
24]. Fundamental standards such as UNE-EN ISO 11734 and VDI-4630 [
25] recommend using sludge from WWTP. Several authors advise it because of its accessibility and permanence of biomass [
26,
27], including pioneers in conducting Biochemical Methane Potential (BMP) test in 1979 [
28], the following pioneers in the conduct of BMP assays [
29]. In particular, in this study it is a granular sludge from an Upflow Anaerobic Sludge Blanket (UASB) reactor, from an agri-food industry sewage treatment plant. This type of sludge, along with its granule agglomeration characteristic makes it resistant to internal or process alterations [
30].
2.2. Analytical Methods for Compositional Characterization of Samples, Inoculum and Mixture Introduced in the Reactor
One of the sub-objectives of this research is to characterize the substrates in depth to know, draw conclusions and assist in the determination of the development of the process. For this purpose, the CrM substrate and the inoculum are characterized. In addition, the same compositional study is also performed to the mixture of substrate + inoculum introduced into the reactor, before the digestion test and after completion of the BMP test. In this way it can be compared and determined what changes in the composition has caused anaerobic digestion, such as how much organic matter has been degraded, whether the mixture has developed accumulation of (Volatile Fatty Acid) VFA, or how much volatile solids have been degraded.
In particular, the following compositional determinations according to the standardized methods were carried out (
Table 1).
2.3. Biochemical Methane Potential Tests to Determine de Anaerobic Degradation
The Biochemical Methane Potential (BMP) test procedure has been developed in accordance with UNE-EN ISO 11734 [
31], including a gas chromatograph for the measurement of biogas composition. In order to determine the amount of methane produced the UNE-EN ISO 11734 [
31] standard uses manometric methods. The VDI-4630 [
25] procedure has been used to transform the measured pressure inside the reactor into the gas flow generated.
The test conditions were the same as those used on the full scale. Digestion is performed under mesophilic conditions, 37 ± 1 °C, with a ratio between substrate and inoculum of 1:3 m/v, that is, for 300 mL of UASB sludge, 100 g of CrM residue are added for digestion [
25].
Pressure changes inside the reactor are measured daily. Also, a sample of the gas generated in the reactors is extracted daily and analyzed in a gas chromatograph to determine the proportion of methane and hydrogen in the biogas. An Agilent (California, USA) 7820A gas chromatograph (GC) was used with a thermal conductivity detector (TCD), equipped with a Molsieve 5A-CP molecular sieve, and a PoraPLOT Q capillary column. N2 is used as a carrier gas to detect H2 more easily. In addition, by using N2 as a gas to ensure air displacement and anaerobic conditions inside the bottles.
Twenty-one repetitions are made with the aim of obtaining reliable results with the least dispersion possible. Since the substrate is a lab prepared sample, there is no dispersion in the results due to it. The only dispersion variable is the inoculum, which, as discussed, is obtained from a UASB reactor from a WWTP. However, attempts have been made to minimize this dispersion by taking inoculum samples on the same days of the week, when the level of production was similar and the characterization of the inoculum too.
2.4. Statistical Analysis of Results
As the tests were repeated 21 times, a statistical analysis was necessary to determine the dispersion between them is so large that there is no relationship, an ANOVA statistical analysis with a 95% confidence level is performed accompanied by their respective DMS and Tukey contrasts. The starting hypotheses are H0 = Equality between curves, and H1 = Inequality between curves.
Some descriptive statistics are also calculated to help determine the level of dispersion between the results. For this purpose, a visual method is used using box diagrams and a quantitative method through Analysis of the Coefficient of Variation (CV).
2.5. Mathematical Adjustment and Determinations of Results
Once the results are obtained these are treated mathematically. Methane generation curves are treated as first-order kinetics, according to the described process by Veeken and Hamlers [
32]. The disintegration constant (k
dis) can be obtained directly by considering the complete anaerobic digestion process, giving information about the depth and speed of the hydrolysis process. Also, maximum amount of actual methane obtained in the process (CH
4max) can be determined, adjusting the generation data by means of least squares, to a first order kinetics reaction:
where CH
4(t) represents the production of methane on the t-day; CH
4max the maximum generation of methane recorded (which can be assumed by the latest generation); and k
dis the average disintegration constant measured in days
−1.
The theoretical generation of methane that was to be expected after anaerobic degradation of the substrate can be obtained from the reduction of COD experienced before and after the BMP test.
where COD
0 and COD
f represents the COD levels measured at baseline at the end of the BMP test expressed in mg/l; V
test the test volume occupied by the mixture substrate + sludge expressed in litters; 340 the conversion factor of COD in methane; and 1/0.9869 the conversion factor from standard conditions (0 °C and 1 bar) to normal conditions (0 °C and 1 atm).
The level of degradation of the substrate or residue can be calculated analytically through the COD reduction degradation levels and provides information about the level of the degradation of the substrate, regardless of degradation inoculum.
2.6. Energy Suitability of the Proposed Process: Energy Balance Analysis
One of the objectives to be covered by this research is to determine whether the proposed solution (anaerobic treatment of barley crop residues) is highly cost-effective. To do this, it analyses its potential, taking into account the energy generated in form of biogas, the needs that must be met in the process, and whether there is energy available for external uses.
The procedure has been developed according to the one described by the authors in the article [
33], which in turn is based on the one described in [
19]. Firstly, analyses and calculates the energy needs of the anaerobic process. Subsequently, with the laboratory data obtained in this research calculates the energy available in the biogas generated, depending on the amount of biogas that is produced and its methane content. Finally, it is determined whether net energy available for external uses exists or not, once the needs of the process (heat demand and electricity demand) have been met, for example for supply in the residential sector. In this way, if net available energy exists, the process would be considered as energy efficient.
2.7. Environmental Suitability of the Proposed Process: Emissions Reduction by Using Generated Biogas as an Energy Source Rather Than a Conventional Fossil Fuel
The objective of this section is to estimate the reduction in emissions that would occur if it is decided to use the biogas generated in the proposed solution as an energy source, rather than obtaining such energy by conventional means in the combustion of a fossil fuel. To this end, the “Methodology for thermal energy projects aimed at reducing the consumption of fossil fuels in a new or existing facility” [
34], developed by the Carbon Fund for a Sustainable Economy (FES-CO
2) of the Spanish Ministry of Environment, has been followed.
The methodology is based on calculating the emission reductions associated with the project as the difference between emissions from a base scenario (final energy is obtained through the burning of natural gas) and project emissions (the final energy is obtained by burning the generated methane).
3. Results and Discussion
3.1. Characterization of Samples, Substrates, Inoculum and Mixtures in the Digester
Studying the characterization of substrates, of the inoculum and from the mixture that exists in the digester, before and at the end of the BMP test, is essential to understand the development of the process and to be able to make decisions about the results obtained during the AD process. All tests have been conducted as described in
Section 2.2, and the results are shown below.
Table 2 shows characterization results of the substrate (CrM), of the inoculum (S) and the mixture in the digester (CrM + S) before the BMP test, and after completion of the latter at 20 days. All results are indicated in the respective units, per gram of substrate, or per milliliter of sludge or reactor mix.
CrM substrate is presented as a substrate with a high humidity level (62.60%) which makes its solubilization, in principle, easy and the process fast and profound. If the LPCH content is compared, it is observed that it is a carbohydrate-type substrate, especially rich in simple cellulose-type carbohydrates. The digestion of this type of substrate is stable and fast, but with the likelihood of releasing VFA during its digestion from the acid digestion of monosaccharides and other simple carbohydrates. However, because of the presence of a certain protein content, a small amount of ammoniacal nitrogen is likely to be released that can compensate by acting as a buffer for the slight acidification caused by VFA. In terms of COD it is a relatively rich substrate in carbonous matter and organic matter, with a particularly high solubility (of 58.81%), indicating that, of the entire COD, almost 60% is directly accessible to microorganisms without the need to hydrolyze or release from encapsulation due to being a particulate substrate. For this easy accessibility, a rapid degradation is expected, even though the inoculum is a granular UASB sludge, difficult to solubilize. In terms of nitrogen content, it is not very high. It is distributed in ON that comes from the light protein content, and in AN, whose content is not excessive, in fact, is below the limit of accumulation studied (2 g/L), so it is expected that the AN will be released as a buffer for pH control and compensate for possible acidifications, without accumulating and ending up inhibiting the process by excess ammonia in the reactor. The CrM material has a C/N ratio of 12.33, which is close to the optimal C/N ratio (approx. 20) [
33,
35,
36] to ensure stable digestion so it is expected that the process will have alterations, but without impact, such as a release of VFA due to the carbohydrate content, compensated with a slight release of ammoniacal nitrogen that will act as buffer dampening its effect.
Analyzing changes in the composition of the mixture in the reactor, before and after the BMP test, it can be observed that the humidity has been slightly reduced, by −8.50%, which is logical when it comes to anaerobic, closed, and wet digestion digesters, as is the case of a UASB digester specially designed for liquid substrates. The reduction of vs. and TS is very remarkable, of −51.82% and −55.11% respectively, which gives an idea that the process has developed correctly because the organic matter present in solids form has been digested. The reduction of COD has been very low, of −10.31%, indicating that, although the digestion process has been correct, the methanization has not been completely profound (later it will be analyzed with the content in methane, since the carbon contained in the COD is the one that is transformed into methane). However, the reduction in CODf has been very noticeable, of −55.61%, indicating that, although only 10% of the COD has been reduced to be converted into methane, this has been practically a reduction in COD that is not encapsulated, and is therefore directly accessible to micro-strategies. This means that the methanization process has not been complete, by a failure of the disintegration + hydrolysis stage, which will provide a lower-than-expected methane content, below 60% which is considered the stable development limit. According to the nitrogen content, TKN is slightly increased by 3.89% by the release of some of the nitrogen encapsulated in the proteins, the ON. In fact, the ON is reduced by −9.75% precisely by the release of this nitrogen, by degrading the proteins. For its part, the AN is increased by 28.29% when the ON is released, until it reaches a value of 1.24 mg/mL, falling below the accumulation limit (2 g/L) in this way it is expected that the released ammoniacal nitrogen will act as a buffer, dampening any acidification, for example, that coming from the release of VFA when digesting carbohydrates. The initial and final pH values are very similar; however, they are expected to have varied during the 20 days of process. As for alkalinity, TA is increased by 43.92%, giving an idea of the stability of the process. Intermediate alkalinity is also increased by 64.94%, indicating that either no VFA has been released, or on the contrary these have been neutralized by the buffer effect of the released AN.
All these assumptions should be checked later with the analysis of the process that develops.
3.2. Biogas Production
To determine biogas production, the internal pressure generated inside the digesters during the development of BMP tests is measured, and then translated into the volume of gas generated, as described in
Section 2.3.
The most convenient measure to express biogas generation is gross production, that is, biogas generated by a certain amount of waste. However, several authors [
37,
38] recommend expressing it in terms of specific production, that is, in biogas generation for each vs. containing the residue, in this way it can be compared with another substrate more quickly. Therefore, the results are commented based on gross production but are also displayed based on specific production.
As shown in
Figure 1, biogas generation is completed on day 10, producing an average of 1604 (±19.980%) NmL of biogas measured under normal conditions, per 100 g of digested CrM residue (
Table 3). Although there are some failed assays, based on the results of the ANOVA analysis developed, all curves can be considered equal and assumed by the mean curve. This is because, after performing the ANOVA analysis, the significance level is, in all curves except those that the process has been failed, 1000, so that the null assumption of average equality can be accepted, and therefore all curves equal to the mean curve can be assumed. This convergence of results was to be expected since the substrate to be treated, as advanced in
Section 3.1 is a substrate rich in simple carbohydrates, which gives it the property to generate stable digestions.
Figure 1 shows the average curve of all the 21 curves obtained, which can be assumed as determined by the ANOVA analysis. It can be seen in them that the initial part of the curves, there are two clearly differentiated slope changes. During the first day there is a delay, and on days 1–4 there is a linear generation, which stops until day 8–9 in which generation resumes to stabilize on day 12. Although it will be demonstrated later in the analysis of the results of the following sections, it is an indicator that anaerobic digestion occurs in two phases. Given the characteristic particulate substrate, in the first place the organic matter is digested directly accessible, that is, the solubilized, and subsequently, after hydrolyzing the particulate matter, it begins to digest it. This assumption will be demonstrated later with the joint analysis of all the variables studied, especially with the evolution of hydrogen, as well as evolutions and compositional changes.
If the generation of biogas is compared with that obtained by the inoculum alone, the effect of adding the CrM substrate has been positive, by increasing the generation of gas by 311.33%, from the 390 mL of biogas produced by the inoculum to the 1604.22 NmL produced in joint digestion and by increasing the process speed, as you can see by comparing the slope of the start of the curves.
As for the specific production of biogas, the conclusions obtained are analogous to those of gross biogas production, as well as their curves, which are proportional. Specific production is nothing more than the production of biogas expressed, not by amount of gross waste, but for each gram of volatile solid contained in the residue, hence the curves are proportional. Specific production, as shown in
Table 3, is estimated at 63,058 NmL of biogas per gram of vs. of CrM waste introduced into the reactor.
3.3. Methane Production
Figure 2 represents all the mean methane generation curves obtained during BMP tests. According to the ANOVA analysis performed, all curves can be assumed by the average curve, so this one will be used for the study, along with the error bars and the diagram of boxes and whiskers. The shape of the curves and the information obtained from them is similar to that obtained in biogas generation curves. Digestion occurs in the same way and clearly in two phases, and the stabilization of the process and therefore the generation of methane occurs around 10 days. In particular, the generation of methane obtained is 458.550 (±24.838%) Biogas NmL measured under normal conditions, per 100 g of digested CrM residue (
Table 3).
Although the dispersion between curves is similar to that obtained in the production of biogas, as inferred from the box and whisker diagram depicted in
Figure 1 and
Figure 2 the descriptive statistics in
Table 3 show that this variability between curves is not pronounced, in fact the dispersion between methane generation curves is less than the deviation between biodegradability curves or biogas production. It follows then that the process is quite stable, and the changes between them are not due to failures in the process, but to changes in the proportion of methane in biogas, which is a good indicator of the stability and development of the process and is therefore studied in a section of its own.
As for the specific production of methane, this is determined at 18.024 NmL of methanol per gram of vs. of CrM residue introduced into the reactor.
3.4. Methane Content of Biogas Generated
It can be seen in
Figure 3 that the proportion of methane in biogas begins to detect something before the first day, begins to grow until day 5, slows slightly, resumes until moderately stabilized on day 10. The curves converge around 27% of methane. This double growth and observed slope change reconfirms the two-phase digestion phenomenon that occurs, a first phase in which directly accessible organic matter is digested, and secondly particulate or encapsulated organic matter, although this must be corroborated with a somewhat more thorough analysis such as the evolution of H
2 to be done in subsequent sections.
As noted, and as seen in the mean curve of
Figure 4, the average methane content in the generated biogas is 27.485 (±16.201%) % of CH
4, resulting in an increase of 128.098% compared to the methane content of the biogas generated by the inoculum, so it is inferred again that the effect of adding CrM substrate has been positive.
The methane content is below 60%, which is the limit considered acceptable for a stable and deeply developed process. In this case it is around 30%, so the process is inferred that it is not entirely complete, as indicated in previous paragraphs and is probably due to low degradation levels, which will be demonstrated later with the mathematical analyses and determinations including the level of biodegradation of the substrate. In this case it has already been indicated that there is first digestion, only of the organic matter directly accessible or solubilized, and subsequently the encapsulation, which will logically not be digested in depth or in full (and will be determined by the analysis of the level of degradation of the substrate). Although some of the results of previous research conducted by other authors yield similar values of methane content, this study explains by the nature of the inoculum, a granular UASB substrate, specially designed to digest solubilized organic matter, and that its characteristic of granule grouping makes the hydrolysis of particulate matter complicated, since microorganisms and hydrolytic enzymes, grouped in a granule have fewer freedoms and the ability to adhere to the walls of the particulate substrate and start hydrolyzing it, being easier directly to act with that COD that is solubilized and directly accessible (CODf).
3.5. Hydrogen Production
Hydrogen generation occurs once hydrolysis has been completed and the acidic stages of acidogenesis and acetogenesis begin, which will consequently become CH4 through acetoclastic methanogenesis. Hydrogen once generated begins to disappear when it is transformed into methane using hydrogenotrophic methanogenesis. It is therefore a good indicator of process development and hydrolysis speed, although its use is not widespread as it is difficult to detect and measure against other indicators such as pH. This research will use it for this purpose, providing added value and novelty to the study.
It is to be expected that hydrogen will form during the first few days and the larger its production and the faster the production peak is reached, the faster and deeper the hydrolysis process will be. As soon as hydrogen is generated, that is, as soon as hydrolysis is complete, the production of acidic elements by acidic elements through acidogenesis and acetogenesis begins, so it is accompanied by a decrease in pH. When the peak is reached it is understood that hydrolysis has completed, and when it begins to disappear hydrogen it is inferred that hydrogenotrophic methanogenesis begins. Methanogenesis should also be acetoclastic, that is, it must be formed from acetic acid and acidic elements. If methanogenesis occurs correctly, hydrogen reduction (by its transformation into methane) is accompanied by an increase of pH (by the transformation of acidic elements into methane). Any other development with hydrogen is identified with a process failure, inhibition or stop, for example if hydrogen reduction is slowed and also coincides with a pH that is maintained at low levels, it is understood that there has been a build-up of acidic elements that has led to inhibition of methanogenesis, and the process has been inhibited without methane production through acetoclastic methanogenesis.
Figure 4 represents the average of gross hydrogen generation curves obtained in each BMP test, along with the error bars. The ANOVA analysis demonstrates by the level of significance that in all cases curves can be resembling the middle curve and studying the process through it.
There is a first hydrogen peak on day 3. This means that hydrolysis ends on day 1, and as hydrogen grows the acidic phases begin. The hydrogen generation for this peak is 0.690 (±105.727%) NmL of hydrogen measured under normal conditions, per 100 g of digested CrM residue (
Table 3). The variability of the data is very high, which is logical since production occurs in less than a day and many averages are performed after this period, on days 1–3. In any case, the presence of a maximum hydrogen on day 3 is clear in any test curve. From this day the amount of hydrogen begins to decrease, at a certain rate, the reduction stops between days 4 and 5, and resumes until the 6th day. This change in slope in the reduction of H
2 may be due to some kind of slowdown, which should be studied and determined with subsequent analyses, such as pH evolution, although it is likely to be due to an accumulation of VFA, since this substrate is prone to release them as stated in
Section 3.1.
There is a second peak of H
2 generation on day 9 although lower value (0.330 (±134.450%) NmL for every 100 g of CrM residue introduced into the reactor). The appearance of this second peak may be due; well begins the digestion of particulate organic matter, which has released the components after hydrolyzing the outer membranes of the waste particles; or inhibition of methanogenesis, which subsequently resumes. Both options may be valid given the characteristics of the CrM residue studied in
Section 3.1:
CrM residue is susceptible to release VFA during digestion by having a significant carbohydrate content (although this does not seem likely due to changes occurring in AI, which does not look particularly altered and does not indicate excessive accumulation of VFA).
CrM residue is strongly particulate, with resistant external membranes, especially for its content in lignocellulosic compounds. This will cause CODf to be digested at first, that is, The OM directly solubilized and accessible to microorganisms, and once hydrolysis has developed, the OM or COD that is encapsulated in the substrate begins to be digested.
In terms of specific production, the curves are proportional to those already described, there is a first generation peak on day 3 worth 0.027 (±39.903%) NmL per gram if vs. of CrM residue introduced, and a second peak on day 9 worth 0.033 (±349.718%) NmL for each gram of vs. of CrM waste introduced into the reactor.
3.6. Hydrogen Content of Biogas Produced
Like hydrogen generation, hydrogen content (
Figure 5) can be used as a process indicator. Although methane is one of the final gases of AD and is therefore accumulated, H
2 is an intermediate gas that appears and subsequently transforms into a final compound. The hydrogen ratio of the biogas generated increases in the first few days when hydrolysis, acidogenesis and acetogenesis occur, until the peak is reached as soon as the latter ends. When methanogenesis begins, the ratio of H
2 should drop as hydrogen is transformed into methane by hydrogenotrophic route.
As noted, there are the two peaks described above. The first and most pronounced occurs on day 3 with a hydrogen content of 0.289 (±9.903%) %, and the second occurs on day 9 reaching a hydrogen content of 0.033 (±349.718%) %. The occurrence of these two peaks reconfirms the possibility of two-phase digestion or a slowdown of the process that is subsequently recovered. To determine the reasons why this occurs, and to give a definitive explanation for the development of the process, we go on to study together all the generation curves together with the pH evolution curve, and to analyze them, taking into account the changes in the composition of the mixture at the end of the digestion process.
3.7. Assessment of the Evolution of the Anaerobic Process
Figure 6 represents the biogas, methane and hydrogen generation curves, along with the pH evolution recorded during the CrM residue AD process, and the process as a whole, can be evaluated. It is observed that:
During the first day (day 0–day 1), there is a delay in the generations without a trace of methane or hydrogen, so it is assumed that the phase of disintegration + hydrolysis occurs during the first day.
Between days 1 and 3 hydrogen generation begins until it reaches a peak on day 3. This means that during days 1 to 3 the phases of acidogenesis and acetogenesis occur. In fact, it is associated with a reduction in pH, indicating that acidic elements such as acetic acid and VFA have formed. At that point biogas and methane begin to appear. The growth of methane is slower (with a lower slope) as it is formed only by acetoclastic route.
During days 3–4 hydrogen disappears at a steady rate as methane and biogas continue to grow, indicating that methane is also generated by acetoclastic methanogenesis.
Between days 4 and 5 the reduction of hydrogen stops, and so do biogas and methane, so it is assumed that there is a slowdown of the process and not an inhibition, since it is subsequently resumed. In addition, being associated with a decrease in pH is assumed to be a slowdown by accumulation of acid elements, which is subsequently resumed when the pH is increased again during days 5 to 6. This is due to the small content in AN that is released and acts as a buffer, as expected as studied in
Section 3.1.
From day 6 the second peak of generation and hydrogen appears, which is accompanied by a decrease in pH, so it is understood that the phases of acidogenesis and acetogenesis are resumed and the process of digestion resumes, In fact generations of biogas and methane are also resumed, which occurs mainly by acetoclastic route as the pH is increased by the transformation of the acid elements into methane.
From day 9 hydrogen reduction begins, so it is understood that hydrogenotrophic methanogenesis begins. This is confirmed by the generations of biogas and methane increasing its speed and slope, so methanogenesis is two-way, acetoclastic (pH increases) and hydrogenotrophic (hydrogen content is reduced).
On day 11 hydrogen is completely consumed, continuous methanogenesis by acetoclastic, pH is progressively increased to neutral values.
The process is stabilized on day 12–13 and ends without any inhibition, with correct pH parameters and with an evolution as expected and studied.
For all of the above, the process develops correctly, with a slight acidification by accumulation of acidic elements, but without impacts when it is dampened by the buffer effect of the AN released during the degradation of the small percentage of proteins. There are two phases of digestion, clearly identified by hydrogen peaks and the two pH changes. It is therefore assumed that during the first phase the organic matter is digested directly accessible, and during the second stage part of the non-soluble organic matter begins to hydrolyze.
3.8. Determinations and Mathematical Adjustment of The Anaerobic Process
Depending on the COD values determined before the BMP test and once it has been completed, therefore the degraded COD values are known, along with the values obtained in terms of methane generation, the process can be mathematically adjusted (
Table 4) as studied in
Section 2.5, to extrapolate and compare it with other scenarios.
Based on the initial and final COD values in the reactor mixture, the theoretical production of methane is determined, that is, what is expected to be obtained if the process had been developed correctly and all that degraded COD would have been transformed into methane. This is estimated at 487.879 NmL of methane per 100 g of CrM residue introduced into the digester. The theoretical generation is only 6.396% higher than the average generation obtained, so it is understood that, within the degraded COD, the process has been complete since virtually all the COD consumed in methane has been transformed.
By adjusting the methane generation process to a kinetics of the first order, the maximum generation of methane obtained in all trials, quantified at 458.820 (±106.029%) is obtained. NmL of methane per 100 g of CrM residue, practically identical to the average generation of methane obtained. The disintegration constant, which provides information on the speed of the process and especially hydrolysis, can also be determined. In this case it is estimated at 0.164 days−1, a fairly fast constant compared to other constants of disintegration of other elements, and that allows to compare the speed of the process with that of other substrates. This disintegration constant is an indication of the speed of hydrolysis, but not the depth of the process, for this it is necessary to go to another parameter.
It has been seen that of all the COD digested, almost everything has been transformed into methane, so the process has been robust, and has also been rapid according to the hydrolysis constant, but now arises the question of whether the process has been deep and complete, that is, whether much of the organic matter available in the substrate has been degraded in the substrate, or only a small part has been degraded. To do this, the degradation coefficient of the substrate that provides information on how much COD of the substrate has been biodegraded in the anaerobic process is analyzed. In this case it has been determined at 15.282%, that is, although almost all the degraded COD has been transformed into methane, with respect to the total COD available on the CrM substrate only 15.282%. This indicates that the CODf which is directly accessible to microorganisms has probably been degraded, and subsequently, in the second stage of digestion, part of the COD that is encapsulated in the substrate is digested. It should be remembered that because of its high content of hemicellulose and lignin is a particulate substrate with strong outer membranes that makes it difficult to hydrolysate and release OM. In addition, it should be borne in mind that the nature of UASB sludge is granular, specially thought for wet digestion, combining two factors, that the substrate is strongly particulate by the high content of hemicellulose and lignin, and the granular nature of the inoculum, which complicates the adhesion of hydrolytic enzymes to the substrate. These low levels of degradation would also explain the methane content below 60%. These results open the door to process improvement through techniques such as pre-treated, which improve accessibility to the substrate, breaking the barriers created by lignocellulose and making the particulate and encapsulated COD solubilized and therefore directly accessible.
3.9. Comparison of Results with Previous Literature
This section compares the results obtained with some of previous research. This is intended to check whether the test conditions have been adequate, whether the use of the new process indicators can be reliable, and whether the methodology applied is valid. They also serve to leave the main innovations developed in this manuscript marked. Publications with a considerable time lapse and similar test characteristics have been selected, however they are not the same, since precisely one of the novelties introduced is the use of UASB sludge as an inoculum. The approach of most research is microbiological, not process development, so it is also another point in favor of innovation and original input.
Table 5 shows the results of other research, and in the variables that can be checked, the results are quite similar. It is then confirmed that the new methodology used can be assumed as correct, that the changes introduced are valid and that new information is provided about:
Complete characterization of the substrate and in-depth study of the process development.
UASB sludge can be used as a source of inoculum.
Hydrogen is a reliable indicator of process development.
The mathematical determinations developed are accurate and their results provide valuable information and complete the characterization of the process.
3.10. Study of Full-Scale Application Potential: Energetic Feasibility and Environmental Suitability of the Solution. Releasing Its Potential in Spain
Once the laboratory tests have been developed, the potential of the solution is studied and whether it is applicable on a real scale. To do this, a study will be carried out at the Spanish level, estimating the amount of CrM waste that is generated in each Autonomous Community. Subsequently, and with laboratory results, the amount of energy that is likely to be generated in each region will be estimated, and if once the needs of anaerobic reactors are met, energy is available for external use, for example for residential use, quantifying the number of homes that are estimated to be supplied. In addition, to check whether there is an environmental benefit, the reduction in emissions involved in the use of generated biogas rather than a conventional energy source such as natural gas is quantified.
3.10.1. Estimation of CrM Waste Generation
To estimate the amount of CrM waste generated, the statistics of the
Survey on Areas and Crop Yields (ESYRCE) of the Ministry of Agriculture of Spain are thus determined the number of hectares cultivated of barley in each region, and their yield [
42]. Taking into account the number of hectares of barley used for malt production, and the performance of this process, as specified in the “Guide to Technical Improvements Available in Spain of the Maltese processing sector” [
43] obtains the amount of waste obtained in malting, which is identified with the CrM residue. These results are shown in
Table 6, separating them by region, and next to a color scale map representing the distribution of crops in the Spanish geography.
3.10.2. Estimation of Biogas and Methane Generation in Each Region
Once estimated, CrM production is estimated at the amount of gas and methane that would be generated if this residue is digested in anaerobic digesters. For this purpose, the data obtained in the previous sections, summarized in
Table 6, are used. The results of the estimation of biogas and methane for each region of the Spanish geography are shown in
Table 7. Logically these results are proportional to those of the amount of CrM waste generated, and in those areas where barley production is much higher, more biogas is produced.
3.10.3. Estimation of the Energy Balance and Energy Available for External Uses in Each Region
The calculations in this section have been developed as explained in
Section 2.6. It has been assumed that biogas is generated in anaerobic digesters of 4500 m
3 capacity, and thus determine the heat and electricity needs of the installation. Once covered, it is calculated whether there is excess energy or net available energy.
Figure 7 shows the amount of energy that can be extracted from the biogas generated in each region, the needs required by the installation, and the excess energy that is available for external uses.
Table 8 collects all this data, determines the power of a plant equivalent to that generation and to give more applicability to the results is estimated how many homes could be sufficient in one year with the available energy.
As can be observed, the region that is the most energy capable of obtaining is Castille-La Mancha, which with this solution could become a generating power plant of 115 MW, followed by Aragon and Castile and Leon. The regions that would take the least advantage of this solution are Cantabria, Galicia and Canary Islands, which are precisely the regions that produce the least barley. Precisely for this reason the solution is not energy effective, when generating little amount of barley, the substrate level is low, little biogas is generated and is not enough to meet the needs of the reactors. The energy profitability limit can be set in the case of Murcia, that is, the solution is interesting from an energy point of view in regions that cultivate at least around 6000 hectares of barley and collect at least 1500 tons of CrM waste. As for the amount of homes that could be supplied, this solution is especially attractive for the regions with the highest available energy. For example, Castile-La Mancha could supply more than 10,000 homes in a year
This could be a solution to lack of energy supply or difficult access to energy in certain areas. The Energy Poverty report in Spain 2018 [
44] of the Association of Environ-mental Sciences places the regions of Valencian Community, Murcia, Cantabria, Andalusia and Castile-La Mancha, in this order, as the areas where there is the most inequality in terms of household warming, so this solution could be of help in these regions, with the exception of Cantabria, which, as has been seen, is one of the regions in which this solution is not profitable. It is also interesting for isolated areas, such as the Balearic Islands, as it is an autonomous generation system that takes advantage of local resources.
With this proposal, renewable energy is obtained from a waste to be disposed of, thus meeting the Sustainable Development Goals (SDG) #1 (in terms of energy poverty) #7 on affordable and non-polluting energy, #10 reducing inequalities in access to energy, #12 in sustainable waste management, and #13 of climate action by providing a renewable energy source that reduces emissions into the atmosphere, as demonstrated in the following section.
3.10.4. Estimate of the Reduction in Emissions Involved in the Use of Biogas Generated Instead of a Conventional Source of Natural Gas
Precisely, for the above reason of the impact on the SDG #13, and since this solution fits perfectly into these goals, it is decided to study the environmental benefit that comes with, in terms of reducing CO
2 emissions equivalent. The calculations have been developed in accordance with
Section 2.7 of the methodology, and the results highlight the importance of the use of biogas rather than conventional sources such as natural gas.
The results are shown in
Table 9, and it is confirmed that there is a 55.4% emission reduction if biogas methane is used to generate energy, rather than natural gas. Specifically, it is a reduction of 38,060 tons of CO
2 equivalent at the Spanish level, being more notable in the areas where the most biogas has been generated, with Castile-La Mancha at first position.
It is important, in turn, to take into account that straws are considered biomass according to the Commission Regulation (EU) No 601/2012 of 21 June 2012 on the monitoring and reporting of greenhouse gas emissions […] [
45], so that if they are issued in the combustion process the emissions can be considered zero, which represents a reduction in the impact of global warming in terms of the use of this fuel of 100%, quantified in approximately 68,750 tons of CO
2 equivalent per year less emitted into the atmosphere.
4. Conclusions
This study has determined that the composition of the CrM residue presents it as a residue formed, for the most part, by carbohydrates. It has good solubility and is relatively resistant to pH changes. Despite these positive aspects, its high content of hemicellulose and lignin may compromise the proper development of AD.
It has been determined that the process develops correctly, with a slight accumulation of VFA without impact when it is dampened by the buffer effect of the released AN. With the novelty introduced of the analysis of the evolution of hydrogen it has been possible to determine that the process occurs in two stages, digesting in the first stage the soluble COD, and in the second phase that of the COD that is particulate and not directly accessible. Methanization has been correct, transforming almost all the digested COD into methane. However, only 15.282% of all available COD is digested, due to the strong particulate characteristic of the substrate and the high content in lignin and hemicellulose, which makes it difficult for the for hydrolytic enzymes to adhere to particle membranes and solubilize the enclosed organic compounds; and is also due to the granular nature of the UASB inoculum. This explains why the methane content of the generated biogas is not very high.
Numerically, 100 g of CrM residue generates 1604.22 NmL of biogas, with a methane content of 27.485%. The disintegration constant is 0.164 days−1 and only 15.282% of the substrate is digested. This low level of degradation opens the door to process improvement through techniques such as pre-treatments, which improve accessibility to the substrate, breaking the barriers created by lignocellulose.
As for its applicability at the national scale, it is a particularly interesting solution from the point of view of energy. It has been determined that this solution is beginning to be energy-effective and therefore to produce enough energy available for external uses, in areas that have at least 6000 hectares of planted barley and collect 1500 tons of CrM waste. At best, it can be considered that this solution provides, in a given region, the equivalent of a 115 MW power plant, and could supply 10,000 households per year in that region. It is also considered an energy-efficient solution that complies with the SDGs #1, #7, #10, #12 and #13, and can guarantee access to energy in isolated areas or with supply problems. Not only is it an energy-efficient solution, but also, in the case of SDG #13, it has been estimated that its implementation would result in a 55.4% reduction in emissions if it were to replace a conventional natural gas energy source, reducing 38,060 tons of equivalent CO2 released into the atmosphere at Spanish level (increased to 68,750 tons if zero emissions are considered from the burning of biogas, being a form of biomass).


 ,
, 


