Effects of Irrigation Management on Chipping Potato (Solanum tuberosum L.) Production in the Upper Midwest of the U.S.

Department of Horticulture, University of Wisconsin—Madison, Madison, WI 53706, USA
*
Author to whom correspondence should be addressed.
Agronomy 2021, 11(4), 768; https://0-doi-org.brum.beds.ac.uk/10.3390/agronomy11040768
Submission received: 19 March 2021
/
Revised: 12 April 2021
/
Accepted: 12 April 2021
/
Published: 14 April 2021
(This article belongs to the Section Water Use and Irrigation)
Abstract
:Irrigation is required for profitable commercial potato (Solanum tuberosum L.) production. Excessive or deficit soil water availability during the growing season can have adverse effects on tuber yield, quality, and storability. A field study was conducted during the 2018 and 2019 field and storage seasons in Central Wisconsin, a region in the U.S. with a high volume of potato production, to evaluate the impacts of different irrigation rates on three chipping potato varieties, Hodag, Lamoka, and Snowden. The treatments were implemented during the late-tuber bulking and tuber maturation growth stages, and consisted of irrigation at 125%, 100%, 75%, and 50% of crop evapotranspiration (ET). Irrigation before the treatment period was at 100%ET for all plots. With the industry standard irrigation practice being at 100%ET, other treatments were designated as over-irrigation or deficit irrigation. The impact of these watering rates on tuber yield and quality was evaluated at harvest, and tuber storage quality was assessed by measuring chip fry color and sugar concentrations at 0, 4, and 8 months of storage. It was found that compared to the standard practice, the over-irrigation treatment at 125%ET when tubers reached late bulking resulted in no significant increase in total yield, marketable yield, tuber quality at harvest and during storage, as well as reduced irrigation efficiency (IE) and water-use efficiency (WUE). This treatment also increased nitrate leaching potential in both years. In comparison, deficit irrigation at 75%ET or even 50%ET during the late season had no impact on tuber growth, could increase IE and WUE in one of the two years, and showed reduced drainage. In both years, irrigation rate had no significant effects on hollow heart incidence, tuber specific gravity at harvest, and fry quality during the 8-month storage period. This study suggested that over-irrigation was not beneficial for potato production in Central Wisconsin of the U.S., and deficit irrigation during late tuber bulking and tuber maturation stages could potentially result in more sustainable water use while not penalizing tuber yield, quality and storability of chipping potatoes.
1. Introduction
Water is the most important compound in an active plant and constitutes more than 80% of the growing tissue [1]. Water for crop irrigation is becoming both scarce and expensive, making it essential for the growers to utilize precious water resource more sustainably [2]. Wisconsin ranks as No. 3 in the U.S. for its potato production, and the Central Sands region produces the majority of the state’s potatoes [3,4]. The Central Sands is a sandy outwash plain featured by extremely coarse texture (90% sand) with a low soil organic matter content (<10 g kg−1) and a relatively shallow groundwater table (0.9–11 m) [5]. Nearly all of the irrigation water in the Central Sands is derived from groundwater. The impact of irrigation on depth of groundwater has become increasingly scrutinized in recent years [6]. Groundwater is a critical resource that must be preserved for long-term viability of the potato and vegetable industry and the local economy, and efficient water management will be crucial for preservation of the invaluable groundwater resource in this region [7].
Potato (Solanum tuberosum L.) is a shallow rooted crop that is often grown on soils with low to medium water-holding capacities and is extremely sensitive to water stress [8,9]. Because of its high economic value, growers may tend to apply more-than-enough amounts of water as an “insurance” to minimize potato production risks [10]. However, tuber yield, size, grade, and internal and external quality can all be negatively impacted by either over- or under-irrigation [11]. Yield sensitivity to under-irrigation is attributed to the combination of the susceptibility of potato plants to water stress, particularly during the early tuber bulking stages, and their shallow roots, which can result in limited soil water storage [12]. Yield reductions due to over-irrigation may occur caused by poor soil aeration, increased disease pressure, and leaching of nutrients from the shallow rooting zone [13]. Efficient irrigation management should avoid both over- and under-irrigation, and aim to improve tuber yield and quality while reducing production costs for the growers by conserving water, energy, and soil mobile nutrients, as well as reducing the risk of potential groundwater contamination and environmental degradation [11].
Among the many efficient irrigation management practices, deficit irrigation (DI) is considered as a strategic option. DI irrigates the crops with an amount of water less than the potential evapotranspiration (ET) and the minor stress that has minimal effects on yield during certain growing stages of the crops [14]. Because close to 20,000 hectares of potatoes are grown in Central Wisconsin, and potatoes in this region normally receive 38–48 cm of irrigation water per season, saving of even 25% of irrigation by DI would substantially reduce groundwater withdrawal and conserve water for future use.
The tuber bulking stage is the growth period in which tuber cells expand with the accumulation of water, nutrients, and carbohydrates. During this phase, tuber growth rates are relatively linear as sucrose moves from the leaves to the tubers and is converted to starch [15]. The last phase of potato development is the tuber maturation stage, which is characterized by canopy decline and slow rate of tuber growth [16]. Many studies have indicated that water stress during early tuber bulking can decrease tuber yield and quality [12,17,18,19]. However, few data are available regarding the impact of irrigation on the latter part of tuber bulking stage and the tuber maturation stage.
The objective of this study was to evaluate the yield, quality, irrigation efficiency, water use efficiency, and post-harvest storability of common U.S. chipping potato varieties that received different irrigation treatments during the late tuber bulking and tuber maturation growth stages. The overarching goal is to explore sustainable irrigation management practices, save operation cost associated with unnecessary irrigation, and improve growers’ stewardship of the natural water resource for potato production.
2. Materials and Methods
2.1. Experimental Design and Agronomic Practices
This study took place over the course of the 2018 and 2019 field and storage seasons at the University of Wisconsin Hancock Agricultural Research Station (HARS) in Hancock, WI (latitude: 44°12.1413 N; longitude 89°53.6840 W; elevation 328 m). The soil type of the field was a loamy fine sand (organic matter < 1%) from a depth of 0 to 45 cm and was a fine sand (organic matter < 0.5%) from a depth of 45 to 75 cm. Soils in the area have an average permanent wilting point of 0.055 m3 m−3, an average field capacity of 0.162 m3 m−3, and an average available water content of 0.107 m3 m−3 [20].
This experiment was a split-plot design with complete randomization, replicated four times. The irrigation rates were randomized to each whole plot, and they are listed in Table 1. Three chipping potato varieties, Snowden, Lamoka and Hodag, were then randomized to each sub-plot. Snowden and Lamoka are publicly available chipping varieties in the U.S., and Hodag is a newly released chipping variety created by the University of Wisconsin potato breeding program. Each sub-plot contained four 7.6-m rows of each variety with 0.3-m seed spacing and 0.9-m row spacing. For each variety, the outer two rows were border rows to mitigate any variations resulting from edge effects, and the inner two rows were dug for at-harvest and post-harvest sampling. A detailed field map of the 2018 study can be found in the Supplemental figure. A weather station (Campbell Scientific, Logan, UT, USA) was located within 500 m of the experimental plots to record precipitation, maximum and minimum soil temperature, and other weather conditions on a daily basis.
Seed potato pieces with an average weight of 71 g were planted on 1 and 2 May in 2018, and on 3 and 6 May in 2019. Emergence occurred on or around 20 May, and tuber initiation took place in the first week of June in each year. Irrigation management was performed by a linear overhead nozzle-controlled variable rate irrigation (VRI) system. Watering at 100% evapotranspiration (ET) is a standard practice at HARS as well as in the Wisconsin potato industry. In both years, all plots received irrigation at 100%ET before 25 July, which was the beginning of the irrigation treatment period. 25 July was chosen as it represented the average date across the three varieties to reach late tuber bulking. 20 August was chosen as the date to change application rates in treatment 5 (Table 1) because it was during the tuber maturation stage. All irrigation treatments ended at vine kill, which occurred on 10 September in 2018 and 9 September in 2019. The vine kill date was 14 days before harvest. Daily potential ET was estimated by the Wisconsin Irrigation Scheduling Program (WISP), where air temperature, relative humidity, wind speed, and cloud cover are used as inputs in the Priestley–Taylor equation. Potential ET values are then adjusted using the current crop canopy cover percentage. This ET estimation method was originally developed for potatoes, although it is not crop specific. WISP uses the latitude and longitude of the field location to pull relevant weather information from the University of Wisconsin-Extension’s system of weather databases, which is a compilation of data from weather stations across the region.
For the standard irrigation treatment, the target soil moisture was 80% of field capacity, which is necessary to meet crop water needs when irrigating at 100%ET. Using WISP to make decisions, irrigation applications occurred when the farm manager determined that the soil water content would soon drop below the allowable depletion range. At that time, the crop would be irrigated to 80% field capacity.
Daily soil water balance was calculated to estimate percolation below the rooting zone using the approach outlined by Bohman et al. [21]. In this approach, daily drainage (Di) was estimated to be the difference between input of daily precipitation (Pi) and daily irrigation (IRRi), output of daily crop evapotranspiration (ETi), and daily change in soil moisture storage (ΔSi) (Equation (1)). In this framework, the sum of ΔSi and the soil moisture storage on the previous day (Si−1) cannot exceed field capacity (FC). This implies that Di equals to the quantity of soil moisture in excess of FC, and leaching of excess soil moisture takes place within a 24-h period:
D𝑖 = 𝑃𝑖 + IRR𝑖 − ET𝑖 − Δ𝑆𝑖, where Δ𝑆𝑖 + 𝑆𝑖−1 ≤ FC
All other cultural practices, including fertilization and pest management, were based on the University of Wisconsin-Madison Extension’s recommendation [22]. Total nitrogen applied was 340 kg N ha−1, and application was split between planting, hilling, tuber initiation, canopy closure, early tuber bulking, and mid tuber bulking.
To monitor soil moisture content during the growing season, one water content reflectometer sensor (WCR) (model CS616, Campbell Scientific, Logan, UT, USA) was calibrated to the soil of the field and was installed at each of the two soil depths (30 cm as topsoil and 60 cm as subsoil) in representative plots for each irrigation treatment, so there were 8 sensors in 2018 and 10 sensors in 2019. Each WCR sensors recorded soil volumetric water content at 15-min intervals to a datalogger. Due to high operation cost, there were not multiple replications of each set of WCR sensors. As a result, these data were used for general management decisions and not for statistical analysis.
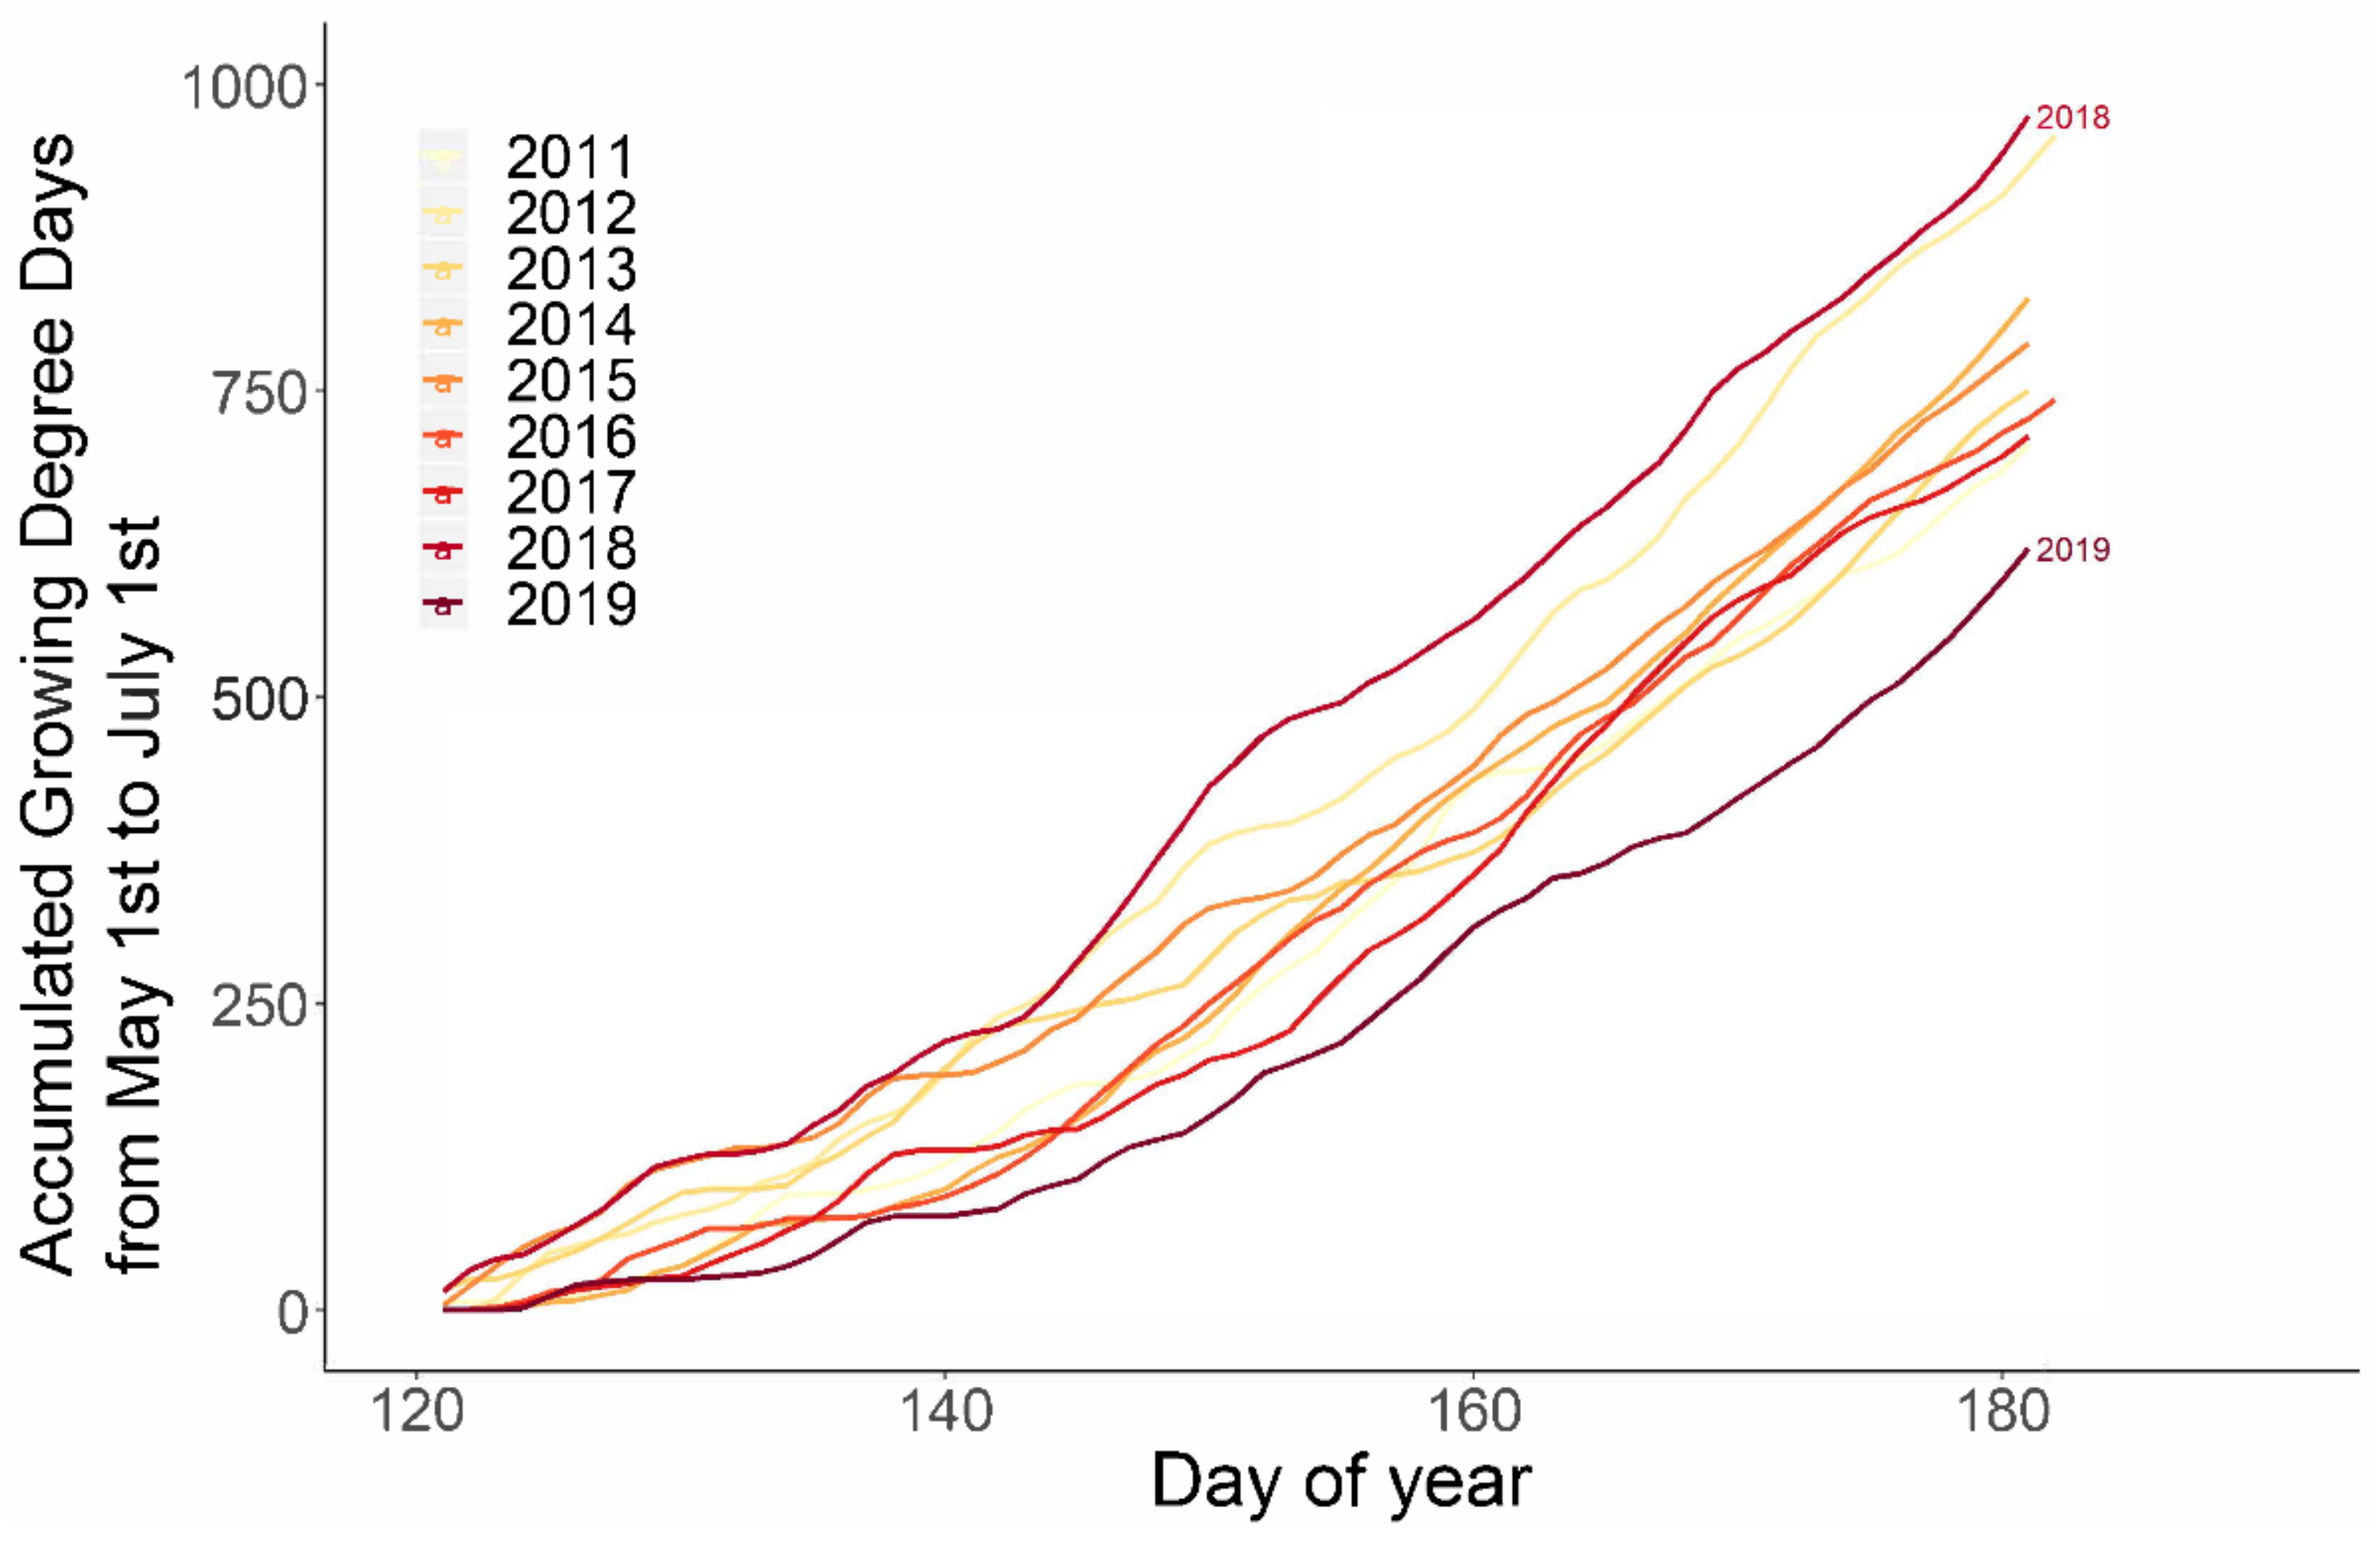
Accumulated growing degree days (GDD) were calculated from 1 May to 1 July in 2011 to 2019 using the formula GDD = [(minT + maxT)/2 to 7 °C] (Sands et al., 1979).
2.2. Harvest Practices
All sub-plots were harvested on 24 September 2018 and 23 September 2019 using a two-row digger (Gallenberg Technologies, Antigo, WI, USA). The tubers were washed and graded for their individual weight using an AgRay Vision X-ray grading machine (AgRay Vision, Acampo, CA, USA). Tubers that were misshapen, rotten, or green due to sunlight exposure were culled before being graded. Cull weights were recorded in their own category and counted towards total yield from each plot.
Grading was categorized following the size profile based on tuber diameter: 0–4.76 cm, 4.76–8.89 cm, and greater than 8.89 cm. Marketable yield was then calculated as the yield of non-culled tubers with diameter between 4.76 and 8.89 cm.
Ten marketable tubers from each sub-plot were randomly chosen to determine specific gravity as well as internal defects. Specific gravity was measured using a Weltech PW-2050 Dry Matter Assessment System. After taking the weight of a 2000–3000 g sample of tubers in the air and in water, the system used the following formula to calculate the specific gravity for the sample (Murphy and Goven, 1959):
To assess internal defects, a separate sample of 10 tubers (4.76–8.89 cm) from each sub-plot were cut in half from stem end to bud end to evaluate incidence of hollow heart.
Irrigation efficiency (IE) was defined as the ratio of the yield produced by the crop to the amount of water supplied to the crop through irrigation. IE was calculated as yield (in megagrams per hectare) divided by the total amount of irrigated water (with a unit of cm) applied over the course of the entire growing season. Water-use efficiency (WUE) was defined as the ratio of the yield produced by the crop to the amount of water (irrigation and precipitation) supplied to the crop. WUE was calculated as yield divided by the total amount of precipitation and irrigation in the entire growing season. Both total yield and marketable yield were used for these calculations.
2.3. Storage Management
After harvest, about 20 kg of healthy potatoes from each sub-plot were placed into the University of Wisconsin Hancock Potato Storage Research Facility, which was maintained at 12.8 °C for the purpose of wound healing for 30 days. Temperatures were then decreased at a rate of 0.3 °C per day to a final holding temperature of 8.9 °C. The sprout inhibitor, isopropyl N-(3-chlorophenyl)carbamate (CIPC, Decco Chemical, at 78.6% active ingredient), was applied to all tubers as a thermal aerosol at a rate of 22 mg kg−1 right before ramping temperature down to the holding temperature. Relative humidity was maintained at 95 ± 3% and CO2 level was kept below 2000 mg m−3 throughout the entire duration of storage. Fry quality data of the three varieties were collected at harvest, and 16 and 32 weeks after harvest in both years.
2.4. Fry Color Analysis
At each sampling point, 10 tubers from each sub-plot were cut in half lengthwise. Three 1-mm thick slices through the stolon attachment point were removed from one half-tuber using a customized cutter and fried in vegetable oil at 185 °C for 2 min 10 s or until bubbling ceased. Fried chips were crushed for fry color analysis indicated by Hunter L-values using a D25LT colorimeter (HunterLab, Reston, VA, USA). Hunter L-values from 0 to 50 indicate dark chip fry color, and those from 51 to 100 indicate light chip fry color. Samples with Hunter L-values of 55 or higher are acceptable to the U.S. potato chip processing industry. Fry color at harvest in 2019 was not tested due to equipment breakdown.
2.5. Sugar Analysis
Sucrose and glucose concentrations were determined on the same 10-tuber sample used for the fry color determination by the method of Sowokinosetal [23] with modifications. Two hundred grams of tuber samples were cut from the center of the tubers. Samples were then juiced using an Acme Supreme Juicerator (Acme Equipment, Spring Hill, FL, USA) mixed with a 50 mM phosphate buffer. The samples were placed in a refrigerator for a minimum of 30 min, then a 1 mL sample from the top of the container was extracted. A YSI 2900 Select Biochemistry Analyzer (Sigma-Aldrich, St. Louis, MO, USA) was used to analyze sucrose and glucose concentration.
2.6. Data Analysis
Data analysis for the data collected at harvest was performed following a split-plot design. Fixed effects included irrigation rate, variety, and their interaction. Random effects included replicated blocks within the whole plot. Data from 2018 and 2019 seasons were analyzed separately due to significant interaction between year and the irrigation treatment. Analysis of variance (ANOVA) was conducted in R (version 3.6, R Foundation for Statistical Computing, Vienna, Austria) using the ‘sp.plot’ function from the ‘agricolae’ package [24,25]. The sp.plot function automatically specifies fixed and random effects in a split-plot design based on the order that the factors are input into the script. Means were separated using a protected Tukey’s honestly significant difference (HSD) test at the α = 0.05 level. This test was performed with the ‘HSD.test’ function from the ‘agricolae’ package [25]. To assess the effect of storage length on storage quality of tubers harvested from each replication of irrigation rate by variety combination, data were analyzed using the SAS (version 3.8, SAS Institute Inc., Cary, NC, USA) PROC MIXED procedure as a split-split plot in time, with repetition*irrigation specifying the whole plot and repetition*irrigation*variety specifying the subplot as random and ‘storage length’ time repeated with an Autoregressive(1) covariance structure [26].
3. Results
3.1. In-Season Weather, Irrigation, and Soil Moisture
Accumulated growing degree days (GDD) from 1 May to 1 July from 2011 to 2019 are shown in Figure 1. For potatoes grown in Wisconsin, the period between 1 May and 1 July is the most critical for tuber sprouting, tuber initiation and early tuber bulking, all of which are directly correlated with final tuber yield and quality. The year of 2018 had the most GDD between planting and early tuber bulking during this 9-year period, whereas the year of 2019 showed the least. The result suggests that the two seasons when the study was conducted covered a range of extreme growing conditions in central Wisconsin over the last 9 years.
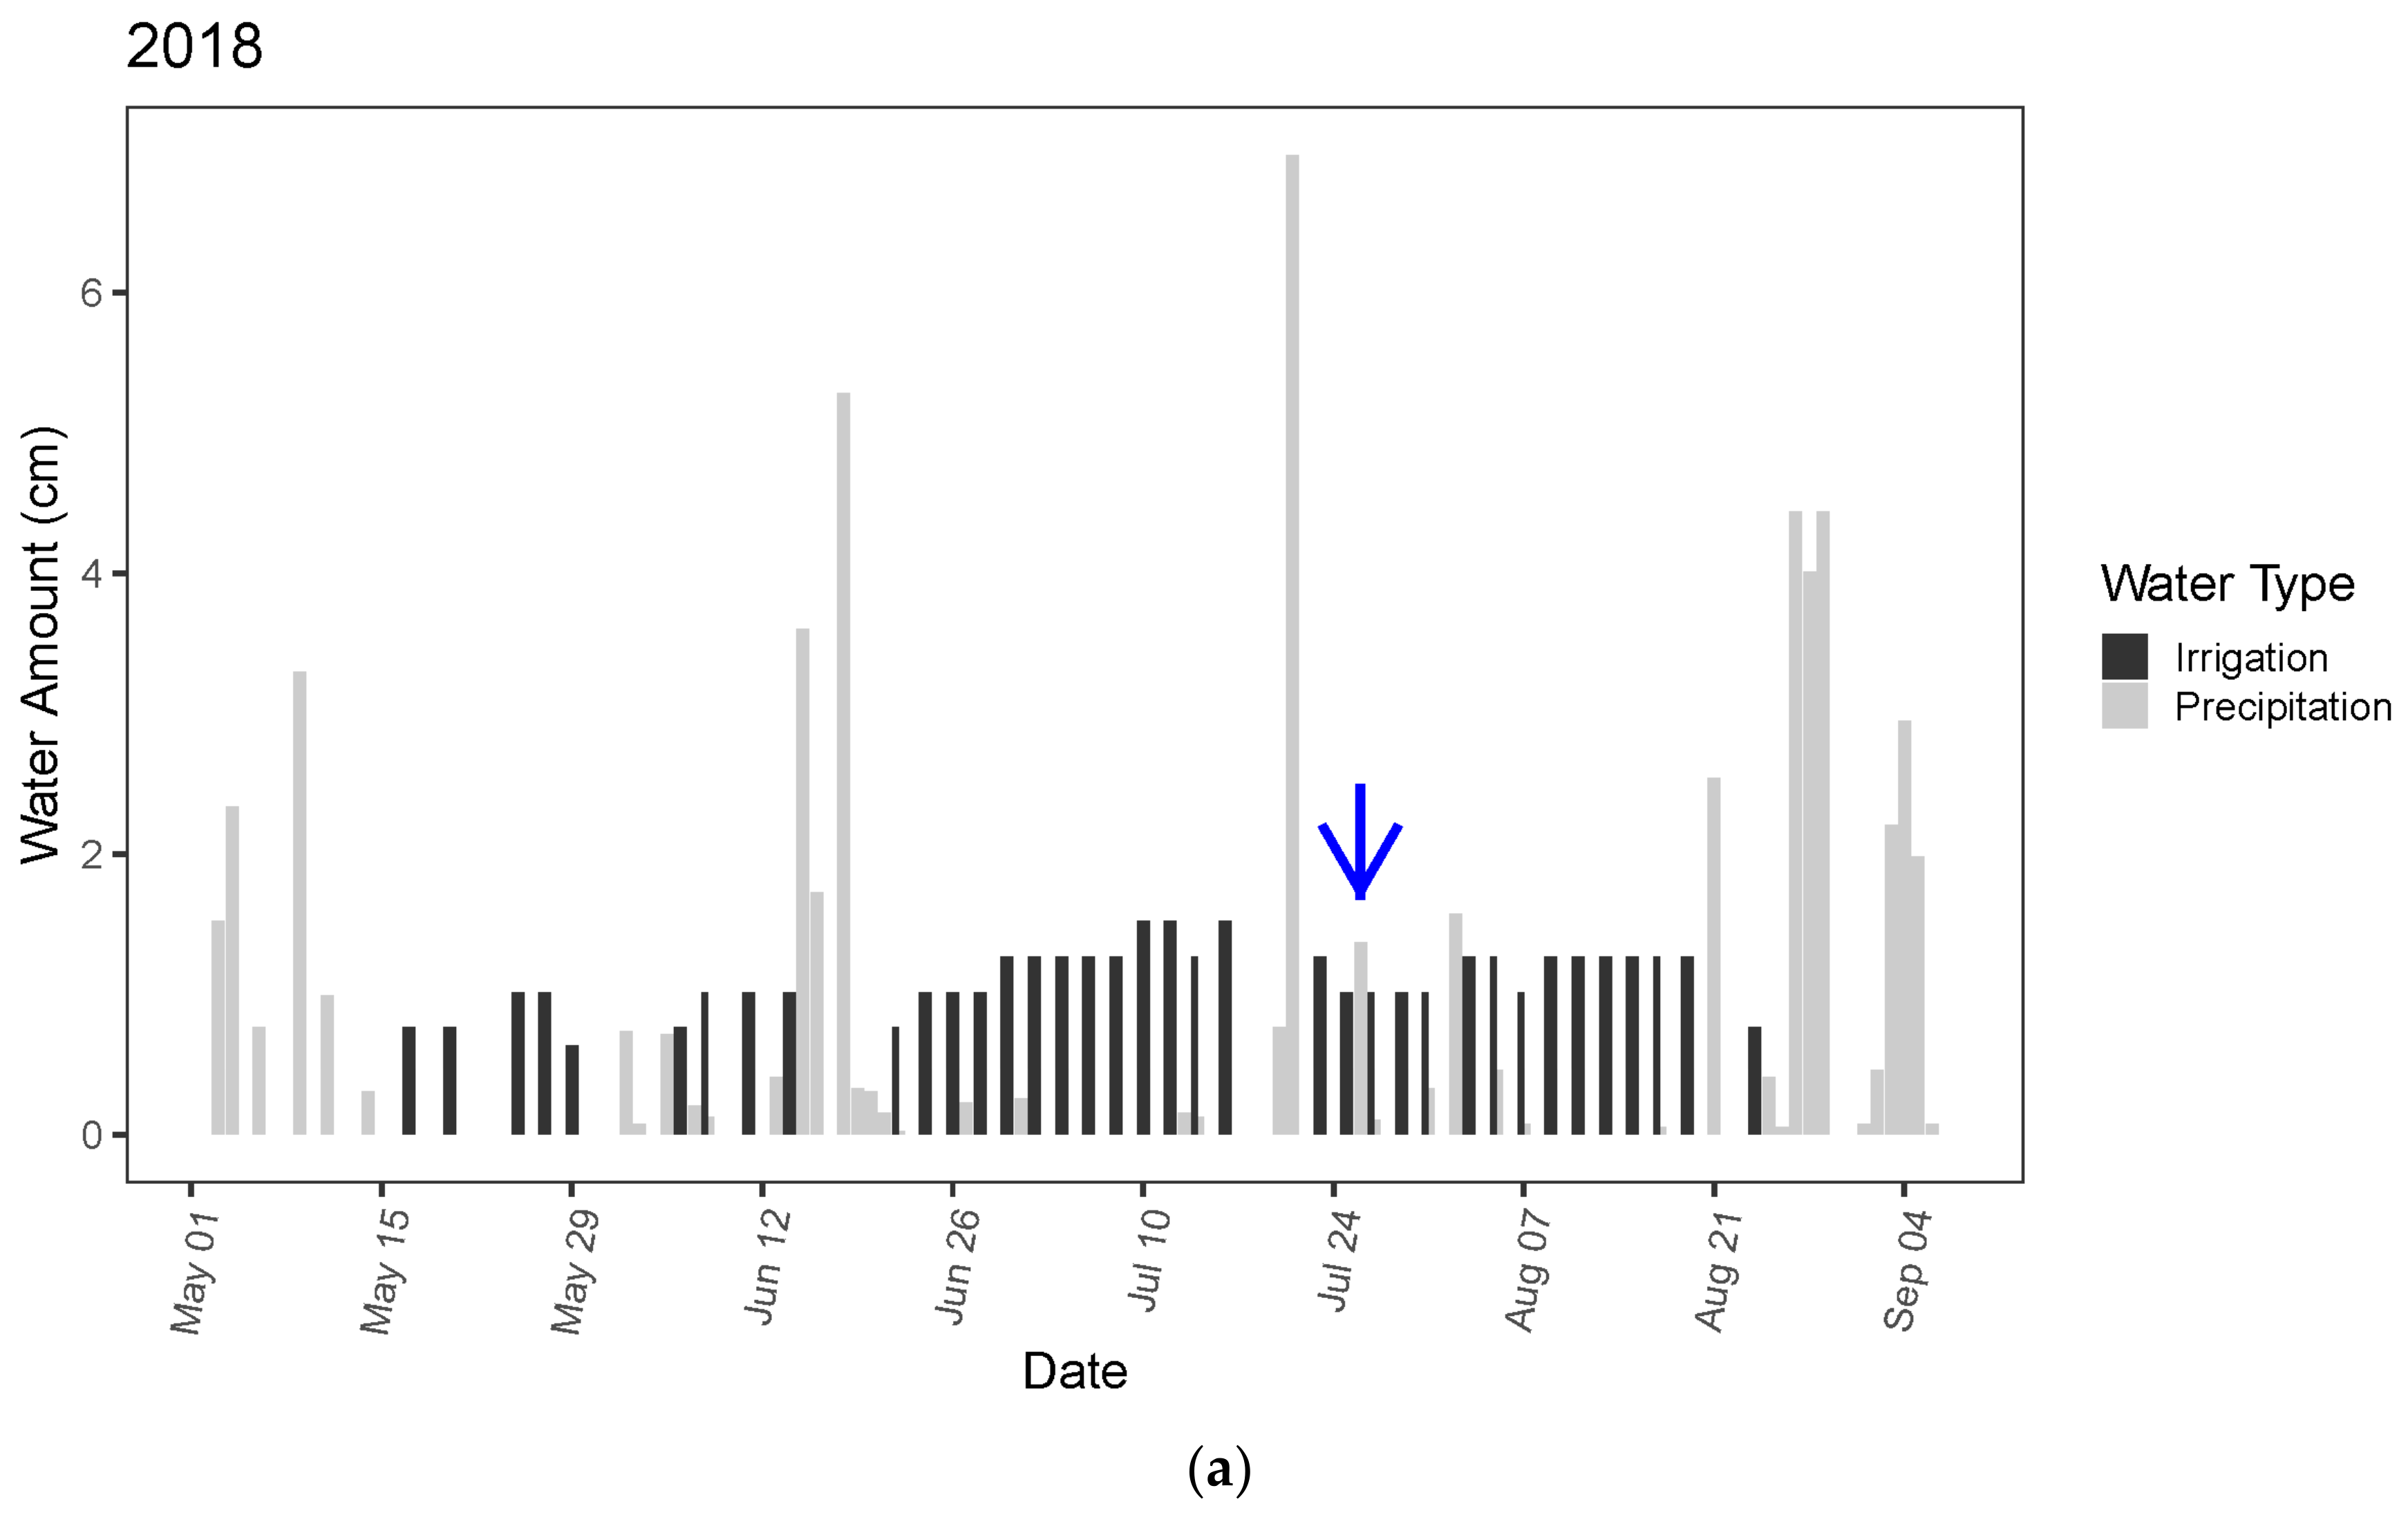
Total precipitation between 1 May and 30 September was 49.80 cm in 2018 and 50.72 cm in 2019. Total precipitation during the treatment period (25 July to vine kill) was 27.61 cm in 2018 and 9.96 cm in 2019. In 2018, there were three periods of heavy precipitation (>2.5 cm per rain event) that largely disrupted the irrigation (Figure 2a). These periods took place between 14 June and 22 June, between 19 July and 23 July, as well as between 21 August and 9 September. The intense rainfall between 21 August and 9 September caused the second irrigation treatment of treatment 5, which was expected to start on 20 August at the rate of 50%ET, to be completely disrupted and not to be imposed. In 2019, there were erratic rainfall events (<2.5 cm) over the course of the treatment period (Figure 2b).
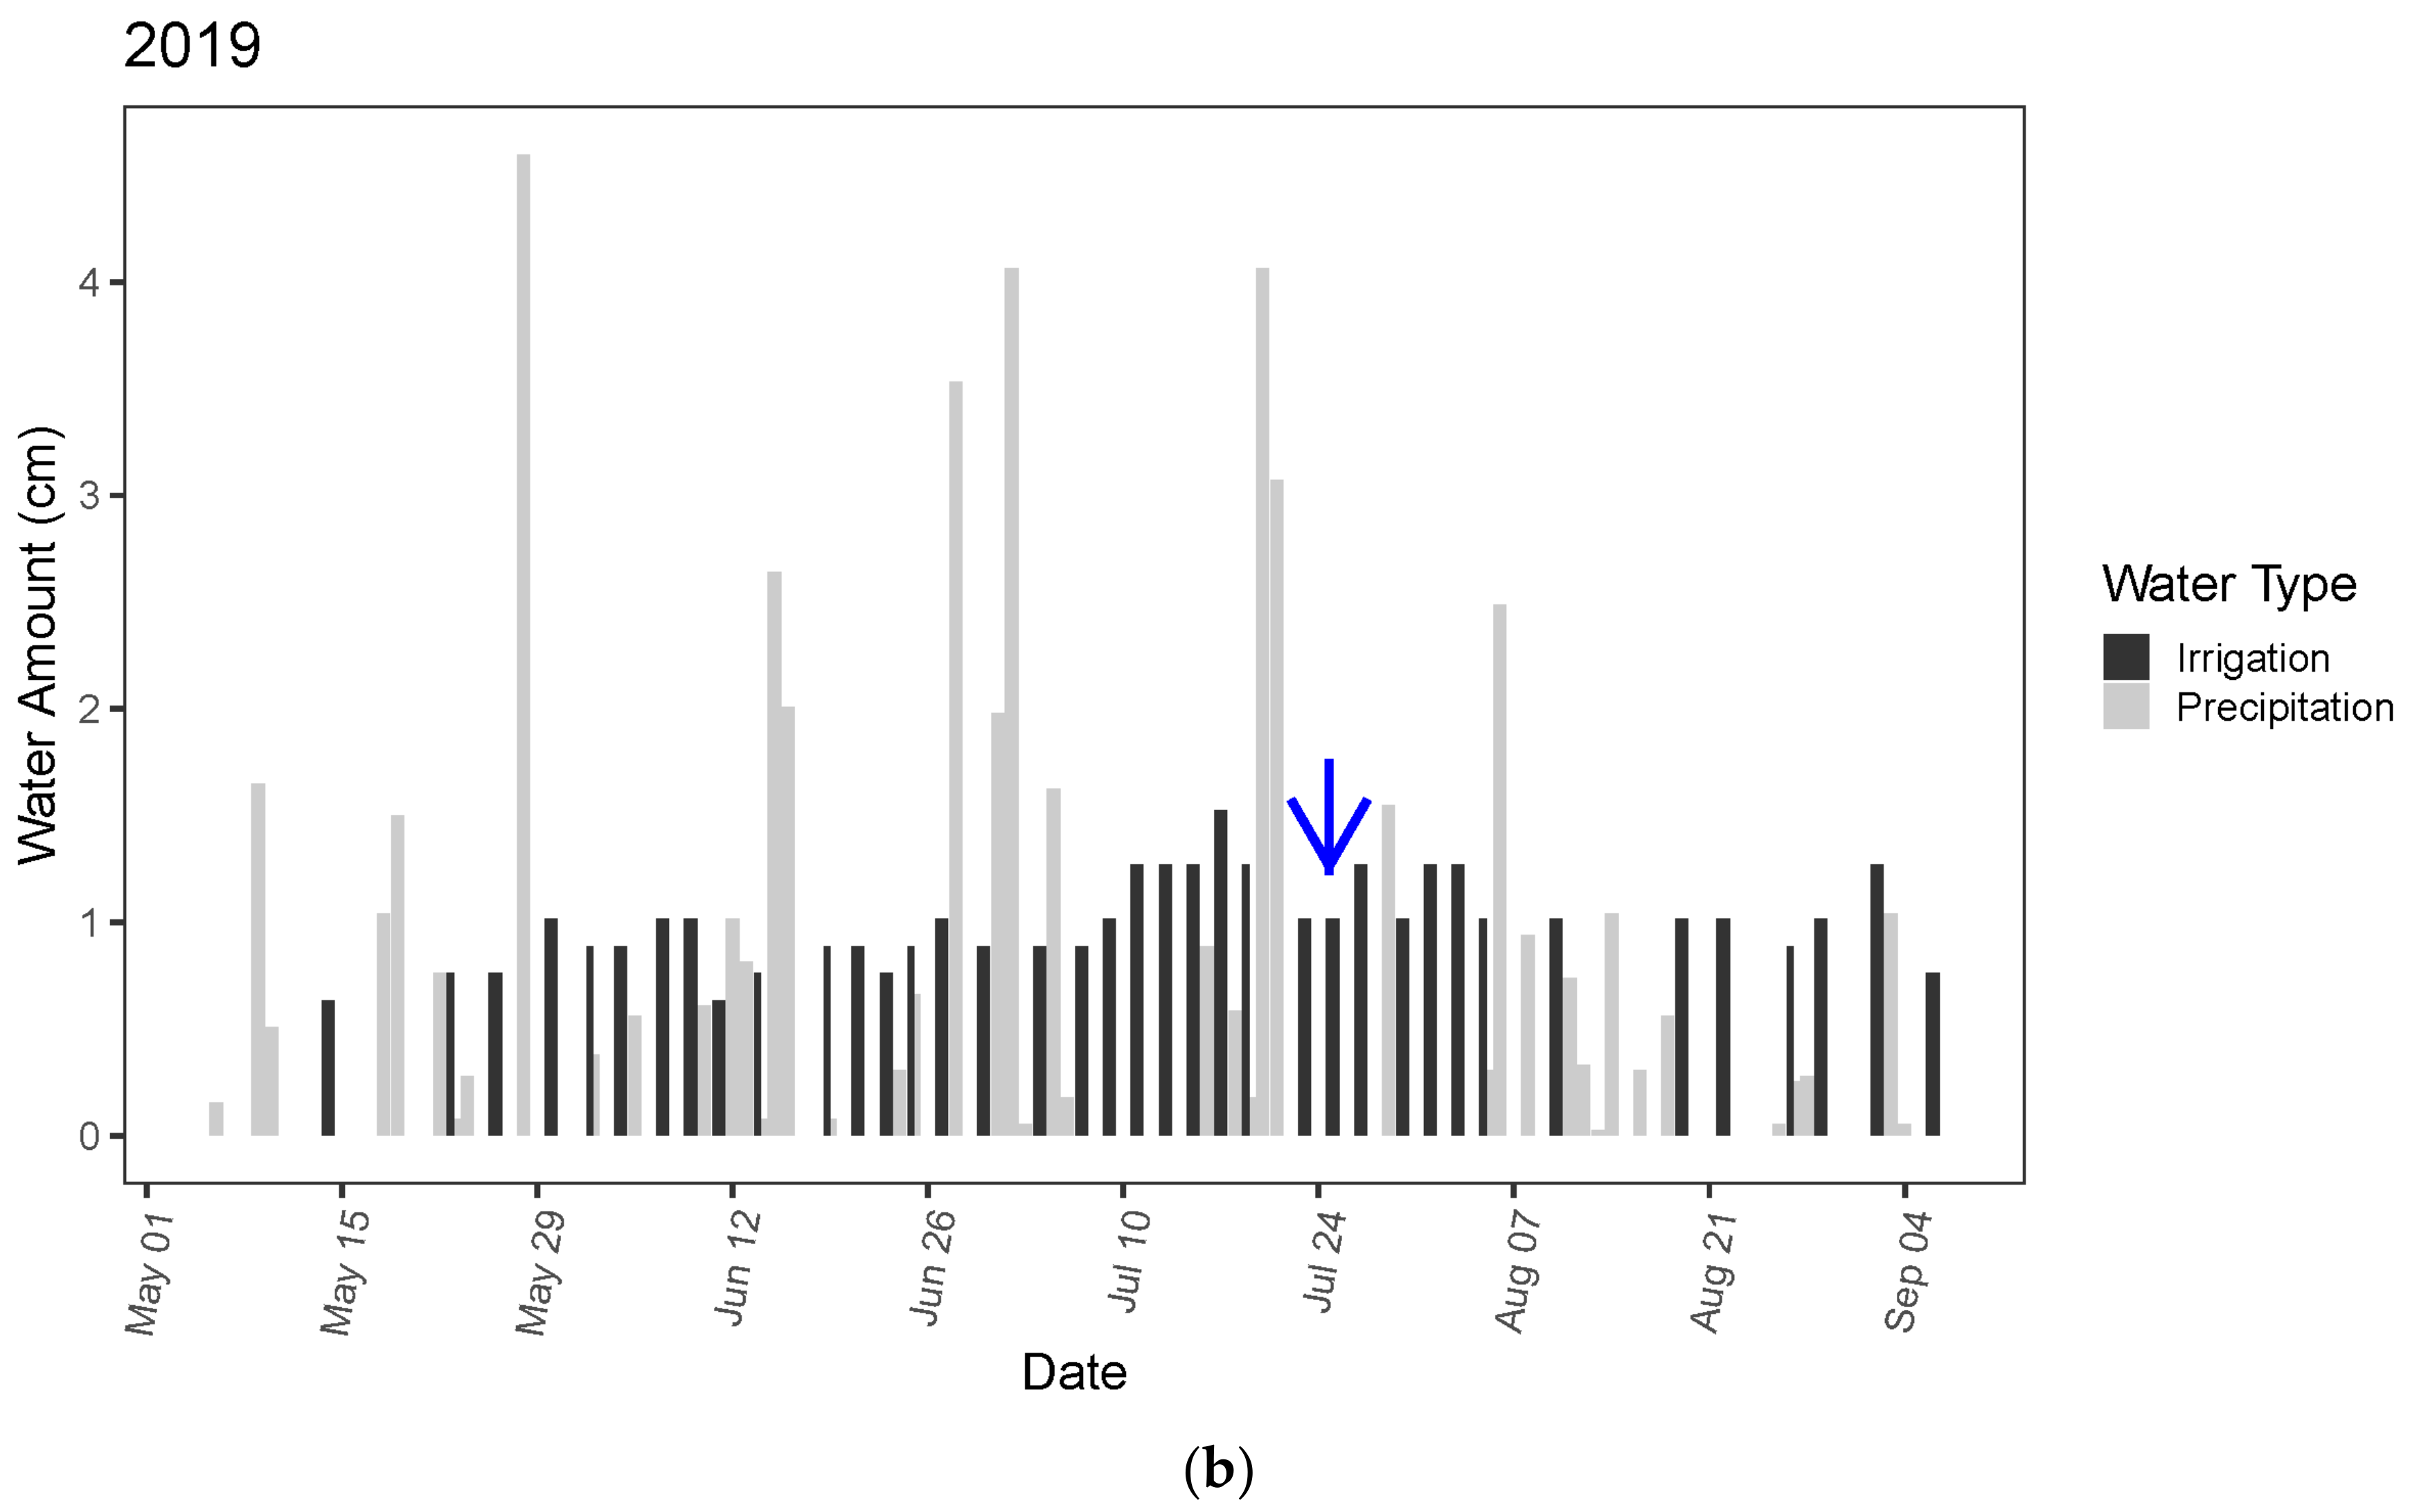
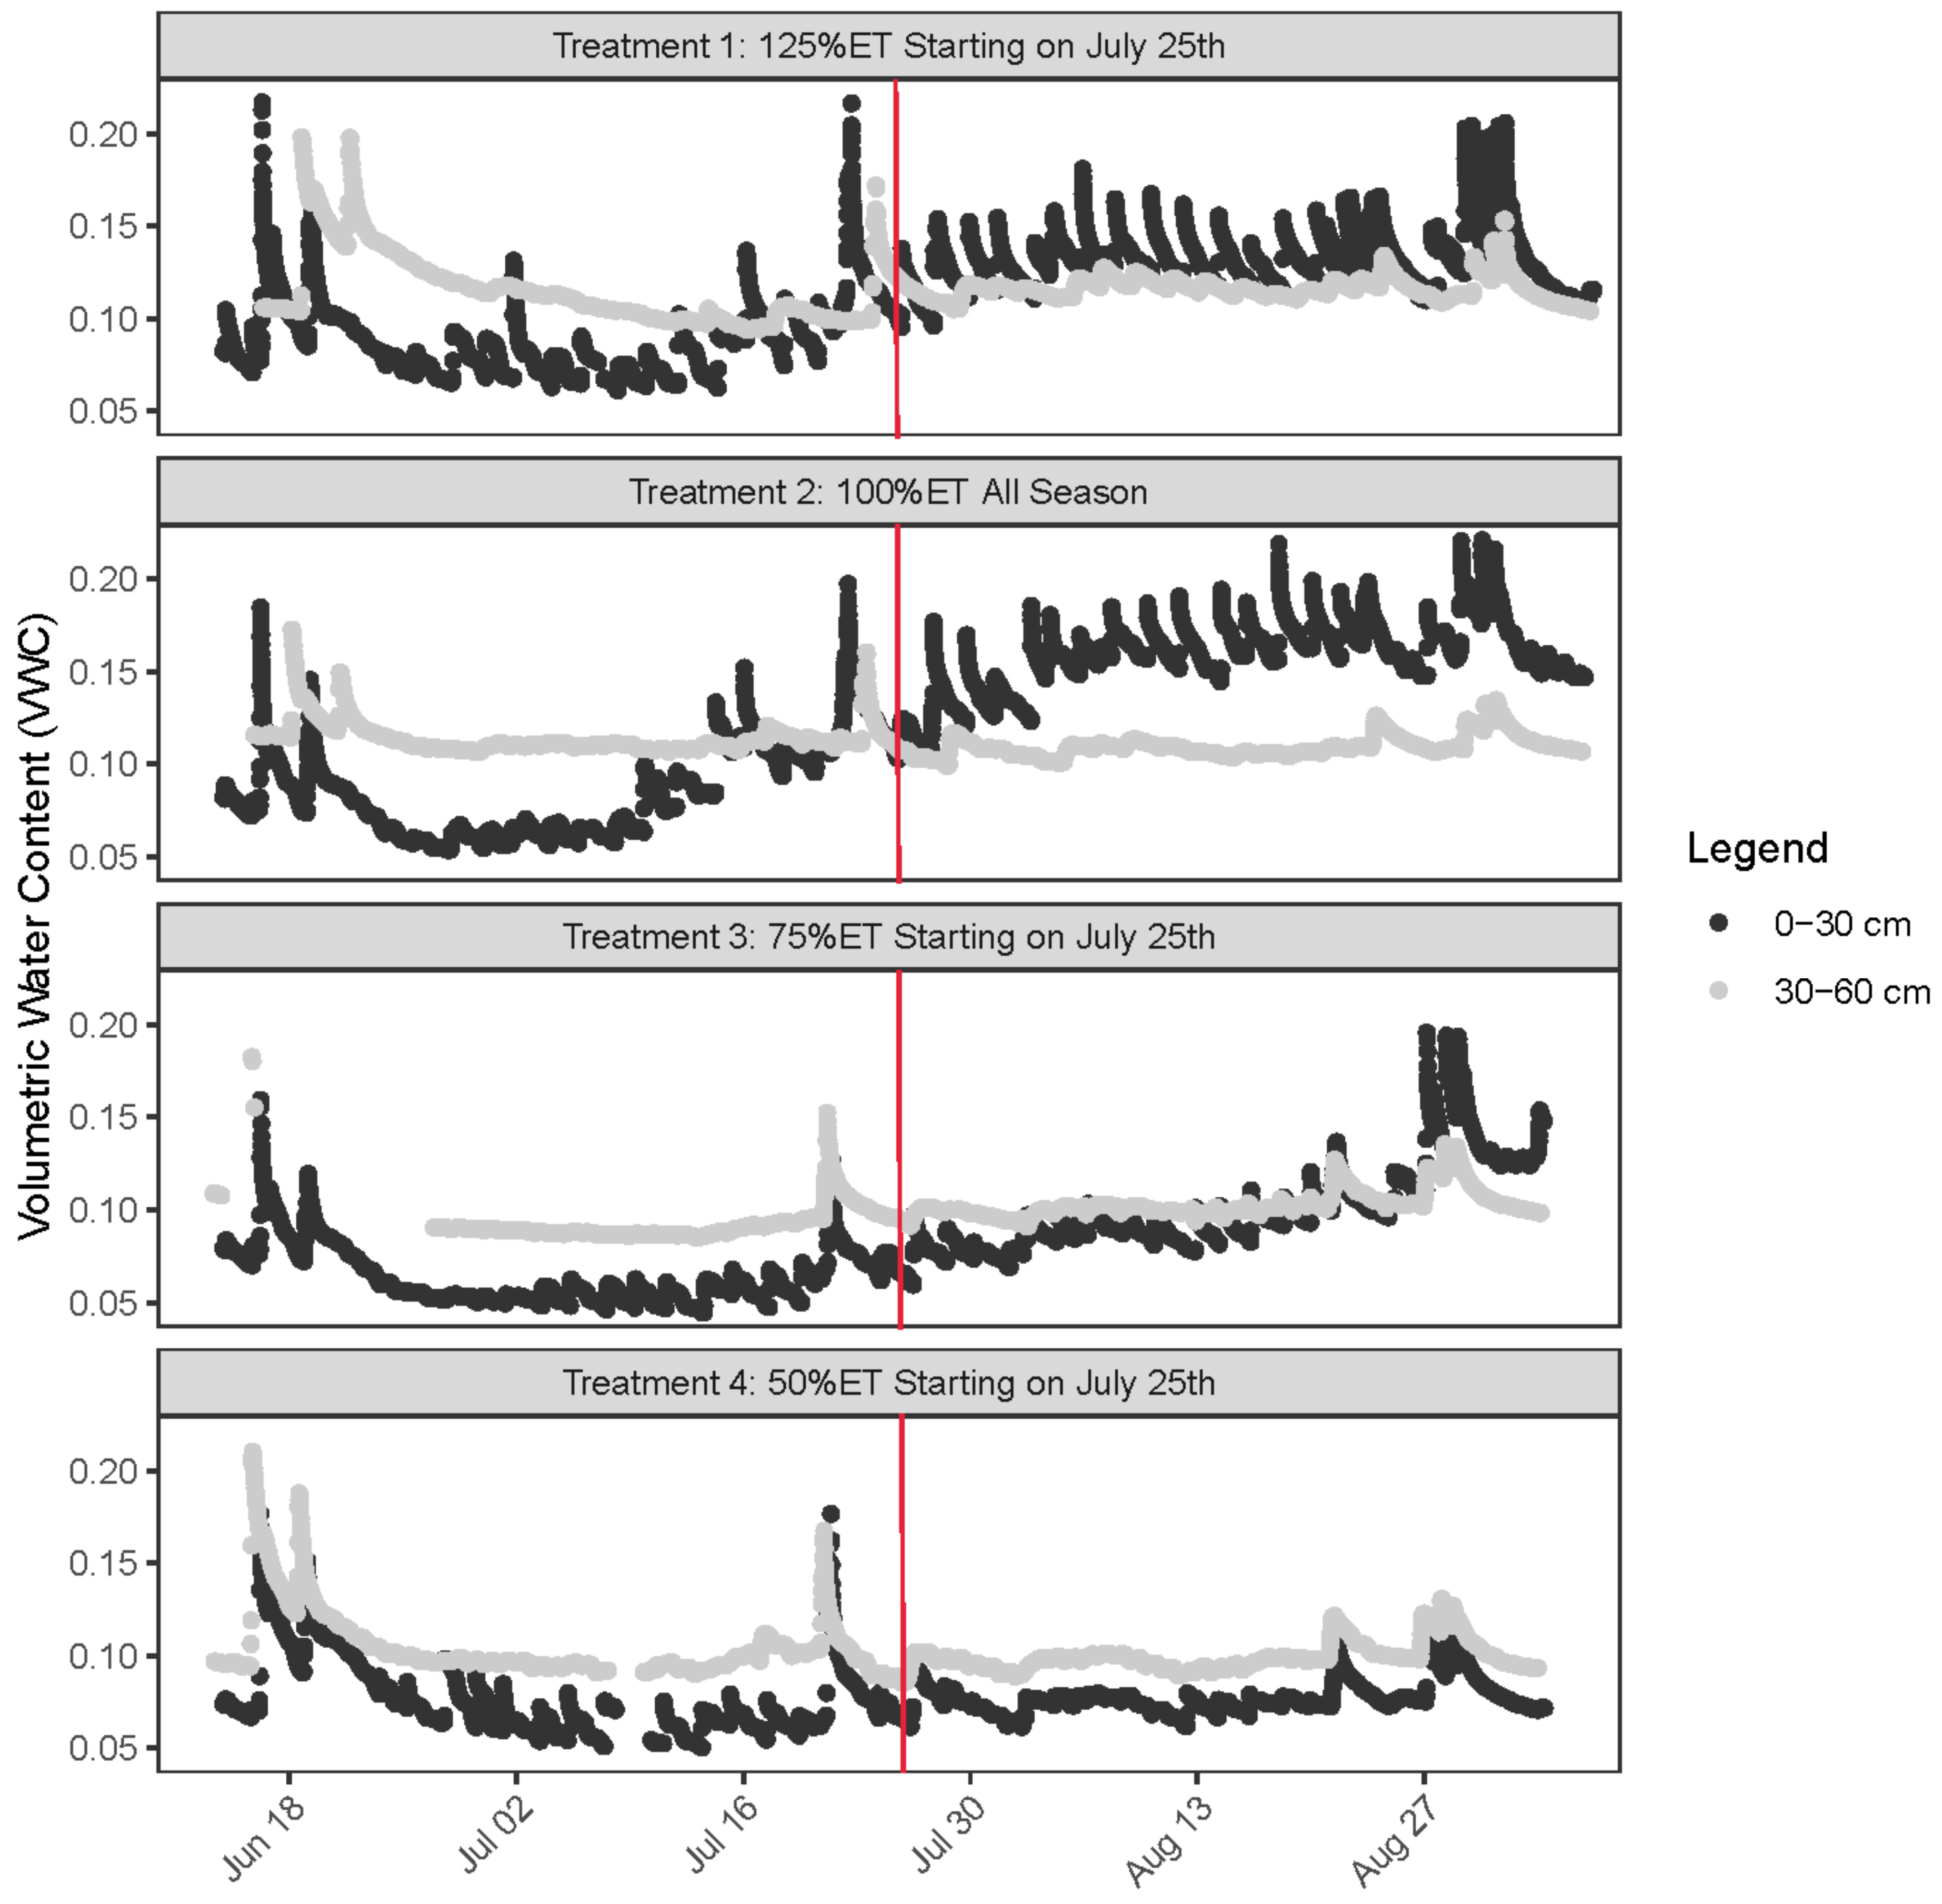
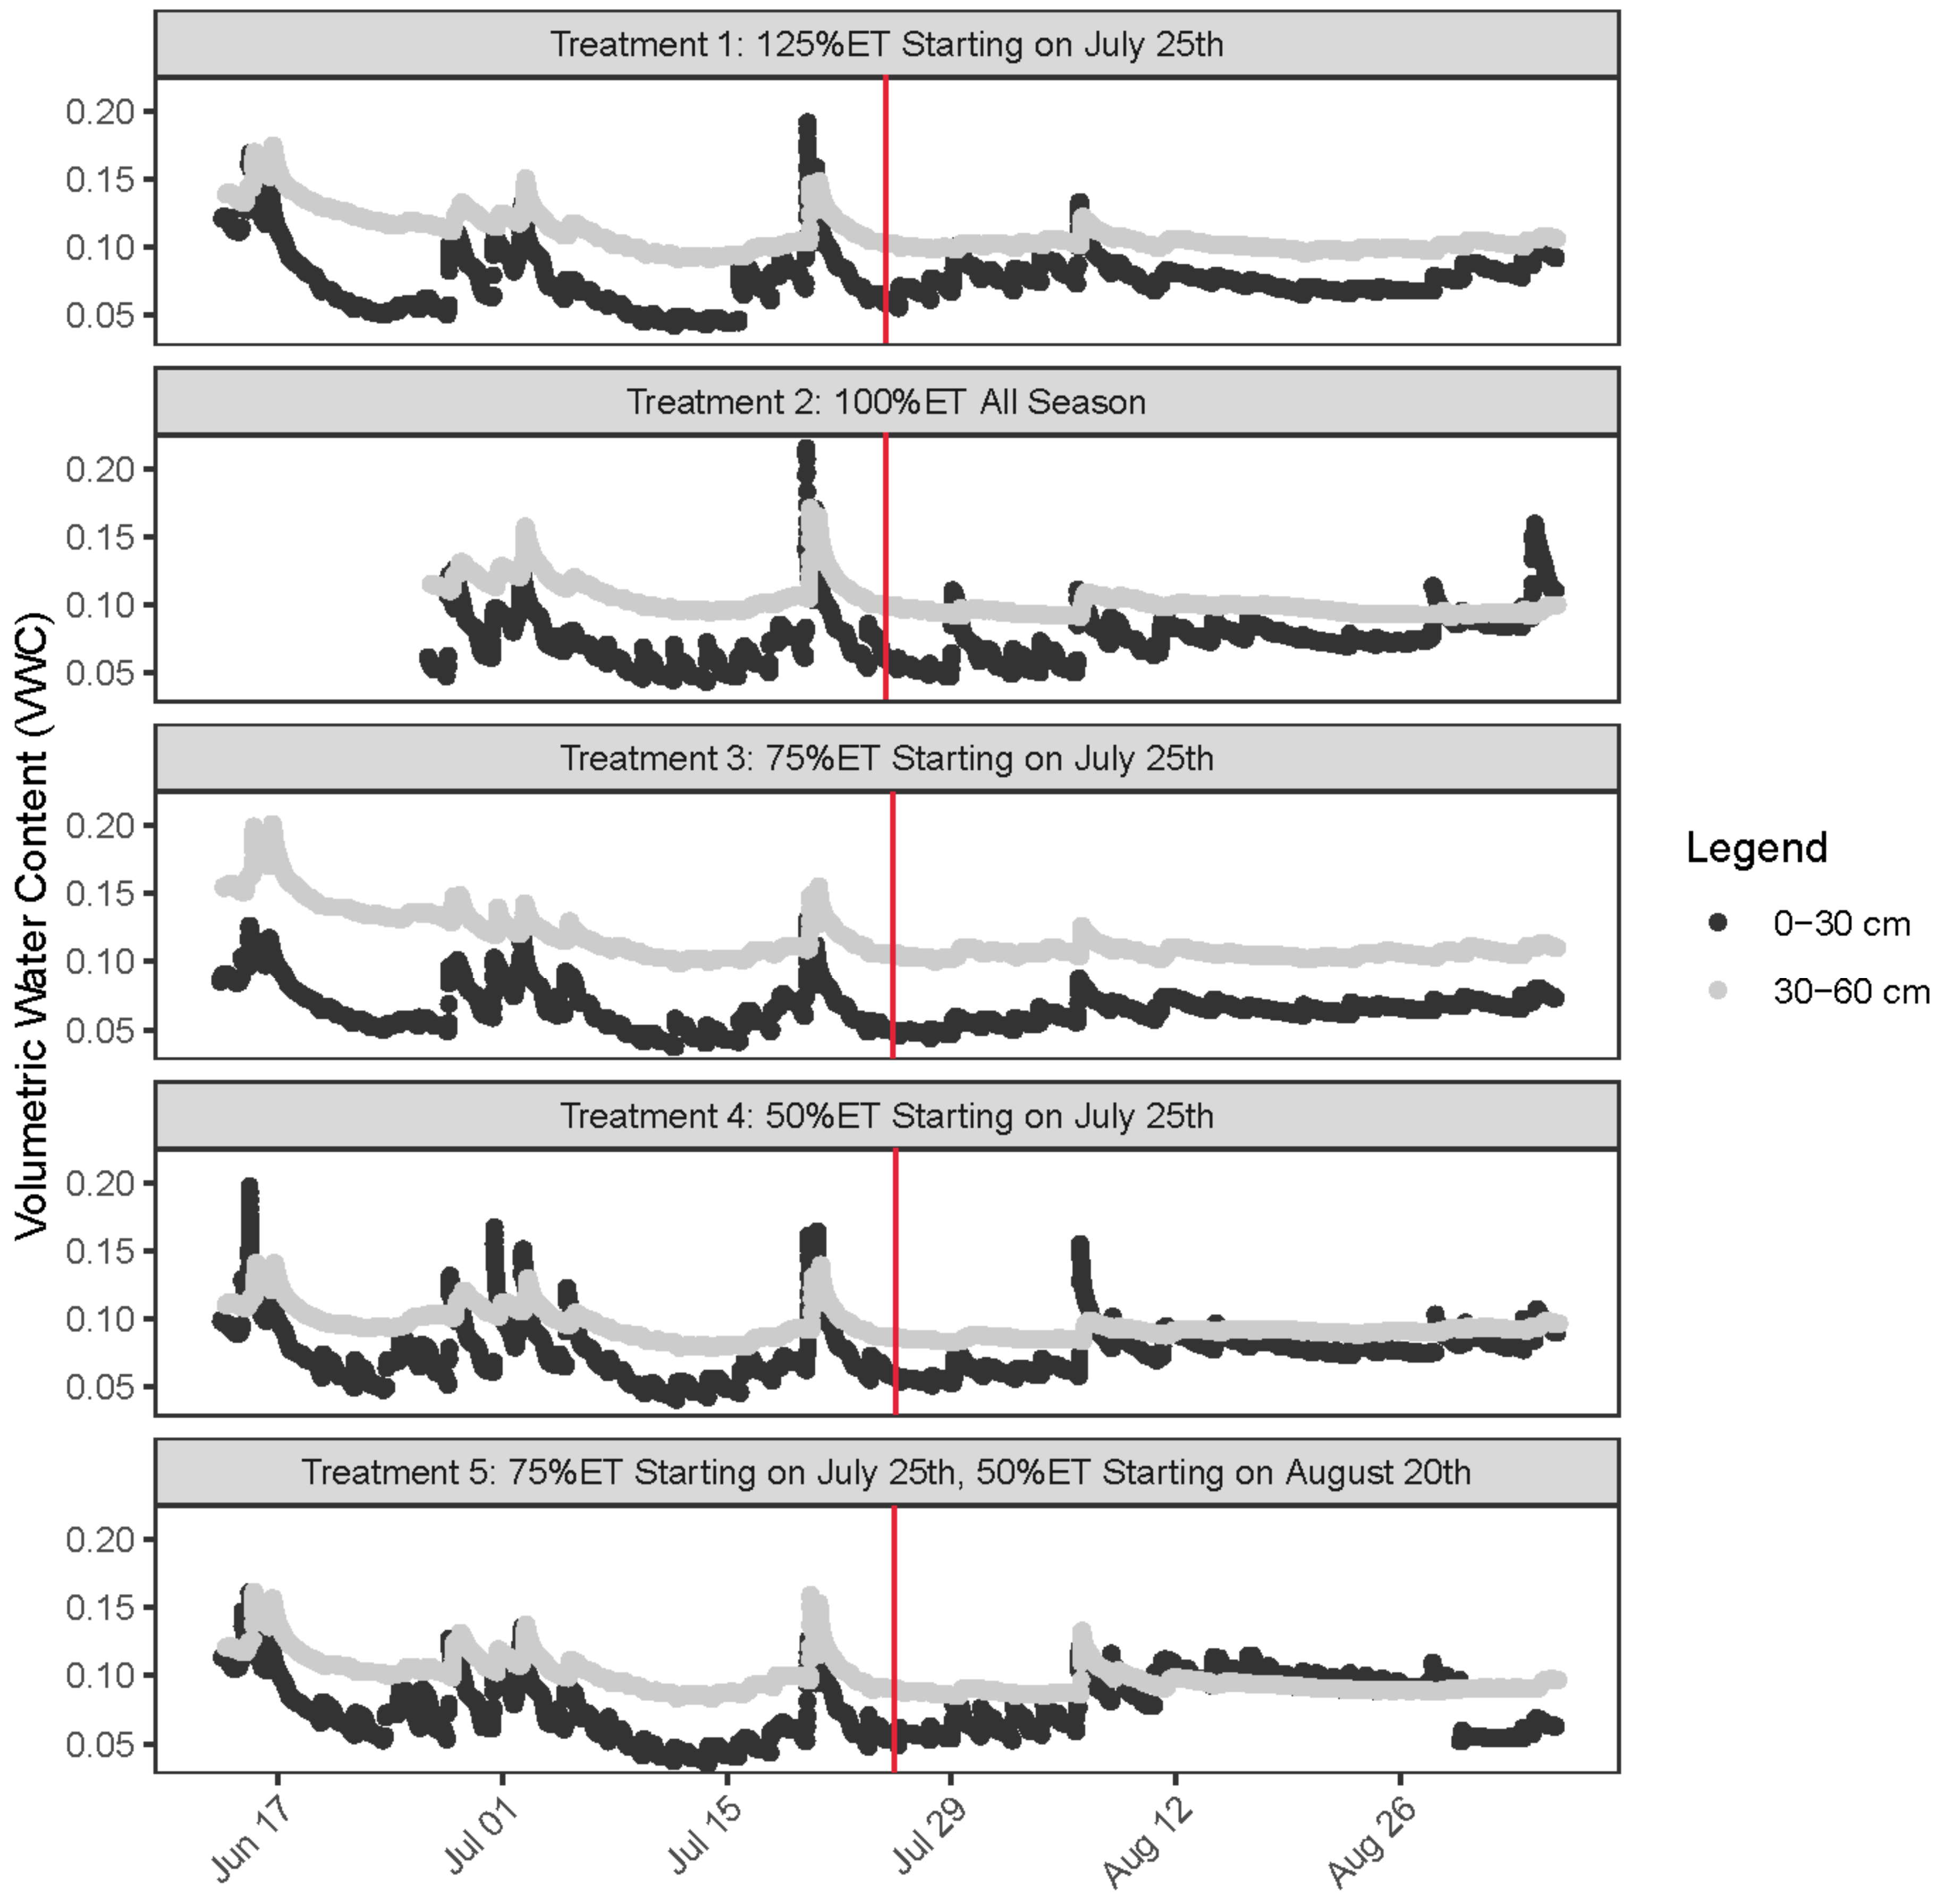
Volumetric water content (VWC) at two soil depths are shown in Figure 3 and Figure 4 for the 2018 and 2019 growing seasons, separately. In both years, the soil water content of the topsoil (0–30 cm) and subsoil (30–60 cm) had similar values among treatments before 25 July, which was the start of the irrigation treatment period. Thereafter treatment 1 (over-irrigation) had higher VWC values than rate 2 (standard irrigation), particularly at the subsoil depth. Rate 3 and rate 4 (the two deficit irrigation levels) had lower VWC values at the top soil depth compared to rate 2 (standard irrigation), and the difference was more pronounced in 2018. In 2019, rate 5 had similar soil VWC changes as rate 4 although the topsoil values were slightly higher under rate 5 during most of the treatment period (Figure 4).
Throughout the growing season, the topsoil had more changes in VWC values within each day, which was indicated by the daily spike approximately at midnight, than the subsoil. The different irrigation treatment effects were more closely reflected by the VWC data in 2018 than in 2019, likely due to precipitation in 2019 throughout the treatment period that can disrupt the irrigation treatments (Figure 2b).
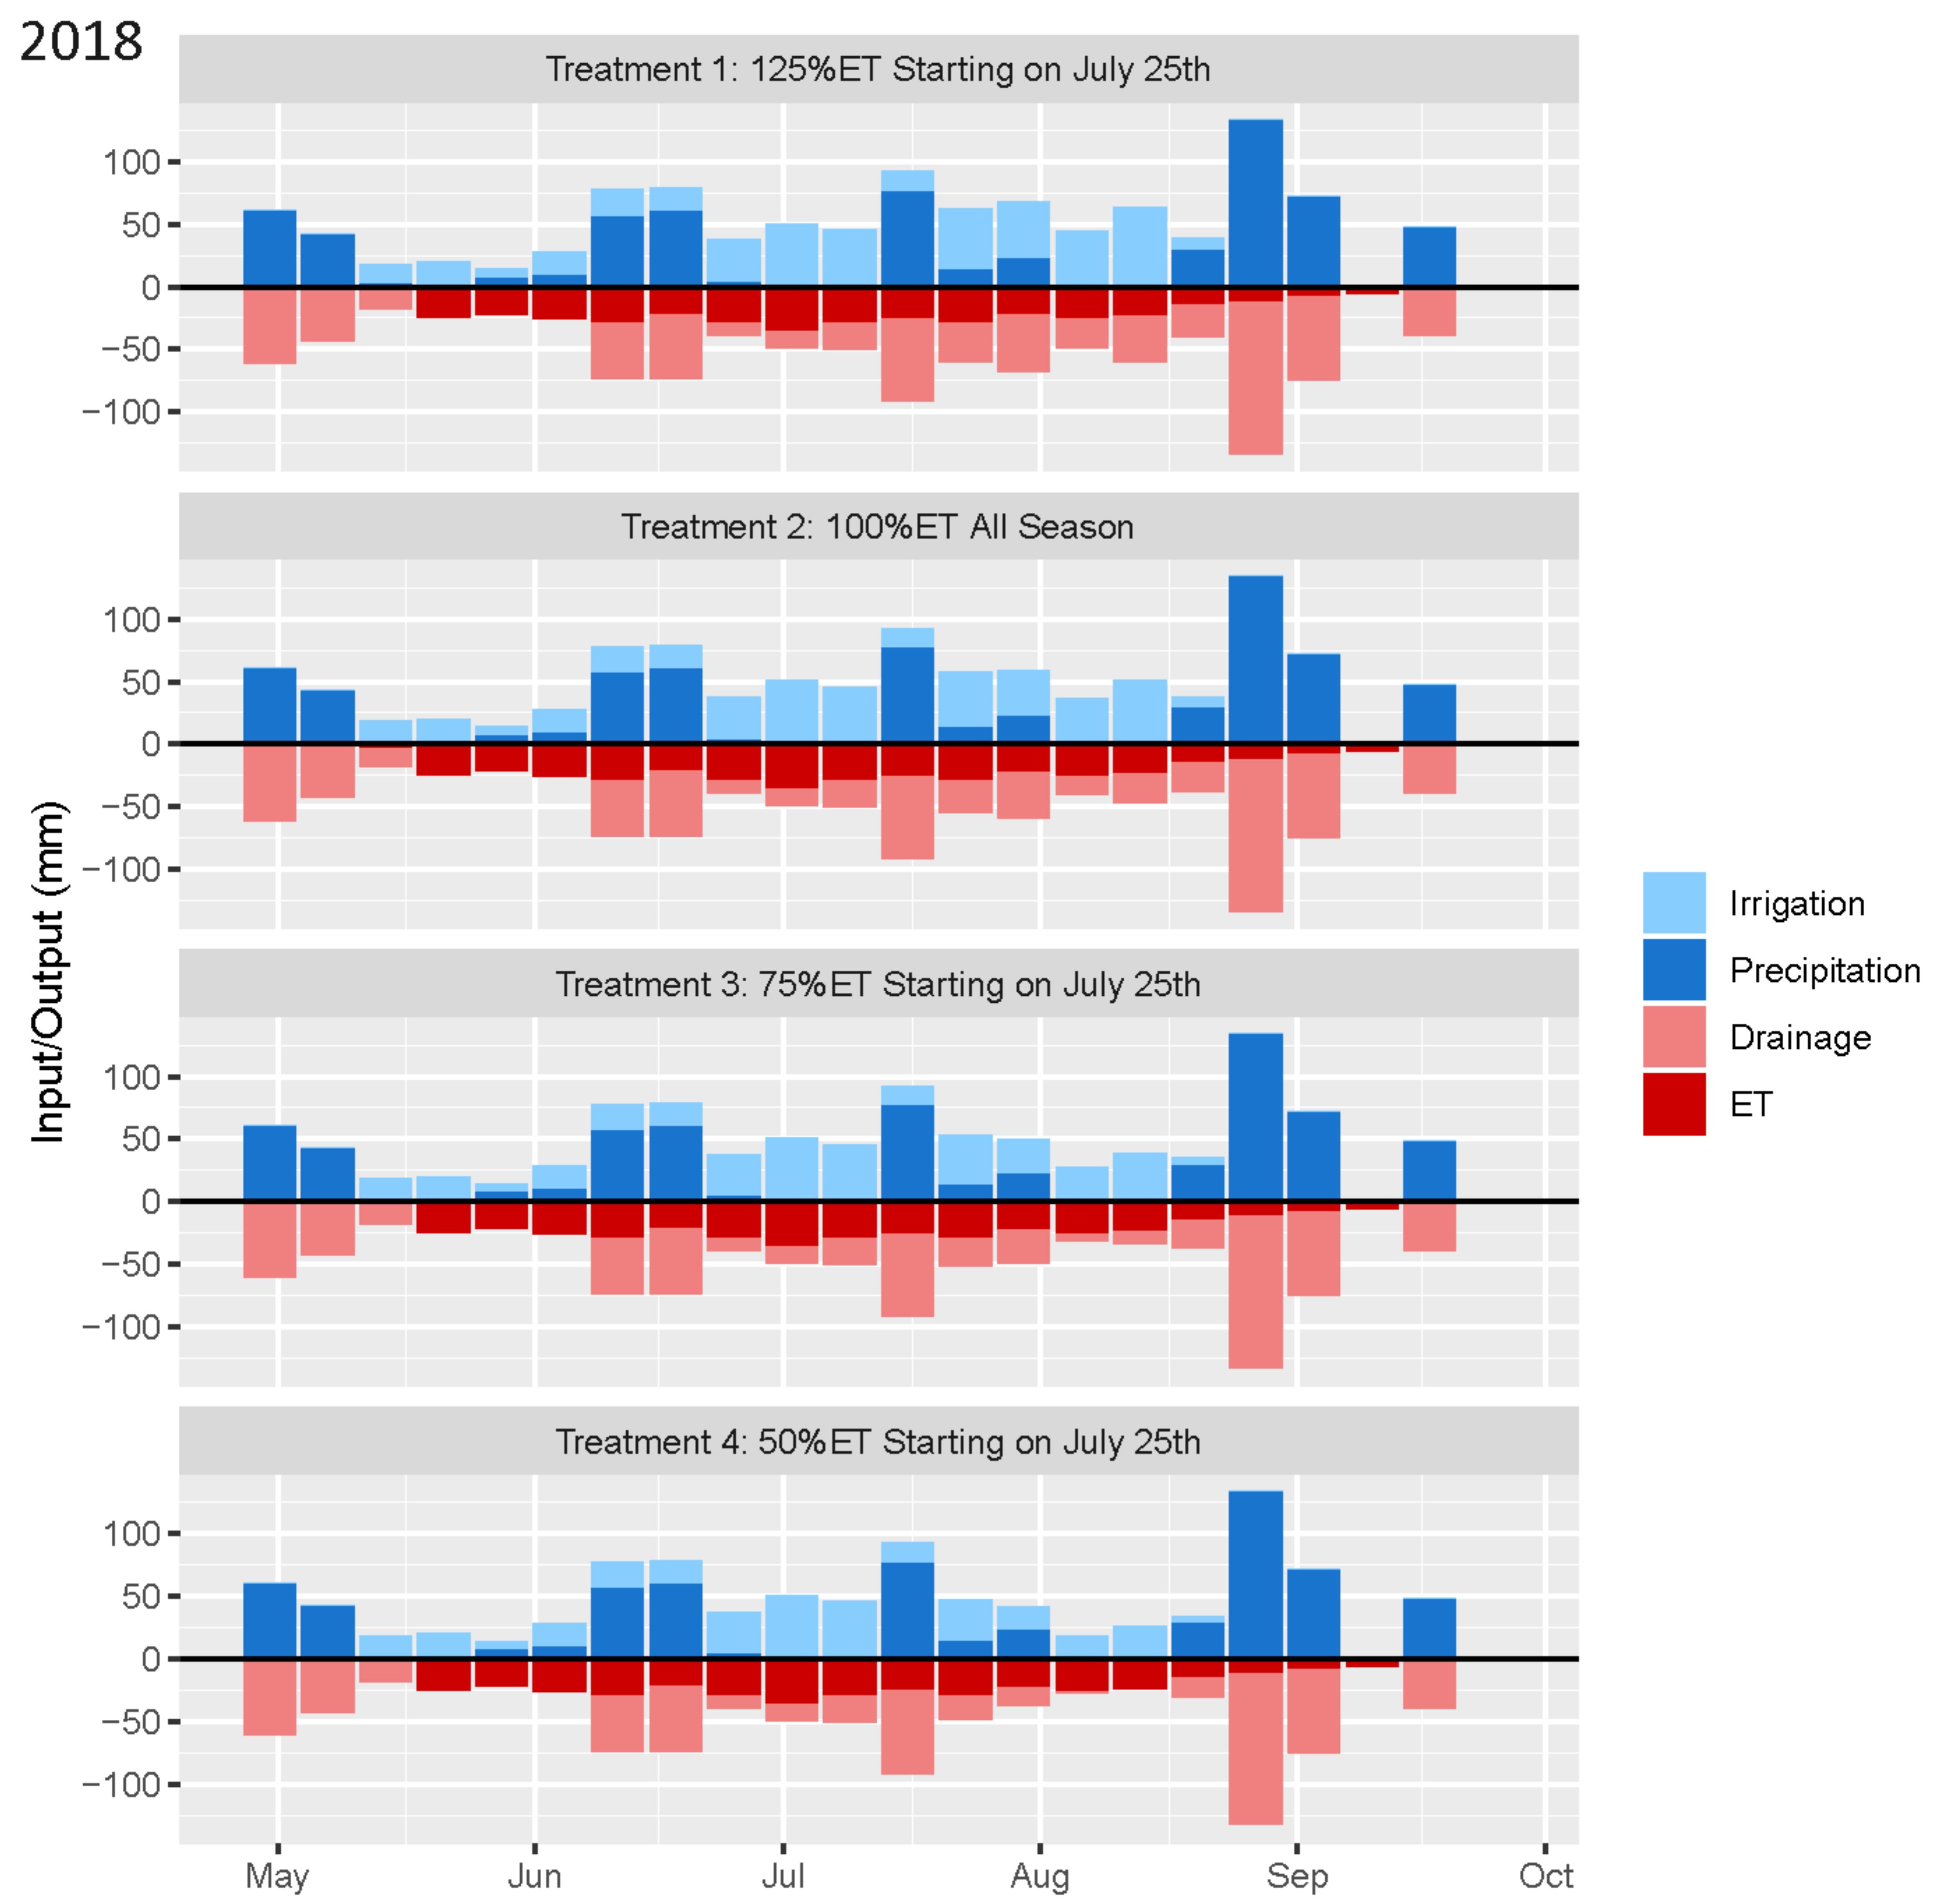
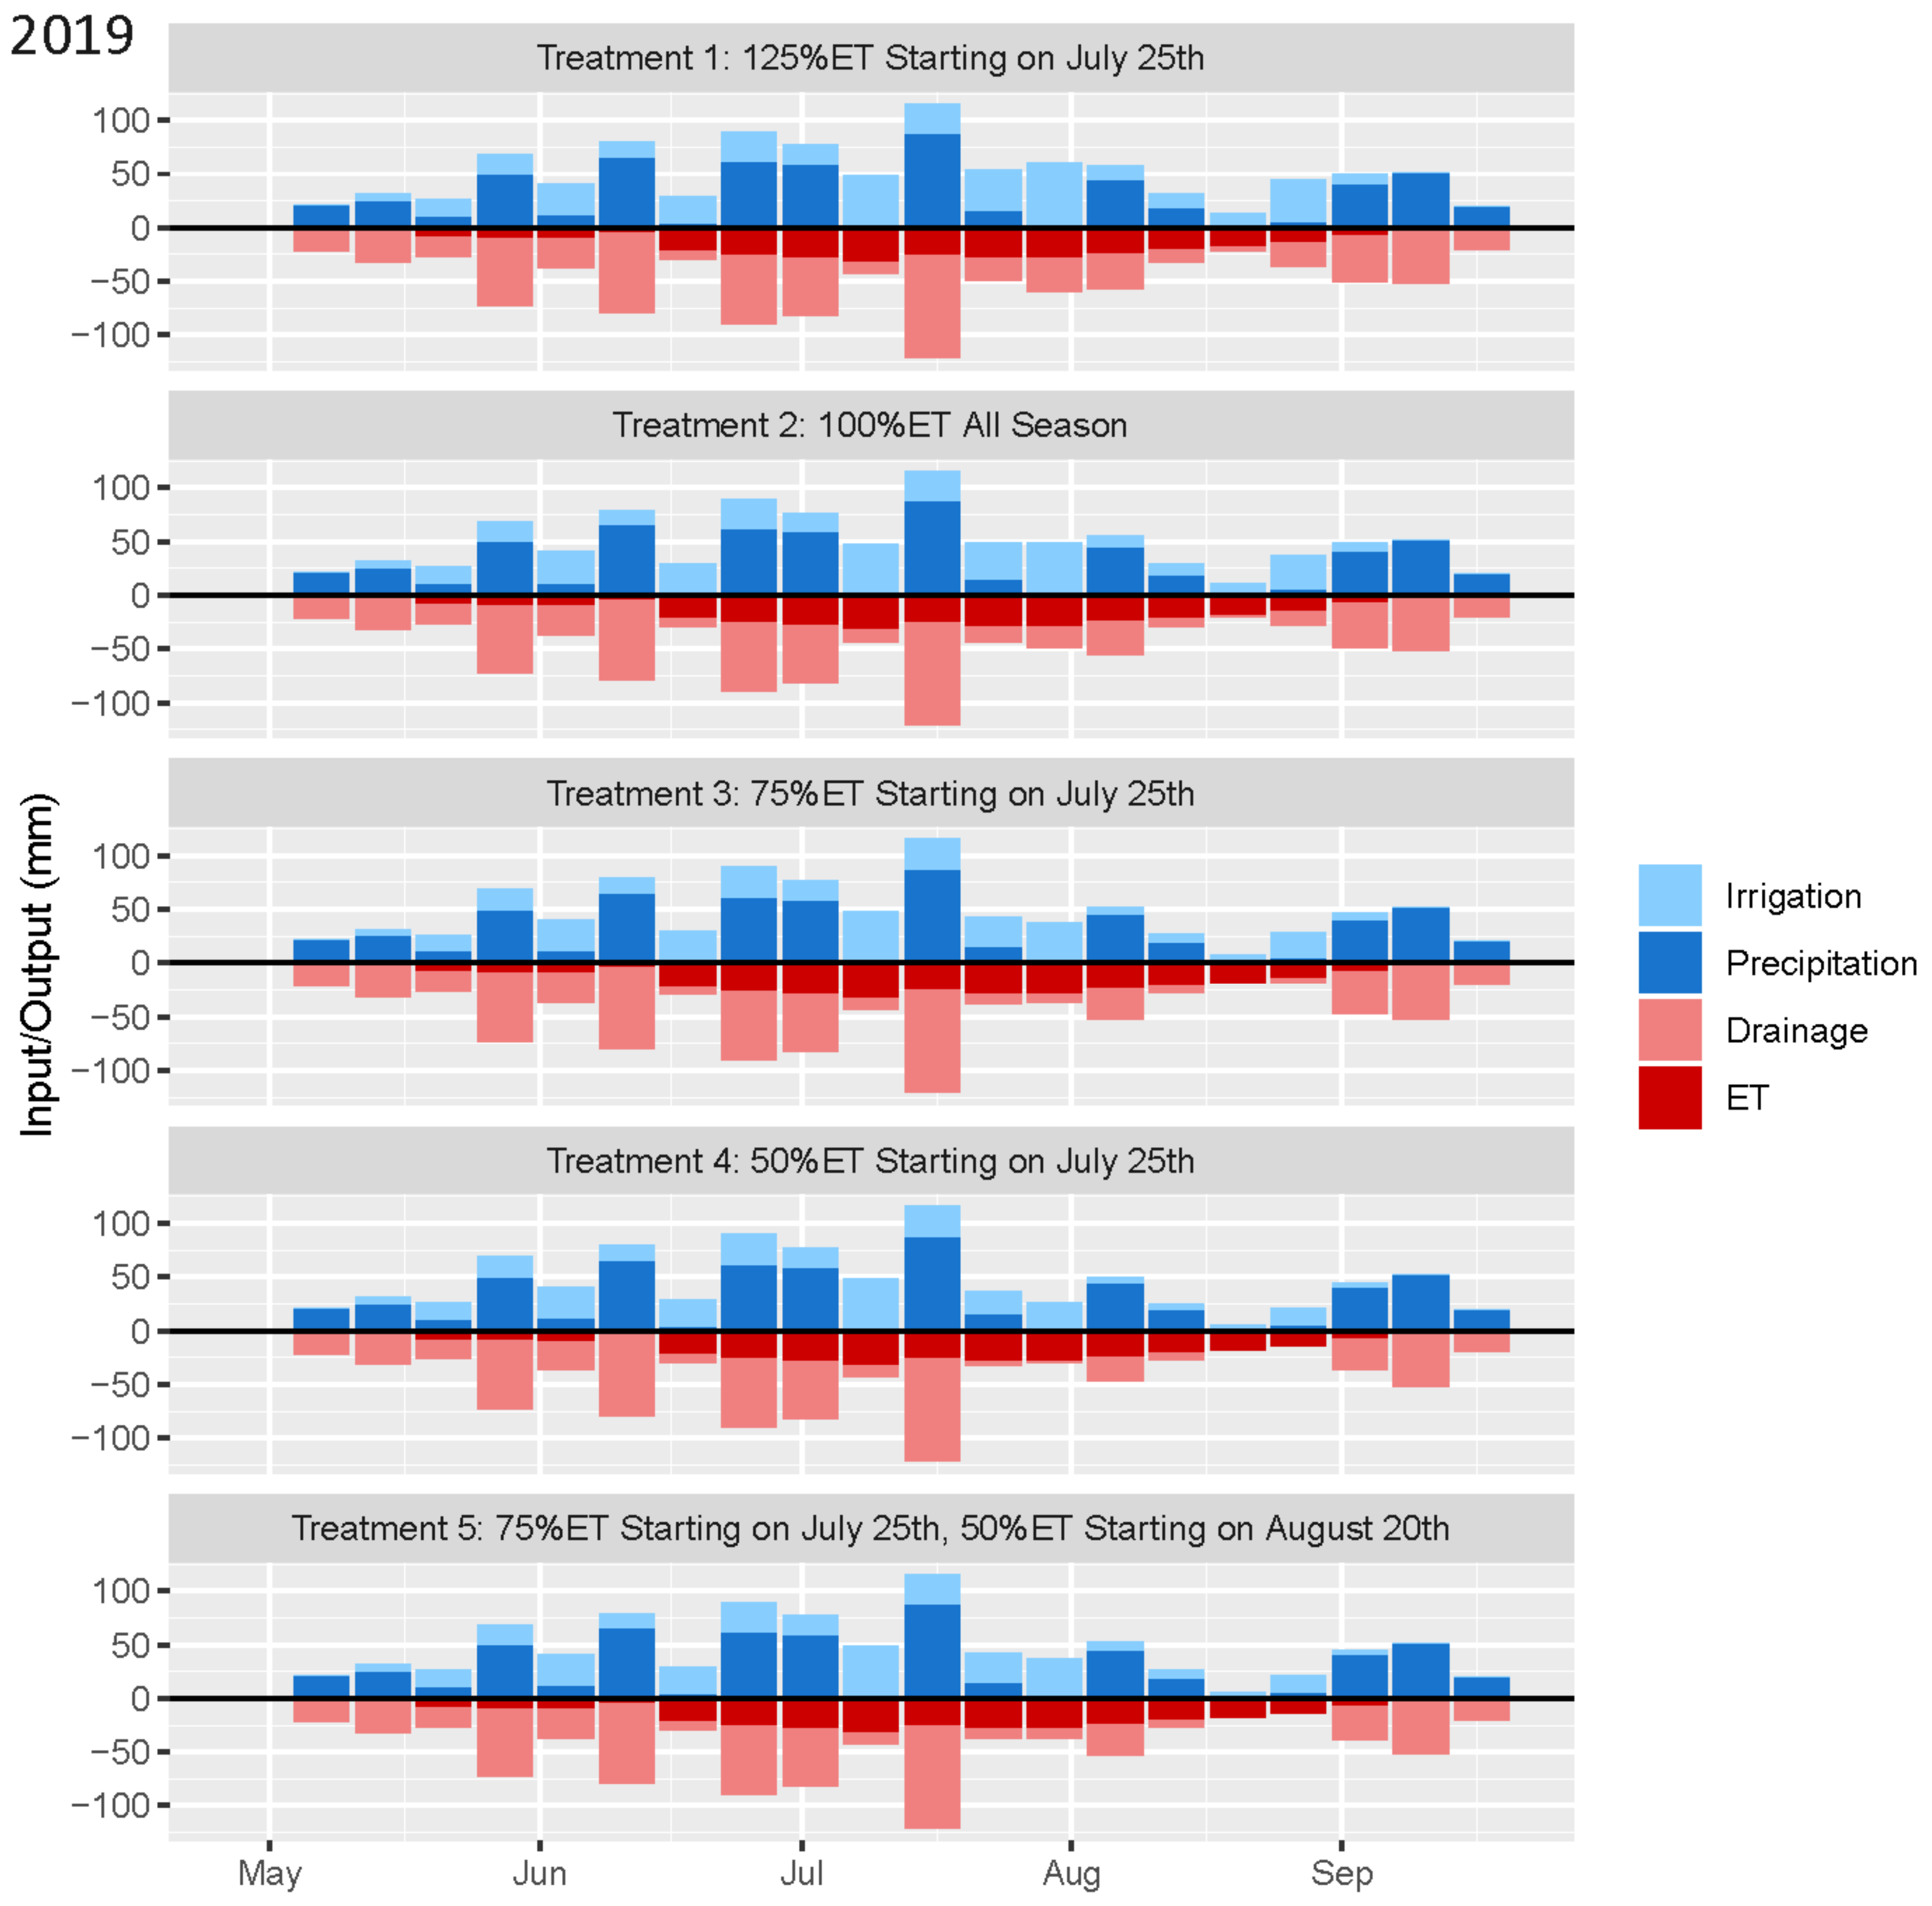
Weekly water balance values under each irrigation rate of this experiment are displayed in Figure 5 and Figure 6. Compared to the weekly ET values of May and June in 2018, the values in 2019 were considerably lower. This is likely related to the lower growing degree days in the early portion of the 2019 growing season (Figure 1). During the treatment period, it is clear that compared to over-irrigation, deficit irrigation at 75%ET or 50%ET when tubers reach late bulking can substantially reduce drainage, which is directly related to nitrate leaching potential to the groundwater. The high drainage values in late August and early September of 2018 should be caused by the series of large rainfall events during that period (Figure 2a). Overall, total drainage under 75%ET and 50%ET was 74.9 mm and 112.4 mm less than that under over-irrigation in 2018. Total drainage under 75%ET, 50%ET, and 75–50%ET was 69.2 mm, 103.8 mm, 81.6 mm less than the value under over-irrigation in 2019.
3.2. Yield and Tuber Size
ANOVA results for traits measured at harvest were separately shown for 2018 and 2019 in Table 2. Different irrigation rates did not result in any significant difference of total yield or marketable yield in either year. However, there was significant varietal difference of total yield and marketable yield in both years (p < 0.001). In 2018, Snowden showed the highest total yield, and Hodag and Snowden showed similar marketable yield (Table 3). In 2019, Hodag had the highest numbers for both yield categories (Table 3). This indicated the premium yield potential of the new Hodag variety. In comparison, Lamoka performed the most poorly for both total and marketable yield in both years (Table 3). There were not any significant two-way interactions between irrigation treatment and variety for any of the measurements done at harvest in either year (Table 2).
All three varieties had lower total and marketable yield in 2019 than in 2018, possibly due to varying growing conditions (Figure 1). For Hodag, total yield was 18% lower in 2019, with marketable yield 50% lower. For Snowden, total yield was 25% lower in 2019, with marketable yield 77% lower. For Lamoka, average total yield was similar between the two years, but the average marketable yield was 74% lower in 2019 than in 2018 (Table 3).
4. Tuber Quality at Harvest
In both years, irrigation rate did not have any significant impact on incidence of hollow heart (Table 2). Overall, hollow heart incidence in all varieties was lower than 20%. In addition, no significant difference of specific gravity was observed under different irrigation rates (Table 2).
Comparatively, varietal difference led to significant difference in hollow heart incidence (Table 2), with Hodag being higher than Snowden and Lamoka in both years. In 2019, Hodag was the only variety that had any occurrence of hollow heart, due to its larger tuber size (Table 3). Varietal difference also had a significant effect on specific gravity (Table 2). In both years, Hodag and Snowden had similar specific gravity values, while the values of Lamoka were significantly lower (Table 3).
5. Water Use
For both total yield and marketable yield across the varieties, irrigation efficiency (IE) was significantly lower under the over-irrigation rate than under all other irrigation rates in 2018 (Table 4 and Table 5). In 2019, IE for total yield under over-irrigation and standard irrigation was lower than those under other treatments (Table 4), but irrigation rate had no effect on IE for marketable yield in this year (Table 2). Compared to the other treatments, over-irrigation consistently showed the lowest IE in both years (Table 4 and Table 5).
Water-use efficiency (WUE), which considers use of both precipitation water and irrigation water, was also significantly affected by irrigation rate. WUE for total and marketable yield in 2018 was significantly lower under the over-irrigation rate than all the other treatments (Table 4 and Table 5). In 2019, WUE for total yield was lower in the over-irrigation treatment than under the rate 4 at 50%ET or rate 5 that had two tiers of irrigation reduction during the treatment period (Table 4 and Table 5).
6. Storage Quality
Table 7 shows the ANOVA results for the storage quality in 2018 and 2019, respectively. Irrigation rate did not influence sugar concentrations or chip fry color in either year. In 2018 the interaction between storage length and variety had a significant effect on sucrose and glucose (Table 7). The sugar concentrations, particularly glucose, significantly increased in Snowden at the eight-month sampling point, whereas the numbers stayed low over the course of the storage season in Hodag and Lamoka (Table 8 and Table 9). In 2019, the interaction between storage length and variety significantly impacted sucrose, glucose, and fry color (Table 7). Snowden again showed significant spikes of sucrose and glucose and a symptom of darkening fry color, indicated by lower Hunter-L values, at the end of the storage season, but Hodag and Lamoka maintained low sugar levels and light fry color (Table 10).
It is interesting to note that in both years of the study, Lamoka showed the lowest levels of sucrose and glucose and lightest fry color after eight months of storage compared to other varieties at other sampling points (Table 8, Table 9 and Table 10), suggesting its premium long-term storability. Alternatively, Snowden showed a substantial increase of sucrose and glucose and worsening of fry color after eight months of storage (Table 8, Table 9 and Table 10), due to its susceptibility to senescent sweetening.
7. Discussion
7.1. Deficit Irrigation Applied during Late Season Provides Potential for Water-Use Sustainability
A 2013 study [27] conducted in Wisconsin on 7 round white chipping varieties showed that the impact of reducing irrigation by 25% during crop maturation was less than expected as yield difference of individual varieties between non-reduced irrigation and reduced irrigation was not significant. Bussan [27] suggested that reducing irrigation while not penalizing yield would possibly provide an economic benefit to growers because of reduced pumping costs and retained productivity of the crops. Hassan et al. [28] examined the effects of deficit irrigation at different potato growth stages in Bangladesh and found that in both years of the study, deficit irrigation at the tuber maturation stage resulted in higher yield compared with the treatment with no deficit irrigation. Additionally, they found that treatments that applied deficit irrigation during both the late tuber bulking stage and the tuber maturation stage did not lead to a significant yield loss when compared to the non-deficit treatments.
In our study, deficit irrigation at 75%ET or 50%ET when tubers reached the late-bulking stage did not affect yield, at-harvest tuber quality, and tuber storage quality (Table 4 and Table 9) when compared to the standard rate at 100%ET or over-irrigation at 125%ET. The increased irrigation efficiency and water-use efficiency at 50%ET during the late growing season showed that irrigating below the standard level at 100%ET when tubers mature results in more efficient use of water (Table 4 and Table 5). In addition, reducing irrigation rate can reduce drainage, which is directly related to nitrate leaching to the groundwater (Figure 5 and Figure 6). Comparatively, irrigating at 125%ET could lead to significantly lower irrigation efficiency and water-use efficiency (Table 4 and Table 5), and higher nitrate leaching potential (Figure 5 and Figure 6) compared to the standard practice. In both years, the highest irrigation efficiency and water-use efficiency was found at the lowest deficit irrigation level at 50%ET. This was true for water use for both total yield and marketable yield. These results are in line with findings from Badr et al. [29].
Aside from overall water savings, irrigation management can interact with nitrogen management and nitrogen losses to groundwater, because the combination of intense irrigation and nitrogen requirements, together with the shallow rooting depth of potato, can result in high nitrate leaching potential [30]. Waddell et al. [31] showed that allowing the soil to become drier between irrigation events was beneficial in reducing N leaching, especially when rains occurred right after irrigation. Sexton et al. [32] showed that if applying irrigation to bring the soils back to field capacity, significant nitrate leaching occurred when thunderstorms followed soon after irrigation or fertilization. Saffigna et al. [33] allowed the soil to become drier between irrigation events, thus providing additional soil-water storage to retain unforeseen rainfall. The smaller spikes of volumetric water content after large rainfall event (>2.5 cm) in both topsoil and subsoil at the 50%ET rate compared to other irrigation treatments (Figure 3 and Figure 4) also indicated the lower nitrate leaching potential under the lowest deficit irrigation level in our study.
Overall our VWC data generally showed the trends that were expected under different irrigation rates, there were times when the trends were not reflected in the data. In particular, the standard irrigation rate at 100%ET in 2018 showed higher topsoil VWC than expected. This finding illustrated the spatial variability in soil hydrologic properties that exist throughout a field, especially in the topsoil. This might suggest the weakness of using soil sensors for closely monitoring water status throughout a field, and conveys the benefits of utilizing remote sensing that covers spatial variability.
7.2. Over-Irrigation Is Not Beneficial for Potato Yield, Quality, and Storage Quality
Our study showed that changes in late season irrigation amount did not impact total yield or marketable yield for all three chipping varieties in both years. Over-irrigation at 125%ET did not result in any improvement in total yield, marketable yield, internal quality, and specific gravity in either year of the study. Therefore, it is suggested that over-irrigation did not provide benefits to potato production in the context of this research. Over-irrigation has been considered by some farmers as an “insurance practice” to ensure crop yield gain. However, when the soil is maintained as excessively wet, root and tuber needs for oxygen are not met [13]. Tubers that develop in frequently saturated soil show swollen lenticels that provide openings for soft rot bacteria to enter [34], and are subject to secondary growth [35]. Tuber yields and marketable grade can decrease with over-irrigation [13,36]. Additionally, late-season excessive soil moisture could lead to tuber storage quality issues such as pink rot and Pythium leak 1997).
Further research is needed in the Central Sands region of Wisconsin to investigate potato performance under over-irrigation in dry years when precipitation does not substantially disrupt irrigation treatments. One strategy is to cover field plots with movable hoop houses during precipitation events, however, significant amount of labor and precise weather forecasting will be needed in order to make this strategy successful.
7.3. Extreme Weather Conditions Increase Year-to-Year Potato Crop Production Variation
When a precipitation event is larger than 1.3 cm in the central sands region of Wisconsin, irrigation is not needed [37], preventing the irrigation treatments of this study from being effectively applied. In 2018, the long period of precipitation from 21 August to 9 September substantially disrupted rate 5, the split deficit irrigation rate that was supposed to start with 50%ET on 20 August. A significant amount of commercial potato fields in that year were also affected by this long stretch of heavy rainfall that caused enlarged tuber lenticels associated with pathogen infection and storage quality issues, or crops not to be harvested due to saturated field conditions [38].
In 2019, the abnormally low amount of growing degree days from 1 May to 1 July contributed to lower yield and smaller tuber sizes compared to the previous year. It is important to note that hollow heart was almost non-existent in the 2019 tubers, most likely due to the reduced growing degree days and the consequently poor yield in this year.
A recent study has found that weather condition extremes, such as temperatures that are too hot and too cold, drought, and heavy precipitation, accounted for 18–43% of interannual variations in crop yield [39]. Extreme weather events are expected to affect the volatility of crop yields and are seen as the principle immediate threat to global crop production in the near future [40,41]. Among the various adaptation measures, those related to new crop variety development and modern irrigation technologies are considered more critical [42]. In this study, Hodag and Snowden showed higher IE and WUE than Lamoka (Table 8). This provides insights for future breeding efforts of developing new outstanding potato varieties that use water more efficiently.
Modern irrigation technologies, such as precision irrigation, are being widely promoted to resolve challenges regarding improving crop productivity under current variable weather patterns. Variable rate irrigation (VRI) technology used in this study is an innovative system that applies varying rates of irrigation amount along the length of the center pivots to address specific soil, crop, and/or other conditions [43]. VRI changes the spatial distribution of water applied to a given field without affecting the amount and timing of application. VRI is a potentially useful tool for enhancing farm profitability, irrigation water productivity (yield produced per unit of irrigation water applied), and water quality [44,45]. O’Shaughnessy et al. [46] had demonstrated the utility of VRI in deficit irrigation management to improve the efficiency of irrigation (e.g., reducing the fraction of irrigation that runs off, drains below the root zone or is otherwise not available for extraction by plant roots), because VRI may allow for a more spatially uniform managed level of water stress across a given field, by accounting for soil and other variability.
7.4. Increased Understanding of the Difference of Agronomic Performance between Chipping Varieties
Although irrigation treatment did not have a significant impact on traits measured at harvest and during storage, substantial varietal difference was observed in both total and marketable yield in both years (Table 2), which provided information for future agronomic research for new potato variety development. For example, Hodag showed higher total and marketable yield in both years, whereas Lamoka was the poorest yielder (Table 3). On the other hand, Hodag tubers had a higher incidence of hollow heart than Snowden and Lamoka tubers, supporting its features of greater yield potential and growing larger tubers.
Hodag and Lamoka are found to be more premium for retaining long-term storage quality, because Snowden showed senescent sweetening with increased sugar concentrations and worsened fry color during the late storage season (Table 8, Table 9 and Table 10). Senescent sweetening is a process that potato tubers in storage undergo a developmentally controlled, age-dependent shift in metabolism that results in an accumulation of sucrose, glucose, and fructose. Senescent sweetening negatively affects potato chip color and is manifested as a blush of dark color that begins in the center of the chip and progresses outward as sweetening becomes more severe [47]. Increasing the wound-healing temperature at the beginning of the storage season can mitigate the senescent sweetening issue on Snowden [38].
8. Conclusions
Sustainable irrigation is required for profitable commercial potato production. Our study suggested that over-irrigation at 125%ET when tubers reached late bulking was not beneficial for potato production in Central Wisconsin of the U.S., and deficit irrigation at 75%ET or even 50%ET during the late season could potentially result in more efficient and sustainable water use while not penalizing tuber yield, quality, and storability of chipping potatoes. While reductions in irrigation did not significantly affect production, choice in variety had major impacts, with Hodag showing the greatest potential for yield and tuber size, and Snowden showing the greatest risk of late season senescent sweetening.
Supplementary Materials
The following are available online at https://0-www-mdpi-com.brum.beds.ac.uk/article/10.3390/agronomy11040768/s1.
Author Contributions
Conceptualization: Y.W.; Funding acquisition: Y.W.; Methodology: Y.W. and T.W.C.; Data curation and formal analysis: T.W.C.; Original draft preparation: T.W.C.; Review and editing: Y.W. and T.W.C. All authors have read and agreed to the published version of the manuscript.
Funding
This research was supported by an industry research grant entitled Evaluating irrigation management practices for chipping potato varieties in Wisconsin. The grant was provided by the Wisconsin Potato Industry Board.
Institutional Review Board Statement
Not applicable.
Informed Consent Statement
Not applicable.
Data Availability Statement
The data presented in this study are available on request from the corresponding author.
Acknowledgments
The authors thank Paul Sytsma, Jerry Pierce, and the field crew at the University of Wisconsin Hancock Agricultural Research Station for providing field management assistance, particularly operating the VRI system to impose different irrigation treatments for this study. The authors thank Troy Fishler, Amber Gotch and the storage crew at the University of Wisconsin Hancock Potato Research Facility for conducting storage quality evaluation. The authors also thank the Wisconsin Potato and Vegetable Growers Association for providing funds to support this research.
Conflicts of Interest
The authors declare no conflict of interest.
Abbreviations
| Evapotranspiration | (ET) |
| Variable Rate Irrigation | (VRI) |
| Water Content Reflectometer | (WCR) |
| Volumetric Water Content | (VWC) |
| Irrigation Efficiency | (IE) |
| Water-Use Efficiency | (WUE) |
| Fresh Weight | (FW) |
References
- Ati, A.; Lyada, A.; Najim, S. Water use efficiency of potato (Solanum tuberosum L.) under different irrigation methods and potassium fertilizer rates. Ann. Agric. Sci. 2012, 57, 99–103. [Google Scholar] [CrossRef] [Green Version]
- Misra, A.K. Climate change and challenges of water and food security. Int. J. Sustain. Built Environ. 2014, 3, 153–165. [Google Scholar] [CrossRef] [Green Version]
- Keene, A.A.; Mitchell, P.D. Economic Impact of Specialty Crop Production and Processing in Wisconsin; University of Wisconsin—Extension, Cooperative Extension: Madison, WI, USA, 2010. [Google Scholar]
- National Potato Council. Potato Statistical Yearbook; NPC: Washington, DC, USA, 2018. [Google Scholar]
- Kniffin, M.; Potter, K.; Bussan, A.J.; Colquhoun, J.; Bradbury, K. Sustaining Central Sands Water Resources: State of the Science 2014; University of Wisconsin—Extension, Cooperative Extension: Madison, WI, USA, 2014; p. 45. Available online: https://learningstore.uwex.edu/Assets/pdfs/G4058.pdf (accessed on 1 July 2020).
- Luczaj, J.; Masarik, K. Groundwater quantity and quality issues in a water-rich region: Examples from Wisconsin, USA. Resources 2015, 4, 323–357. [Google Scholar] [CrossRef]
- Kraft, G.J.; Clancy, K.; Mechenich, D.J.; Haucke, J. Irrigation effects in the northern lake states: Wisconsin central sands revisited. Groundwater 2012, 50, 308–318. [Google Scholar] [CrossRef] [PubMed]
- Jefferies, R.A.; Heilbronn, T.D. Water stress as a constraint on growth in the potato crop. 1. Model development. Agric. For. Meteorol. 1991, 53, 185–196. [Google Scholar] [CrossRef]
- Fabeiro, C.; de Santa Olalla, F.M.; de Juan, J.A. Yield and size of deficit irrigated potatoes. Agric. Water Manag. 2001, 48, 255–266. [Google Scholar] [CrossRef]
- Trippensee, A.; Byrne, P.; Boggess, W.; Smajstrla, A. Management Effect on Irrigation Water Use for Potato Farms of North Florida; Food and Resource Economics Department, Institute of Food and Agricultural Sciences, University of Florida: Gainesville, FL, USA, 1996. [Google Scholar]
- Shock, C.C.; Pereira, A.B.; Eldredge, E.P. Irrigation best management practices for potato. Am. J. Potato Res. 2007, 84, 29–37. [Google Scholar] [CrossRef]
- MacKerron, D.K.L.; Jefferies, R.A. The influence of early soil moisture stress on tuber numbers in potato. Potato Res. 1986, 29, 299–312. [Google Scholar] [CrossRef]
- Holder, C.B.; Cary, J.W. Soil oxygen and moisture in relation to Russet Burbank potato yield and quality. Am. Potato J. 1984, 61, 67–75. [Google Scholar] [CrossRef]
- English, M. Deficit irrigation. I. Analytical framework. J. Irrig. Drain. Eng. 1990, 116, 400–402. [Google Scholar] [CrossRef]
- Stark, J.C.; Love, S.L. Potato Production Systems; University of Idaho Agricultural Communications: Moscow, ID, USA, 2003. [Google Scholar]
- Mihovilovich, E.; Carli, C.; de Hualla, M.F.V.; Bonierbale, M.W. Tuber Bulking Maturity Assessment of Elite and Advanced Potato Clones Protocol; International Potato Center (CIP): Lima, Peru, 2014. [Google Scholar]
- Dwyer, L.M.; Boisvert, J.B. Response to irrigation of two potato cultivars (Solanum tuberosum L.’Kennebec’and’Superior’). Can. Agric. Eng. 1990, 32, 197–203. [Google Scholar]
- Walworth, J.L.; Carling, D.E. Tuber initiation and development in irrigated and non-irrigated potatoes. Am. J. Potato Res. 2002, 79, 387–395. [Google Scholar] [CrossRef]
- Ojala, J.C.; Stark, J.C.; Kleinkopf, G.E. Influence of irrigation and nitrogen management on potato yield and quality. Am. Potato J. 1990, 67, 29–43. [Google Scholar] [CrossRef]
- Yost, J.L. Soil Carbon and Soil Moisture Variation in Cropped Fields of the Central Sands in Wisconsin. Ph.D. Thesis, University of Wisconsin—Madison, Madison, WI, USA, 2016. [Google Scholar]
- Bohman, B.J.; Rosen, C.J.; Mulla, D.J. Evaluation of variable rate nitrogen and reduced irrigation management for potato production. Agron. J. 2019, 111, 2005–2017. [Google Scholar] [CrossRef]
- Colquhoun, J.B.; Chapman, S.A.; Gevens, A.J.; Groves, R.L.; Heider, D.J.; Jensen, B.M.; Nice, G.R.W.; Ruark, M.D. Commercial Vegetable Production in Wisconsin; University of Wisconsin Extension: Madison, WI, USA, 2019. [Google Scholar]
- Sowokinos, J.R.; Shock, C.C.; Stieber, T.D.; Eldredge, E.P. Compositional and enzymatic changes associated with the sugar-end defect in Russet Burbank potatoes. Am. J. Potato Res. 2000, 77, 47–56. [Google Scholar] [CrossRef]
- R Core Team. R: A Language and Environment for Statistical Computing. 2019. Available online: http://www.r-project.org/ (accessed on 10 July 2020).
- De Mendiburu, F.; Yaseen, M. Agricolae: Statistical Procedures for Agricultural Research, R Package Version 1.4.0. 2020. Available online: https://myaseen208.github.io/agricolae/https://cran.r-project.org/package=agricolae (accessed on 10 July 2020).
- SAS Institute Inc. SAS/ACCESS® 9.4 Interface; SAS Institute Inc.: Cary, NC, USA, 2013. [Google Scholar]
- Bussan, A.J. Growth of Chipping Potatoes as Influenced by Reduced Irrigation. Unpublished work; 2013. [Google Scholar]
- Hassan, A.A.; Sarkar, A.A.; Ali, M.H.; Karim, N.N. Effect of deficit irrigation at different growth stages on the yield of potato. Pak. J. Biol. Sci. 2002, 5, 128–134. [Google Scholar] [CrossRef]
- Badr, M.A.; El-Tohamy, W.A.; Zaghloul, A.M. Yield and water use efficiency of potato grown under different irrigation and nitrogen levels in an arid region. Agric. Water Manag. 2012, 110, 9–15. [Google Scholar] [CrossRef]
- Roberts, S.; Qubrosi, R.N.; Rhee, J.K. Uptake and mobility of nutrients as influenced by potato irrigation. In Proceedings of the Annual Washington State Potato Conference and Trade Fair, Moses Lake, WA, USA, 5–7 February 1991; pp. 57–63. [Google Scholar]
- Waddell, J.T.; Gupta, S.C.; Moncrief, J.F.; Rosen, C.J.; Steele, D.D. Irrigation-and nitrogen-management impacts on nitrate leaching under potato. J. Environ. Qual. 2000, 29, 251–261. [Google Scholar] [CrossRef]
- Sexton, B.T.; Moncrief, J.F.; Rosen, C.J.; Gupta, S.C.; Cheng, C.C. Optimizing Nitrogen and Irrigation Inputs for Corn Based on Nitrate Leaching and Yield on a Coarse—Textured Soil; American Society of Agronomy, Crop Science Society of America, and Soil Science Society of America: Madison, WI, USA, 1996; Volume 25. [Google Scholar]
- Saffigna, P.G.; Keeney, D.R.; Tanner, C.B. Nitrogen, Chloride, and Water Balance with Irrigated Russet Burbank Potatoes in a Sandy Soil 1. Agron. J. 1977, 69, 251–257. [Google Scholar] [CrossRef]
- Timm, H.; Flocker, W.J. Responses of Potato Plants to Fertilization and Soil Moisture Tension Under Induced Soil Compaction 1. Agron. J. 1966, 58, 153–157. [Google Scholar] [CrossRef]
- Bradley, G.A.; Pratt, A.J. The effect of different combinations of soil moisture and nitrogen levels on early plant development and tuber set of the potato. Am. Potato J. 1955, 32, 254–258. [Google Scholar] [CrossRef]
- Hill, H.M. Irrigation-The option for economic development. In Proceedings of the Irrigation on the Prairies: Proceedings of the 4th Annual Western Provincial Conference Rationalization of Water and Soil Research and Management, Saskatoon, SK, Canada, 25–27 November 1985; pp. 233–245. [Google Scholar]
- Colquhoun, J.B.; Chapman, S.A.; Gevens, A.J.; Groves, R.L.; Heider, D.J.; Jensen, B.M.; Nice, G.R.W.; Ruark, M.D.; Wang, Y. Commercial Vegetable Production in Wisconsin 2020; Madison Extension Publication A3422; University of Wisconsin—Extension, Cooperative Extension: Madison, WI, USA, 2020. [Google Scholar]
- Wang, Y.; Naber, M.R.; Crosby, T.W. Effects of wound healing management on potato postharvest storability. Agronomy 2020, 10, 512. [Google Scholar] [CrossRef] [Green Version]
- Vogel, E.; Donat, M.G.; Alexander, L.V.; Meinshausen, M.; Ray, D.K.; Karoly, D.; Frieler, K. The effects of climate extremes on global agricultural yields. Environ. Res. Lett. 2019, 14, 054010. [Google Scholar] [CrossRef]
- Urban, D.; Roberts, M.J.; Schlenker, W.; Lobell, D.B. Projected temperature changes indicate significant increase in interannual variability of US maize yields. Clim. Chang. 2012, 112, 525–533. [Google Scholar] [CrossRef]
- Lobell, D.B.; Hammer, G.L.; McLean, G.; Messina, C.; Roberts, M.J.; Schlenker, W. The critical role of extreme heat for maize production in the United States. Nat. Clim. Chang. 2013, 3, 497–501. [Google Scholar] [CrossRef]
- Varela-Ortega, C.; Blanco-Gutiérrez, I.; Esteve, P.; Bharwani, S.; Fronzek, S.; Downing, T.E. How can irrigated agriculture adapt to climate change? Insights from the Guadiana Basin in Spain. Reg. Environ. Chang. 2016, 16, 59–70. [Google Scholar] [CrossRef] [Green Version]
- Evans, R.G.; LaRue, J.; Stone, K.C.; King, B.A. Adoption of site-specific variable rate sprinkler irrigation systems. Irrig. Sci. 2013, 31, 871–887. [Google Scholar] [CrossRef] [Green Version]
- Hedley, C.B.; Yule, I.J.; Bradbury, S. Analysis of Potential Benefits of Precision Irrigation for Variable Soils at Five Pastoral and Arable Production Sites in New Zealand. In Proceedings of the 19th World Congress of Soil Science, Soil Solutions for a Changing World, Brisbane, Australia, 1–6 August 2010; pp. 1–6. Available online: https://iuss.org/19th%20WCSS/Symposium/pdf/1104.pdf (accessed on 10 July 2020).
- Perea, R.G.; Daccache, A.; Díaz, J.R.; Poyato, E.C.; Knox, J.W. Modelling impacts of precision irrigation on crop yield and in-field water management. Precis. Agric. 2018, 19, 497–512. [Google Scholar] [CrossRef]
- O’Shaughnessy, S.A.; Evett, S.R.; Colaizzi, P.D.; Andrade, M.A.; Marek, T.H.; Heeren, D.M.; Lamm, F.R.; LaRue, J.L. Identifying advantages and disadvantages of variable rate irrigation: An updated review. Appl. Eng. Agric. 2019, 35, 837–852. [Google Scholar] [CrossRef]
- Wiberley-Bradford, A.E.; Bethke, P.C. Suppression of the vacuolar invertase gene delays senescent sweetening in chipping potatoes. J. Sci. Food Agric. 2017, 98, 354–360. [Google Scholar] [CrossRef]
Figure 1.
Accumulated growing degree days, 1 May to 1 July, from 2011 to 2019. 2018 and 2019 were marked to indicate that they had the highest and lowest numbers, respectively.
Figure 1.
Accumulated growing degree days, 1 May to 1 July, from 2011 to 2019. 2018 and 2019 were marked to indicate that they had the highest and lowest numbers, respectively.

Figure 2.
Irrigation (black bars) and precipitation (grey bars) records at the University of Wisconsin (UW) Hancock Agricultural Research Station in 2018 (a) and 2019 (b). The blue arrow in each graph indicates date of irrigation treatment initiation (25 July).
Figure 2.
Irrigation (black bars) and precipitation (grey bars) records at the University of Wisconsin (UW) Hancock Agricultural Research Station in 2018 (a) and 2019 (b). The blue arrow in each graph indicates date of irrigation treatment initiation (25 July).


Figure 3.
Volumetric water content (VWC) data from 2018. The black line indicated VWC at 0–30 cm soil depth, and the grey line indicated VWC at 30–60 cm soil depth. Start of the irrigation treatment, which was on 25 July, was marked by a red line. Gaps in the graphs were due to equipment errors.
Figure 3.
Volumetric water content (VWC) data from 2018. The black line indicated VWC at 0–30 cm soil depth, and the grey line indicated VWC at 30–60 cm soil depth. Start of the irrigation treatment, which was on 25 July, was marked by a red line. Gaps in the graphs were due to equipment errors.

Figure 4.
Volumetric water content (VWC) data from 2019. The black line indicated VWC at 0–30 cm soil depth, and the grey line indicated VWC at 30–60 soil depth. Start of the irrigation treatment, which was on 25 July, was marked by a red line. Gaps in the graphs were due to equipment errors.
Figure 4.
Volumetric water content (VWC) data from 2019. The black line indicated VWC at 0–30 cm soil depth, and the grey line indicated VWC at 30–60 soil depth. Start of the irrigation treatment, which was on 25 July, was marked by a red line. Gaps in the graphs were due to equipment errors.

Figure 5.
Weekly soil water balance values under each irrigation treatment in 2018.

Figure 6.
Weekly soil water balance values under each irrigation treatment in 2019.


Table 1.
Irrigation treatments that were applied in this study.
| Irrigation Rate | Treatments |
|---|---|
| 1—over irrigation | Irrigation at 125% of adjusted evapotranspiration (ET) |
| 2—standard irrigation | Irrigation at 100%ET, standard treatment |
| 3—deficit irrigation 1 | Irrigation at 75%ET |
| 4—deficit irrigation 2 | Irrigation at 50%ET |
| 5 *—deficit irrigation 3 | Irrigation at 75%ET starting on 25 July, and then at 50% ET starting on 20 August |
* Rate 5 was only applied in 2019.
Table 2.
At-harvest analysis of variance (ANOVA) results for 2018 and 2019.
| Source | Total Yield | Marketable Yield | Hollow Heart Incidence | Specific Gravity | Irrigation Efficiency | Water-Use Efficiency | ||
|---|---|---|---|---|---|---|---|---|
| Total Yield | Marketable Yield | Total Yield | Marketable Yield | |||||
| 2018 | ||||||||
| Irrigation Rate | - | - | - | - | 0.002 | 0.025 | 0.025 | 0.002 |
| Variety | <0.001 | <0.001 | <0.001 | 0.035 | - | - | - | - |
| Rate × Variety | - | - | - | - | - | - | - | - |
| 2019 | ||||||||
| Irrigation Rate | - | - | - | - | 0.038 | - | 0.022 | - |
| Variety | <0.001 | <0.001 | <0.001 | 0.013 | <0.001 | - | <0.001 | - |
| Rate × Variety | - | - | - | - | - | - | - | - |
Values that were not significant at α = 0.05 are indicated as ‘-’.
Table 3.
Total yield, marketable yield, hollow heart incidence and specific gravity of the three chipping varieties for 2018 and 2019. Numbers followed by the same letter are not significantly different at α = 0.05.
Table 3.
Total yield, marketable yield, hollow heart incidence and specific gravity of the three chipping varieties for 2018 and 2019. Numbers followed by the same letter are not significantly different at α = 0.05.
| Variety | Total Yield (Mg ha−1) | Marketable Yield (Mg ha−1) | Hollow Heart Incidence | Specific Gravity | ||||
|---|---|---|---|---|---|---|---|---|
| 2018 | 2019 | 2018 | 2019 | 2018 | 2019 | 2018 | 2019 | |
| Hodag | 75.2 b | 61.4 a | 54.0 a | 27.2 a | 18% a | 6% a | 1.076 a | 1.083 a |
| Lamoka | 52.0 c | 51.6 b | 34.1 c | 9.0 b | 3% b | 0% b | 1.072 b | 1.080 b |
| Snowden | 81.3 a | 61.2 a | 48.1 b | 10.9 b | 3% b | 0% b | 1.075 a | 1.082 ab |
Table 4.
Effects of irrigation rate on irrigation efficiency (IE) and water-use efficiency (WUE) for producing total yield in 2018 and 2019. Within each year and efficiency type, numbers followed by different letters are significantly different at α = 0.05.
Table 4.
Effects of irrigation rate on irrigation efficiency (IE) and water-use efficiency (WUE) for producing total yield in 2018 and 2019. Within each year and efficiency type, numbers followed by different letters are significantly different at α = 0.05.
| Treatment | Irrigation Efficiency (Mg ha−1 cm−1 of Water) | Water-Use Efficiency (Mg ha−1 cm−1 of Water) |
|---|---|---|
| 2018 | ||
| Rate 1 (125%ET) | 1.23 c | 0.59 b |
| Rate 2 (100%ET) | 1.68 b | 0.77 a |
| Rate 3 (75%ET) | 1.84 ab | 0.80 a |
| Rate 4 (50%ET) | 1.96 a | 0.81 a |
| 2019 | ||
| Rate 1 (125%ET) | 1.38 c | 0.63 b |
| Rate 2 (100%ET) | 1.56 bc | 0.66 ab |
| Rate 3 (75%ET) | 1.64 b | 0.67 ab |
| Rate 4 (50%ET) | 1.83 a | 0.70 a |
| Rate 5 (75–50%ET) | 1.74 ab | 0.69 a |
Table 5.
Effects of irrigation rate on irrigation efficiency (IE) and water-use efficiency (WUE) for producing marketable yield in 2018. Within each year and efficiency type, numbers followed by different letters are significantly different at α = 0.05.
Table 5.
Effects of irrigation rate on irrigation efficiency (IE) and water-use efficiency (WUE) for producing marketable yield in 2018. Within each year and efficiency type, numbers followed by different letters are significantly different at α = 0.05.
| Treatment | Irrigation Efficiency (Mg ha−1 cm−1 of Water) | Water-Use Efficiency (Mg ha−1 cm−1 of Water) |
|---|---|---|
| Rate 1 | 0.82 c | 0.39 b |
| Rate 2 | 1.14 b | 0.52 a |
| Rate 3 | 1.33 a | 0.58 a |
| Rate 4 | 1.32 a | 0.54 a |
Table 6.
Varietal difference of irrigation efficiency (IE) and water-use efficiency (WUE) for producing total yield of the three chipping varieties in 2019. Within each column, numbers followed by different letters are significantly different at α = 0.05.
Table 6.
Varietal difference of irrigation efficiency (IE) and water-use efficiency (WUE) for producing total yield of the three chipping varieties in 2019. Within each column, numbers followed by different letters are significantly different at α = 0.05.
| Variety | Total Yield | |
|---|---|---|
| IE (Mg ha−1 cm−1 of Water) | WUE (Mg ha−1 cm−1 of Water) | |
| Hodag | 1.72 a | 0.71 a |
| Lamoka | 1.45 b | 0.60 b |
| Snowden | 1.71 a | 0.71 a |
Table 7.
ANOVA results of sucrose, glucose and chip fry color for 2018 and 2019 separately. Values that were not significant at α = 0.05 are indicated as ‘-’.
Table 7.
ANOVA results of sucrose, glucose and chip fry color for 2018 and 2019 separately. Values that were not significant at α = 0.05 are indicated as ‘-’.
| Source | Sucrose Concentration (mg g−1 FW) | Glucose Concentration (mg g−1 FW) | Fry Color |
|---|---|---|---|
| 2018 | |||
| Irrigation Rate (R) | - | - | - |
| Variety (V) | <0.001 | <0.001 | <0.001 |
| R × V | - | - | - |
| Storage Length (S) | <0.001 | <0.001 | <0.001 |
| R × S | - | - | - |
| V × S | <0.001 | <0.001 | - |
| R × V × S | - | - | - |
| 2019 | |||
| Irrigation Rate (R) | - | - | - |
| Variety (V) | 0.024 | <0.001 | - |
| R × V | - | - | - |
| Storage Length (S) | - | <0.001 | <0.001 |
| R × S | - | - | - |
| V × S | <0.001 | <0.001 | <0.001 |
| R × V × S | - | - | - |
Table 8.
Sucrose and glucose concentrations in 2018 significantly affected by the interaction between variety and storage length. Within each sugar type, numbers followed by different letters are significantly different at α = 0.05.
Table 8.
Sucrose and glucose concentrations in 2018 significantly affected by the interaction between variety and storage length. Within each sugar type, numbers followed by different letters are significantly different at α = 0.05.
| Storage Length | Sucrose Concentration (mg g−1 FW) | Glucose Concentration (mg g−1 FW) |
|---|---|---|
| Hodag | ||
| 0 Months | 0.499 cd | 0.041 bc |
| 4 Months | 0.625 bc | 0.081 b |
| 8 Months | 0.628 bc | 0.025 c |
| Lamoka | ||
| 0 Months | 0.656 b | 0.039 bc |
| 4 Months | 0.580 bc | 0.036 bc |
| 8 Months | 0.524 c | 0.003 d |
| Snowden | ||
| 0 Months | 0.575 bc | 0.061 b |
| 4 Months | 0.433 d | 0.040 bc |
| 8 Months | 1.43 a | 0.366 a |
Table 9.
Sucrose and glucose concentrations in 2019 significantly affected by the interaction between variety and storage length. Within each sugar type, numbers followed by different letters are significantly different at α = 0.05.
Table 9.
Sucrose and glucose concentrations in 2019 significantly affected by the interaction between variety and storage length. Within each sugar type, numbers followed by different letters are significantly different at α = 0.05.
| Storage Length |
Sucrose Concentration (mg g−1 FW) |
Glucose Concentration (mg g−1 FW) |
|---|---|---|
| Hodag | ||
| 4 Months | 0.612 b | 0.149 ab |
| 8 Months | 0.298 c | 0.032 c |
| Lamoka | ||
| 4 Months | 0.527 bc | 0.136 ab |
| 8 Months | 0.296 c | 0.012 c |
| Snowden | ||
| 4 Months | 0.343 c | 0.104 b |
| 8 Months | 0.822 a | 0.196 a |
Table 10.
Chip fry color, indicated by Hunter-L values, in 2019 that was significantly influenced by the interaction between variety and storage length. Numbers followed by different letters are significantly different at α = 0.05.
Table 10.
Chip fry color, indicated by Hunter-L values, in 2019 that was significantly influenced by the interaction between variety and storage length. Numbers followed by different letters are significantly different at α = 0.05.
| Storage Length | Hunter-L Value |
|---|---|
| Hodag | |
| 0 Months | 60.2 ab |
| 4 Months | 56.8 c |
| 8 Months | 60.5 ab |
| Lamoka | |
| 0 Months | 61.0 ab |
| 4 Months | 57.5 c |
| 8 Months | 62.4 a |
| Snowden | |
| 0 Months | 59.7 b |
| 4 Months | 59.5 bc |
| 8 Months | 51.7 d |
Publisher’s Note: MDPI stays neutral with regard to jurisdictional claims in published maps and institutional affiliations. |
© 2021 by the authors. Licensee MDPI, Basel, Switzerland. This article is an open access article distributed under the terms and conditions of the Creative Commons Attribution (CC BY) license (https://creativecommons.org/licenses/by/4.0/).
Share and Cite
MDPI and ACS Style
Crosby, T.W.; Wang, Y. Effects of Irrigation Management on Chipping Potato (Solanum tuberosum L.) Production in the Upper Midwest of the U.S. Agronomy 2021, 11, 768. https://0-doi-org.brum.beds.ac.uk/10.3390/agronomy11040768
AMA Style
Crosby TW, Wang Y. Effects of Irrigation Management on Chipping Potato (Solanum tuberosum L.) Production in the Upper Midwest of the U.S. Agronomy. 2021; 11(4):768. https://0-doi-org.brum.beds.ac.uk/10.3390/agronomy11040768
Chicago/Turabian StyleCrosby, Trevor W., and Yi Wang. 2021. "Effects of Irrigation Management on Chipping Potato (Solanum tuberosum L.) Production in the Upper Midwest of the U.S." Agronomy 11, no. 4: 768. https://0-doi-org.brum.beds.ac.uk/10.3390/agronomy11040768
Note that from the first issue of 2016, this journal uses article numbers instead of page numbers. See further details here.