Article

Canopy Temperature as a Key Physiological Trait to Improve Yield Prediction under Water Restrictions in Potato

1
International Potato Center (CIP), Headquarters P.O. Box 1558, Lima 15024, Peru
2
Department of Meteorological Engineering and Climate Risk Management, Science Faculty, Universidad Nacional Agraria La Molina (UNALM), Av. La Molina 12 s/n, Lima 15024, Peru
3
Centro Agronómico Tropical de Investigación y Enseñanza (CATIE), Cartago Turrialba 30501, Costa Rica
*
Author to whom correspondence should be addressed.
Submission received: 12 June 2021 / Revised: 14 July 2021 / Accepted: 14 July 2021 / Published: 20 July 2021
(This article belongs to the Special Issue Water Saving in Irrigated Agriculture)

Abstract

:
Canopy temperature (CT) as a surrogate of stomatal conductance has been highlighted as an essential physiological indicator for optimizing irrigation timing in potatoes. However, assessing how this trait could help improve yield prediction will help develop future decision support tools. In this study, the incorporation of CT minus air temperature (dT) in a simple ecophysiological model was analyzed in three trials between 2017 and 2018, testing three water treatments under drip (DI) and furrow (FI) irrigations. Water treatments consisted of control (irrigated until field capacity) and two-timing irrigation based on physiological thresholds (CT and stomatal conductance). Two model perspectives were implemented based on soil water balance (P1) and using dT as the penalizing factor (P2), affecting the biomass dynamics and radiation use efficiency parameters. One of the trials was used for model calibration and the other two for validation. Statistical indicators of the model performance determined a better yield prediction at harvest for P2, especially under maximum stress conditions. The P1 and P2 perspectives showed their highest coefficient of determination (R 2 ) and lowest root-mean-squared error (RMSE) under DI and FI, respectively. In the future, the incorporation of CT combining low-cost infrared devices/sensors with spatial crop models, satellite image information, and telemetry technologies, an adequate decision support system could be implemented for water requirement determination and yield prediction in potatoes.

1. Introduction

Global food demand will increase because of the rapid population growth, which will reach around nine billion people by 2050; therefore, the agricultural sector will need more water resources to supply this demand [1]. The increase of temperature and drought intensity/frequency brought about by climate change will affect water availability and accessibility [2]. On the other hand, potato is the most important noncereal food security crop worldwide, highlighted by its high potential yield, elevated nutritional value, high water productivity, and wide climatic adaptability [3,4,5]. This crop has a high water requirement (3500–6500 m 3 ha 1 ; [6]), being sensitive to water stress due to its shallow-rooted system [7,8]. Many water-saving irrigation strategies and water management practices to optimize crop yield have been reported in the literature [9]. Thus, the maximum light-saturated stomatal conductance ( g s _ m a x ), considered the most critical physiological trait to determine the crop water status [10], has recently been used to define optimal irrigation thresholds (0.15 mol H 2 O m 2 s 1 ). This threshold value allows saving water without affecting potato yield [10,11]. In addition, the crop water stress index (CWSI) is a radiometric canopy temperature-based index that is closely related to g s _ m a x [12,13]. It is widely used for water stress monitoring/detection for watering purposes, CWSI being a noninvasive and more efficient measurement than g s _ m a x [10,14]. Although crop models are predominantly developed and calibrated under nonlimiting conditions, fundamental advances in yield prediction under water restriction in potato are also available in the literature [15,16]. Thus, there is the possibility to convert crop models into suitable tools for irrigation scheduling, provided water routines do not depend solely on soil moisture status [17]. New relationships (routines) among physiological water stress responses and above-/below-ground biomass have been researched to improve model performance [15], as well as remote–proximal sensing data assimilation methods for the calibration process [18]. Canopy temperature has been tested on crop models to improve yield prediction under stress conditions in cereals [19,20,21]. In potatoes, the canopy temperature’s usefulness in irrigation scheduling has been highlighted in several studies [13,22,23]; this notwithstanding, its application to yield prediction by using crop models has been overlooked. Thus, crop modeling applications that include canopy temperature as a critical input variable, along with advances in low-cost infrared devices/sensors, improvements in satellite images’ temporal/spatial resolution, and the development of radio telemetry technologies have the potential to improve irrigation scheduling and simplify the construction of water stress and yield maps [22,24,25].
In the present study, the two perspectives of potato yield prediction potential and water-limited conditions were analyzed by using a simple ecophysiological crop model (SOLANUM): (i) based on the crop water stress degree determined by a routine of soil water balance (first perspective, P1) and (ii) based on dT effect analysis on the tuber yield’s most critical parameters from the SOLANUM model (second perspective, P2). For P2, a reparameterization of those critical parameters, as a function of how water stress level affects dT, was performed. The study’s aims were: (i) to incorporate canopy temperature into the SOLANUM potato growth model under the modeling perspective P2 and compare its performance against perspective P1 on tuber yield prediction by both perspectives under different water stress levels and (ii) to compare the SOLANUM model’s performance under drip (DI) and furrow (FI) irrigations. The first hypothesis was that canopy temperature incorporation into the SOLANUM model improves potato yield prediction (better performance under P2) because it integrates the whole plant water stress response in different soil moisture contexts. However, since the crop physiological water stress response is irrigation system dependent [11], the second hypothesis states that there would be differences in the model performance of both perspectives (P1 and P2) depending on the irrigation type.

2. Materials and Methods

2.1. Study Area and Plant Material

Three field trials were carried out at the International Potato Center (CIP) and National Agrarian University-La Molina (UNALM) research stations from 5 July to 10 October 2017 (Trial A, at CIP), 5 October to 15 January 2017–2018 (Trial B, at CIP), and 13 June to 13 September 2017 (Trial C, at UNALM). These research stations are located in the Lima region, central coast of Peru (12.08° S, 76.95° W, 244 m.a.s.l.), characterized by an arid and semiwarm climate with humidity deficiency throughout the year [26]. At this site, the average yearly precipitation, relative humidity, solar radiation, minimum temperature, and maximum temperature are 6.0 mm, 81.2 ± 1.58%, 13.6 ± 1.29 MJ m 2 day 1 , 15.9 ± 0.74 °C, and 26.8 ± 0.99 °C, respectively (data for 2013–2019, CIP meteorological station). In addition, the day temperature, night temperature, and photoperiod were in the ranges of 12.4–32.5 °C, 12.0–28.0 °C, and 11.3–12.7 h during the trials. The potato variety used was UNICA (CIP code: 392797.22), an early genotype well adapted to the desertic conditions of the Peruvian coast, with slight tolerance to salinity and heat, moderate tolerance to drought, and resistance to the virus PVY [27,28].

2.2. Experimental Conditions and Crop Management

The soil in the study area had a sandy-loam texture, with a phosphorous, potassium, and organic matter content and a cation exchange capacity in the ranges of 14.9–45.9 ppm, 197.3–273.2 ppm, 1.31–1.53%, and 9.74–10.56 Cmol(+) kg 1 , respectively (Laboratorio de Análisis de Suelo, Plantas, Agua y Fertilizantes–Universidad Nacional Agraria La Molina, Lima, Peru). A plant density of 3.7 plants m 2 was used in all the trials. A completely randomized block design was established under two irrigation types: DI and FI (see the details in Table 1). Integrated management of pests and diseases, which included ethological and pheromone traps and chemical applications, was implemented (see the specific products and doses applied for Trial A and Trials B and C in [11,22], respectively), together with recommended fertilization doses ([29]; see Table 1), to ensure that water was the only limiting factor. Two-timing irrigation treatments were applied (from the tuber initiation onset (TIO)) to submit the crop to different water stress levels and compare against a control. These treatments were defined with the maximum light-saturated stomatal conductance ( g s _ m a x , in Trial A) using a portable photosynthesis system (LI6400 TX, LICOR-Bioscience, Lincoln, NE, USA) and the crop water stress index (CWSI, in Trials B and C) using a thermal camera (Model E60, FLIR Systems Inc., Täby, Sweden). The portable photosynthesis system was configured as 1500 μ mol m 2 s 1 of PAR (light saturation point), 400 ppm of CO 2 , 9.29 mol m 2 s 1 of boundary layer conductance, 500 μ mol s 1 of airflow, 19.0–23.8 °C of leaf temperature, and 1.2–1.8 kPa of pressure deficit, the measurements being recorded between 8:00 and 11:00 a.m. (see the details in [11]). Irrigation pulses (to achieve soil moisture at field capacity) were supplied each time the crop reached the average g s _ m a x (0.05 and 0.15 mol H 2 O m 2 s 1 ) or CWSI (0.4 and 0.6) threshold values established for each treatment (see Table 1). The specific methodology for leaf/plant samplings for threshold assessments, g s _ m a x measurement details, CWSI calculus, and meteorological conditions for the growing season in Trial A and Trials B and C can be found in [11,22], respectively.

2.3. Crop Measurements

Six sequential biomass samplings were performed in each trial (from TIO to physiological maturity). Six center plants were individually harvested and separated into leaves, stems, and tubers. Subsamples of approximately 100 g of fresh weight of above- (leaves and stems) and below-ground (tubers) biomass were dried at 80 °C for 3 days to estimate dry matter percentage (DMP) and total dry matter (TDM) as in [30]. Dry tuber yield (DTY) was then estimated by multiplying fresh tuber yield (FTY) by the DMP of belowground biomass. In turn, the harvest index (HI) was estimated as the ratio of DTY to TDM. Canopy cover (CC) was evaluated weekly using a digital camera (D5300, Nikon, Thailand) according to CIP’s protocol established for potatoes [31]. The digital images were processed with the Image-Canopy software (v3.6, CIP, 2017), which classifies the potato’s healthy green foliage throughout a segmentation algorithm. To determine the canopy temperature, thermal and RGB images were taken using an FLIR thermal camera (Model E60, FLIR Systems Inc., Täby, Sweden) around 13:00–15:00 h, according to Rinza et al.’s [13] procedure (see Figure S1). The spatial resolution of the thermal and RGB FLIR camera’s sensors was 320 × 240 and 2048 × 1536 pixels, with an angular field-of-view of 25° × 19° and 53° × 41°, respectively. These evaluations were performed from TIO to physiological maturity with a ∼1-daily frequency. The thermal images were processed with the TIPCIP software (Version 3.6, CIP, 2018), which aligns the thermal and RGB images and extracts the temperature of the crop according to the green pixels of the RGB image [22] (Figure S1). Finally, canopy temperature depression (dT) was calculated as canopy temperature (obtained from the thermal images) minus air temperature (measured with a HOBO meteorological station at the same time in which the thermal images were recorded).

2.4. Potato Yield Simulation

2.4.1. Potential Yield Modeling Calibration

The SOLANUM potato potential growth model [30,32] was used. This model uses eight crop parameters that describe light interception’s main processes, intercepted light (radiation) conversion into biomass and biomass translocation to the tubers (see the details in [32,33]). The parameters related to light interception and the biomass translocation process (Table 2) were estimated by nonlinear regression fitting of CC and HI measured data to a Beta and Gompertz function, respectively [34]. These analyses were performed using the R software [35]. The radiation use efficiency (RUE) was calculated as the slope of the linear regression (passing through the origin) between the total dry biomass (in g m 2 ) and the intercepted and accumulated photosynthetically active radiation (in MJ m 2 ), as in Condori et al. [32] and Kooman et al. [36]. Tuber dry matter concentration (DMc) was calculated as the ratio dry–fresh tuber weight [31]. The model was calibrated with data from Trial B’s control treatment.

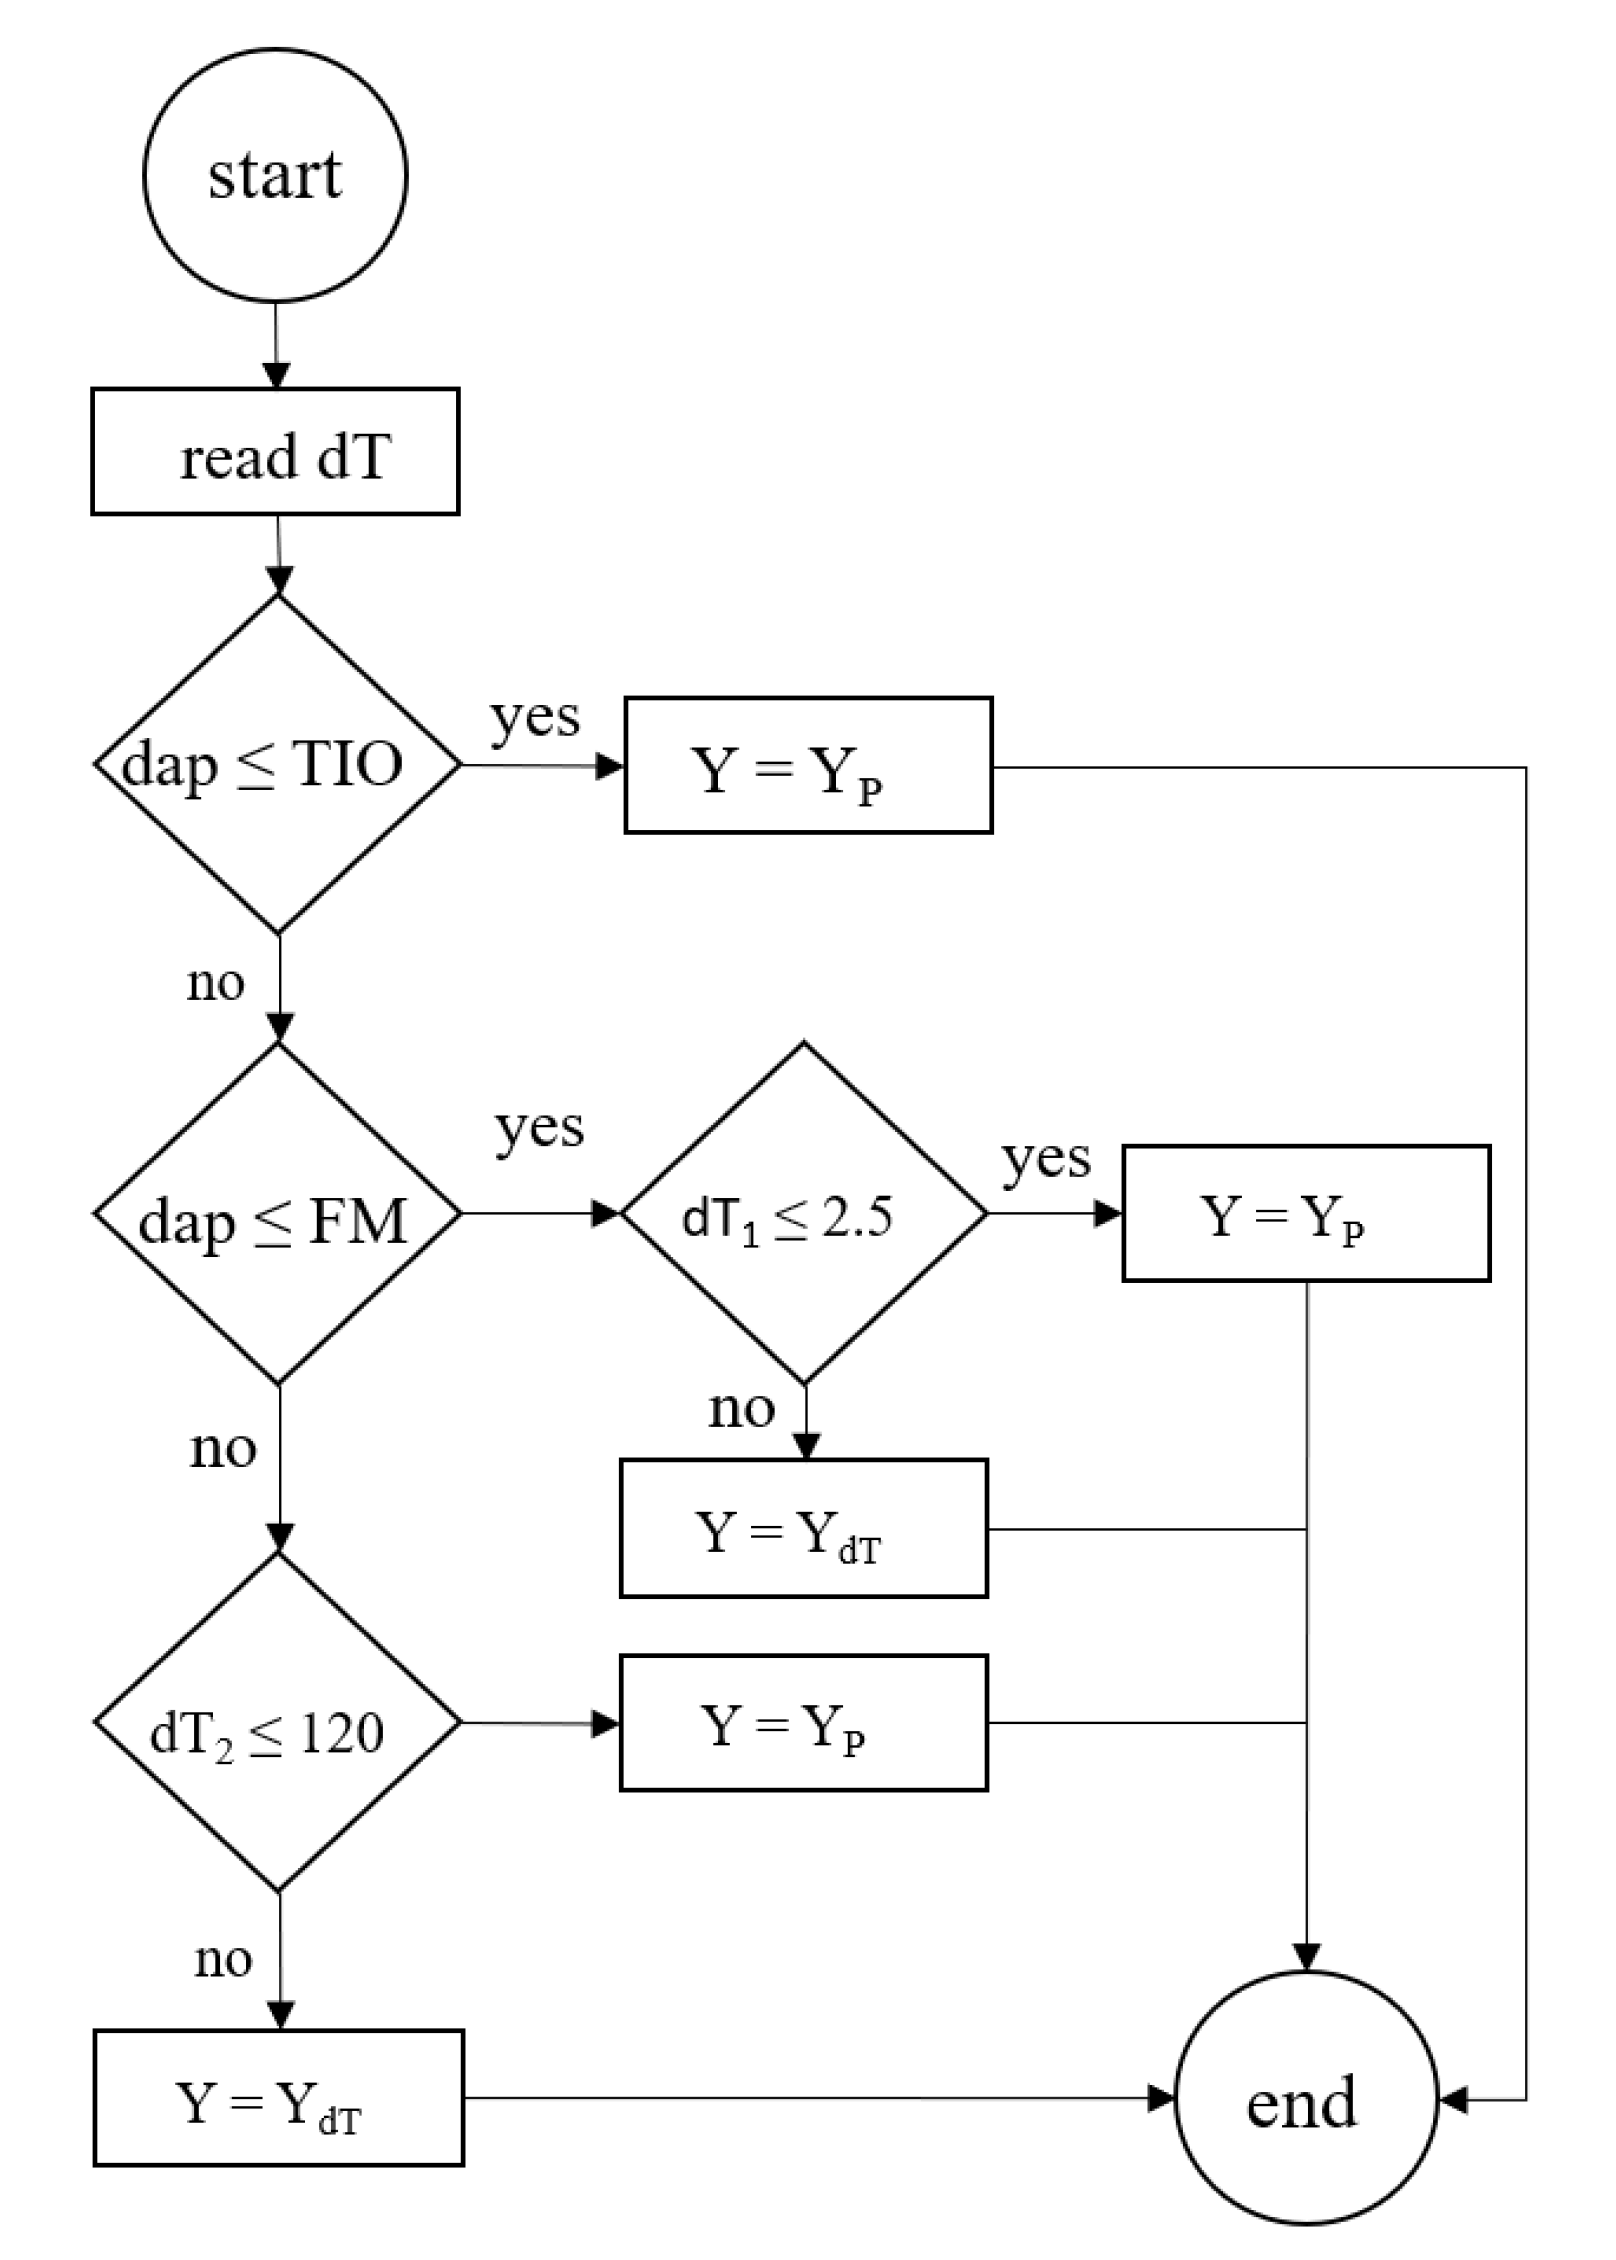
2.4.2. Yield Prediction under Water-Limited Conditions

In this study, two yield prediction perspectives under water-limited conditions were analyzed. In the first perspective (P1), the SOLANUM potato model routine of soil water balance [37] was used. Under this perspective, the no percolation and initial water reserve being maximum (i.e., soil moisture is at field capacity) conditions were assumed. Potential evapotranspiration (ET0) was calculated according to the FAO-Penman–Monteith method [38]. Potential transpiration (T0) was determined by an exponential relationship between ET0 and CC. In contrast, actual transpiration (T) was estimated as a function of the soil water available and two soil physical parameters (field capacity (FC) and permanent wilting point (PWP)) (see the equations in [39]). The model determines a water stress index based on T and T0 that penalizes RUE, HI, and CC, affecting yield. A maximum soil depth of the UNICA potato variety root biomass (0.30 m, [13]) was considered in the water balance to simulate water-limited conditions. FC was determined from two soil pits made in the field (in each trial), and PWP was estimated according to Rab et al. [40]’s equation.
For the second perspective (P2), the target critical parameters (TCPs) of the SOLANUM model were reparameterized. These TCPs were determined through a sensitivity analysis based on the “elasticity” of the parameters associated with radiation interception and use efficiency and the biomass translocation process, following Quiroz et al.’s [30] procedure. Based on this analysis, the TCPs were chosen if the yield percentage variation per unit of percentage variation of those parameters was >|0.95|. Model calibration for each water-restricted treatment of Trial B was carried out to calculate the parameters (as in Section 2.4.1). Empirical functions (Equation (1)) were developed to estimate the impact that water stress, as estimated by dT, would have on reducing/increasing the TCP potential value ( X p , obtained from the data of Trial B’s control treatment (Section 2.4.1)) according to the water stress degree based on dT. Thus, X p was transformed to a penalized parameter ( X ^ ) using the following equation:
X ^ = X p × F R ( d T 1 , d T 2 ) ,
FR is a function that depends on the average value of dT before irrigation pulse ( d T 1 ) and the accumulated dT from the treatment onset to physiological maturity ( d T 2 , ∼80 days after planting (DAP)). The FR function is defined as follows:
F R = a × d T 1 + b × d T 2 + c ,
The empirical coefficients a, b, and c were estimated by nonlinear regression analysis by fitting TCP calculated data to Equation (1), using R software (R core team). Equations (1) and (2) were applied for each TCP to obtain the X ^ values from CC-Beta and HI-Gompertz curve calculation. Thus, the CC, HI, and RUE curves (the latter calculated directly from Equation (1)) were obtained: (i) one for optimum conditions ( Y p o t , by using X p values) and (ii) the other that includes the water stress effects based on dT ( Y d T , by using X ^ values). The final daily values of the CC, HI, and RUE curves (Y) were selected between the daily value of the Y d T (if the crop is under water stress conditions) and Y p o t (if the crop is under optimum conditions) curves according to the logical process presented in Figure 1. From planting to TIO, plants grew under well-watered conditions; therefore, Y assumes Y p o t values. From TIO to physiological maturity (∼80 DAP), a d T 1 value of 2.5 °C was used as a decision threshold to determine the Y values; thus, Y assumes the Y p o t value when on a day “d”, d T is lower than 2.5 °C; otherwise, Y assumes Y d T values (Figure 1). From physiological maturity to harvest, a d T 2 value of 120 °C was used as a decision threshold to determine the Y values; thus, Y assumes Y p o t and Y d T values when d T 2 is <120 and >120 °C, respectively (Figure 1). These decision thresholds were determined from the dT data of Trial B’s control treatment, coinciding (in the case of d T 1 ) with the reported values by Ramírez et al. [10] for well-watered conditions in potato crop. Finally, the Y curves (CC, HI, and RUE) were used in the SOLANUM model’s biomass assimilation/partition equations (see the equations in [33]) to simulate the potato crop potato yield.

2.4.3. Evaluation of the Crop Models’ Performance

Simulated FTY (t ha 1 ) data were compared with observed data to evaluate the crop model’s performance. Thus, the statistical indicators of the coefficient of determination ( R 2 ), the slope of linear regression (m), the root-mean-squared error (RMSE), and the normalized RMSE (NRMSE) were used. The regression to calculate R 2 and m was for the 1:1 line and forced through the origin [41]. The RMSE (Equation (3)) and NRMSE (Equation (4)) were calculated using the following equations:
R M S E = i = 1 N ( S i O i ) 2 N ,
N R M S E = R M S E i = 1 N O i N × 100 ,
where S i is the simulated value, O i is the observed value, and N is the number of observations. R 2 measures the actual deviation between simulated and observed values, and m quantifies a possible overestimation (m > 1) or underestimation (m < 1) by the model [42]. The RMSE was computed to provide a measure of the absolute magnitude of the error.

3. Results

3.1. Sensitivity Analysis, Model Parameters’ Calibration, and Reduction Functions’ Calculation

The accumulated thermal time at maximum CC ( t e ), the fraction of the maximum CC index ( w m a x ), RUE, and the maximum HI (A) were the parameters with the highest values in the sensitivity analysis (Table 2). Those parameters were identified as TCP to be penalized based on dT. The Beta-adjusted curve for the CC-related parameters showed R 2 values of 0.86 (p < 0.05) and 0.91 (p < 0.05) corresponding to DI and FI, respectively. The Gompertz-adjusted curve for the calibration of the HI dynamic parameters showed R 2 values of 0.99 (p < 0.05) and 0.99 (p < 0.05) corresponding to DI and FI, respectively. The linear function fitted for the RUE calculus showed R 2 values of 0.98 (p < 0.05) and 0.95 (p < 0.05) corresponding to DI and FI, respectively. The model parameters differed between irrigation types, these being more favorable to the light interception (high t e and low t m value) and biomass translocation (high A and low b value) processes under FI and DI, respectively (Table 2). R 2 from the fitted functions between the TCP calculated and penalized based on dT showed the following pattern: RUE > w m a x > t e > A (Table 3).

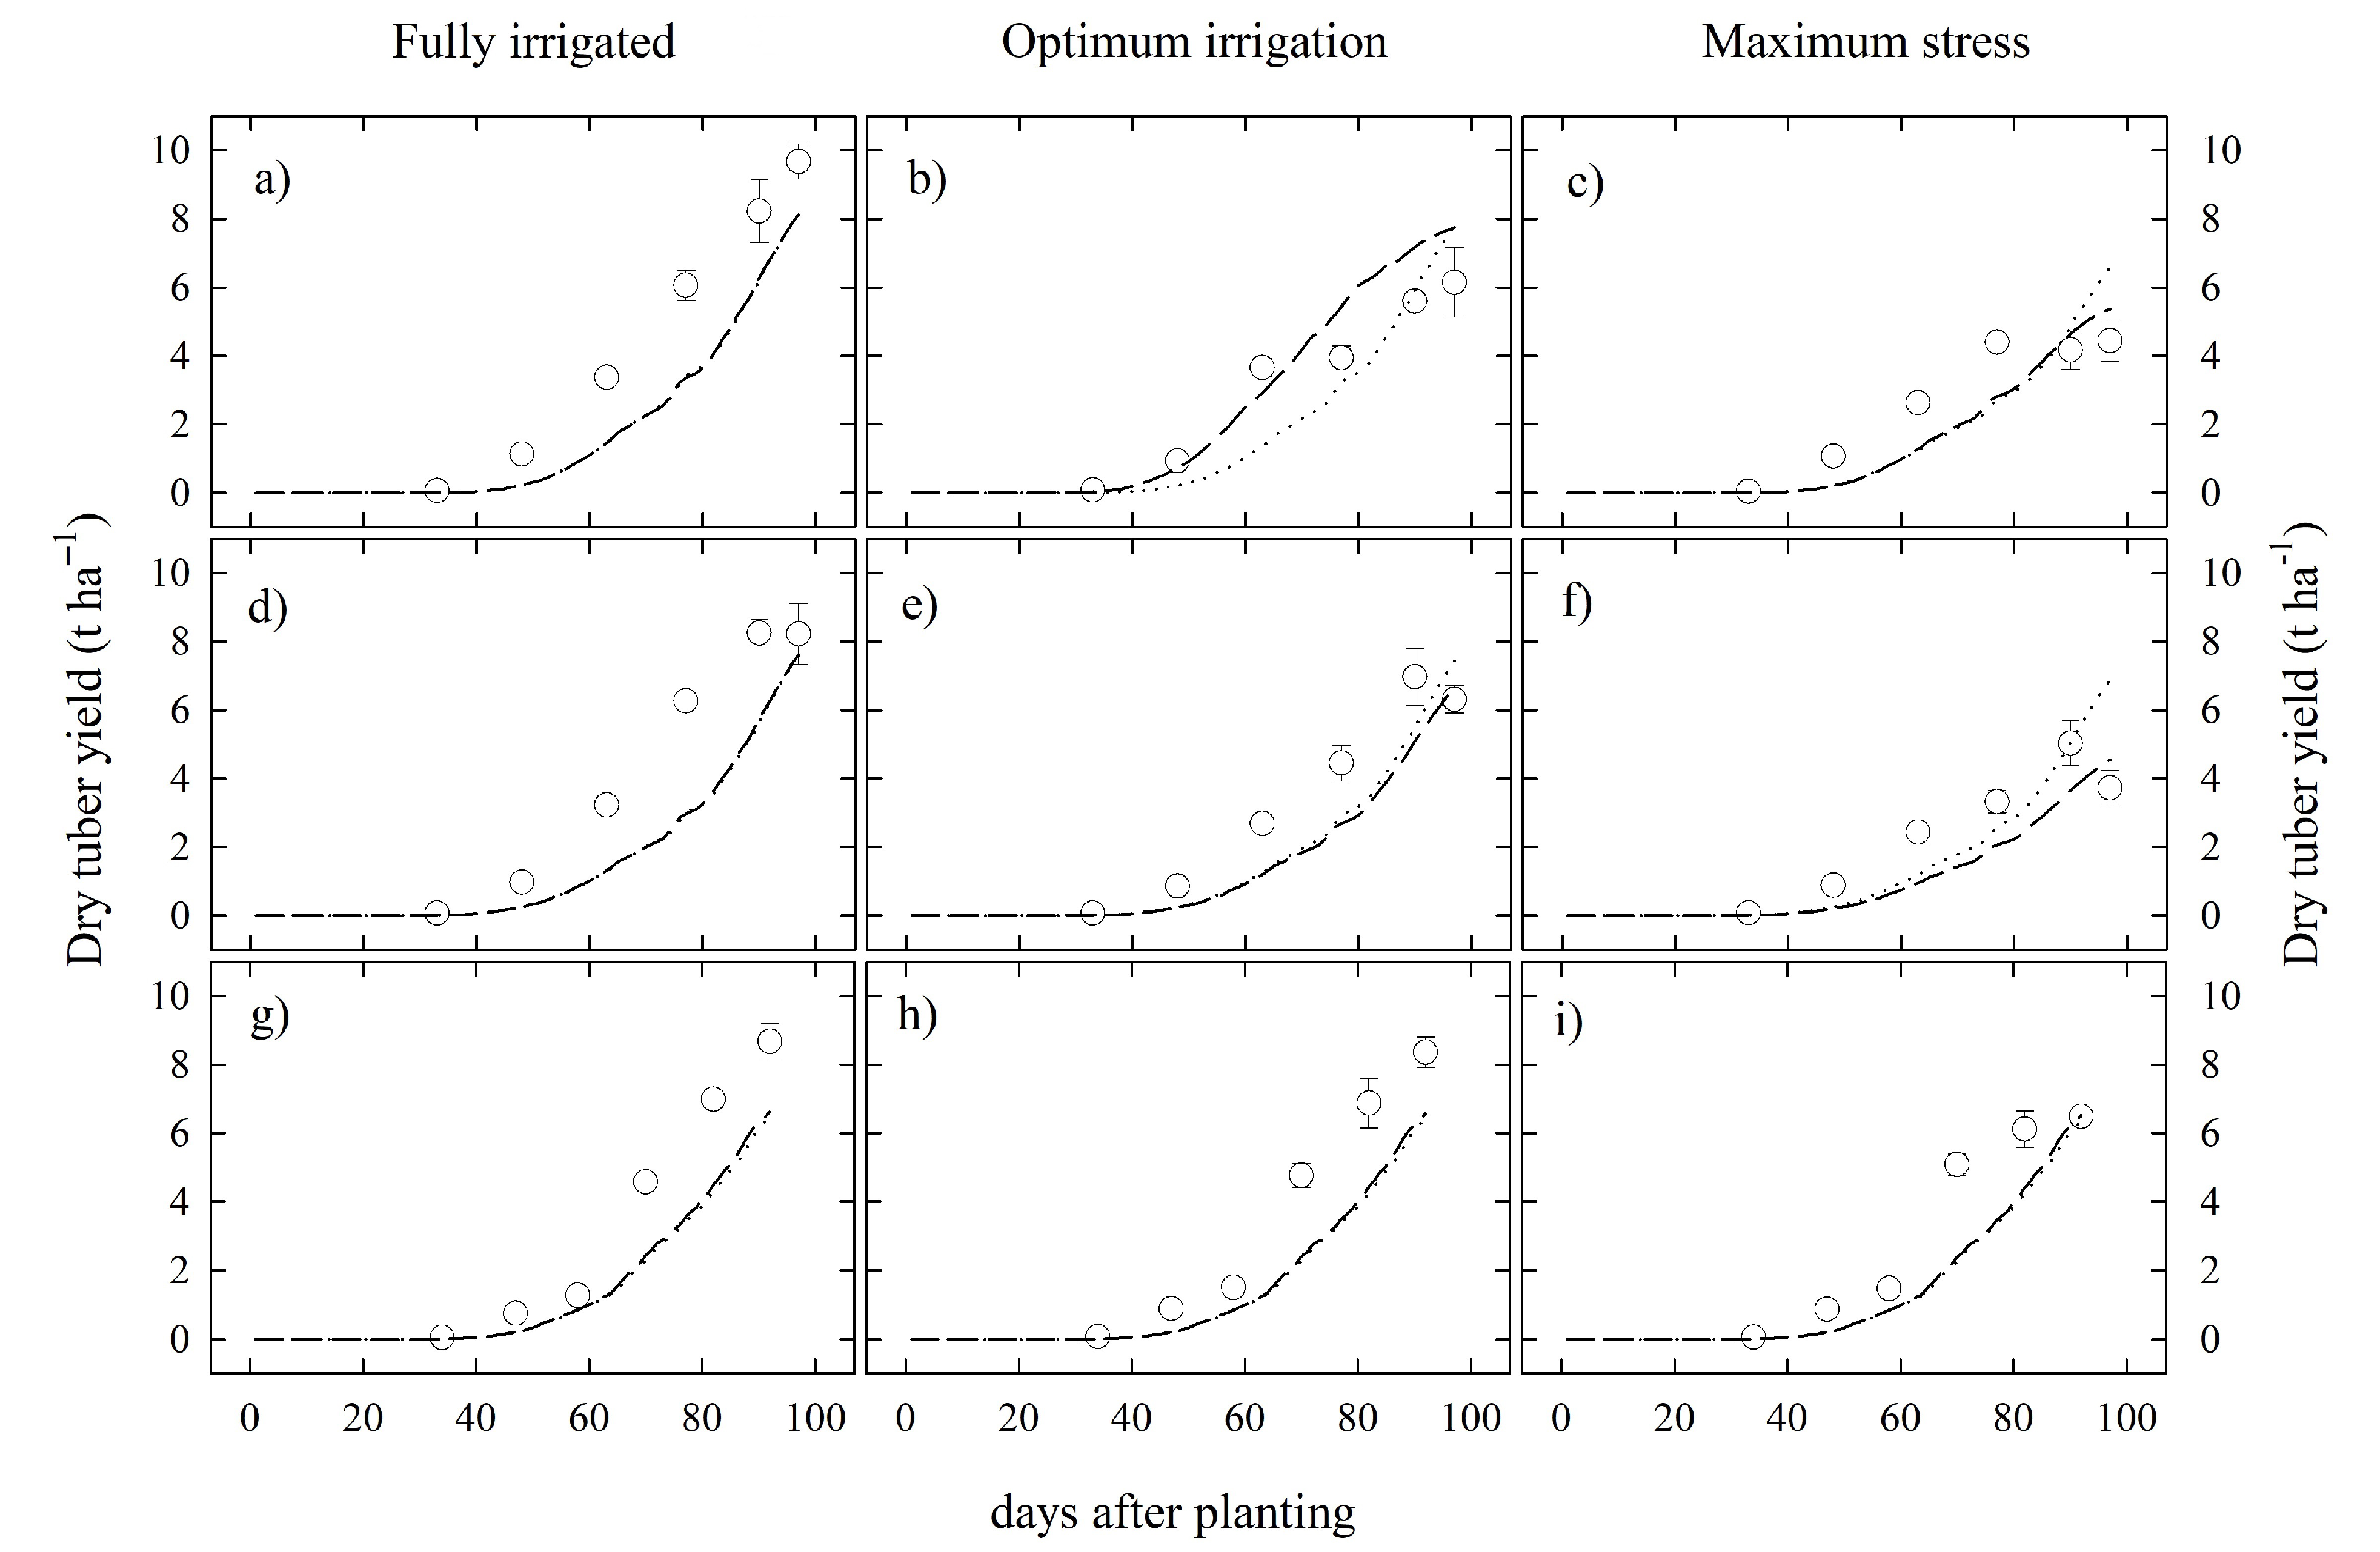
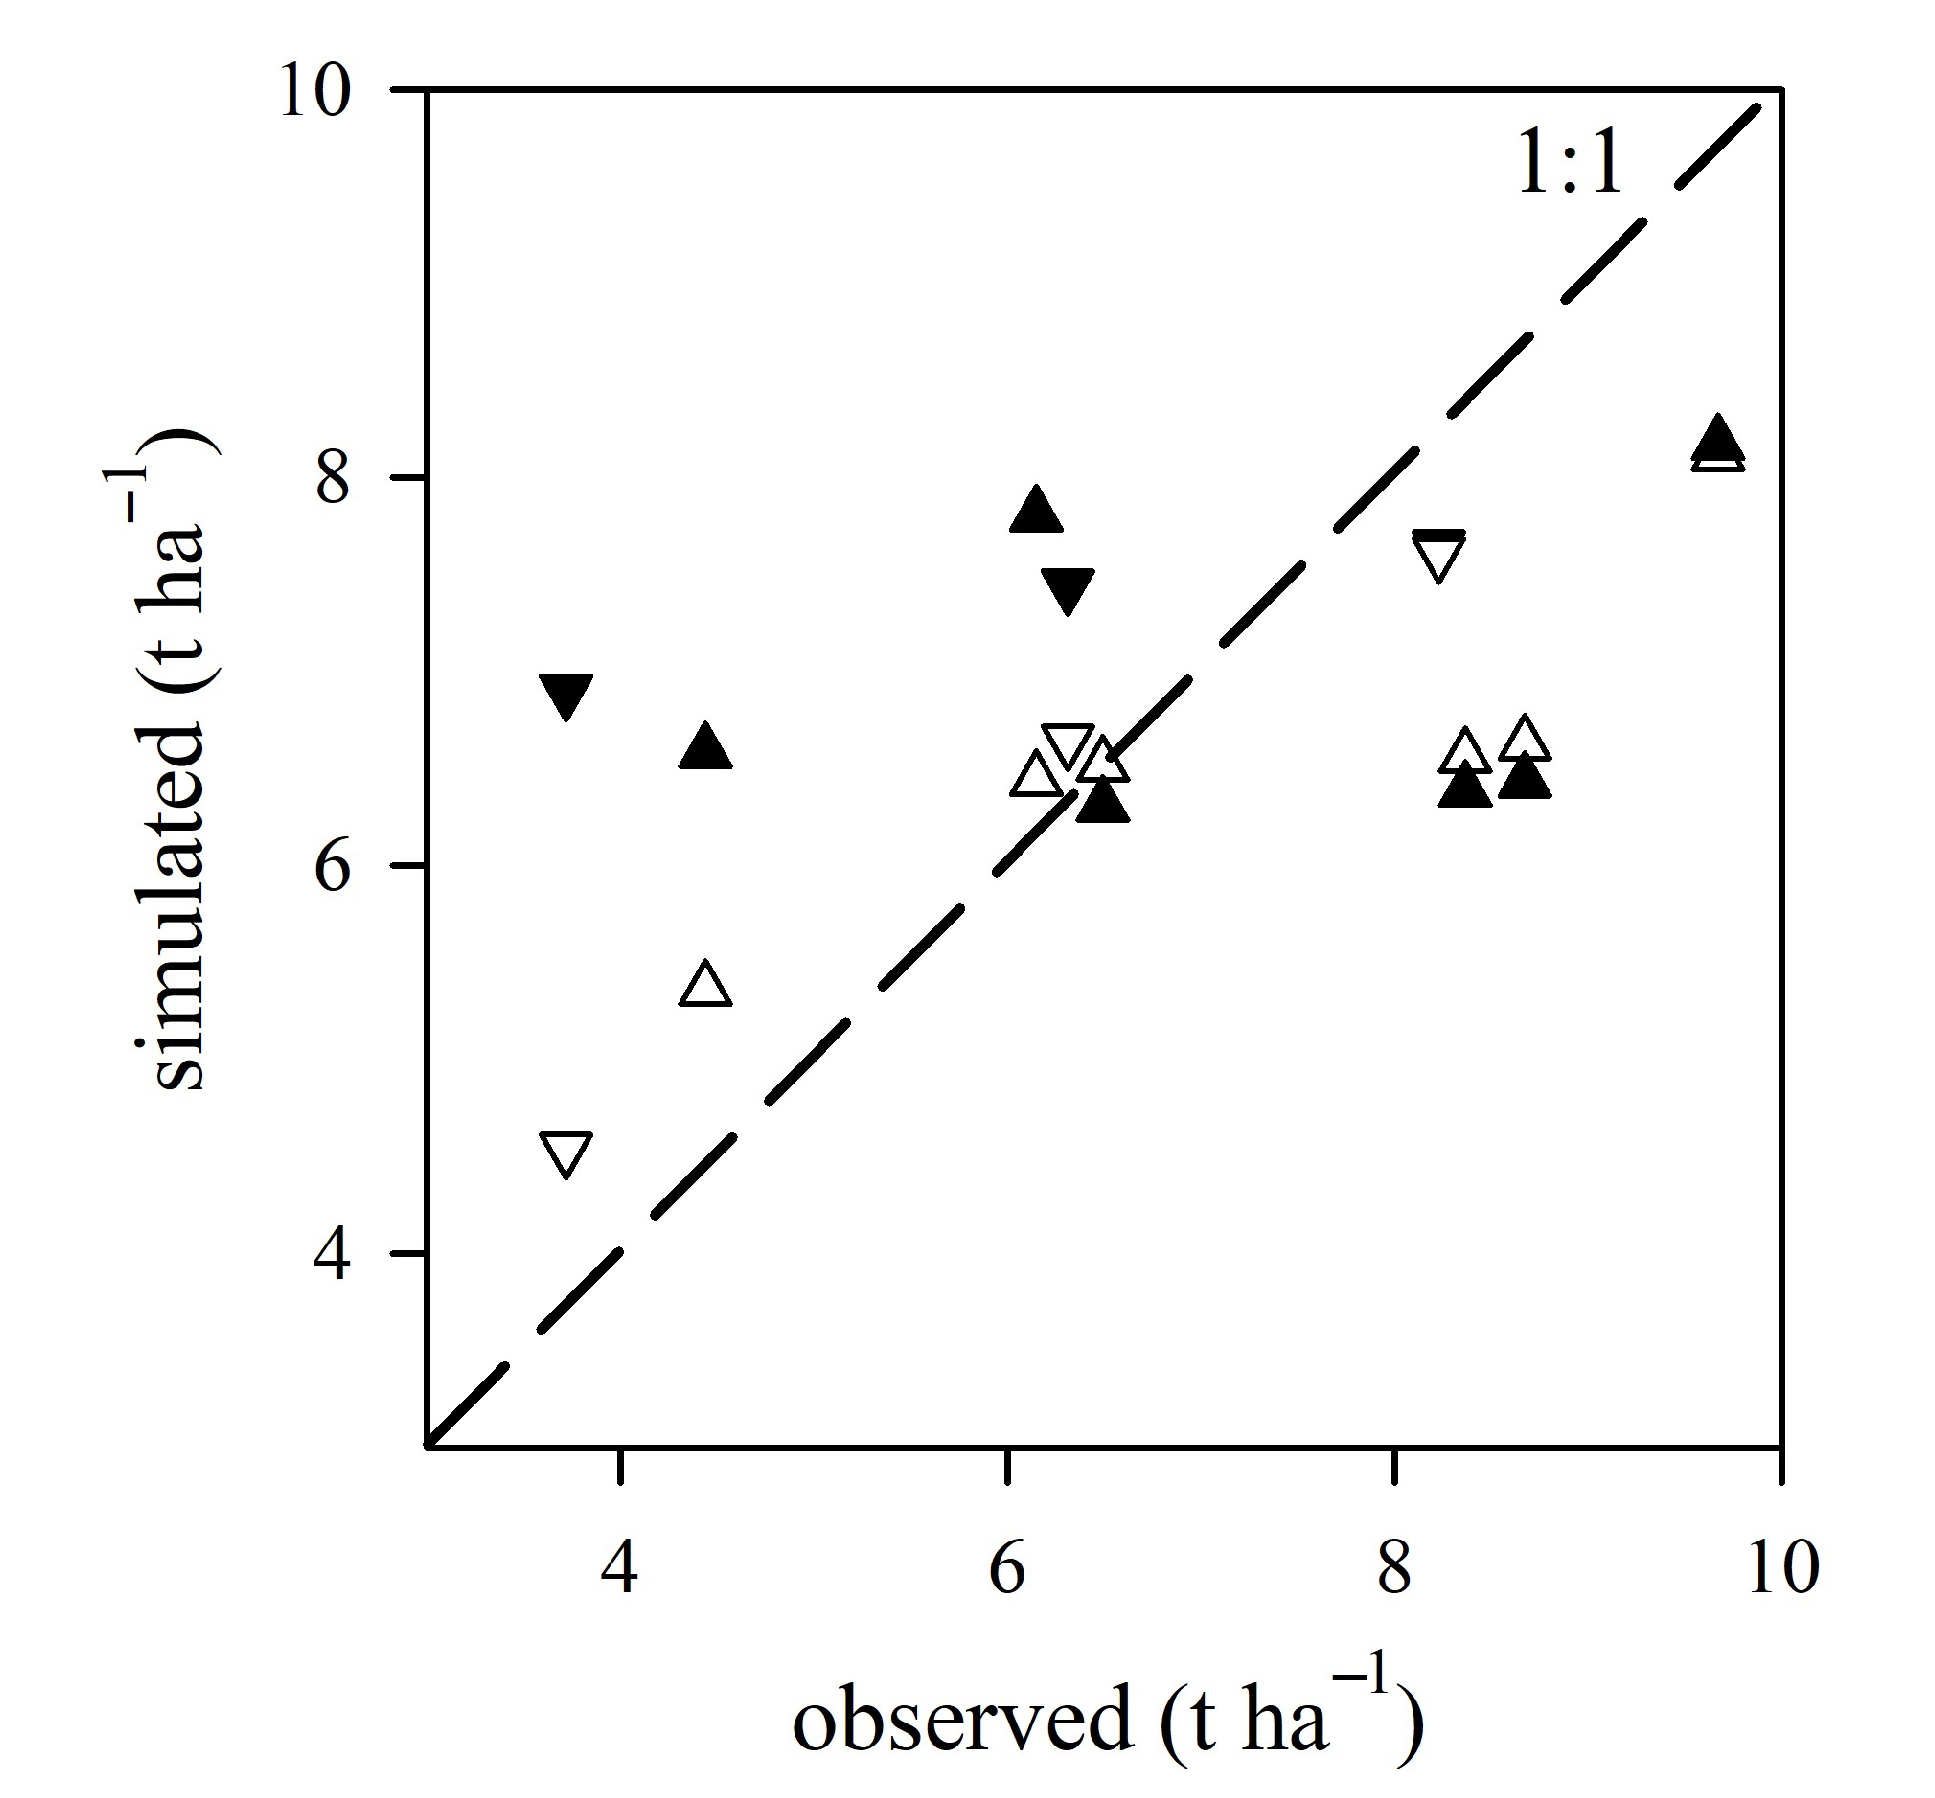
3.2. Model Performances and Validation

In general, both modeling perspectives (P1 and P2) showed different underestimation degrees of simulated DTY, depending on the growth stages and water restriction context (Figure 2). Thus, the simulated DTY underestimated the observed data with higher intensity during midstage (∼50–80 DAP), whereas during the initial stages (∼0–50 DAP), the simulated and observed DTY values showed a higher coincidence (Figure 2). There was no difference in either modeling perspectives for the DTY simulation under fully irrigated conditions during the growth stages (Figure 2a,d,g). In contrast, under maximum stress conditions and late growing stages (∼80–100 DAP), P1 showed an average overestimation of +9.3 and +16.0% for DI (only considering Trial A) and FI, respectively. On the other hand, P2 showed an underestimation of 17.4 and 21.0% for DI and FI, respectively (Figure 2c,f,i). Regarding the final DTY sampling (harvest), P2 showed higher R2 and a lower RMSE and NRMSE in comparison to P1 (Table 4). In general, the final DTY was underestimated (m = 0.97) and overestimated (m = 1.08) for P1 and P2, respectively (Table 4, Figure 3). Considering the irrigation type, DI and FI showed an overestimation (m > 1) and underestimation (m < 1), respectively regardless of the modeling perspective (Table 4). The highest R 2 and the lowest RMSE and NRMSE were obtained in P1 under DI and in P2 under FI (Table 4).

4. Discussion

4.1. Canopy Temperature Incorporation Improved Yield Prediction under Water Restriction

The incorporation of canopy temperature, which is closely related to stomatal conductance in potatoes [10], into the tested model improved the yield prediction. This finding agreed with other modeling exercises tested in this crop where water stress factors related to stomatal conductance response improved tuber yield prediction under different water restriction scenarios [16]. A high canopy temperature limits the assimilation of nutrientsand the subsequent tuber growth during the early growth stage of potatoes [44], whereas during the reproductive phase, this stressor has shown a negative and significant relationship with tuber yield [10,13,22,45]. Several studies have highlighted the usefulness of canopy temperature in water stress detection and its relationship with crop yield [13,46,47]. Thereby, canopy temperature has successfully been used in statistical models for yield estimation in crops such as wheat [45,48,49], sorghum [50], and potato [13,51]. P1 and P2 showed a fair (20% < NRMSE < 30%) and good (10% < NRMSE < 20%) performance, respectively (sensu Jamieson et al. [52]), the NRMSE values being in the reported ranges in potato simulations (2–51%, Raymundo et al. [15]). In agreement with the study’s finding (Figure 2), the prevalence of tuber yield underestimation against overestimation has also been detected to run the SUBSTOR-potato model over a wide range of contrasting growth conditions [41,53].
On the other hand, the morphophysiological features of potato plants play a critical role in their drought stress responses; thus, small canopies reduce water loss by transpiration, whereas large canopies maximize radiation interception [54]. In addition, water stress has a significant effect on tuber quality traits [37]. The effects of climate change (CO 2 increasing) on tuber size and dry matter concentration are considered in some crop models (for example, LINTUL-POTATO-DSS [55]); still, water stress response on these tuber quality traits has been overlooked. The latter and morphophysiological features constitute important variables that could be improved in future modeling studies. It is reported that yield is positively affect by radiation intensity [56]. In that sense, models based on RUE such as SOLANUM can improve yield estimation, provided they have robust calibration processes. The inclusion of canopy temperature in cereal crop models [20,21,57] has resulted in considerable improvement compared to the same models parameterized only with meteorological data and soil/plant characteristics [58]. Nonetheless, canopy temperature datasets are limited because their acquisition requires trained personnel for manual measurements and/or high expenses for the installation, maintenance, and calibration of suitable instrumentation techniques [57]. Satellite-based surface temperatures have been successfully used for actual evapotranspiration and soil moisture estimations at the regional scale [59,60]. However, the low temporal resolution of satellite imagery imposes a challenge on their use to run crop models, which usually run daily [18,61]. A Gamma of empirical, statistical, and probabilistic energy balance models has been developed to predict canopy temperature in cereal crops using weather variables obtained from weather stations and/or model predictions [19,21,62]. These efforts have allowed overcoming the difficult canopy temperature data acquisition and open the door for crop geospatial modeling to improve yield prediction under future water-restricted scenarios at higher spatial scales. On the other hand, new developments in low-cost infrared devices/sensors, open-source microcontrollers, wireless communication, and Internet of Things technologies [12,63,64,65] have been implemented for a continuous monitoring of water status based on canopy temperature with potential usefulness for irrigation scheduling, crop breeding/phenotyping, and crop modeling.

4.2. Modeling Performance under Water Restriction Depends on the Irrigation Type

The best performance of both SOLANUM’s perspectives obtained in different irrigation types suggests that modeling performance is irrigation system dependent, confirming the second work’s hypothesis. It has been reported that potato physiological response depends on the irrigation method used. Thus, whereas DI promotes early senescence onset, FI delays senescence, improving short-term water stress memory [11]. Evapotranspiration and soil water content are significantly lower under DI than under FI, contrary to soil temperature, which is higher [66]. Erdem et al. [51] reported a higher relationship between CT and potato yield under furrow irrigation ( R 2 = 0.98) in comparison to DI ( R 2 = 0.97), which agreed with the best performance of P2 under FI. For an adequate decision support system (DSS) for irrigation scheduling, it is essential to know the timing for which the crop must be irrigated (when) and the necessary water amount that must be applied (how much). For that, water balance models (mainly the FAO-56 dual-crop coefficient approach) have traditionally been adopted to determine the crop water requirements and, therefore, the “when” and “how much” [67,68]. Regardless of the irrigation methods, these models (one-dimensional) have been applied assuming a uniform spatial variability of the soil moisture [69]. Nonetheless, under DI, the soil moisture is unevenly distributed, so a two-dimensional water balance model was developed for DI scheduling with better results (compared to traditional one-dimensional models) on shallow-rooted crops [70]. The study’s findings invite exploring future efforts to incorporate CT into a DSS through proximal–remote sensing tools that are being used for irrigation scheduling based on plant water stress monitoring [24,25,71]. The proposed thresholds to establish timing irrigation through CWSI in potatoes [10,13] can serve as a starting point for using spaceborne remotely-sensed information to design future DSSs. In this regards, maps of LANDSAT satellite image-based CWSI have been used for irrigation scheduling in sugarcane fields, but the low temporal image resolution (∼16 days) limits their operational use on crops where the irrigation frequency is short (∼2–3 days) [72]. This deficiency could be solved by combining satellite imagery with water balance models, weather forecast information, wireless sensor networks, radio telemetry technologies (Internet of Things), and big data analytics. Thus, for example, some web-based DSSs such as AQUAMAN [73], IrrigWeb [74], and/or IrrigaSys [75] have been developed and successfully implemented for irrigation scheduling/management. Although DSS implementation allows saving water, this could be used in a complementary way, joining other water-saving strategies such as water harvesting, which is being used in arid and semi-arid environments [76,77].

5. Conclusions

The incorporation of canopy temperature improved a radiation use efficiency simulation model to predict tuber yield under water restriction conditions. This trait integrates the whole plant response under different soil moisture contexts, serving as a crucial atmosphere–plant–soil indicator to consider in future simulation efforts. The model performance depends on the growth stage and water restriction contexts, showing a higher underestimation prevalence in the midgrowth in contrast to the late growth stage. Because the model performance was different under drip or furrow irrigation, it is recommended to adapt the model components (canopy temperature thresholds, calibration factors, among others) according to the irrigation system. Combining the methodology of this preliminary study with low-cost infrared devices/sensors and radio telemetry technologies, a real-time DDS could be implemented for water requirement determination and yield prediction with potential usefulness in precision agriculture.

Supplementary Materials

The following are available online at https://0-www-mdpi-com.brum.beds.ac.uk/article/10.3390/agronomy11071436/s1, Figure S1. (A) Thermal and RGB images acquisition using the camera FLIR model E60, according to Rinza et al’ [1] procedure. (B) RGB images (2048 × 1536 pixels). (C) Thermal images (320 × 240 pixels). (D) Thermal image filtered (mask) to avoid detection of non-plant surfaces. (E) RGB and thermal images aligned to determine canopy temperature in a specific region of the plot. Thermal and RGB images processing was performed using the TIPCIP software [2].

Author Contributions

Conceptualization, D.A.R. and R.Q.; methodology, J.N. and D.A.R.; software, J.N.; validation, J.N. and J.R.; formal analysis, J.N. and D.A.R.; investigation, J.N., D.A.R., and J.R.; resources, D.A.R. and J.R.; data curation, J.N., J.R., and C.S.-D.; writing—original draft preparation, J.N. and D.A.R.; writing—review and editing, R.Q., J.R., J.G., C.S.-D., and M.C.; visualization, J.N.; supervision, D.A.R., J.R., and J.G.; project administration, D.A.R. and J.R.; funding acquisition, D.A.R. All authors read and agreed to the published version of the manuscript.

Funding

This research received financial support from “Programa Nacional de Innovación Agraria” (PNIA), with Project No. 016-2015-INIA-PNIA/UPMSI/IE “Uso efectivo del agua en el cultivo de papa en zonas áridas: Mejorando el manejo del riego mediante el monitoreo del estatus hídrico para enfrentar al Cambio Climático”. This research was undertaken as a part of, and funded by, the CGIAR Research Program on Roots, Tubers and Bananas (RTB) and supported by CGIAR Fund Donors. We thank all donors who supported this research through their contributions to the CGIAR Fund: http://www.cgiar.org/about-us/our-funders/ accessed on 1 June 2021.

Institutional Review Board Statement

Not applicable.

Informed Consent Statement

Not applicable.

Data Availability Statement

The data presented in this study are available on CIP’s dataverse for trials A, B, and C in 10.21223/P3/Q4KNAN, 10.21223/P3/VLLFPK, and 10.21223/P3/2VCYRQ, (accessed on 12 June 2021) respectively.

Acknowledgments

The authors thank Nikolai Alarcón and Jesús Zamalloa for their technical support.

Conflicts of Interest

The authors declare no conflict of interest.

References

  1. Dinar, A.; Tieu, A.; Huynh, H. Water scarcity impacts on global food production. Glob. Food Sec. 2019, 23, 212–226. [Google Scholar] [CrossRef] [Green Version]
  2. Mancosu, N.; Snyder, R.L.; Kyriakakis, G.; Spano, D. Water Scarcity and Future Challenges for Food Production. Water 2015, 7, 975–992. [Google Scholar] [CrossRef]
  3. Renault, D.; Wallender, W.W. Nutritional water productivity and diets. Agric. Water Manag. 2000, 45, 275–296. [Google Scholar] [CrossRef]
  4. DeFauw, S.L.; He, Z.; Larkin, R.P.; Mansour, S.A. Sustainable potato production and global food security. In Sustainable Potato Production: Global Case Studies; He, Z., Larkin, R., Honeycutt, W., Eds.; Springer: Dordrecht, The Netherlands, 2012; pp. 3–19. [Google Scholar] [CrossRef]
  5. Devaux, A.; Kromann, P.; Ortiz, O. NPotatoes for sustainable global food security. Potato Res. 2014, 57, 185–199. [Google Scholar] [CrossRef]
  6. Sood, M.C.; Singh, N. Water management. In The Potato: Production and Utilization in Sub-Tropics; Khurana, S.M.P., Minhas, J.S., Pandey, S.K., Eds.; Mehta Publishers: New Dehli, India, 2003; pp. 111–112. [Google Scholar]
  7. Monneveux, P.; Ramírez, D.A.; Pino, M.T. Drought tolerance in potato (S. tuberosum L.): Can we learn from drought tolerance research in cereals? Plant Sci. 2013, 205–206, 76–86. [Google Scholar] [CrossRef] [PubMed]
  8. Obidiegwu, J.E.; Bryan, G.J.; Jones, H.G.; Prashar, A. Coping with drought: Stress and adaptive responses in potato and perspectives for improvement. Front. Plant Sci. 2015, 6, 542. [Google Scholar] [CrossRef] [Green Version]
  9. Zhou, J.B.; Wang, C.Y.; Zhang, H.; Dong, F.; Zheng, X.F.; Gale, W.; Li, S.X. Effect of water saving management practices and nitrogen fertilizer rate on crop yield and water use efficiency in a winter wheat–summer maize cropping system. Field Crops Res. 2011, 122, 157–163. [Google Scholar] [CrossRef]
  10. Ramírez, D.A.; Yactayo, W.; Rens, L.R.; Rolando, J.L.; Palacios, S.; De Mendiburu, F.; Mares, V.; Barreda, C.; Loayza, H.; Monneveux, P.; et al. Defining biological thresholds associated to plant water status for monitoring water restriction effects: Stomatal conductance and photosynthesis recovery as key indicators in potato. Agric. Water Manag. 2016, 177, 369–378. [Google Scholar] [CrossRef]
  11. Silva-Díaz, C.; Ramírez, D.A.; Rodríguez-Delfín, A.; De Mendiburu, F.; Rinza, J.; Ninanya, J.; Loayza, H.; Quiroz, R. Unraveling Ecophysiological Mechanisms in Potatoes under Different Irrigation Methods: A Preliminary Field Evaluation. Agronomy 2020, 10, 827. [Google Scholar] [CrossRef]
  12. Jones, H.G.; Hutchinson, P.A.; May, T.; Jamali, H.; Deery, D.M. A practical method using a network of fixed infrared sensors for estimating crop canopy conductance and evaporation rate. Biosyst. Eng. 2018, 165, 59–69. [Google Scholar] [CrossRef] [Green Version]
  13. Rinza, J.; Ramírez, D.A.; García, J.; De Mendiburu, F.; Yactayo, W.; Barreda, C.; Velasquez, T.; Mejía, A.; Quiroz, R. Infrared radiometry as a tool for early water deficit detection: Insights into its use for establishing irrigation calendars for potatoes under humid conditions. Potato Res. 2019, 62, 109–122. [Google Scholar] [CrossRef] [Green Version]
  14. Jones, H.G. Application of thermal imaging and infrared sensing in plant physiology and ecophysiology. Adv. Bot. Res. 2004, 41, 107–163. [Google Scholar] [CrossRef]
  15. Raymundo, R.; Asseng, S.; Cammarano, D.; Quiroz, R. Potato, sweet potato, and yam models for climate change: A review. Field Crops Res. 2014, 166, 173–185. [Google Scholar] [CrossRef]
  16. Fleisher, D.H.; Dathe, A.; Timlin, D.J.; Reddy, V.R. Improving potato drought simulations: Assessing water stress factors using a coupled model. Agric. For. Meteorol. 2015, 200, 144–155. [Google Scholar] [CrossRef]
  17. Gu, Z.; Qi, Z.; Burghate, R.; Yuan, S.; Jiao, X.; Xu, J. Irrigation scheduling approaches and applications: A review. J. Irrig. Drain. Eng. 2020, 146, 04020007. [Google Scholar] [CrossRef]
  18. Jin, X.; Kumar, L.; Li, Z.; Feng, H.; Xu, X.; Yang, G.; Wang, J. A review of data assimilation of remote sensing and crop models. Eur. J. Agron. 2018, 92, 141–152. [Google Scholar] [CrossRef]
  19. Webber, H.; Ewert, F.; Kimball, B.A.; Siebert, S.; White, J.W.; Wall, G.W.; Ottman, M.J.; Trawally, D.; Gaiser, T. Simulating canopy temperature for modelling heat stress in cereals. Environ. Model. Softw. 2016, 77, 143. [Google Scholar] [CrossRef] [Green Version]
  20. Webber, H.; Martre, P.; Asseng, S.; Kimball, B.; White, J.; Ottman, M.; Wall, G.; De Sanctis, G.; Doltra, J.; Grant, R.; et al. Canopy temperature for simulation of heat stress in irrigated wheat in a semi-arid environment: A multi-model comparison. Field Crops Res. 2017, 202, 21–35. [Google Scholar] [CrossRef]
  21. Webber, H.; White, J.W.; Kimball, B.A.; Ewert, F.; Asseng, S.; Rezaei, E.E.; Pinter, P.J., Jr.; Hatfield, J.L.; Reynolds, M.P.; Ababaei, B.; et al. Physical robustness of canopy temperature models for crop heat stress simulation across environments and production conditions. Field Crops Res. 2018, 216, 75–88. [Google Scholar] [CrossRef] [Green Version]
  22. Cucho-Padin, G.; Rinza, J.; Ninanya, J.; Loayza, H.; Quiroz, R.; Ramírez, D.A. Development of an open-source thermal image processing software for improving irrigation management in potato crops (Solanum tuberosum L.). Sensors 2020, 20, 472. [Google Scholar] [CrossRef] [PubMed] [Green Version]
  23. O’Shaughnessy, S.A.; Evett, S.R.; Colaizzi, P.D.; Howell, T.A. A crop water stress index and time threshold for automatic irrigation scheduling of grain sorghum. Agric. Water Manag. 2012, 107, 122–132. [Google Scholar] [CrossRef] [Green Version]
  24. Ihuoma, S.O.; Madramootoo, C.A. Recent advances in crop water stress detection. Comput. Electron. Agric. 2017, 141, 267–275. [Google Scholar] [CrossRef]
  25. Chen, X.; Qi, Z.; Gui, D.; Gu, Z.; Ma, L.; Zeng, F.; Li, L.; Sima, M.W. A model-based real-time decision support system for irrigation scheduling to improve water productivity. Agronomy 2019, 9, 686. [Google Scholar] [CrossRef] [Green Version]
  26. Servicio Nacional de Meteorología e Hidrología (SENAMHI). Reporte Ejecutivo–Climas del Perú: Mapas de Clasificación Nacional Peru. 2020; p. 5. Available online: https://idesep.senamhi.gob.pe/geonetwork/srv/api/records/9f18b911-64af-4e6b-bbef-272bb20195e4/attachments/Resumen%20ejecutivo%20Climas%20del%20Peru%CC%81.pdf (accessed on 15 March 2021).
  27. Gutiérrez-Rosales, R.O.; Espinoza-Trelles, J.A.; Bonierbale, M. UNICA: Variedad Peruana para mercado fresco y papa frita con tolerancia y resistencia para condiciones climáticas adversas. Rev. Latinoam. Papa 2017, 14, 41–50. [Google Scholar] [CrossRef]
  28. Rol, J.L.; Ramírez, D.A.; Yactayo, W.; Monneveux, P.; Quiroz, R. Leaf greenness as a drought tolerance related trait in potato (Solanum Tuberosum L.). Environ. Exp. Bot. 2015, 110, 27–35. [Google Scholar] [CrossRef]
  29. Quiroz, R.; Chujoy, E.; Mares, V. Papa o potato. In Respuesta del Rendimiento de los Cultivos al Agua; Steduto, P., Hsiao, T.C., Fereres, E., Raes, D., Eds.; Estudio FAO: Roma, Italy, 2012; pp. 190–195. Available online: https://agris.fao.org/agris-search/search.do?recordID=XF2015001461 (accessed on 15 April 2021).
  30. Quiroz, R.; Loayza, H.; Barreda, C.; Gavilán, C.; Posadas, A.; Ramírez, D.A. Linking process-based potato models with light reflectance data: Does model complexity enhance yield prediction accuracy? Eur. J. Agron. 2017, 82, 104–112. [Google Scholar] [CrossRef]
  31. Production Systems and the Environment (PSE); International Potato Center (CIP). Protocol for Designing and Conducting Potato Field Experiments for Modeling Purposes; International Potato Center: Lima, Peru, 2013; p. 16. [Google Scholar] [CrossRef]
  32. Condori, B.; Hijmans, R.J.; Quiroz, R.; Ledent, J.F. Quantifying the expression of potato genetic diversity in the high Andes through growth analysis and modeling. Field Crops Res. 2010, 119, 135–144. [Google Scholar] [CrossRef]
  33. Harahagazwe, D.; Condori, B.; Barreda, C.; Bararyenya, A.; Byarugaba, A.A.; Kude, D.A.; Lung’aho, C.; Martinho, C.; Mbiri, D.; Nasona, B.; et al. How big is the potato ( Solanum tuberosum L.) yield gap in Sub-Saharan Africa and why? A participatory approach. Open Agric. 2018, 3, 180–189. [Google Scholar] [CrossRef]
  34. Yin, X.; Goudriaan, J.A.N.; Lantinga, E.A.; Vos, J.A.N.; Spiertz, H.J. A flexible sigmoid function of determinate growth. Ann. Bot. 2003, 91, 361–371. [Google Scholar] [CrossRef]
  35. R Core Team. R Software, Version, 5.3.3.; Available online: https://www.r-project.org/ (accessed on 20 November 2020).
  36. Kooman, P.L.; Fahem, M.; Tegera, P.; Haverkort, A.J. Effects of climate on different potato genotypes 1. Radiation interception, total and tuber dry matter production. Eur. J. Agron. 1996, 5, 193–205. [Google Scholar] [CrossRef]
  37. Carli, C.; Yuldashev, F.; Khalikov, D.; Condori, B.; Mares, V.; Monneveux, P. Effect of different irrigation regimes on yield, water use efficiency and quality of potato (Solanum Tuberosum L.) Lowl. Tashkent, Uzb. A Field Model. Perspective. Field Crops Res. 2014, 163, 90–99. [Google Scholar] [CrossRef]
  38. Allen, R.G.; Pereira, L.S.; Raes, D.; Smith, M. Evapotranspiración del Cultivo: Guías para la Determinación de los Requerimientos de Agua de los Cultivos; Estudio FAO: Roma, Italy, 2006; p. 298. Available online: http://www.fao.org/3/x0490s/x0490s00.htm (accessed on 15 April 2021).
  39. Spitters, C.J.T.; Schapendonk, A.H.C.M. Evaluation of breeding strategies for drought tolerance in potato by means of crop growth simulation. In Genetic Aspects of Plant Mineral Nutrition. Developments in Plant and Soil Sciences; El Bassam, N., Dambroth, M., Loughman, B.C., Eds.; Springer: Dordrecht, The Netherlands, 1990; pp. 151–161. [Google Scholar] [CrossRef]
  40. Rab, M.A.; Chandra, S.; Fisher, P.D.; Robinson, N.J.; Kitching, M.; Aumann, C.D.; Imhof, M. Modelling and prediction of soil water contents at field capacity and permanent wilting point of dryland cropping soils. Soil Res. 2011, 49, 90–99. [Google Scholar] [CrossRef]
  41. Raymundo, R.; Asseng, S.; Prassad, R.; Kleinwechter, U.; Concha, J.; Condori, B.; Bowen, W.; Wolf, J.; Olesen, J.E.; Dong, Q.; et al. Performance of the SUBSTOR-potato model across contrasting growing conditions. Field Crops Res. 2017, 202, 57–76. [Google Scholar] [CrossRef] [Green Version]
  42. Yang, J.M.; Yang, J.Y.; Liu, S.; Hoogenboom, G. An evaluation of the statistical methods for testing the performance of crop models with observed data. Agric. Syst. 2014, 127, 81–89. [Google Scholar] [CrossRef]
  43. McMaster, G.S.; Wilhelm, W.W. Growing degree-days: One equation, two interpretations. Agric. For. Meteorol. 1997, 87, 291–300. [Google Scholar] [CrossRef] [Green Version]
  44. Lee, Y.H.; Sang, W.G.; Baek, J.K.; Kim, J.H.; Shin, P.; Seo, M.C.; Cho, J.I. The effect of concurrent elevation in CO2 and temperature on the growth, photosynthesis, and yield of potato crops. PLoS ONE 2020, 15, e0241081. [Google Scholar] [CrossRef] [PubMed]
  45. Kingra, P.K.; Mahey, R.K.; Gill, K.K.; Mukherjee, J.; Bal, S.K. Prediction of grain yield of wheat using canopy temperature based indices. J. Agromet. 2010, 12, 61–63. Available online: https://www.researchgate.net/profile/Pavneet-Kingra/publication/288973076_Prediction_of_grain_yield_of_wheat_using_canopy_temperature_based_indices/links/5a1fe5c5aca272cbfbc33f39/Prediction-of-grain-yield-of-wheat-using-canopy-temperature-based-indices.pdf (accessed on 15 April 2015).
  46. Conaty, W.C.; Mahan, J.R.; Neilsen, J.E.; Tan, D.K.; Yeates, S.J.; Sutton, B.G. The relationship between cotton canopy temperature and yield, fibre quality and water-use efficiency. Field Crops Res. 2015, 183, 329–341. [Google Scholar] [CrossRef]
  47. Hou, M.; Tian, F.; Zhang, T.; Huang, M. Evaluation of canopy temperature depression, transpiration, and canopy greenness in relation to yield of soybean at reproductive stage based on remote sensing imagery. Agric. Water Manag. 2019, 222, 182–192. [Google Scholar] [CrossRef]
  48. Balota, M.; Payne, W.A.; Evett, S.R.; Lazar, M.D. Canopy temperature depression sampling to assess grain yield and genotypic differentiation in winter wheat. Crop Sci. 2007, 47, 1518–1529. [Google Scholar] [CrossRef]
  49. Thapa, S.; Jessup, K.E.; Pradhan, G.P.; Rudd, J.C.; Liu, S.; Mahan, J.R.; Devkota, R.N.; Baker, J.A.; Xue, Q. Canopy temperature depression at grain filling correlates to winter wheat yield in the US Southern High Plains. Field Crops Res. 2018, 217, 11–19. [Google Scholar] [CrossRef]
  50. Ajayi, A.E.; Olufayo, A.A. Evaluation of two temperature stress indices to estimate grain sorghum yield and evapotranspiration. Agron. J. 2004, 96, 1282–1287. [Google Scholar] [CrossRef]
  51. Erdem, T.; Orta, A.H.; Erdem, Y.; Okursoy, H. Crop water stress index for potato under furrow and drip irrigation systems. Potato Res. 2005, 48, 49–58. [Google Scholar] [CrossRef]
  52. Jamieson, P.D.; Porter, J.R.; Wilson, D.R. A test of the computer simulation model ARCWHEAT1 on wheat crops grown in New Zealand. Field Crops Res. 1991, 27, 337–350. [Google Scholar] [CrossRef]
  53. Šťastná, M.; Toman, F.; Dufkova, J. Usage of SUBSTOR model in potato yield prediction. Agric. Water Manag. 2010, 97, 286–290. [Google Scholar] [CrossRef]
  54. Hill, D.; Nelson, D.; Hammond, J.; Bell, L. Morphophysiology of Potato (Solanum Tuberosum) Response Drought Stress. Paving Way Forward. Front. Plant Sci. 2020, 11. [Google Scholar] [CrossRef]
  55. Haverkort, A.J.; Franke, A.C.; Steyn, J.M.; Pronk, A.A.; Caldiz, D.O.; Kooman, P.L. A Robust Potato Model: LINTUL-Potato-DSS. Potato Res. 2015, 58, 313–327. [Google Scholar] [CrossRef] [Green Version]
  56. Minda, T.T.; Van Der Molen, M.K.; de Arellano Vilà-Guerau, J.; Chulda, K.C.; Struik, P.C. Responses of Canopy Growth and Yield of Potato Cultivars to Weather Dynamics in a Complex Topography: Belg Farming Seasons in the Gamo Highlands, Ethiopia. Agronomy 2019, 9, 163. [Google Scholar] [CrossRef] [Green Version]
  57. Neukam, D.; Ahrends, H.; Luig, A.; Manderscheid, R.; Kage, H. Integrating wheat canopy temperatures in crop system models. Agronomy 2016, 6, 7. [Google Scholar] [CrossRef] [Green Version]
  58. Wallach, D.; Makowski, D.; Jones, J.W.; Brun, F. Working with Dynamic Crop Models: Evaluation, Analysis, Parameterization, and Applications, 1st ed.; Elsevier: Amsterdam, The Netherlands, 2006; p. 462. [Google Scholar]
  59. Zhang, K.; Kimball, J.S.; Running, S.W. A review of remote sensing based actual evapotranspiration estimation. Wiley Interdiscip. Rev. Water 2016, 3, 834–853. [Google Scholar] [CrossRef]
  60. Purdy, A.J.; Fisher, J.B.; Goulden, M.L.; Colliander, A.; Halverson, G.; Tu, K.; Famiglietti, J.S. SMAP soil moisture improves global evapotranspiration. Remote Sens. Environ. 2018, 219, 1–14. [Google Scholar] [CrossRef]
  61. Kasampalis, D.A.; Alexandridis, T.K.; Deva, C.; Challinor, A.; Moshou, D.; Zalidis, G. Contribution of remote sensing on crop models: A review. J. Imaging 2018, 4, 52. [Google Scholar] [CrossRef] [Green Version]
  62. Shao, Q.; Bange, M.; Mahan, J.; Jin, H.; Jamali, H.; Zheng, B.; Chapman, S.C. A new probabilistic forecasting model for canopy temperature with consideration of periodicity and parameter variation. Agric. For. Meteorol. 2019, 265, 143. [Google Scholar] [CrossRef]
  63. Mahan, J.R.; Conaty, W.; Neilsen, J.; Payton, P.; Cox, S.B. Field performance in agricultural settings of a wireless temperature monitoring system based on a low-cost infrared sensor. Comput. Electron. Agric. 2010, 71, 176–181. [Google Scholar] [CrossRef]
  64. Payero, J.O.; Mirzakhani-Nafchi, A.; Khalilian, A.; Qiao, X.; Davis, R. Development of a low-cost Internet-of-Things (IoT) system for monitoring soil water potential using Watermark 200SS sensors. Adv. Internet Things 2017, 7, 71–86. [Google Scholar] [CrossRef] [Green Version]
  65. Noguera, M.; Millán, B.; Pérez-Paredes, J.J.; Ponce, J.M.; Aquino, A.; Andújar, J.M. A new low-cost device based on thermal infrared sensors for olive tree canopy temperature measurement and water status monitoring. Remote Sens. 2020, 12, 723. [Google Scholar] [CrossRef] [Green Version]
  66. Li, B.; Shi, B.; Yao, Z.; Shukla, M.K.; Du, T. Energy partitioning and microclimate of solar greenhouse under drip and furrow irrigation systems. Agric. Water Manag. 2020, 234, 106096. [Google Scholar] [CrossRef]
  67. Li, H.; Li, J.; Shen, Y.; Zhang, X.; Lei, Y. Web-based irrigation decision support system with limited inputs for farmers. Agric. Water Manag. 2018, 210, 279–285. [Google Scholar] [CrossRef]
  68. Pereira, L.S.; Paredes, P.; Jovanovic, N. Soil water balance models for determining crop water and irrigation requirements and irrigation scheduling focusing on the FAO-56 method and the dual Kc approach. Agric. Water Manag. 2020, 241, 106357. [Google Scholar] [CrossRef]
  69. Raes, D.; Steduto, P.; Hsiao, T.C.; Fereres, E. AquaCrop—the FAO crop model to simulate yield response to water: II. Main algorithms and software description. Agron. J. 2009, 101, 438–447. [Google Scholar] [CrossRef] [Green Version]
  70. Sammis, T.; Sharma, P.; Shukla, M.K.; Wang, J.; Miller, D. A water-balance drip-irrigation scheduling model. Agric. Water Manag. 2012, 113, 30–37. [Google Scholar] [CrossRef]
  71. Fernández, J.E. Plant-based methods for irrigation scheduling of woody crops. Horticulturae 2012, 3, 35. [Google Scholar] [CrossRef] [Green Version]
  72. Veysi, S.; Naseri, A.A.; Hamzeh, S.; Bartholomeus, H. A satellite based crop water stress index for irrigation scheduling in sugarcane fields. Agric. Water Manag. 2017, 189, 70–86. [Google Scholar] [CrossRef]
  73. Chauhan, Y.S.; Wright, G.C.; Holzworth, D.; Rachaputi, R.C.; Payero, J.O. AQUAMAN: A web-based decision support system for irrigation scheduling in peanuts. Irrig. Sci. 2013, 31, 271–283. [Google Scholar] [CrossRef]
  74. Wang, E.; Attard, S.; Linton, A.; McGlinchey, M.; Xiang, W.; Philippa, B.; Everingham, Y. Development of a closed-loop irrigation system for sugarcane farms using the Internet of Things. Comput. Electron. Agric. 2020, 172, 105376. [Google Scholar] [CrossRef]
  75. Simionesei, L.; Ramos, T.B.; Palma, J.; Oliveira, A.R.; Neves, R. IrrigaSys: A web-based irrigation decision support system based on open source data and technology. Comput. Electron. Agric. 2020, 178, 105822. [Google Scholar] [CrossRef]
  76. Lasage, R.; Verburg, P.H. IrrigaSys: Evaluation of small scale water harvesting techniques for semi-arid environments. J. Arid Environ. 2015, 118, 48–57. [Google Scholar] [CrossRef]
  77. Grum, B.; Hessel, R.; Kessler, A.; Woldearegay, K.; Yazew, E.; Ritsema, C.; Geissen, V. A decision support approach for the selection and implementation of water harvesting techniques in arid and semi-arid regions. Agric. Water Manag. 2016, 173, 35–47. [Google Scholar] [CrossRef]
Figure 1. Scheme of the incorporation of canopy temperature into the SOLANUM model. Final values (Y) of the SOLANUM model’s growth curves were determined between potential values ( Y p ) and penalized valued ( Y d T ) according to the water stress degree based on canopy temperature depression (dT). d T 1 : average dT before irrigation pulse. d T 2 : accumulated dT from the tuber initiation onset (TIO) to physiological maturity (FM).
Agronomy 11 01436 g001
Figure 2. Average values (±standard error) of observed (open circles) and simulated dry tuber yield temporal dynamics of the UNICA potato variety for Trials A and C. Simulated values of the water-limited module (1st perspective, dotted line) and canopy temperature module (2nd perspective, dashed line) of the SOLANUM model. The first (ac), second (df), and third (gi) row correspond to Trial A’s drip irrigation, Trial A’s furrow irrigation, and Trial C’s drip irrigation, respectively.
Agronomy 11 01436 g002
Figure 3. Scatterplot of observed values of the final dry tuber yield (t ha 1 ) versus simulated data of the water limited module (1st perspective, black triangles) and canopy temperature module (2nd perspective, white triangles) of the SOLANUM model. Triangles facing up and down correspond to drip and furrow irrigation, respectively.
Agronomy 11 01436 g003
Table 1. General details of the first (Trial A), second (Trial B), and third (Trial C) trial established under a completely randomized design with N treatments repeated in M blocks (N × M) using two irrigation types: drip (DI) and furrow (FI) irrigations. All trials had a control treatment in which the soil moisture was maintained at field capacity. g s _ m a x : maximum stomatal conductance at saturated light (in mol H 2 O m 2 s 1 ). CWSI: crop water stress index. TO: treatment onset. dap: days after planting. θ F C : volumetric soil moisture at field capacity.
TrialPlot Size
(m 2 )
# of Plants
per Plot
TO
(dap)
N×MIrrigation
Indicator a
Irrigation
Thresholds b
Irrigation
Type
Fertilizer Dose c
(kg ha 1 )
θ FC
(%)
A3.6 × 12.5120303 × 4 g s _ m a x 0.15 and 0.05DI and FI180:100:16031.8
B3.6 × 12.5120344 × 5CWSI0.4, 0.6 and 0.7DI and FI180:100:16032.8
C4.5 × 15.8180363 × 5CWSI0.4 and 0.6DI160:80:18028.4
a Variable evaluated to determine the irrigation timing. b Irrigation thresholds from which the irrigation pulses were applied. c Fertilization dose based on N:P 2 O 5 :K 2 O.
Table 2. Coefficients obtained from potential conditions (based on Trial B’s control treatment) for the calibration of the SOLANUM model under drip irrigation (DI) and furrow (FI) irrigation and sensitivity analysis (in % % 1 ) expressed as a percentage of the variation in fresh tuber yield (t ha 1 ) affected by a percentage of the variation in the input parameters of the SOLANUM model. TT = thermal time (calculated as in McMaster and Wilhelm [43]). In gray, the selected parameters with the sensitivity analysis values ≥ |0.95|.
Physiological ProcessCrop ParametersSymbolDIFISensitivity Analysis
Light
interception
Maximum canopy cover index (fraction)W m a x 1.01.00.99
TT time at the maximum canopy cover (°C day)t e 971.31023.01.70
TT at the maximum canopy cover growth rate (°C day)t m 332.3272.9−0.79
Light conversionRadiation use efficiency (g MJ 1 )RUE2.472.800.99
Biomass
translocation
Maximum harvest index (fraction)A0.760.730.99
TT at the maximum tuber partition rate (°C day)t u 642.1659.5∼0
TT just before the tuber initiation process (°C day)b222.2286.6∼0
Dry matter concentration of tubers (fraction)DMc0.210.18
Table 3. Empirical coefficients (a, b, and c) of a multilinear function ( F R = a × d T 1 + b × d T 2 + c ) that reduce/increase the potential value ( X p ) of a specifically targeted crop parameter (TCP) according to the water stress degree based on canopy temperature depression (dT). d T 1 = average dT before irrigation pulse, d T 2 = accumulated dT from the treatment onset to physiological maturity, R 2 = coefficient of determination. Abbreviation (and units) of TCP in Table 2.
TCP X p Valuea ( × 10 2 )b ( × 10 3 )cR 2
RUE2.64−0.81−2.561.410.92
w m a x 1.00−3.69−0.751.240.84
t e 997.2−1.91−0.041.080.73
A0.75−4.050.821.020.53
Table 4. Metrics’ results for dry tuber yield simulations of the water-limited module (1st perspective (P1)) and canopy temperature module (2nd perspective (P2)) of the SOLANUM model. R 2 : coefficient of determination. m: slope of linear regression. RMSE: root-mean-squared error (in t ha 1 ). NRMSE: normalized root-mean-squared error (in %).
MetricsDrip IrrigationFurrow IrrigationOverall
P1P2P1P2P1P2
R 2 0.940.970.910.990.930.98
m1.051.120.840.990.971.08
RMSE1.761.341.980.621.841.15
NRMSE0.240.180.330.100.270.17
Publisher’s Note: MDPI stays neutral with regard to jurisdictional claims in published maps and institutional affiliations.

