Communication

Using Genomic Selection to Leverage Resources among Breeding Programs: Consortium-Based Breeding

1
Department of Horticulture and Crop Science, The Ohio State University, 281 W Lane Ave, Columbus, OH 43210, USA
2
Department of Agronomy, Purdue University, 610 Purdue Mall, West Lafayette, IN 47907, USA
3
Department of Crop Science, University of Illinois Urbana-Champaign, Champaign, IL 61820, USA
*
Author to whom correspondence should be addressed.
Submission received: 1 June 2021 / Revised: 16 July 2021 / Accepted: 28 July 2021 / Published: 4 August 2021
(This article belongs to the Special Issue Wheat Breeding: Procedures and Strategies – Series Ⅱ)

Abstract

:
Genomic selection has many applications within individual programs. Here, we discuss the benefits of forming a GS-based breeding consortium (GSC) among programs within the context of a recently formed a GSC of soft red winter wheat breeding programs. The GSC will genotype lines from each member breeding program (MBP) and conduct cooperative phenotyping. The primary GSC benefit is that each MBP can use GS to predict the local and broad value of all germplasm from all MBPs including lines in the early stages of testing, thus increasing the effective size of each MBP without significant new investment. We identified eight breeding aspects that are essential to GSC success and analyzed how our GSC fits those criteria. We identified a core of >5700 related lines from the MBPs that can serve in training populations. Germplasm from each MBP provided breeding value to other MBPs and program-specific adaption was low. GS accuracy was acceptable within programs but was low between programs when using training populations with little testing connectivity, but increased when using data from trials with high testing connectivity between MBPs. In response we initiated sparse-testing with a germplasm sharing scheme utilizing family relationship to connect our phenotyping of early-stage lines.

1. Introduction

Public breeding programs serve society by releasing improved cultivars, developing parent lines, conducting breeding and genetic research, and training students. Public-based breeding programs are small compared to programs for major crops conducted by private companies where breeders working on the same crop share all data, germplasm, databases, and marker platforms. In contrast, public programs cooperate primarily by testing a few advanced elite lines in cooperative trials that assess local and broad adaptation of the entries, though these benefits are applied to only a handful of the elite lines. Public breeders generally have no knowledge or access to the wealth of diversity and genetic potential that reside among the lines in the earlier stages of evaluation in other breeding programs. This can significantly limit the impact of public programs.
The rapid development of genomic selection [1] in plant breeding, high-throughput genotyping, public databases, and advanced analytical models enable us to look at individual breeding programs in new ways [2,3,4]. They also enable us to envision how these technologies can extend the interactions among programs and leverage investments beyond cooperative testing. We recently formed a GS-based breeding consortium (GSC) involving soft winter wheat breeding programs at The Ohio State University (OH), Purdue University (IN), the University of Kentucky (KY), and the University of Illinois Urbana-Champaign (IL). Our GSC was inspired in part from the Sungrains project involving six soft wheat breeding programs in the southern US (http://www.sungrains.lsu.edu/ accessed on 2 September 2021). Our objectives are to outline the benefits and rationale for a GSC, criteria needed for a successful GSC, and to present analyses supporting this approach in our nascent consortium.

2. Materials and Methods

2.1. Diversity Analysis

We genotyped 8943 lines from the four member breeding programs (MBP) using genotyping by sequencing (GBS). The SNP calling and filtering was conducted using the methods of Ward et al. [5]. Linkage disequilibrium pruning was performed using the PLINK 1.9 (www.cog-genomics.org/plink/1.9/, accessed on 2 August 2021) indep-pairwise command with 100 kb window size, 10 step size, and 0.90 r2 threshold as parameters. The filtering resulted to 6399 SNPs. The SNP data was used in a principal component analysis using TASSEL (Trait Analysis by aSSociation, Evolution and Linkage; [6]) and plotted the first two principal components using the ggplot2 package [7] in R (R Core Team, 2020). We did an Fst analysis [8] to estimate the differentiation of the lines from the four programs using the hierfstat package [9] in R.

2.2. GS Analyses Using Data from Breeding Trials

We obtained genotypic and phenotypic data for yield, test weight, and FHB data on lines from each MBP (Table 1). The data was unbalanced. Within a program we obtained BLUES using the following model
Yijk = u + gi + tj + rk + grik + eijk
where Yijk is the phenotype of the ith lines, in the jth test, in the kth year. u is the mean, gi the effect of the ith genotype, tj the effect of the jth trial, rk the effect of the kth year, grik the interaction of the ith genotype with the kth year, and eijk the error. Only entry means were available from some the programs so we first obtained means over replications for the data from the other programs prior to the analysis. Genotype and trial effects were considered fixed effects. GS analyses were performed using (1) data from just one MBP with 10-fold cross-validation, and (2) using data from one MBP to predict the value of lines that were phenotyped within another MBP. The correlation of these predicted value and BLUES was used to estimate the accuracy of GS between MBPs.

2.3. Analysis of Data from Cooperative Trials

We obtained entry means from evaluation of 264 genotyped lines assessed for yield and test weight in the 5-State cooperative trials from 2012 to 2020. The 5-State trial also contained lines and test site from non-MBP: that data was deleted from the analysis. We obtained BLUEs over multiple testing states for all lines using the following model.
Yijkl = u + gi + sj + l(s)ik + rl + gsij + gyil + pyjl + eijkl
where Yijk is the phenotype of the ith lines, in the jth testing state, in the kth location and the lth year. u is the mean, gi the effect of the ith genotype, sj the effect of the jth testing state, l(s)jk is the effect of the kth location within the jth testing state, rl is the effect of the lth year, gsij the interaction of the ith genotype with the jth testing state, gril is the interaction of the ith genotype with the lth year, srjl is the interaction of the jth testing state with the lth year, and eijkl the error. We also obtained BLUES using data from just one testing state using the model:
Yijkl = u + gi + lj + rk + glij + gyik + eijk
where Yijk is the phenotype of the ith lines, in the jth location, in the kth year. u is the mean, gi the effect of the ith genotype, lj the effect of the jth testing location, rk is the effect of the kth year, glij the interaction of the ith genotype with the jth testing location, gril is the interaction of the ith genotype with the kth year, and eijk the error. We also obtained entry means from evaluation of 453 genotyped lines evaluated for resistance to FHB in the P+NUWWSN cooperative trials from 2012 to 2020. The P+NUWWSN trials contained lines and test site from non-MBPs: that data was deleted from the analysis. BLUES were obtained using Equations (2) and (3). The BLUES were obtained using Proc mixed in SAS and the lme4 package [10] in R.
We did three GS analyses using the BLUES from the cooperative trials. In one analysis, termed the “3->1” analysis, we used BLUES derived from the analysis of data from three states using Equation (2) in the training population to obtain predicted values that were then correlated to the BLUEs from the 4th program. In the “1->3” analysis, we used the BLUEs from one state as the training population to obtain predicted values that were then correlated to the BLUES obtained over the other three states. In what we term the “1->1”, the BLUEs from one state are used as the training populations to obtain predicted values that were then correlated to the BLUES from another state. All predicted value were generated using the BGLR package [11] in R.

3. Rationale for a GS Consortium

Developing a new cultivar requires assessing many lines to identify one that is acceptable for all targeted traits. There is an axiom that “breeding is a numbers game”. The validity of this axiom depends on if you are applying it to short or long terms breeding goals and whether you are assessing genetic gain, gain per season, gain per dollar spent, or the probability of attaining a new cultivar [12]. If the goal is to develop a new cultivar, from a certain population, in a short time frame, then the axiom is quite valid. A primary rationale of the GSC is to effectively increase the size and impact of our programs without greatly increasing our investment.
Evaluating more lines from a population increases the probability of identifying a new variety and presents the opportunity to increase selection intensity. When traits and the genes controlling them are independent then the probability that a new cultivar (Pnc) will exist in a population is
P n c = i = 1 t p i
where pi is the probability that a line in the population has an acceptable value for the ith trait of t independent traits. The number of lines that must be evaluated (N) to have a particular probability (Pe) that one line suited to be a new cultivar will be in that evaluation is estimated as [12]:
N = ln ( 1 P e ) ln ( 1 P n c )
A breeder must either increase Pnc, N, or both if they want to increase Pe. There are many strategies to increase Pnc such as increasing the rate of genetic gain, selecting better parents, and using molecular breeding to select individuals prior to evaluations. All strategies should be considered. Regardless of 
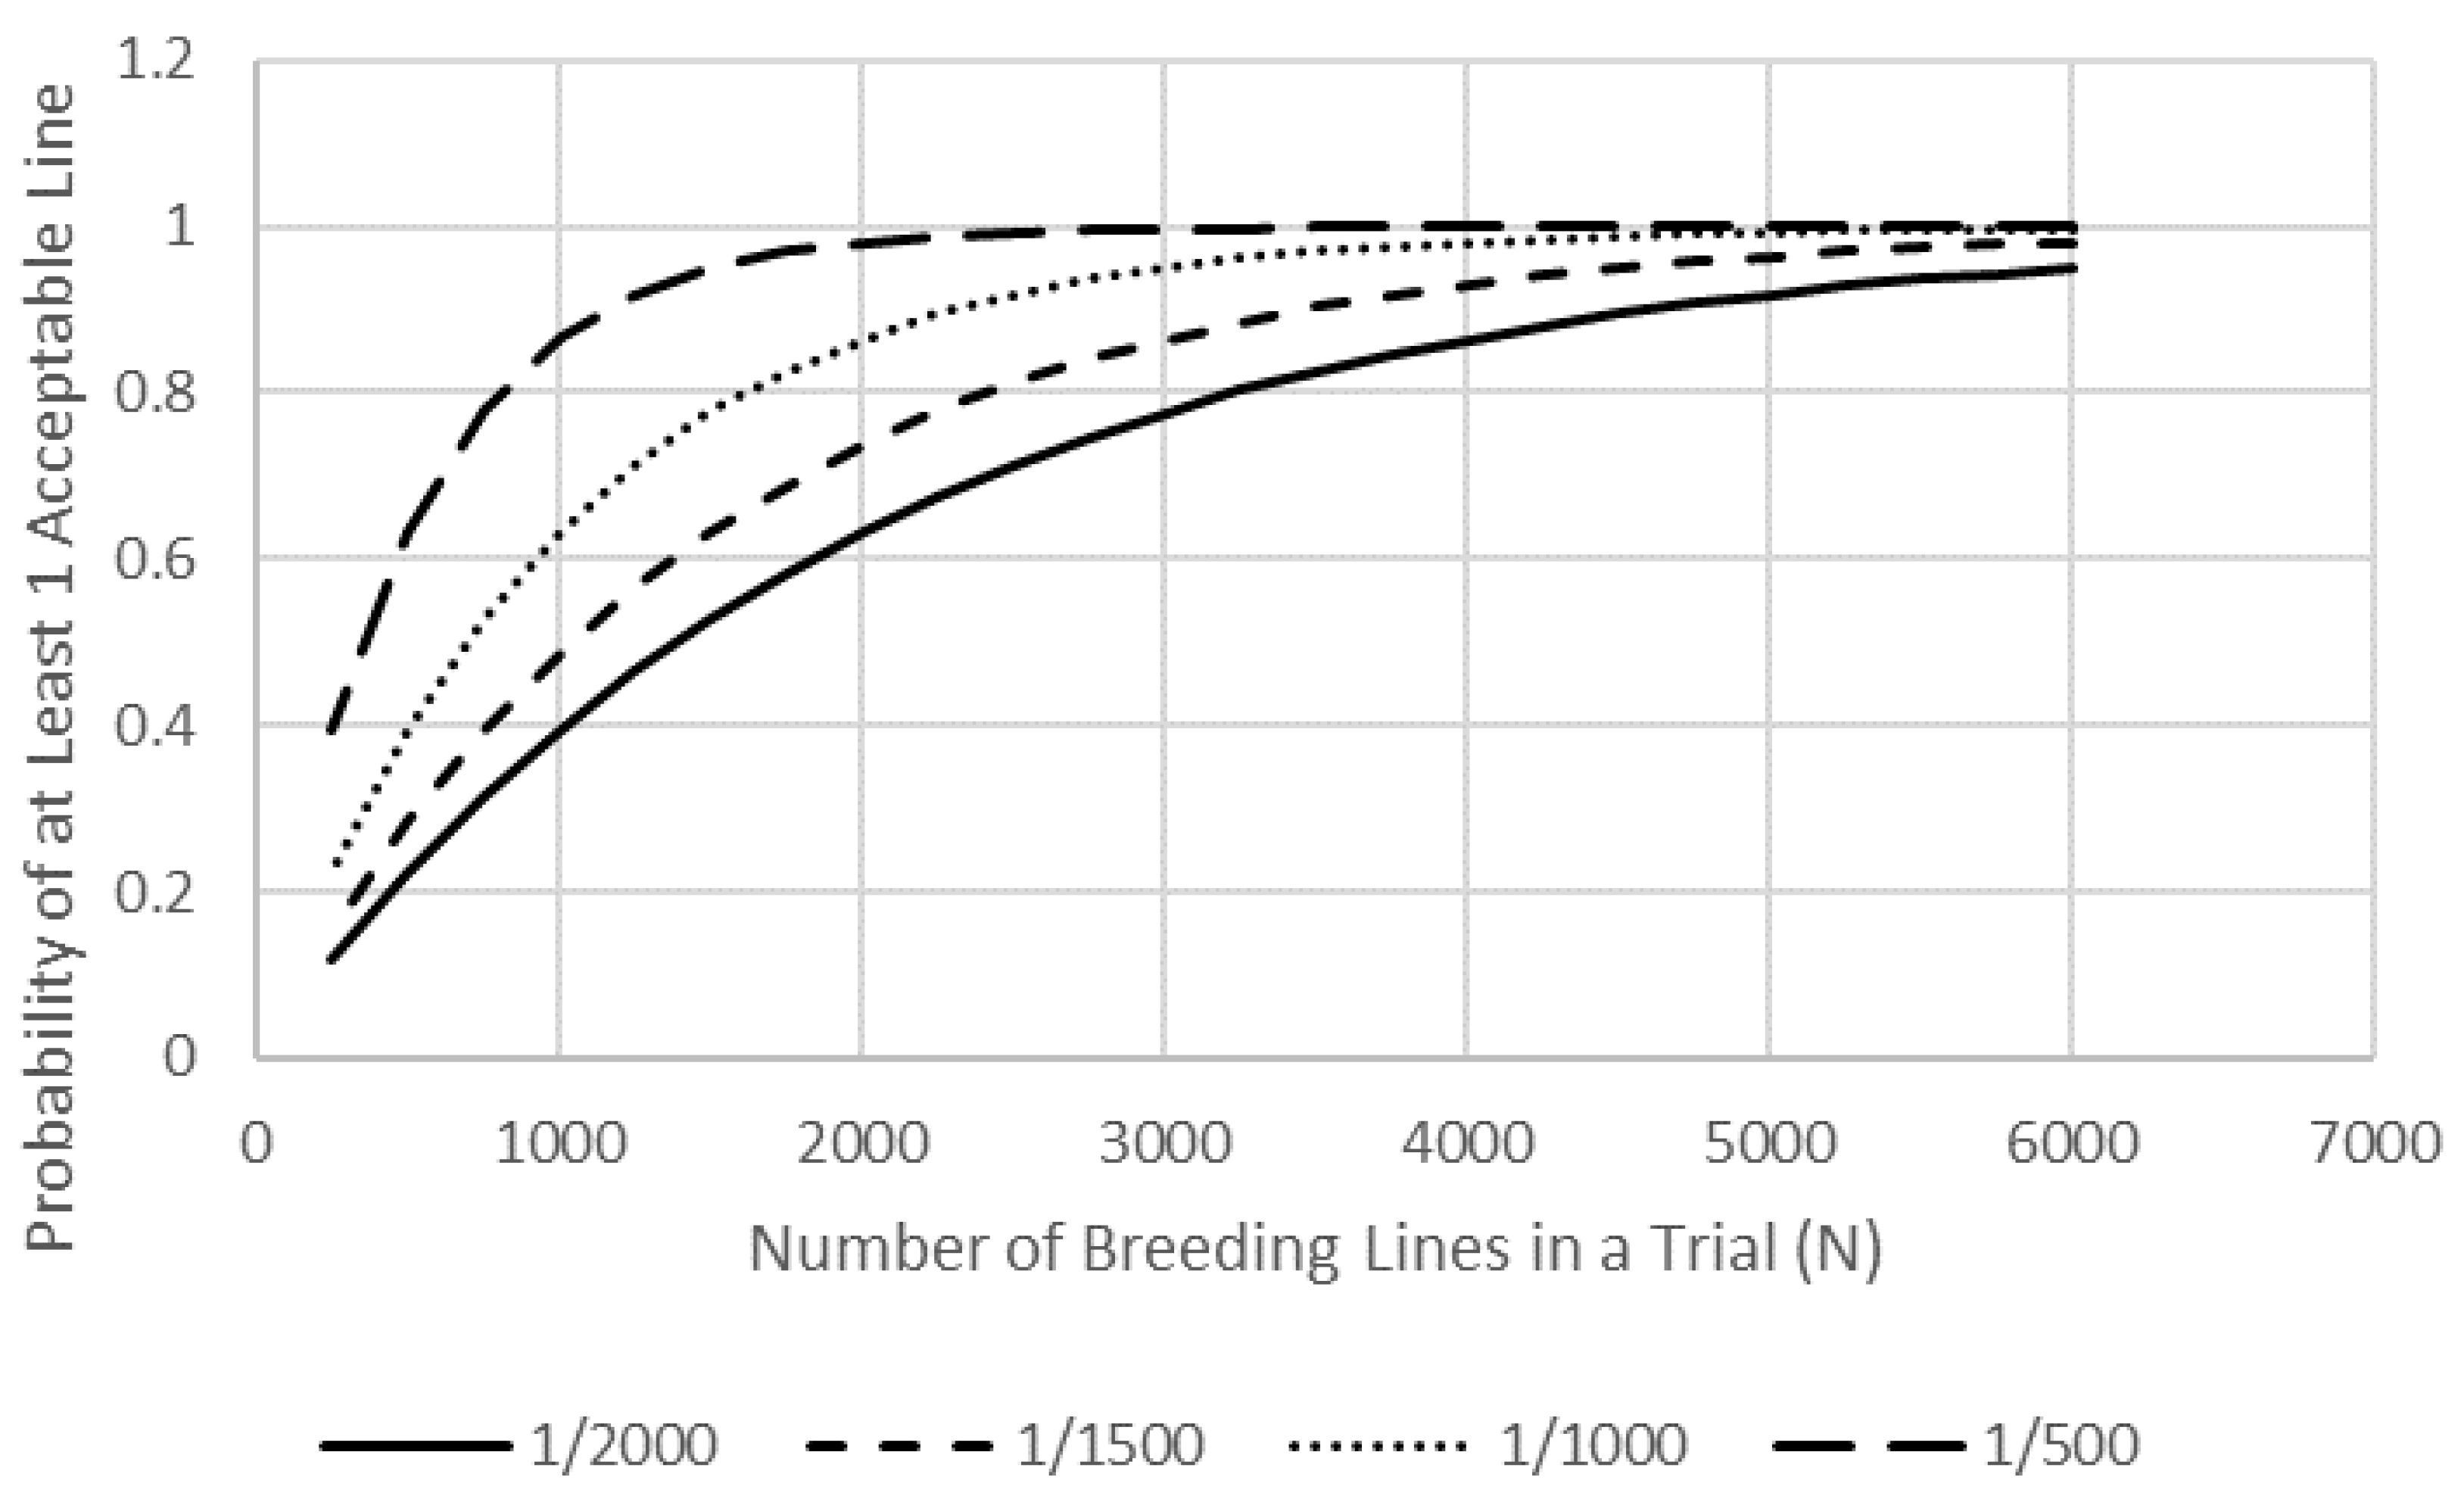
Pnc, the larger the evaluation (N), the greater Pe becomes, though with diminishing returns (Figure 1). Each of the four MBPs in our GSC evaluates an average of 900 stage-1 lines per year. If we assume a Pnc of 0.001, then each breeder has a Pe of 0.59 by evaluating their 900 lines.
It is likely unwise and inefficient to greatly increase N within a single public breeding program given the cost of phenotyping and the diminished returns (Figure. 1). Our GSC though allows each breeder to use GS to predict the value of the 2700 stage-1 lines from the other three MBP resulting in an effective N of 3600 and a Pe of 0.97. The Pnc can be small when attempting to attain acceptable trait values for yield, agronomics, resistance to multiple pests, and quality such that N may need to be in the 2000–4000 range to attain a Pe > 0.9, an N that our GSC provides.
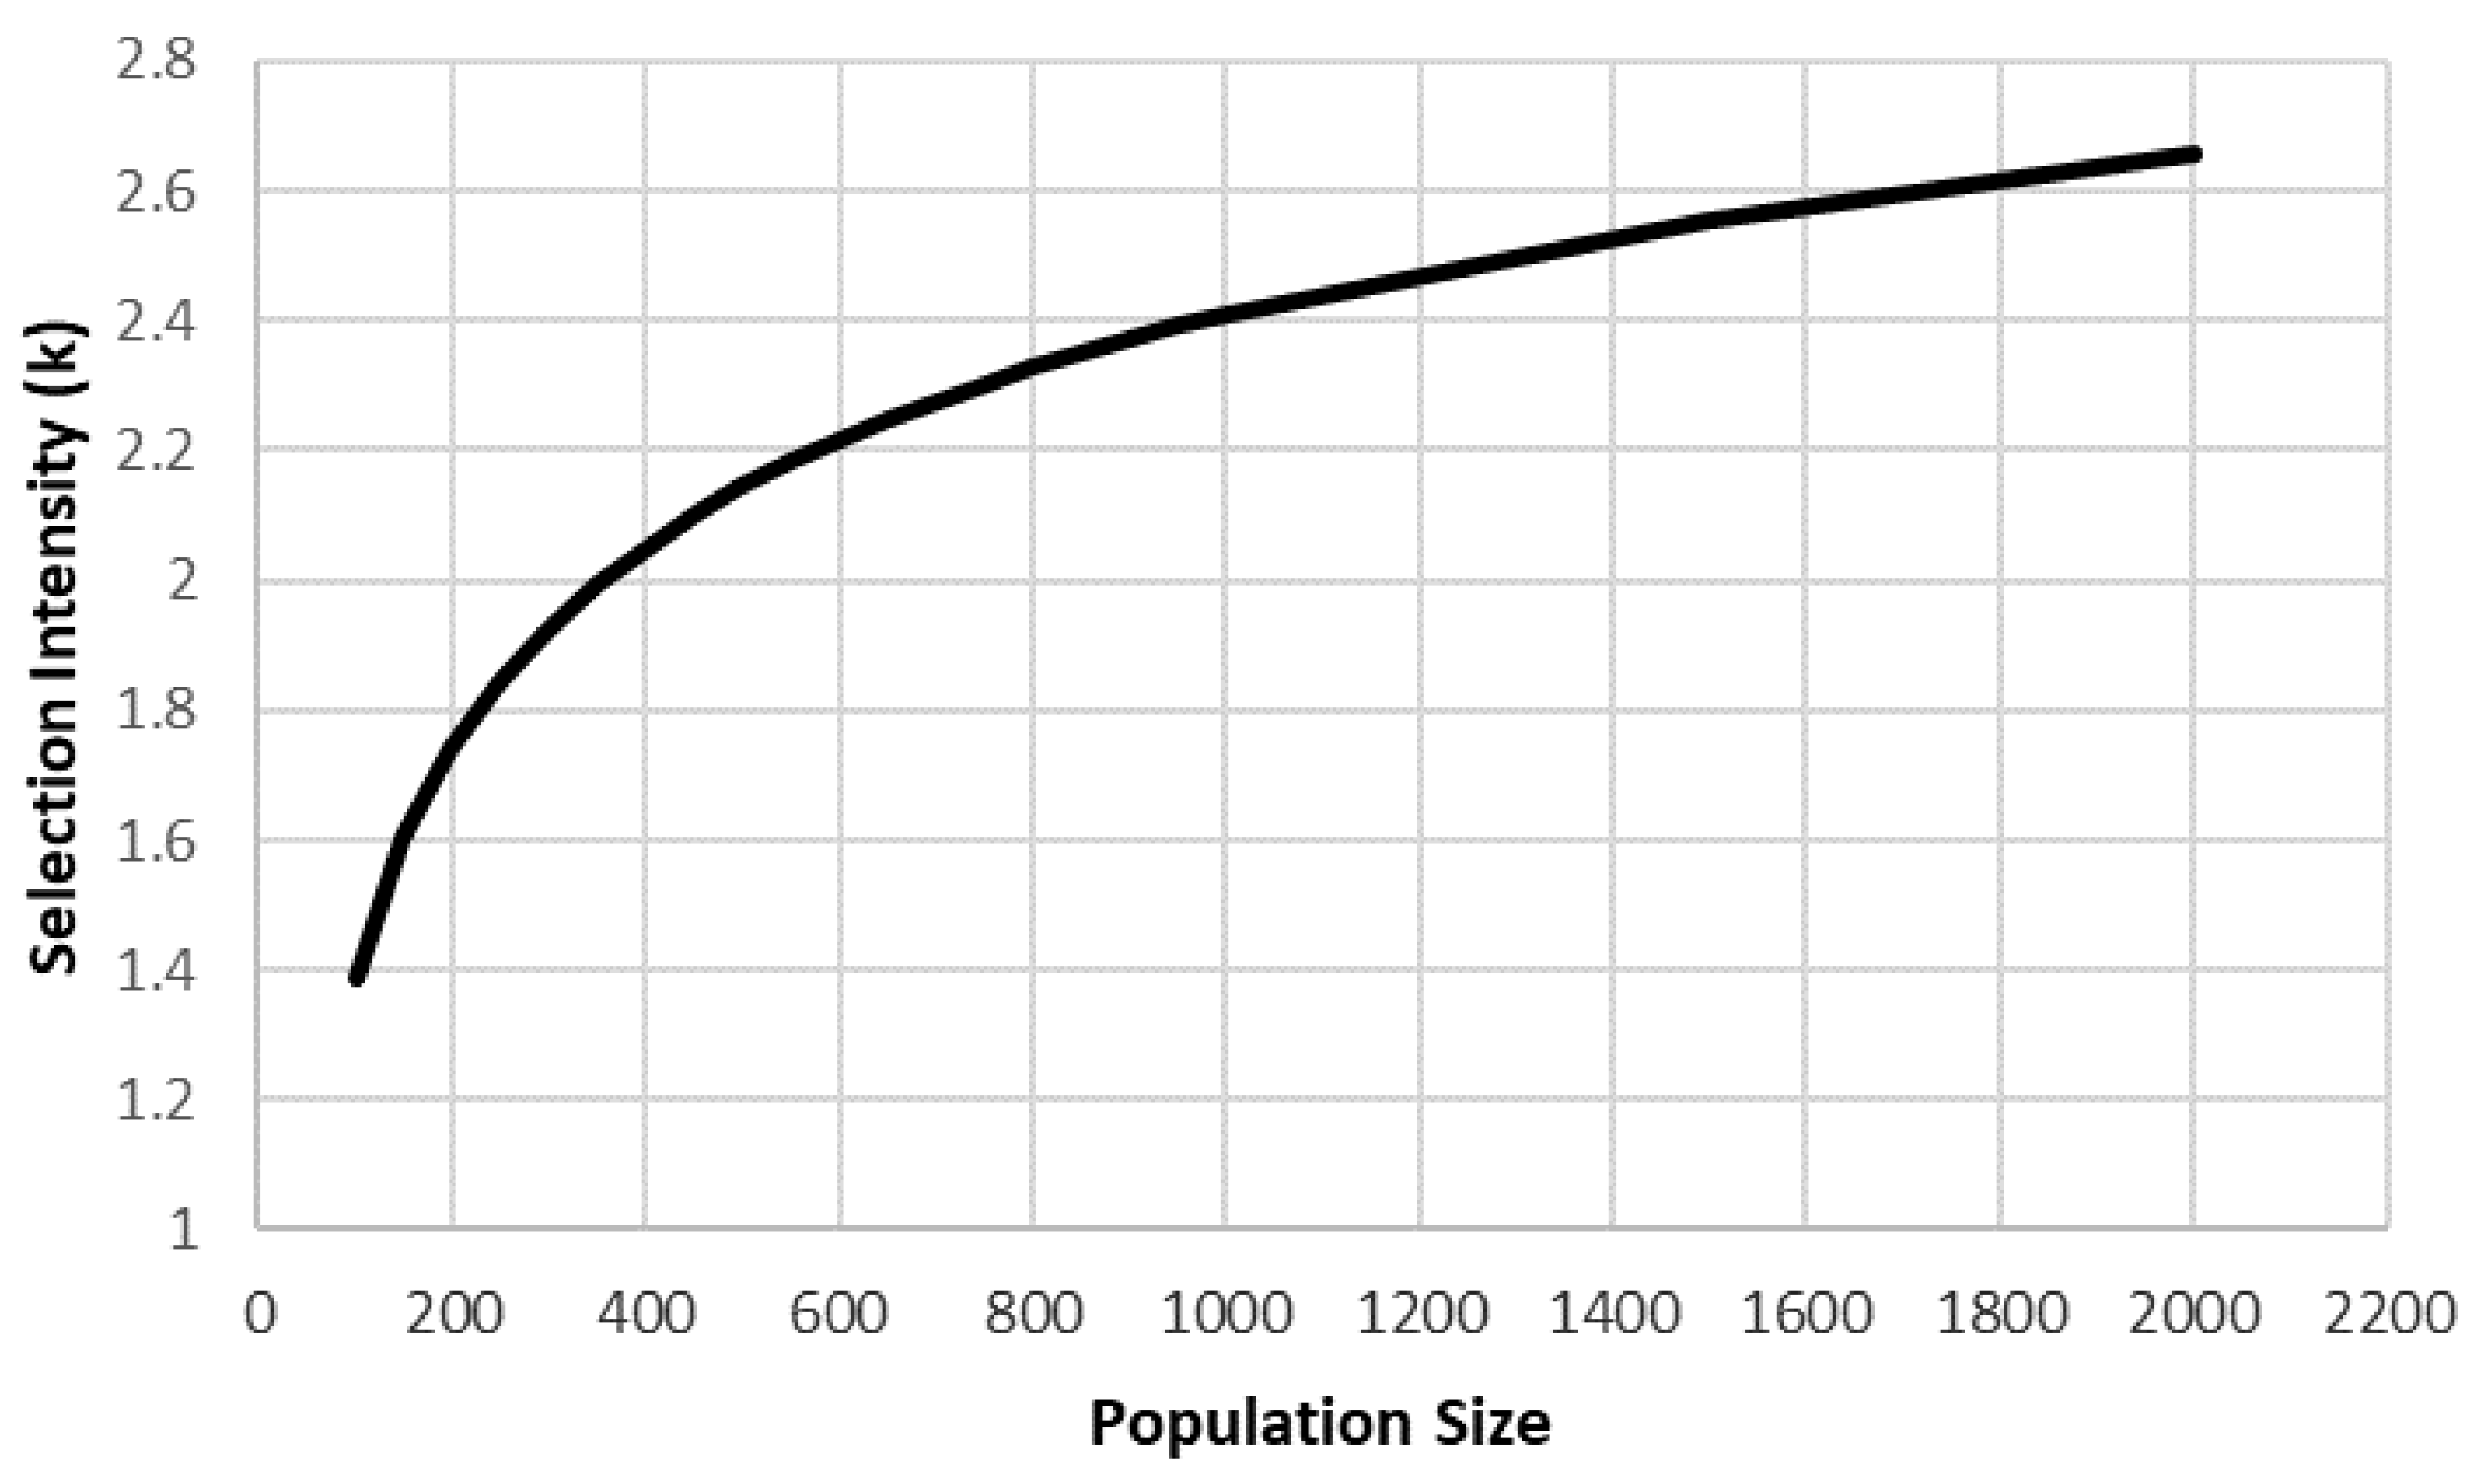
Selection intensity (k) also increases as N increases, though also with diminishing returns (Figure 2). Each MBP advances and average of 215 of their 900 lines to stage-2, providing a k = 1.297. Selecting 215 of 3600 lines from the entire GSC produces a k of 1.980, a 53% increase compared no GSC. If a breeder selects 20 900 lines as parents, then k = 2.233 while selecting 20 of the 3600 GSC lines produces k = 2.849, a 28% increase compared to no GSC.
Increasing N within public programs by investing funds to phenotype more lines is difficult due to limited funding and is likely inefficient in terms due to the diminishing returns in Pnc and k (Figure 1 and Figure 2). An alternative to increased phenotyping is to assess a large number of lines using GS as genotyping is often less expensive than phenotyping [2]. Funding genotyping can also be problematic within a public program. The four MBP in our GSC were already genotyping all their new breeding lines prior to forming the GSC so genotyping was not a new expense required of the MBPs. Borrenpohl et al. [13] presented evidence that GS could replace phenotyping of stage-1 lines such that the money saved by not conducting a stage-1 trial could be used to genotype lines. Thus, the genotyping required for a GSC is not necessarily an extra expense and could even save money.
The GSC concept allows a breeder to leverage their current investment to effectively increase the size of their selection population without much extra investment. This can increase Pnc, k, and gain per unit of investment. A GSC converts separate breeding programs into one large cooperative program allowing each breeder to assess the local and broad value of all lines from all breeders in. This extensive cooperation among public programs is now feasible due to the low cost of genotyping and the proven success of GS.
There are other benefits to a GSC. GS could be used to predict the value of all lines from all breeders, in all phenotyping environments, and over all environments, without actually phenotyping all lines in all environments. This is especially beneficial when applied to lines in the early stages of evaluation of each MBP where the population size is large and there is maximum genetic variation. A breeder can also get the predicted value of their lines for traits they did not phenotype when another MBP phenotypes for that trait.
A GSC offers benefits for genotyping. One condition for a GSC to operate is that all MBP must genotype their lines with the same marker system. Samples for genotyping can be consolidated within a GSC and result in volume discount and a lower genotyping cost per sample. The use of a common genotyping platform across all members also facilitates analyses of the diversity within and across the MBPs. The GSC also presents unique opportunities for training graduate students and learning from each MBP.

4. Requirements for a Successful GSC

The general operating plan for a GSC is to genotype all new breeding lines from each MBP prior to field testing, and to distribute the lines among the MBPs for testing, predictions, and selection. The GS models would be trained using phenotypic data from past and current field trials associated with the product development phase of each MBP. While it may be desirable to integrate all aspects of the MBPs, this article focuses on integrating the product development phase involving the evaluation of new lines.
There are many factors that will affect the success of a GSC. Some factors are related to management and administrative (see items I–M below). These are not trivial, but they will not be discussed in this article. Items A–H are related to principals of breeding and GS. We will discuss each within the context of our recently formed GSC.
  • Germplasm among the member programs must be related
  • Shared breeding goals among the members
  • Germplasm from each member must offers value to the other members
  • GS must be effective for target traits and populations
  • Development of optimal breeding and testing schemes to enhance predictions
  • A common, affordable marker platform
  • A common database for storing phenotypic and genotypic data
  • Ability to accurately phenotype for target traits
  • Communication among members
  • Skills in GS analyses
  • Coordinator for organizing samples, data files, and for executing analyses within and across programs
  • Ability of members to fund genotyping
  • Ability to share germplasm
A. The elite lines in the cultivar development portion of each MBP must be related to one another to obtain meaningful GS predictions [14,15,16]. The degree of relatedness also affects what size training population (TP) is required [5]. Bassi et al. [17] estimated that to attain a prediction accuracy of 0.5 required a TP size of at least 50 when selection candidates are full sibs of individuals in the TP, at least 100 for half-sibs, and at least 1000 for more distant relationships. In simulations of maize biparental populations, Hickey et al. [18] reported that a TP between 400 and 1000 individuals was required to achieve prediction accuracies above 0.6 when half-sib F2 families were used as the TP to predict phenotypes in a target F2 population. Utilizing a TP from unrelated biparental populations produced poor prediction accuracy unless >4000 phenotypes were used).
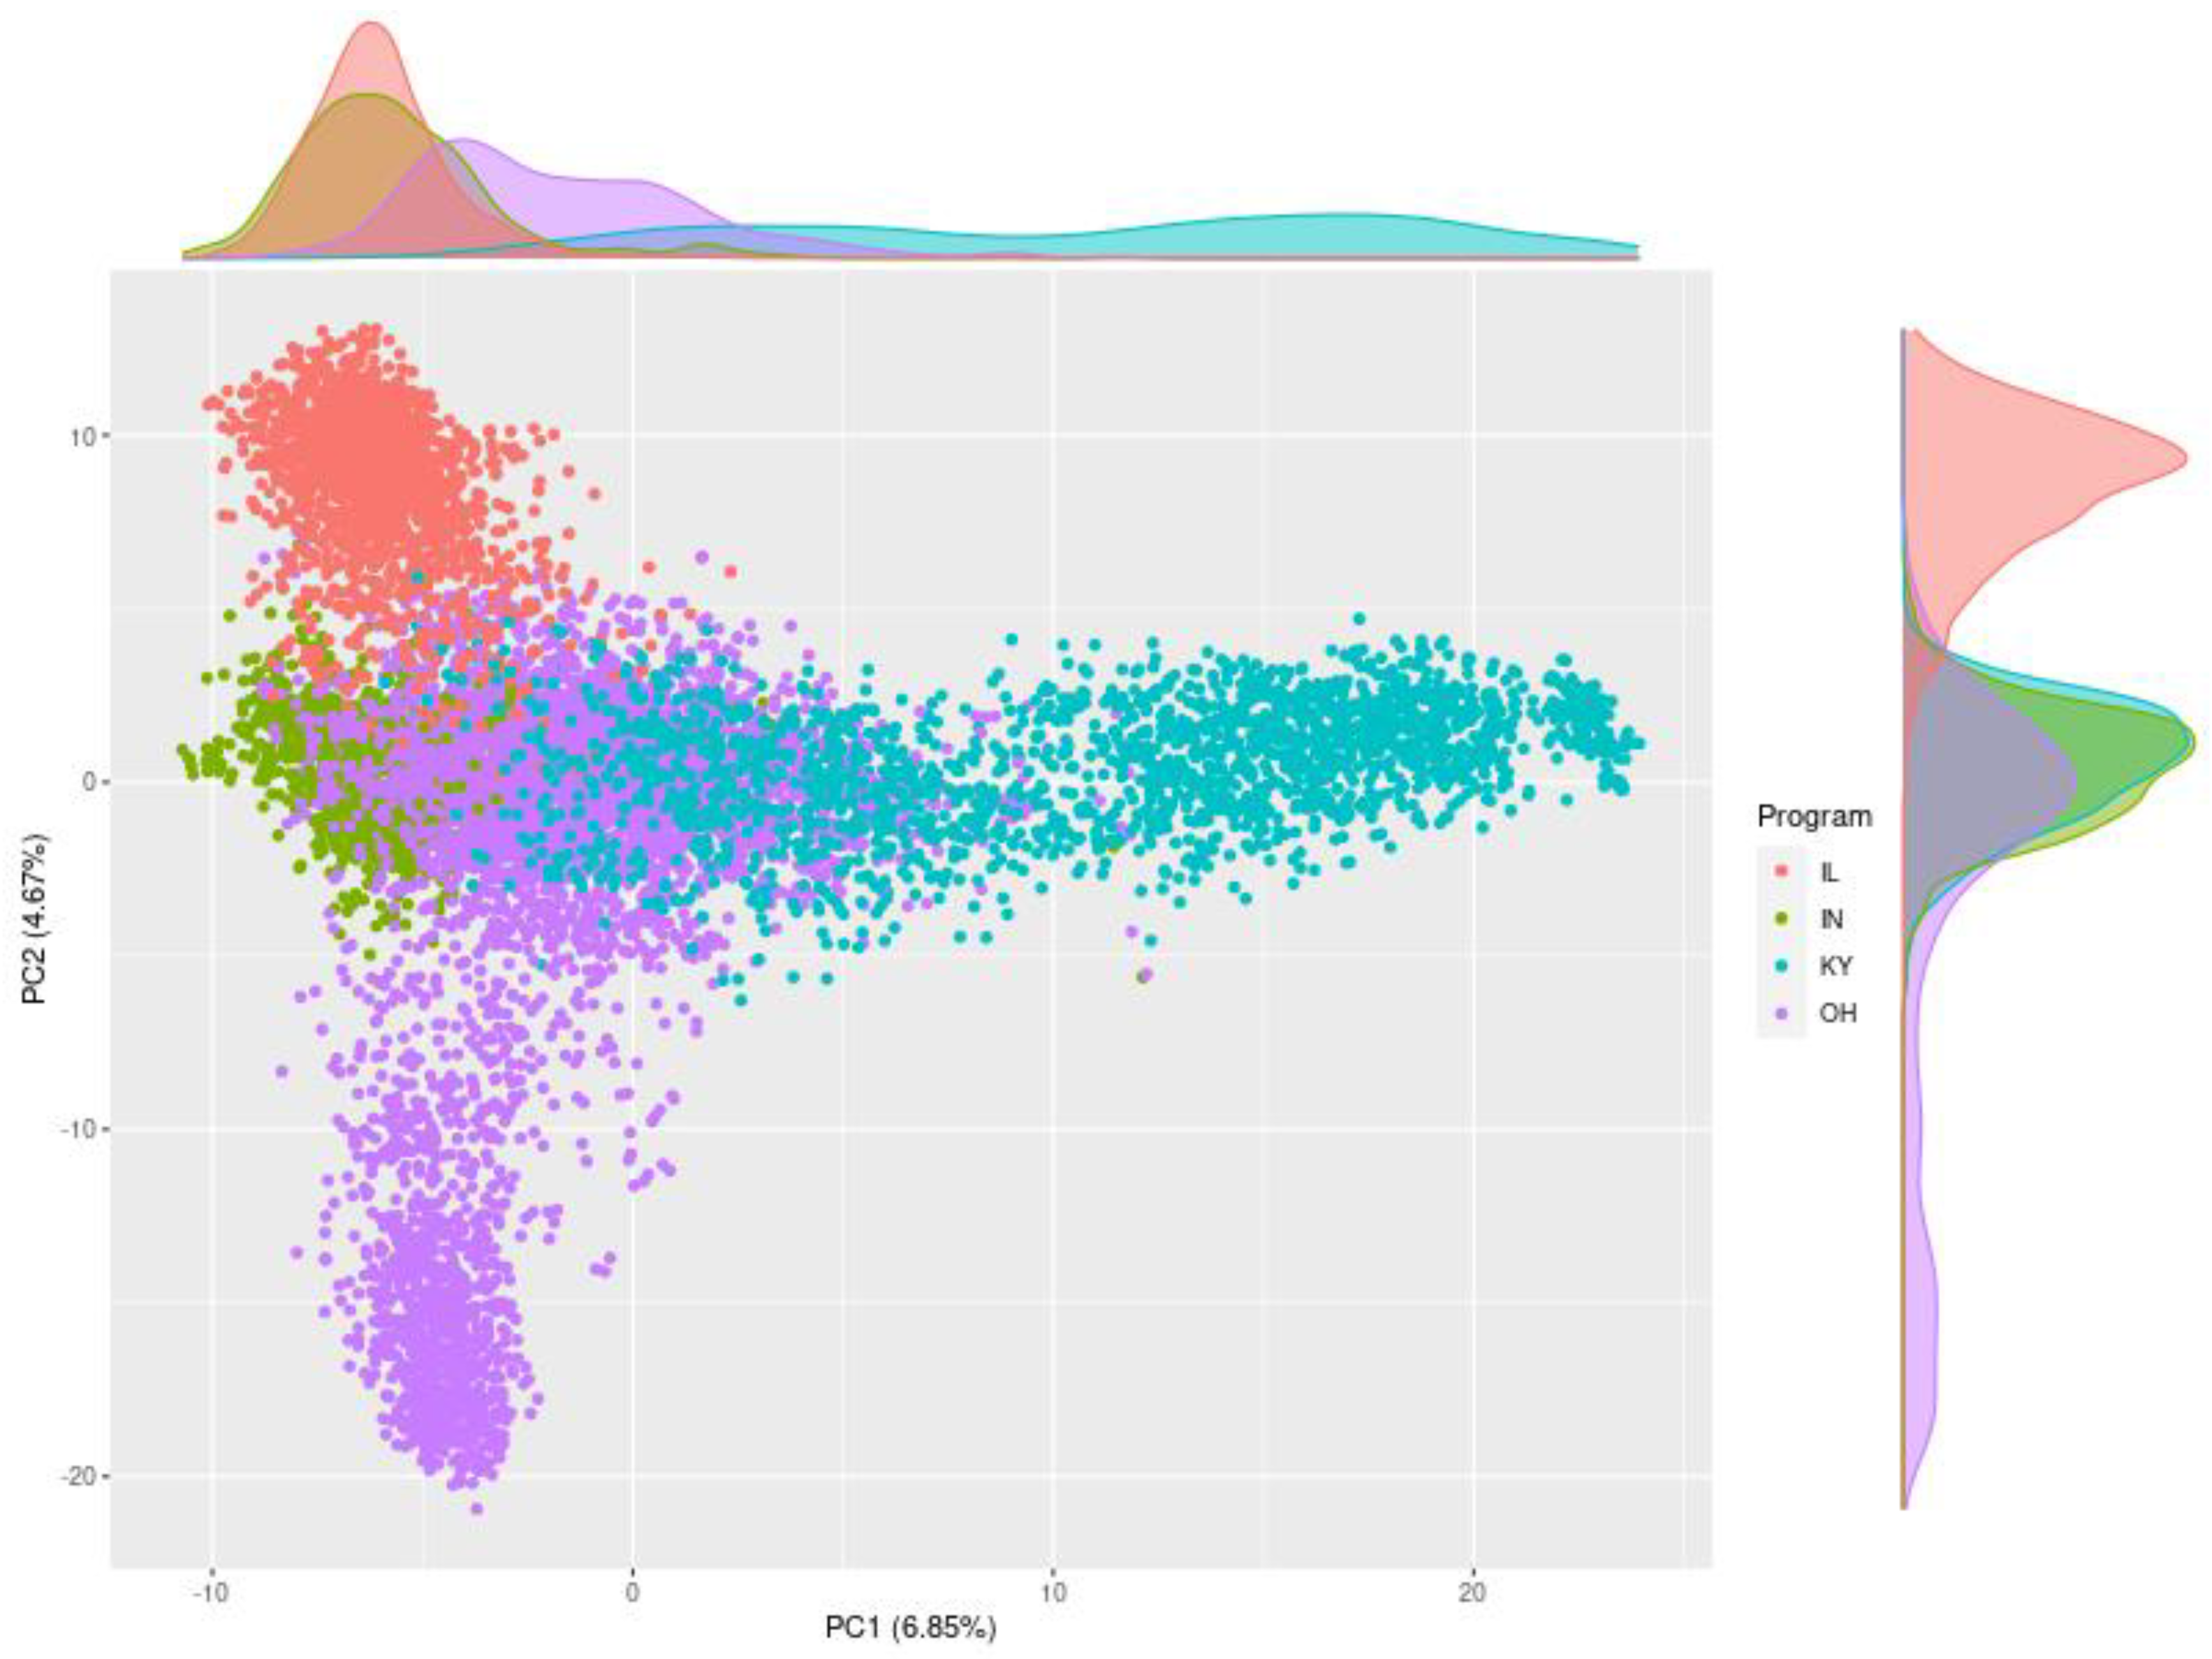
We used GBS to genotyped 8943 recent and historical germplasm accessions from the four MBPs of our GSC. The principal components graph (Figure 3) indicates considerable diversity and some structure among the lines of the four MBPs. There is also considerable relatedness as 5745 (64%) of the lines are within 1.25 standard deviations from the origin in Figure 3: this includes 35% of the lines from IL, 98% of the lines from IN, 43% of the lines from KY, and 77% of the lines from OH. The analysis of Fst values also suggest that the germplasm from the MBPs is fairly related especially lines from IL and OH, IN and OH, and KY and OH. (Table 2). Producing a large TP is a benefit of the GSC. And thehe 5745 centralized accessions can serve as a large and suitable TP for predictions within and between MBPs and optimized TPs can be derived from this set [18].
The general relatedness among the four MBPs is not surprising as these MBP have participated in cooperative trials of each other’s germplasm and exchanged parents for decades. A similar relationship could arise among programs that acquire much of their germplasm and parents from a common source, such as the Consultive Group for International Agriculture Research (CGIAR) institutes. This is a common practice among National breeding programs in the developing world.
B. Each member of the GSC should target the same primary traits in their product profile. The four MBP in our GSC share the primary goals of improving grain yield, test weight, and resistance to Fusarium Head Blight (FHB) cause by the fungus Fusarium graminearum. In addition, the four MBP have similar target values for maturity and plant height.
C. It is vital that the germplasm of each MBP of the GSC offers value to the other MBPs. It is important to analyze the value of germplasm among the MBPs and the genotype x environment interaction (GEI) pattern among lines and MBP environments to assess the degree of specific adaptation of each MBP’s germplasm. We assessed the GEI pattern and value of the germplasm from each MBP to the other MBPs in an analysis of data from cooperative trials.
The trait averages show that lines from one MBP perform reasonably well when tested in the other MBP’s environments (Table 3) indicating that the germplasm of each MBP offers value to the others. This is particularly true for yield where the highest average yielding lines in IN, KY, and OH were from a different MBP. The average GEI values also indicate that there is not a pronounced MBP-specific adaptation of one MBP’s line to their program’s environments.
D. The accuracy of GS must be sufficient to warrant its use for the target traits of the GSC. Published results of static TPs show that GS can be effective in soft red winter wheat for our primary traits. The prediction accuracy for grain yield has ranged from 0.20 to 0.65, from 0.37 to 0.62 for FHB resistance, and from 0.30 to 0.66 for test weight (Table 4).
There are several GS predictions of particular interest within a GSC: (1) breeder A predicting the value of their own lines in their own environments, (2) breeder A predicting the value of lines from the other MBP in breeder A’s environments, and (3) breeder A predicting the value of their own lines in other MBP environments The values in Table 4 are encouraging but what is more relevant is the accuracy of a GS model that uses the accumulating phenotypic data from the annual successive stage trials of a breeding trials as the TP, referred to as stage-gate trials. Several studies have shown that GS provides useful prediction with TP whose phenotypes come from unbalanced designs that commonly occur within breeding programs [5,13,25,30,31,32,33,34,35]. We assessed GS accuracy using the yield, test weight, and FHB resistance data from the breeding trials of each MBP (Table 5). The cross-validation estimates of GS accuracy within a program (diagonal elements in Table 5) were similar to the GS accuracy as obtained using the static TPs (Table 4). These results show GS can be effective within a program using stage-gate data.
The accuracy of GS though was quite low when using the stage-gate data from one MBP to predict the phenotypes of lines in another MBP, (off diagonal elements, Table 5). The low GS accuracy could arise from (1) low genetic relatedness among the lines in the programs, (2) each MBP may represent a unique environment which promotes large GEI, or (3) too few lines are tested over all environments to effectively connect the data among programs (e.g., low connectivity). Our analysis of diversity (Figure 3) and GEI (Table 3) suggest that the diversity and GEI in the data are unlikely to be major issues, leaving a lack of data connectivity over between the stage-gate trials of the MBP as the likely problem. Prior to the GSC, our early stage-gate trials (stages 1 and 2) had zero connectivity and in a typical year about 1% of all lines in the GSC were tested by more than one MBP.
The MBP of our GSC conduct cooperative trials where all lines in a trial are tested by all MBPs providing 100% connectivity. We data from cooperative trials to assess GS accuracy among MBP using these connected data sets. Data from the 5-State trials was used to assess GS accuracy for yield and test weight. Data from the P+NUWWSN FHB trials were used to assess GS accuracy for FHB resistance. We used BLUES estimated over trials conducted by three MBPs to predict the phenotype of the lines in trials of the fourth MBP: this is called a 3->1 prediction. We used BLUEs from one MBP trials to predict the phenotype of lines over the trials of the other three MBP (1->3 predictions). Finally, we used BLUEs from one MBP’s trials to predict the phenotypes of one other MBP’s trials (1->1 predictions).
The accuracy of GS between MBPs improved when using the highly connected data from the cooperative trials relative to the analysis using stage-gate data. Previously the average 1->1 accuracy for yield was 0.058 with a range of −0.1 to 0.18 (Table 5). The average 1->1 accuracy for yield in the 5-State analysis was 0.22 with a range of 0.04 to 0.43 (Table 6). This is similar to the inter-program accuracy reported by Saranelli et al. [22] by using data from the Sungrains cooperative wheat trial. Using BLUEs from data compiled over three MPB’s trials greatly improved prediction accuracies shown by the values of the 3->1 and the 1->3 predictions (Table 6). These results show the (1) increasing the connectivity between testing sites and MBP by co-testing more lines can increase the accuracy of GS and (2) that compiling phenotypic data over multiple MBPs can increase GS accuracy, a practice facilitated by a GSC.
E. There is a conundrum to be addressed. The primary benefit of a GSC is to effectively increase the size of each MBP by facilitating access to all the breeding lines of the other MBP. This benefit is only realized with accurate GS predictions between MBPs which can only be attained with connectivity of the phenotyping of the MBPs. This suggests that each MBP needs to increase their phenotyping if they continue to phenotype all of their own lines as well as lines from other MBP to attain connectivity. This is a major challenge given that an individual MBP cannot greatly increase the number of lines they phenotype. Sparse testing and the use of marker x environment interaction (MEI) in a GS model can be used to create an effective evaluation scheme that will produce connectivity and useful inter-program predictions without extensive replication of lines over all programs. Training population optimization algorithms [36,37,38] could potentially be used to identify the optimum set of lines to evaluate across the MBPs to achieve sufficient GS accuracy with fixed phenotyping resources.
Sparse testing is where alleles, not lines, are replicated over environments and facilitates testing more lines with the same phenotyping resources [39]. The performance of lines in environment where they were not tested can be predicted using GS models that includes a MEI term. Endelman et al. [39] concluded that sparse testing at early stages with GS was superior to testing all lines in all environments as it enabled sampling a broader array of lines and environments. They also concluded that GS would be cost effect if the TP size was large and consisted of related individuals, a scenario that exists within a well-designed GSC. Others have noted that that GS can be effective for selection in early-stage trials [13,40] and that GS can alter the distribution of breeding resources [33,37,39].
To increase connectivity and balance in our phenotyping, our GSC will disperse the stage-1 and stage-2 lines from each MBP among all four MBPs. Prior to the GSC, none of our stage-1 stage-2 were tested by another MBP, and less than 1% of all our breeding lines. Table 7 shows how we dispersed stage stage-1 and stage-2 lines over the four programs of the GSC for the 2020–2021 season. A total of 35% of the stage-1 and stage-2 lines are now being tested outside of their MBP of origin, and 12% are being tested by multiple MBP providing connectivity among the four MBP.
We are currently investigating different sparse-testing schemes with a goal of attaining sufficient connectivity while not significantly increasing the amount of phenotyping any one MBP must conduct. An example is shown in Table 8 assuming Breeder A normally tests 1000 lines in a stage-1 trial. Without a GSC, Breeder A will only test their own 1000 lines. In a GSC, breeder A could test 400 of their own lines and 200 lines from each of the other three MBPs Breeder A would send 600 of their stage-1 lines to the other MBP for testing. We are proposing to disperse the lines across the MBPs by families so pedigrees and alleles are replicated over MBPs. Connectivity could increase at advanced stage of testing. We envision that in stage-2 trials that some lines will be evaluated by multiple, MBPs. Our most advanced lines will still be evaluated by all MBPs in a cooperative trial that provides complete connectivity. Data from the stage-1, stage-2, and cooperative trials would be combined to make predictions.
Assessing GEI is the major rationale for uniform testing that allows estimation of both broad (stable, main effect) and local (main effect + GEI) adaptation of lines. GEI must be dealt with in sparse-testing [41]. There are two scenarios for using GS models that incorporate GEI: (1) CV1 = predicting the value of lines that have not been phenotyped in any environment and (2) CV2 = predicting the value of lines that have been tested in some environments but not others (i.e., sparse testing) [42,43,44]. The CV2 scenario is particularly applicable to our GSC where the vast majority of our lines are tested by just one MBP in their local environments in stage-1 trials. Crossa et al. [44] indicated that GEI could be used to estimate the value of lines in environments where they were not tested by using information from relatives that were tested in those environments. Burgueño et al. [42] extended this to GS models using marker data and the CV1 and CV2 testing schemes. They reported that prediction accuracy was significantly greater in the CV2 sparse testing scenario than for the CV1 scenario. This emphasizes the importance of testing related lines with shared marker alleles across environments. Sparse testing allows for estimation of main effects (broad adaption) and site-specific trait values. Lopez-Cruz et al. [45] incorporated MEI into the prediction models for wheat yield. They found that the use of MEI increased GS accuracy by up to 30% compared to models without MEI, and that GS accuracy was greater for CV2 than for CV1. Others have reported increased GS accuracy by incorporating GEI (or MEI) into prediction models for wheat [5,46,47,48] in sparse-testing trials and CV2. Studies in rye [49], maize, [50], rice [51], rubber [52], and coffee [53] also show benefits to incorporating GEI (or MEI) into GS predictions.
F. Genotyping Platforms. Applied GS requires low-cost genotyping and a GSC requires all MBP to genotype their lines with the same marker platform. High-throughput multiplexed SNP genotyping is a widely used genotyping method. Genotyping-by-sequencing (GBS) is a low-cost SNP genotyping platform that has been widely used in plant breeding [54,55,56]. With GBS target SNPs need not be identified a priori which reduces assay development cost and ascertainment bias while enabling application across a wide range of diverse populations. The disadvantages of GBS include (1) SNP calls with a greater proportion of randomly missing data for some genotypes, which must be imputed [57,58], (2) generation of markers that do not match across datasets, and (3) the bioinformatics workload for GBS can be intensive in terms of data storage, CPU usage and labor as the number of samples reach 10,000 s after many years and new samples are added each season requiring new SNP calls.
An emerging alternative to GBS protocols are pooled, multiplexed targeted sequencing assays that target specific SNPs [59,60] Commercial implementations of pooled, multiplexed sequencing technology include Illumina’s AmpliSeq (Illumina, San Diego, CA, USA), Integrated DNA Technologies’ rhAmpSeq (Integrated DNA Technologies, Coralville, IA, USA), and Diversity Array Technology’s DArTag (Diversity Array Technology, Bruce, Australia). These platforms require a significant up-front design cost but can produce more repeatable SNPs, can accurately identify heterozygotes and require less bioinformatics than GBS.
In collaboration with the USDA Eastern Regional Small Grains Genotyping Lab at North Carolina State University (https://www.ars.usda.gov/southeast-area/raleigh-nc/plant-science-research/docs/small-grains-genotyping-laboratory/main/, accessed on 2 August 2021), we are in the process of designing a pooled, multiplexed sequencing genotypic assay that will provide data on ~2500 highly polymorphic markers at a cost of ~$5–$9 per sample. The final assay will also include ~100 well-characterized markers for critical agronomic and disease-resistance traits. This will facilitate GS and marker-assisted selection in the same genotyping platform.
The targeting sequencing assays provide fewer markers that GBS. Several studies in wheat have shown that 1000–2000 markers can provide the same GS accuracy as marker sets that are 10 times larger [13,56,61]. The low cost, repeatability, identification of heterozygotes, ability to combine GS and MAS in one genotyping operation, and the lightened bioinformatics favor the use of targeting sequencing assays in a GSC.
G. Building a GSC requires careful collection, curation, and standardization of phenotypic and genotypic data from all MBP so all data is accessible to all MBP.
Recently, multiple research groups have been working on developing centralized, open-source relational databases for breeding. The Breeding Application Programming Interface (BrAPI) has been developed to implement standardized tools for interacting with breeding databases [62]. BrAPI standards have been implemented in both commercially supported breeding databases such as the Integrated Breeding Platform (https://integratedbreeding.net, accessed on 2 August 2021) and in open source projects such as Breedbase (https://breedbase.org, accessed on 2 August 2021) and Breeding4Results (https://b4r.irri.org, accessed on 2 August 2021). Currently there several large Breedbase instances supporting public breeding efforts for cassava (Manihot esculenta; https://cassavabase.org, accessed on 2 August 2021), bananas (Musa spp.; https://musabase.org, accessed on 2 August 2021), yams (Dioscorea spp.; https://yambase.org, accessed on 2 August 2021), sweet potato (Ipomoea batatas; https://sweetpotatobase.org, accessed on 2 August 2021), and Solanaceous crops (Solanaceae spp.; https://solgenomics.net, accessed on 2 August 2021). Genotyping data management software such as the Genomics Open-source Breeding Informatics Initiative Genomics Data Manager (GOBii GDM; https://gobiiproject.atlassian.net/wiki/spaces/GD/overview, accessed on 2 August 2021) and GenomicsDB (https://www.genomicsdb.org/, accessed on 2 August 2021) features efficient storage and querying of genotype data.
Any breeding database utilized by multiple breeding programs should include support for the generation and management of trial information and phenotypic data at the plot level. It should enable the management of information on accessions, locations, and genotypic data. In addition, any database solution should support the use of trait ontology systems such as the crop ontology (CO) database [63] to ensure standardization of trait measurements across MBP, as well as integration with tablet data collection programs such as the Field Book Android app [64]. Our experience has shown that transitioning to a common breeding data management system is not trivial, and resources and technical support for this transition are vital.
H. Accurate phenotypes. The foundation of all successful breeding, including GS and marker-assisted selection, is accurate phenotyping. Each member of the GSC should be able to provide reliable phenotypic data for the key traits of the GSC. The data should be filtered for outliers and assessed for validity by the MBP that generates the data. Each MBP should also be phenotyping in some environments that are relevant to other MBP.

5. Conclusions

The general success of GS and the advent of low-cost genotyping should encourage every breeder to assess how GS can be used in their program. These technologies also present opportunities to assess how individual programs can collaborate to leverage their resources in a consortium whose whole is greater than the parts. The MBP in our GSC have started on the journey to create a consortium to leverage our resources and improve or effectiveness. We have noted challenges in the areas of archiving pre-GSC data from each MBP into a common database. We have a coordinator who has been instrumental in getting the database populated so we can create the TPs needed for GS. We pooled our genotyping and received a reduced cost per sample. We have conducted analyses related to several of the key components that are required to have a successful GSC. The analyses indicate that there is a degree of genetic relationship among our programs and that a large central core of germplasm exists in our programs that can serve as TP across the programs. Analyses of past cooperative trials show that the germplasm of each MBP offers value to the others and that there is little environment-specific adaptation of one MBP’s germplasm to their own testing sites. Perhaps most importantly, our analyses indicate a need to increase the genetic connectivity among our phenotyping efforts, especially at the early stages of testing. We will develop and test various germplasm sharing and sparse-testing scenarios to develop an optimized testing scheme. We also will look to expand the GSC to include other programs.

Author Contributions

Conceptualization, C.S., J.R., B.W., C.I. and M.M.; methodology, C.S., C.I. and B.W.; formal analysis, C.S., C.I. and B.W.; data curation, C.I. and B.W.; writing—original draft preparation, C.S., C.I. and B.W.; writing—review and editing, C.S., C.I., B.W., J.R. and M.M.; supervision, C.S.; project administration, C.S.; funding acquisition, C.S., J.R. and M.M. All authors have read and agreed to the published version of the manuscript.

Funding

USDA: National Institute for Food and Agriculture: Award: 2020-67013-30874.e.

Data Availability Statement

Available upon request.

Conflicts of Interest

The authors declare no conflict of interest.

References

  1. Meuwissen, T.; Hayes, B.; Goddard, M. Prediction of total genetic value using genome-wide dense marker maps. Genetics 2001, 1574, 1819–1829. [Google Scholar] [CrossRef]
  2. Gaynor, R.; Gorjanc, G.; Bentley, A.; Ober, E.; Howell, P.; Jackson, R.; MacKay, I.; Hickey, J. A two-part strategy for using genomic selection to develop inbred lines. Crop Sci. 2017, 575, 2372–2386. [Google Scholar] [CrossRef] [Green Version]
  3. Heffner, E.; Lorenz, A.J.; Jannink, J.-L.; Sorrells, M.E. Plant breeding with genomic selection: Gain per unit of time and cost. Crop Sci. 2010, 50, 1681–1690. [Google Scholar] [CrossRef]
  4. Jannink, J.-L.; Lorenz, A.; Iwata, H. Genomic selection in plant breeding: From theory to practice. Brief. Funct. Genom. Proteom. 2010, 92, 166–177. [Google Scholar] [CrossRef] [Green Version]
  5. Ward, B.; Brown-Guedira, G.; Tyagi, P.; Kolb, F.; van Sanford, D.; Sneller, C.; Griffey, C. Multienvironment and multitrait genomic selection models in unbalanced early-generation wheat yield trials. Crop Sci. 2019, 59, 491–507. [Google Scholar] [CrossRef] [Green Version]
  6. Bradbury, P.J.; Zhang, Z.; Kroon, D.E.; Casstevens, T.M.; Ramdoss, Y.; Buckler, E.S. TASSEL: Software for Association Mapping of Complex Traits in Diverse Samples. Bioinformatics 2017, 23, 2633–2635. [Google Scholar] [CrossRef] [PubMed]
  7. Wickham, H. Ggplot2: Elegant Graphics for Data Analysis; Springer: New York, NY, USA, 2016. [Google Scholar]
  8. Weir, B.S.; Cockerham, C.C. Estimating F-Statistics for the Analysis of Population Structure. Evolution 1984, 38, 1358. [Google Scholar] [CrossRef] [PubMed]
  9. Goudet, J.; Jombart, T. hierfstat: Estimation and Tests of Hierarchical F-Statistics. Available online: https://www.r-project.org or https://github.com/jgx65/hierfstat (accessed on 2 August 2021).
  10. Bates, D.; Mächler, M.; Bolker, B.; Walker, S. Fitting Linear Mixed-Effects Models Using lme4. J. Stat. Softw. 2015, 67, 1–48. [Google Scholar] [CrossRef]
  11. Pérez-Rodríguez, P.; de los Campos, G. Genome-Wide Regression and Prediction with the BGLR Statistical Package. Genetics 2014, 198, 483–495. [Google Scholar] [CrossRef] [PubMed]
  12. Sedcole, J.R. Number of plant necessary to recover a trait. Crop Sci. 1977, 17, 667–668. [Google Scholar] [CrossRef]
  13. Borrenpohl, D.; Huang, M.; Olson, E.; Sneller, C. The value of early stage phenotyping for wheat breeding in the age of genomic selection. Appl Genet. 2020, 133, 2499–2520. [Google Scholar] [CrossRef]
  14. Habier, D.; Fernando, R.L.; Dekkers, J.C.M. The impact of genetic relationship information on genome-assisted breeding values. Genetics 2007, 1774, 2389–2397. [Google Scholar] [CrossRef] [PubMed] [Green Version]
  15. Lorenz, A.; Smith, K. Adding Genetically Distant Individuals to Training Populations Reduces Genomic Prediction Accuracy in Barley. Crop Sci. 2015, 55, 2657–2667. [Google Scholar] [CrossRef] [Green Version]
  16. Akdemir, D.; Isidro-Sánchez, J. Design of training populations for selective phenotyping in genomic prediction. Sci. Rep. 2019, 9, 446. [Google Scholar] [CrossRef]
  17. Bassi, F.M.; Bentley, A.R.; Charmet, G.; Ortiz, R.; Crossa, J. Breeding schemes for the implementation of genomic selection in wheat Triticum spp. Plant Sci. 2015, 242, 23–36. [Google Scholar] [CrossRef]
  18. Hickey, J.M.; Dreisigacker, S.; Crossa, J.; Hearne, S.; Babu, R.; Prasanna, B.M.; Grondona, M.; Zambelli, A.; Windhausen, V.S.; Mathews, K.; et al. Evaluation of genomic selection training population designs and genotyping strategies in plant breeding programs using simulation. Crop. Sci. 2014, 54, 1476–1488. [Google Scholar] [CrossRef] [Green Version]
  19. Heffner, E.; Jannink, J.L.; Sorrells, M.E. Genomic selection accuracy using multifamily Prediction models in a wheat breeding program. Plant Genome 2011, 41, 65. [Google Scholar] [CrossRef] [Green Version]
  20. Huang, M.; Cabrera, A.; Hoffstetter, A.; Griffey, C.; Van Sanford, D.; Costa, J.; McKendry, A.; Chao, S.; Sneller, C. Genomic selection for wheat traits and trait stability. Theor. Appl. Genet. 2016, 1299, 1697–1710. [Google Scholar] [CrossRef] [PubMed]
  21. Hoffstetter, A.; Cabrera, A.; Huang, M.; Sneller, C. Optimizing training population data and validation of genomic selection for economic traits in soft winter wheat. G3: Genes Genomes Genet. 2016, 69, 2919–2928. [Google Scholar] [CrossRef] [Green Version]
  22. Sarinelli, J.; Murphy, J.P.; Tyagi, P.; Holland, J.; Johnson, J.; Mergoum, M.; Mason, R.; Babar, A.; Harrison, S.; Sutton, R.; et al. Training population selection and use of fixed effects to optimize genomic predictions in a historical USA winter wheat panel. Appl. Genet. 2019, 132, 1247–1261. [Google Scholar] [CrossRef] [Green Version]
  23. Arguello-Blanco, N.; Borrenpohl, D.; Huang, M.; Sneller, C. Correlation between Genomic Estimated Breeding Values and Observed Phenotypic Values for FHB Resistance. In Proceedings of the National Fusarium Head Blight Forum, Hyatt Regency, St. Louis, MO, USA, 2–4 December 2018. [Google Scholar]
  24. Cabrera, A.; Huang, M.; Olson, E.; Brisco, B.; Kolb, F.; Brucker, E.; Krill, A.; Arruda, M.; Sorrells, M.; van Sanford, D.; et al. Preliminary Analysis of genomic selection for FHB resistance. In Proceedings of the National Fusarium Head Blight Forum, Hyatt Regency, St. Louis, MO, USA, 7–9 December 2014. [Google Scholar]
  25. Arruda, M.P.; Brown, P.J.; Lipka, A.E.; Krill, A.M.; Thurber, C.; Kolb, F.L. Genomic selection for predicting fusarium head blight resistance in a wheat breeding program. Plant Genome 2015, 8, 1–12. [Google Scholar] [CrossRef] [PubMed] [Green Version]
  26. Rutkoski, J.; Singh, R.; Huerta-Espino, J.; Bhavani, S.; Poland, J.; Jannink, J.; Sorrells, M. Genetic gain from phenotypic and genomic selection for quantitative resistance to stem rust of wheat. Plant Genome 2015, 8. [Google Scholar] [CrossRef] [PubMed] [Green Version]
  27. Heffner, E.L.; Jannink, J.-L.; Iwata, H.; Souza, E.; Sorrells, M.E. Genomic Selection Accuracy for Grain Quality Traits in Biparental Wheat Populations. Crop Sci. 2011, 51, 2597–2606. [Google Scholar] [CrossRef] [Green Version]
  28. Huang, M.; Ward, B.; Griffey, C.; van Sanford, D.; McKendry, A.; Brown-Guedira, G.; Tyagi, P.; Sneller, C. The accuracy of genomic prediction between environments and populations for soft wheat. Crop Sci. 2018, 58, 2274–2288. [Google Scholar] [CrossRef] [Green Version]
  29. Longin, C.; Mi, X.; Würschum, T. Genomic selection in wheat: Optimum allocation of test resources and comparison of breeding strategies for line and hybrid breeding. Appl. Genet. 2015, 128, 1297–1306. [Google Scholar] [CrossRef]
  30. Dawson, J.; Endleman, J.; Heslot, N.; Crossa, J.; Poland, J.; Freisigaker, S.; Manes, Y.; Sorrells, M.; Jannink, J.L. The use of unbalanced historical data for genomic selection in an international wheat breeding program. Field Crop. Res. 2013, 154, 12–22. [Google Scholar] [CrossRef] [Green Version]
  31. He, S.; Schulthess, A.; Mirdita, V.; Zhao, Y.; Korzun, V.; Bothe, R.; Ebermeyer, E.; Reif, J.; Jiang, Y. Genomic selection in a commercial winter wheat population. Theor. Appl. Genet. 2016, 1293, 641–651. [Google Scholar] [CrossRef]
  32. Michel, S.; Ametz, C.; Gungor, H.; Epure, D.; Grausgruber, H.; Loschenberger, F.; Buerstmayr, H. Genomic selection across multiple breeding cycles in applied wheat breeding. Theor. Appl. Genet. 2016, 129, 1179–1189. [Google Scholar] [CrossRef] [Green Version]
  33. Michel, S.; Ametz, C.; Gungor, H.; Akgöl, B.; Epure, D.; Grausgruber, H.; Loschenberger, F.; Buerstmayr, H. Genomic assisted selection for enhancing line breeding: Merging genomic and phenotypic selection in winter wheat breeding programs with preliminary yield trials. Theor. Appl. Genet. 2017, 1302, 363–376. [Google Scholar] [CrossRef]
  34. Tolhurst, D.; Mathews, K.; Smith, A.; Cullis, B. Genomic selection in multi-environment plant breeding trials using a factor analytic linear mixed model. J. Anim. Breed Genet. 2019, 136, 279–300. [Google Scholar] [CrossRef]
  35. Belamkar, V.; Guttieri, M.; Hussain, W.; Jarquín, D.; El-basyoni, I.; Poland, J.; Lorenz, A.; Baenziger, P.S. Genomic selection in preliminary yield trials in a winter wheat breeding program. G3: Genes Genomes Genet. 2018, 88, 2735–2747. [Google Scholar] [CrossRef] [Green Version]
  36. Rincent, R.; Laloë, D.; Nicolas, S.; Altmann, T.; Brunel, D.; Revilla, P.; Rodriguez, V.; Moreno-Gonzalez, J.; Melchinger, A.E.; Bauer, E.; et al. Maximizing the reliability of genomic selection by optimizing the calibration set of reference individuals: Comparison of methods in two diverse groups of maize inbreds Zea mays L. Genetics 2012, 1922, 715–728. [Google Scholar] [CrossRef] [Green Version]
  37. Riedelsheimer, C.; Melchinger, A.E. Optimizing the allocation of resources for genomic selection in one breeding cycle. Appl. Genet. 2013, 12611, 2835–2848. [Google Scholar] [CrossRef]
  38. Isidro, J.; Jannink, J.-L.; Akdemir, D.; Poland, J.; Heslot, N.; Sorrells, M. Training set optimization under population structure in genomic selection. Appl. Genet. 2015, 1281, 145–158. [Google Scholar] [CrossRef] [Green Version]
  39. Endelman, J.B.; Atlin, G.N.; Beyene, Y.; Semagn, K.; Zhang, X.; Sorrells, M.E.; Jannink, J.-L. Optimal design of preliminary yield trials with genome-wide markers. Crop Sci. 2014, 54, 48–59. [Google Scholar] [CrossRef] [Green Version]
  40. Zhang, X.; Perez-Rodriguez, P.; Semagn, K.; Beyene, Y.; Babu, R.; Lopez-Cruz, M.; Vincent, F.S.; Olsen, M.; Buckler, E.; Jannink, J.; et al. Genomic prediction in biparental tropical maize populations in water-stressed and well-watered environments using low-density and GBS SNPs. Heredity 2015, 114, 291–299. [Google Scholar] [CrossRef] [Green Version]
  41. Burgueno, J.; de los Campos, G.; Weigel, K.; Crossa, J. Genomic prediction of breeding values when modeling genotype x environment interaction using pedigree and dense molecular markers. Crop Sci. 2012, 52, 707–719. [Google Scholar] [CrossRef] [Green Version]
  42. de Leon, N.; Jannink, J.-L.; Edwards, J.W.; Kaeppler, S.M. Introduction to a special issue on genotype by environment interaction. Crop. Sci. 2016, 56, 2081–2089. [Google Scholar] [CrossRef] [Green Version]
  43. Xu, Y. Envirotyping for deciphering environmental impacts on crop plants. Theor. Appl. Genet. 2016, 129, 653–673. [Google Scholar] [CrossRef] [Green Version]
  44. Crossa, J.; Burgueno, J.; Cornelius, P.; McLaren, G.; Trethowan, R.; Krishnamachari, A. Modeling genotype x environment interaction using additive genetic covariances of relatives for predicting breeding values of wheat genotypes. Crop Sci. 2006, 46, 1722–1733. [Google Scholar] [CrossRef]
  45. Lopez-Cruz, M.; Crossa, J.; Bonnett, D.; Dreisigaker, S.; Poland, J.; Jannink, J.; Singh, R.; Autrique, E.; de los Campos, G. Increased prediction accuracy in wheat breeding trials using a marker x environment interaction genomic selection model. G3 2015, 5, 569–582. [Google Scholar] [CrossRef] [Green Version]
  46. Crossa, J.; de los Campos, G.; Maccaferri, M.; Tuberosa, R.; Burgueno, J.; Perez-Rodriguez, P. Extending the marker x environment interaction model for genomic-enabled prediction and genome-wide association analysis in durum wheat. Crop Sci. 2016, 56, 2193–2209. [Google Scholar] [CrossRef] [Green Version]
  47. Lado, B.; Barrios, P.; Quincke, M.; Sila, P.; Guttierrez, L. Modeling genotype x environment interaction for genomic selection with unbalanced data from a wheat breeding program. Crop Sci. 2016, 56, 2165–2179. [Google Scholar] [CrossRef] [Green Version]
  48. Cuevas, J.; Crossa, J.; Soberanis, V.; Pérez-Elizalde, S.; Pérez-Rodríguez, P.; Campos, G.D.L.; Montesinos-Lopez, O.A.; Burgueño, J. Genomic Prediction of Genotype × Environment Interaction Kernel Regression Models. Plant Genome 2016, 9, 1–20. [Google Scholar] [CrossRef] [Green Version]
  49. Bernal-Vasquez, A.-M.; Gordillo, A.; Schmidt, M.; Piepho, H.-P. Genomic prediction in early selection stages using multi-year data in a hybrid rye breeding program. BMC Genet. 2017, 51, 1–17. [Google Scholar] [CrossRef] [Green Version]
  50. Guo, Z.; Tucker, D.M.; Wang, D.; Basten, C.J.; Ersoz, E.; Briggs, W.H.; Lu, J.; Li, M.; Gay, G. Accuracy of Across-Environment Genome-Wide Prediction in Maize Nested Association Mapping Populations. G3 Genes Genomes Genet. 2013, 3, 263–272. [Google Scholar] [CrossRef] [Green Version]
  51. Ben-Hassen, M.; Bartholome, J.; Vale, G.; Cao, T.; Ahmadi, N. Genomic prediction accounting for genotype by environment interaction offers effective framework for breeding simultaneously for adaptation to an abiotic stress and performance under normal cropping conditions in rice. G3 2018, 8, 2319–2332. [Google Scholar] [CrossRef]
  52. Souza, L.M.; Francisco, F.R.; Gonçalves, P.S.; Junior, E.J.S.; Le Guen, V.; Fritsche-Neto, R.; Souza, A.P. Genomic Selection in Rubber Tree Breeding: A Comparison of Models and Methods for Managing GxE Interactions. bioRxiv 2019, 10, 1353. [Google Scholar] [CrossRef] [Green Version]
  53. Ferrao, L.; Ferrao, R.; Ferrao, M.; Francisco, A.; Garcia, A. A mixed model to multiple harvest-location trials applied to genomic prediction of Coffea canephore. Tree Genet. Genomes 2017, 13, 95. [Google Scholar] [CrossRef] [Green Version]
  54. Baird, N.A.; Etter, P.D.; Atwood, T.S.; Currey, M.C.; Shiver, A.L.; Lewis, Z.A.; Selker, E.U.; Cresko, W.A.; Johnson, E.A. Rapid SNP discovery and genetic mapping using sequenced rad markers. PLoS ONE 2008, 3, e3376. [Google Scholar] [CrossRef]
  55. Poland, J.; Endelman, J.; Dawson, J.; Rutkoski, J.; Wu, S.; Manes, Y.; Dreisigaker, S.; Crossa, J.; Sanchez-Villeda, H.; Soells, M.; et al. Genomic selection in wheat breeding using genotyping-by-sequencing. Plant Genome J. 2012, 5, 103. [Google Scholar] [CrossRef] [Green Version]
  56. Rutkoski, J.; Benson, J.; Jia, Y.; Brown-Guedira, G.; Jannink, J.; Sorrells, M. Evaluation of genomic prediction methods for fusarium head blight resistance in wheat. Plant Genome 2012, 52, 51–61. [Google Scholar] [CrossRef] [Green Version]
  57. Torkamaneh, D.; Belzile, F. Scanning and filling: Ultra-dense snp genotyping combining genotyping-by-sequencing, SNP array and whole-genome resequencing data. PLoS ONE 2015, 10, e0131533. [Google Scholar] [CrossRef] [Green Version]
  58. Campbell, N.R.; Harmon, S.A.; Narum, S.R. Genotyping-in-Thousands by sequencing (GT-seq): A cost effective SNP genotyping method based on custom amplicon sequencing. Mol. Ecol. Resour. 2015, 15, 855–867. [Google Scholar] [CrossRef]
  59. Onda, Y.; Takahagi, K.; Shimizu, M.; Inoue, K.; Mochida, K. Multiplex PCR targeted amplicon sequencing (MTA-seq): Simple, flexible, and versatile SNP genotyping by highly multiplexed pcr amplicon sequencing. Front. Plant Sci. 2018, 9, 201. [Google Scholar] [CrossRef] [Green Version]
  60. Ruff, T.M.; Marston, E.J.; Eagle, J.D.; Sthapit, S.R.; Hooker, M.A.; Skinner, D.Z.; See, D.R. Genotyping by multiplexed sequencing (GMS): A customizable platform for genomic selection. PLoS ONE 2020, 15, e0229207. [Google Scholar] [CrossRef] [PubMed]
  61. Hayes, B.J.; Visscher, P.M.; Goddard, M.E. Increased accuracy of artificial selection by using the realized relationship matrix. Genet. Res. 2009, 91, 47–60. [Google Scholar] [CrossRef] [Green Version]
  62. Selby, P.; Abbeloos, R.; Backlund, J.E.; Basterrechea Salido, M.; Bauchet, G.; Benites-Alfaro, O.E.; Birkett, C.; Calaminos, V.C.; Carceller, P.; Cornut, G.; et al. BrAPI—An application programming interface for plant breeding applications. Bioinformatics 2019, 35, 4147–4155. [Google Scholar] [CrossRef] [Green Version]
  63. Shrestha, R.; Arnaud, E.; Mauleon, R.; Senger, M.; Davenport, G.; Hancock, D.; Morrison, N.; Bruskiewich, R.; McLaren, G. Multifunctional crop trait ontology for breeders’ data: Field book, annotation, data discovery and semantic enrichment of the literature. AoB PLANTS 2010, 2010, plq008. [Google Scholar] [CrossRef]
  64. Rife, T.W.; Poland, J.A. Field book: An open-source application for field data collection on android. Crop. Sci. 2014, 54, 1624–1627. [Google Scholar] [CrossRef]
Figure 1. The probability (Pe) that at least one line in a trial of size N is acceptable as a new cultivar given that the probability of a new cultivar (Pnc) ranges from 1/2000 to 1/500.
Agronomy 11 01555 g001
Figure 2. Selection intensity with increasing population size when selecting 20 lines to be parents.
Agronomy 11 01555 g002
Figure 3. Graph of first two principal components (PC) from analysis of 6399 genetic mar17ers on 8943 winter wheat germplasm accessions from the four consortium breeding programs. Graphs along the top and right side show the distribution along the axes of accessions from the four programs.
Agronomy 11 01555 g003
Table 1. Number of lines used as training population for genomic predictions and cross-validation for each trait collected from the stage-gate trails of each breeding programs.
TraitSource of Lines
ILINKYOH
Yield121039020672834
Test Weight120439017951989
FHB Index4773772472804
Years of trials2017–20202018–20202015–20202013–2020
Table 2. Fst values among the breeding lines of four soft red winter wheat programs: IL, IN, KY, and OH.
ILINKYOH
IL 0.150.190.09
IN0.15 0.180.07
KY0.190.18 0.10
OH0.090.070.10
Table 3. Average trait values and genotype by testing program interaction (GPI) of lines evaluated in a cooperative trial conducted by breeding programs located in four states (IL, IN, KY, and OH). The results are parsed by the source of the lines and by where the lines were tested. Yield and test weight values come from analysis of the 5-State trial while the Fusarium Head Blight (FHB) values from analysis of the P+NUWWSN trials.
YieldTest WeightFHB Index
Source of LinesState of TestingAvg. (bu/ac)GPIAvg. (1 bs/bu)GPIAvg. (%)GPI
IL84.10.5560.2−0.00415.3−0.389
INIL80.90.3658.90.07224.2−0.124
KYIL77.7−0.5060.1−0.01627.40.119
OHIL80.3−0.8860.2−0.03331.70.310
ILIN84.61.0960.60.0852.50.147
ININ78.8−0.3458.70.0376.8−0.075
KYIN77.4−0.1859.4−0.0164.6−0.034
OHIN82.7−0.1258.9−0.05811.90.048
ILKY70.1−2.2056.5−0.14213.90.322
INKY75.90.3754.7−0.11920.10.379
KYKY74.50.5955.8−0.01419.40.001
OHKY76.51.0955.00.25119.6−0.560
ILOH76.40.3258.00.04117.1−0.063
INOH72.3−0.3255.8−0.00520.7−0.146
KYOH73.10.1357.00.02224.3−0.076
OHOH76.30.0256.1−0.13528.50.213
Table 4. Prediction accuracy of genomic selection for key soft red winter wheat traits. These values were obtained by cross-validation within defined training populations. The superscripts identify the associated reference.
TraitGS Prediction Accuracy
Grain Yield0.20 [19], 0.33 [20], 0.34 [20], 0.35 [13], 0.37 [20], 0.37 [5], 0.45 [21], 0.62 [22], 0.64 [23]
FHB Resistance0.37 [21], 0.39 [24], 0,47 [25], 0.49 [13], 0.49 [13], 0.52 [26], 0.61 [27], 0.62 [25]
Test Weight0.30 [13], 0.50 [20], 0.50 [28], 0.56 [19], 0.56 [23], 0.60 [5], 0.53 [22],0.66 [20]
Heading Date0.43 [29], 0.44 [27], 0.49 [29], 0.54 [5], 0.56 [20], 0.58 [20], 0.71 [23], 0.72 [13], 0.75 [20], 0.75 [19]
Height0.50 [13], 0.54 [20], 0.57 [5], 0.73 [23], 0.73 [20], 0.74 [19], 0.83 [20]
Flour Yield0.49 [20], 0.56 [28], 0.62 [21], 0.76 [19]
Flour Softness0.27 [28], 0.37 [20], 0.37 [28], 0.51 [21],
Table 5. Accuracy of genomic selection within and between each of four soft winter wheat breeding programs (IL, IN, KY, OH) for grain yield, test weight, and resistance to Fusarium Head Blight (FHB). Shaded diagonal elements are from ten-fold cross-validation accuracy of genomic selection within programs using data from just the lines and phenotyping trials of that program. Off-diagonal elements are the correlation of the observed phenotypes of lines from one program obtained from that program’s testing, with their predicted value derived from genotypic and phenotypic data from lines from another program’s testing. The phenotypic data for the training population was obtained from multiple years of trials conducted within each program.
Source of Lines and Phenotypic Data Used to Make PredictionsPredicted Populations That Contained Only Phenotypes and Lines from This Source.
TraitILINKYOH
YieldIL0.45−0.100.170.10
IN0.010.440.070.04
KY0.150.010.510.08
OH0.18−0.120.110.63
Test WeightIL0.46−0.010.260.28
IN−0.100.330.040.00
KY0.15−0.090.630.24
OH0.230.060.250.45
FHBIL0.58 0.030.270.20
IN0.130.40 0.080.05
KY0.260.090.48 0.16
OH0.310.080.270.53
FHB data from IL and IN was toxin level while KY and OH used disease index.
Table 6. Average accuracy of different types of predictions for yield and test weight using data from the 5-state trials and for FHB Index using data from the P+NUWWSN trials. A 3->1 prediction used BLUES derived from data from three programs to predict the performance of the same lines in the other program. A 1->3 prediction used BLUES derived from one program to predict the BLUES of the same lines over the other three programs. A 1->1 prediction used BLUES from one program to predict the BLUES of the same from the other program.
Type of PredictionYieldTest WeightFHB Index
3->10.310.400.51
1->30.300.460.50
1->10.220.280.43
Table 7. Distribution of stage-1 and stage-2 lines from four programs (IL, IN, KY, OH) across testing sites of the four programs for the 2020–2021 season.
Source of Lines
ILINKYOHTotal
Tested in only own program19653762886933322
Tested in other programs4273281513601266
Percentage tested in other programs17.9%46.6%34.4%34.2%27.6%
Table 8. The number of stage-1 lines tested by breeder A from each of four programs (A, B, C, and D) under a traditional non-sharing scheme and one possible sparse testing scheme used by a GSC.
Source of Lines for in Stage-1 Testing
Breeder ABreeder BBreeder CBreeder DTotal
Non-sharing10000001000
Sparse Testing4002002002001000
Publisher’s Note: MDPI stays neutral with regard to jurisdictional claims in published maps and institutional affiliations.

