Article

Quantitative Trait Locus Analysis of Microscopic Phenotypic Characteristic Data Obtained Using Optical Coherence Tomography Imaging of Rice Bacterial Leaf Blight Infection in the Field

1
Division of Plant Biosciences, School of Applied Biosciences, College of Agriculture and Life Science, Kyungpook National University, Daegu 41566, Korea
2
Coastal Agriculture Research Institute, Kyungpook National University, Daegu 41566, Korea
3
School of Electronic and Electrical Engineering, College of IT Engineering, Kyungpook National University, 80, Daehak-ro, Buk-gu, Daegu 41566, Korea
*
Authors to whom correspondence should be addressed.
These authors contributed equally to this manuscript.
Submission received: 2 August 2021 / Revised: 11 August 2021 / Accepted: 12 August 2021 / Published: 16 August 2021
(This article belongs to the Special Issue Rice Genetics: Trends and Challenges for the Future Crops Production)

Abstract

:
Rapid climate change has increased the incidence of various pests and diseases, and these threaten global food security. In particular, BLB (bacterial leaf blight) is caused by Xoo (Xanthomonas oryzae pv. oryzae) and its main characteristic is that the rice suddenly dries and withers. Recently, omics have been effectively used in agriculture. In particular, it is a key technology that can accurately diagnose diseases in the field. Until now, QTL (quantitative trait loci) mapping has been analyzed using only subjective phenotypic data by experts. However, in this study, diseases were accurately diagnosed using OCT (optical coherence tomography), and QTL mapping was performed using leaf thickness and leaf angles after Xoo inoculation. After Xoo inoculation of a 120 Cheongcheong/Nagdong double haploid (CNDH) population, QTL mapping was performed using the changing leaf angle, and OsWRKY34q1 was detected in RM811-RM14323 of chromosome 1. OsWRKY34q1 always had a higher expression level in the BLB-resistant population than in the susceptible population after Xoo inoculation. OsWRKY34q1 belongs to the WRKY family of genes. OsWRKY34q1 could be effectively used to develop BLB-resistant rice varieties in response to the current era of unpredictable climate change.

1. Introduction

Rice is currently the world’s most cultivated and stable food for over 3.5 billion people worldwide. In particular, current rice production and consumption is the highest in Asia, supplying up to 50% or more of Asians’ dietary calories [1]. The rapidly increasing population along with agricultural problems caused by global warming and increases in pesticide-resistant pests and pathogens have threatened global food security; thus, improving rice yield and breeding programs are necessary. Rice research has focused on identifying useful crop genes using molecular genetic tools and cultivating new varieties via molecular breeding strategies. Bacterial leaf blight (BLB), a disease caused by Xanthomonas oryzae pv. oryzae (Xoo), is a major problem in rice cultivation areas in Southeast Asia, including Korea [2]. The crop damage caused by Xoo varies depending on the region, weather, variety, cultivation method, time of onset, and outbreak severity and can significantly reduce the quantity and quality of rice yields. In severe cases, more than 50% reductions in rice yield have been reported [3]. Most BLB symptoms appear on the rice leaves, and the lesions inhibit photosynthesis and nutrient transport. BLB can be transmitted through water pores or mechanical wounds, affecting the entire growth period as pathogens multiply and move through individual plants and entire fields. Therefore, developing BLB resistant crop varieties is the optimal method for controlling and preventing BLB outbreaks. Pathogen-resistant genetic resources and bacterial differentiation and distribution for the development of resistant varieties have been investigated in many studies [4].
With the development of molecular biological marker technology, a high-density plant genetic map containing hundreds of markers has been constructed, and the accuracy of quantitative trait loci (QTL) mapping has been improved [5]. QTL mapping is currently most effectively used to analyze the association between genotype and phenotype [6]. In the last two decades, QTL mapping has been developed using these genetic maps and is now widely used to identify and manipulate genes associated with complex characteristics that regulate crop traits. Most useful agronomic and disaster-tolerant crop traits are controlled by many genes, and evaluating these phenotypic traits requires substantial time, labor, and financial resources [7]. QTL analysis provides rapid and accurate genetic information by searching for a specific locus of the chromosome involved in the trait. In addition, QTL analysis can identify differences in phenotypes more practically than mutation analysis, which is beneficial for detecting phenotypic traits that are regulated by natural variation and the environment [8].
Crop diseases are typically diagnosed visually by identifying damage on the leaves; however, visual inspection is difficult and time-consuming. Moreover, internal changes cannot be observed without damaging the leaves [9]. Destructive optical and microscopic imaging techniques use plant sections to observe stained cells and tissue to assess internal morphological changes [10]. Immobilizing plant sections with chemicals such as formaldehyde can damage cells and tissues. Non-destructive microscopy and medical technologies such as X-ray, positron emission tomography (PET) [11], and magnetic resonance imaging (MRI) [12] have also been used as testing methods to identify plant diseases. However, these non-destructive methods still have limitations. For example, microscopes have high resolution but limited scanning ranges and require additional histological preparation. MRI and X-ray tomography have low image resolution, making it difficult to distinguish fine features in plant samples, and PET cannot display images in real-time. Optical coherence tomography (OCT) is a biomedical imaging technology used for non-destructively observing internal defects and structures in opaque media [10]. OCT is also widely used for biomedical imaging analysis of living biological tissues. The advantages of OCT include the generation of high-resolution cross-sectional images 1–1.5 mm deep and a greater micro-resolution depth than microscopes [13]. Thus, the OCT scanning depth range is suitable for examining the internal structure of plant leaves. Moreover, OCT can be performed in real-time in the field, which is ideal for plant research applications [14]. In the past decade, OCT plant imaging analysis has been used to investigate the internal structure and morphology of various crops [15] and perform quality inspection of fruits [16] and seeds [17] in agricultural fields. OCT imaging has also been used to diagnose onion rot [14] and monitor the spread of fungal gray leaf spots on pepper leaves [9]. Furthermore, a smart agricultural plant disease detection system that uses OCT analysis to detect early stages of plant diseases and minimize yield loss has been developed recently [18].
QTL mapping of the BLB resistance gene is typically performed using subjective data, such as changes in the lesion length or phenotype after bacterial inoculation. In this study, we used swept-source (SS)-OCT for non-destructive morphological characterization of rice leaf specimens, which generates accurate and standardized data [19]. To the best of our knowledge, this is the first study to map BLB resistance genes in rice using SS-OCT technology. We measured leaf layer thickness, internal lower mid-vein angle, and leaf angle, including the external bi-directional angles between the lower epidermis layer and lower mid-vein by SS-OCT imaging to screen for BLB resistance genes. The obtained values were then used for QTL analysis. We aimed to elucidate the relationship between BLB resistance and rice leaf internal structure and then map related genes.

2. Material and Methods

2.1. Rice Materials

Cheongcheong/Nagdong double haploid (CNDH) line materials have been planted in the field at Kyungpook National University since 2010 [20]. F1 offspring obtained by crossing Cheongcheong (Indica) and Nagdong (Japonica) were cultured to double haploid, and the CNDH 120 line was developed for genetic mapping. Seeds of 120 CNDH population were disinfected using a seed disinfectant solution. After disinfection, they were soaked in darkness at 25 °C for 4 days and then sowed at Kyungpook National University. After 30 days of sowing, the seedlings were transplanted into the field, at an interval of 30 × 15 cm, and 125 plants were transplanted for each population. Field management after transplanting was performed at a fertilization rate of N-P2O5-K2O = 9-4.5-5.7 kg/10a, and cultivation was performed according to the Agricultural Science and Technology Research Standards of the Rural Development Administration.

2.2. K3 Strain Culture Media, Inoculation, and Infection Assessment

K3 was used as the pathogen inoculated with white leaf blight. The strain was stored at −80 °C using 10% sterile glycerol before use, and recovered by culturing at −80 °C for 72 h at 27 °C in peptone sucrose agar (PSA) medium before inoculation into rice. (Akhtar et al., 2008). Vitality was restored, and the pathogen was incubated in a sterilized medium at 28 °C at 130 RPM, in darkness using a solution of 8 g each of bacto nutrient broth powder in 1 L of distilled water (DW) using an autoclave. Leaf clipping was performed following the method described by Kauffman et al. (1973) [21]. The rice seedlings were inoculated 40 d after transplantation. The middle 10 plants in each row were inoculated with K3, and five leaves on each plant were inoculated. A pair of scissors was dipped into the K3 suspension and then used to cut 3–4 cm from the leaf tip. Fourteen days after the pathogenic inoculation, the infected leaf was measured using OCT. Data were generated to evaluate BLB defense-related genes using QTL analysis. According to the Rural Development Administration’s Agricultural Science and Technology Research and Analysis Standard (2003), the lesion length was classified as susceptibility, and plants with a lesion length of less than 5.0 cm were classified as susceptible.

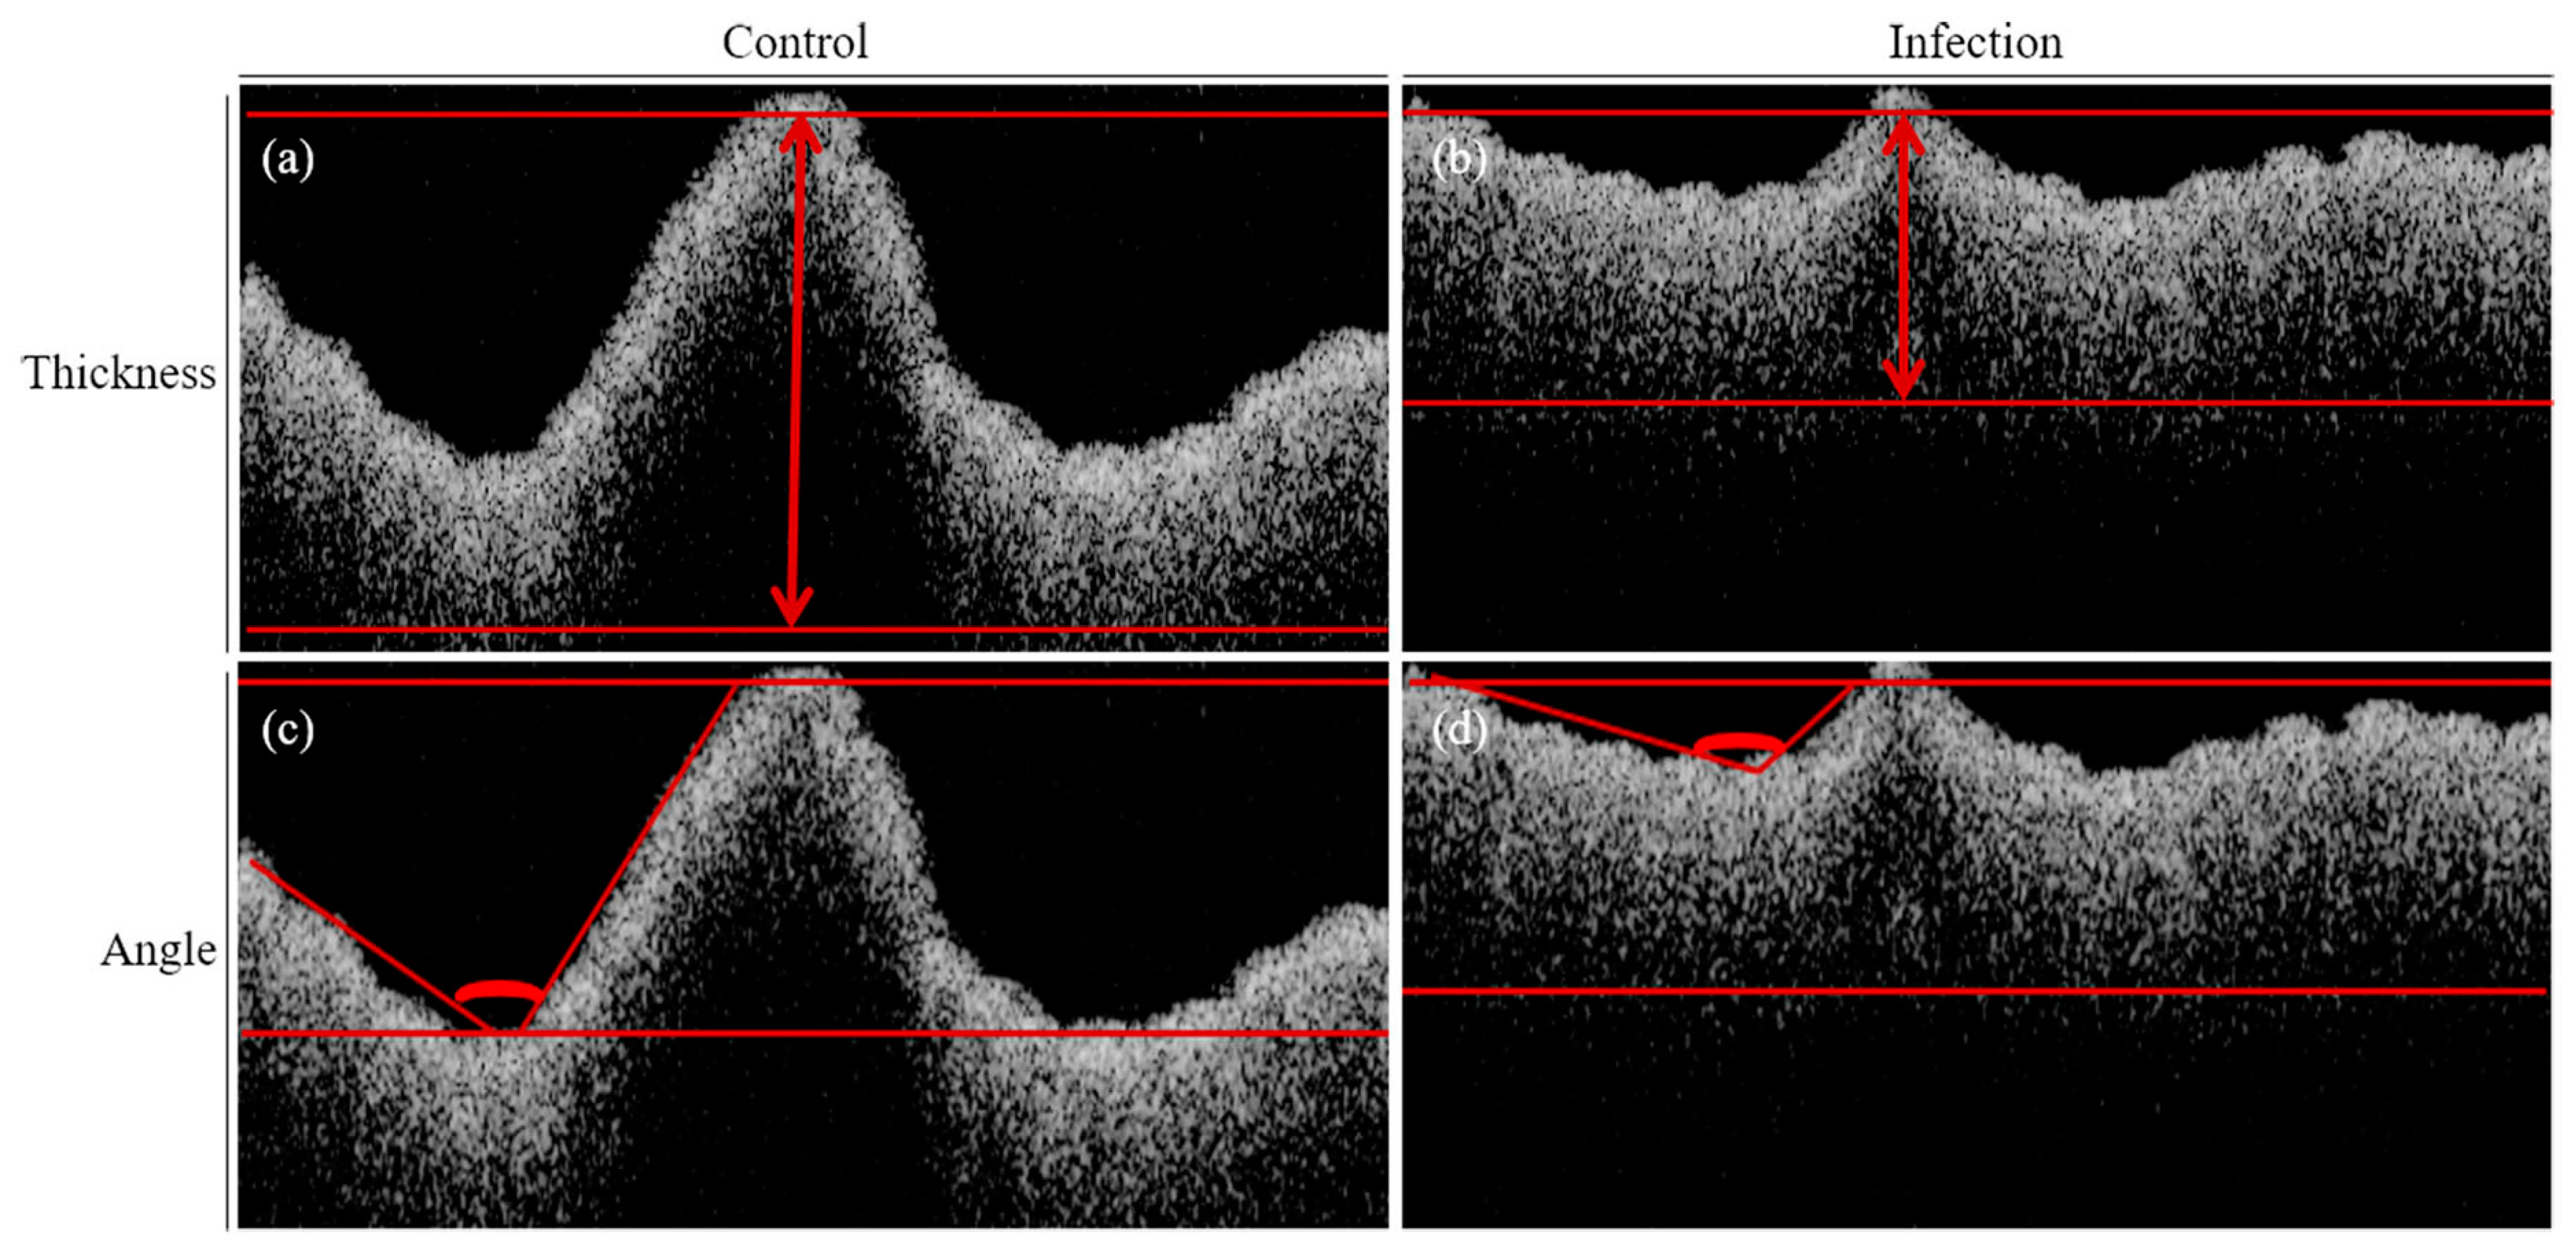
2.3. Optical Coherence Tomography (OCT) Analysis of Infected Rice Leaves

An SS-OCT system was used to scan the top, middle, and bottom of the front and back sides of the rice leaf after Xoo inoculation, and real-time scan images were obtained. Supplemental Figure S1 shows a schematic design of the SS-OCT system (OCS1310V1, Thorlabs, Inc., Newton, NJ, USA) that was utilized for rice leaf imaging. A swept-source laser engine with a center wavelength of 1310 nm and full width half maximum bandwidth of >97 nm (−10 dB cut-off point) was used in this commercially available system. The source has an average laser output power of >20 mW and a 100 kHz axial scan rate. The lateral and axial resolutions of the system are 25 µm and <16/12 µm (air/water), respectively. The sensitivity is 111 dB at zero optical-path length difference. A detailed explanation of the system specifications can be found in previous literature [22].
OCT technology was used to scan and measure the opening and closing angles of the rice leaf surface to assess the rice leaf tissue damage. We measured and analyzed the leaf thickness before and after infection and the number of opening and closing angles in the OCT scan images of all infected leaf surfaces in the CNDH population. We created distribution diagrams of the leaf thickness and the derivative distribution of the leaf opening and closing angles. These data were then used as QTL microscopic quantitative trait data in the corresponding QTL analysis [17]. Rice infection with BLB will inevitably lead to necrosis and shrinkage of the internal leaf tissues. As a result, the efficiency of rice photosynthesis and nutrient transport pipelines decline and eventually fail completely. Rice photosynthesis mainly depends on chlorophyll levels and the opening and closing angles of the rice leaf surface. Therefore, we used OCT technology to scan and measure the opening and closing angles of the rice leaf surface to assess the rice leaf tissue damage. We observed significant differences in the thickness and opening and closing angles of the inoculated and the uninoculated rice leaves.

2.4. Quantitative Trait Loci (QTL) Analysis

QTL mapping of BLB-resistant candidate regions was performed using Window QTL cartographer 2.5 (Zeng, 1994). The data for QTL mapping included the angle of the leaf analyzed using OCT technology. For the genetic map of the CNDH population, a genetic map with an average distance between markers of 10.6 cM was constructed using 222 SSR (Simple Sequence Repeats Markers) (Lander et al., 1987). The physical position of the SSR marker on the chromosome was analyzed using RAP-DB (The Rice Annotation Project Database). For OCT data analysis values, Composite Interval Mapping (CIM) was used in the Kosambi function of Window QTL cartographer 2.5. Also, the accuracy of QTL was improved by detecting only regions with a LOD score of 3.0 or higher among the mapped QTL regions (Zeng, 1994). The identified QTLs were named using the method adapted by McCough et al. (1997) [23].

2.5. Target Gene Selection and Physical Mapping

BLB resistance candidate genes were screened in the regions detected through QTL mapping. SSR marker information present in the QTL mapped region was analyzed using the Rice Annotation Project Database (RAP-DB) and Rice Expression Profile Database (Rice X Pro). All ORFs (open reading frames) existing in the detected region were searched using the analyzed SSR marker. Candidate genes related to BLB resistance were filtered out of ORFs present in the SSR marker region using the National Center for Biotechnology Information (NCBI) database.

2.6. RNA Extraction

RNA extraction from rice leaves was performed using RNeasy plant mini kits (QIAGEN, Hilden, Germany), and instructions were followed through the handbook provided with the kits. After inoculating the leaves with pathogens, the collected rice leaves were sampled at various time points (0, 1, 2, 4, 8, 16, 24, 48, and 72 h) for RNA extraction. The samples were rapidly cooled using liquid nitrogen to minimize RNA denaturation. The samples collected at each time point were immediately placed in liquid nitrogen and then manually ground using a mortar and pestle. According to the manufacturer’s instructions, the rice powder was suspended in 450 µL Buffer RLT with β-mercaptoethanol by vortexing. The lysate was transferred to a QIAshredder spin column, centrifuged at 13,000 rpm for 1 min, and then transferred into a new tube. Next, 0.5 volume of (96–100%) ethanol was added. The mixture was moved into an RNeasy spin column (pink) and centrifuged for 15 s at 10,000 rpm to allow RNA binding within the spin column, and then the residue was discarded. The column was washed by adding 700 µL Buffer RW1, and centrifuged for 1 min at 10,000 rpm. Finally, 500 µL Buffer RPE was used twice to remove any residual liquid in the spin column, followed by centrifugation at 10,000 rpm for 1 and 2 min, respectively. RNA was eluted by adding 40 µL RNase-free water into a new collection tube up to a final volume of 1.5 mL, and then the mixture was centrifuged for 2 min at 13,000 rpm.

2.7. Quantitative RT-PCR Analyses

For quantitative RT-PCR, the concentration of RNA extracted according to the manufacturer’s instructions of the RNeasy plant mini kit (QIAGEN, Germany) was analyzed using a Nano Drop 2000 spectrophotometer (Thermo Scientific, Wilmington, DE, USA). Quantitative RT-PCR was performed using Eco Real-Time PCR system (Illumina, Inc., San Diego, CA, USA). Total RNA 1 µg, 2X qPCRBIO SyGreen (www.pcrbio.com, London, UK), and the specific primers for the examined gene expression 10 pmol and DW was used to make a final volume of 20 µL. WRKY transcription factor 34 gene sequence were used for design of primer set (forward 5′-ATGGCGGCGGCGATGATTCTC-3′, reverse 5′-TCA GGCATTGCAAGTTCGAATCC-3′). Among the CNDH populations, WRKY transcription factor 34 expression levels after Xoo K3 inoculation were compared among BLB resistance lines (Nagdong, CNDH23, CNDH100, CNDH105, CNDH112) and susceptible lines (Cheongcheong, CNDH49, CNDH99, CNDH106, CNDH115). The chorismate mutase-overexpressing (OxCM) line was provided by Jan et al. (2020); OxCM is BLB resistant. The relative expression levels of WRKY transcription factor 34 were analyzed and compared among OxCM and CNDH populations. Inoculation by the K3 strain of Xoo was conducted in the field, and after inoculation, the phenotype was checked.

3. Results

Rice infection with BLB will inevitably lead to necrosis and shrinkage of the internal leaf tissues. As a result, the efficiency of rice photosynthesis and nutrient transport pipelines decline and eventually fail. Rice photosynthesis mainly depends on chlorophyll levels and the opening and closing angles of the rice leaf surface. The opening and closing angles of the rice leaf surface were scanned and measured through OCT to assess the rice leaf tissue damage. We observed significant differences in the thickness and opening and closing angles of the inoculated and the uninoculated rice leaves. Figure 1 shows the 2D cross-sectional OCT images of rice leaf. OCT was used 40 days after inoculation with Xoo, which induces BLB, in the 120 CNDH population. The adaxial and abaxial leaves were divided into three parts, top, middle, and lower, and phenotypes such as leaf thickness and angle were analyzed (Table 1). Under normal conditions without Xoo inoculation, the thicknesses of the adaxial top, middle, and lower cheongcheong were 1.97 ± 0.83 mm, 2.02 ± 0.81 mm, and 2.10 ± 0.93 mm, respectively. After Xoo inoculation, the thicknesses of the top, middle, and lower adaxial of Cheongcheong were 1.10 ± 0.81 mm, 1.14 ± 0.90 mm, and 1.13 ± 0.86 mm, respectively. In Nagdong, the thicknesses of the adaxial top, middle, and lower parts of the leaves were 1.40 ± 0.68 mm, 1.20 ± 0.69 mm, and 1.17 ± 0.92 mm, respectively, under normal conditions. However, after Xoo inoculation, the thickness of the adaxial top, middle, and lower parts of the leaves decreased to 0.68 ± 0.74 mm, 0.69 ± 0.92 mm, and 0.64 ± 0.67 mm, respectively. In the CNDH population, the thicknesses of the adaxial top, middle, and lower parts of the leaves were 0.93 ± 0.88 mm, 0.93 ± 0.88 mm, and 0.95 ± 0.90 mm, respectively, under normal conditions. After Xoo inoculation, the adaxial top, middle, and lower parts of the leaves thicknesses of the CNDH population were 0.48 ± 0.45 mm, 0.47 ± 0.45 mm, and 0.49 ± 0.46 mm, respectively. Under normal conditions of Cheongcheong, the thicknesses of abaxial top, middle, and lower parts of the leaves were 2.08 ± 0.79 mm, 2.08 ± 0.81 mm, and 2.06 ± 0.89 mm, respectively, and when Xoo was inoculated, they were 1.31 ± 0.81 mm, 1.50 ± 0.91 mm, and 1.16 ± 0.73 mm, respectively. In Nagdong, abaxial top, middle, and lower parts of the leaves thicknesses were 1.76 ± 0.79 mm, 1.38 ± 0.62 mm, 1.44 ± 0.91 mm, respectively, under normal conditions, and 0.60 ± 0.91 mm, 0.63 ± 0.84 mm, and 0.71 ± 0.69 mm when Xoo was inoculated, respectively. In the CNDH population, the abaxial top, middle, and lower parts of the leaves thicknesses were 1.04 ± 0.98 mm, 1.01 ± 0.95 mm, and 0.97 ± 0.91 mm, respectively, under normal conditions, and 0.49 ± 0.47 mm, 0.51 ± 0.50 mm, and 0.49 ± 0.46 mm when Xoo was inoculated, respectively. The angles of the top, middle, and lower cheongcheong leaves in normal conditions were 72.83 ± 0.92°, 71.90 ± 0.82°, and 106.98 ± 0.74°, respectively, and when inoculated with Xoo they were 108.06 ± 0.79°, 105.64 ± 0.81°, and 78.13 ± 0.85°, respectively. The leaf top, middle, and lower parts of the leaves angles of Nagdong were 139.0 ± 0.80°, 158.13 ± 0.93°, 158.55 ± 0.91° under normal conditions, and 151.74 ± 0.65°, 156.21 ± 0.93°, and 145.58 ± 0.91° when Xoo was inoculated. The leaf top, middle, and lower parts of the leaves angles of the CNDH population in normal conditions were 54.21 ± 51.97°, 64.93 ± 61.88°, and 71.39 ± 67.51°, respectively, and the leaf angles when inoculated with Xoo were 69.64 ± 66.08°, 67.95 ± 64.34°, and 64.60 ± 61.61°, respectively. When in normal conditions Xoo was inoculated and adaxial and abaxial leaf thickness and leaf angle were analyzed, they were all continuous variations and normally distributed (Figure 2).
When the 120 CNDH population was QTL mapped on the basis of adaxial and abaxial thickness and angle using OCT, QTLs with the LOD score of 3.0 or higher were detected on chromosomes 1, 6, 8, and 12 (Figure 3). The adaxial of BLB-infected leaves was analyzed. The qio-1t-8 was detected when using the adaxial thickness data at the top position of the adaxial. The qio-1t-8 is a region detected with the LOD score of 3.52 and an explainable phenotypic variation in RM6999-RM22334 of chromosome 8 of 36%. Also, qio-1t-8 was derived from the allele of Nagdong. When the thickness data were used at the middle position of the adaxial, qio-2t-8 was detected. The qio-2t-8 could explain the phenotypic variation with the LOD score of 4.81, 39% in RM6999-RM22334 of chromosome 8, and was derived from the allele of Nagdong. At the lower position of the adaxial, qio-3t-6 was detected. The qio-3t-6 was located in RM20158-RM217 of chromosome 6. And the LOD score of RM20158-RM217 was 2.96, 31%, which could explain the phenotypic variation, and was derived from the allele of Cheongcheong. QTLs were analyzed by dividing the abaxial thickness of BLB-infected leaves into three categories: top, middle, and lower. When QTLs of thickness were analyzed on the abaxial top, qio-1bt-1 was detected in RM8111-RM14323 of chromosome 1 and qio-1bt-8 was detected in RM22499-RM22334 of chromosome 8. The LOD score of qio-1bt-1 was 34.85, and 93% of the explainable phenotypic variation was derived from the allele of Cheongcheong. The LOD score was qio-1bt-8 was 3.86 and the explainable phenotypic variation of 36%, and it was derived from the allele of Nagdong. In the abaxial middle, qio-2bt-8 was detected. The qio-2bt-8 was detected with an LOD score of 3.48 in RM6999-RM23314 of chromosome 8, which could explain the phenotypic variation of 31%, and was derived from the allele of Nagdong. In the abaxial lower, qio-3bt-8 was detected in RM6999-RM23314 of chromosome 8. The qio-3bt-8 had the LOD score of 5.09 and an explainable phenotypic variation of 37%, derived from the allele of Nagdong. The angles of BLB-infected leaves were analyzed. Leaf angle data of the analyzed 120 CNDH population were used for QTLs mapping. When weaving leaf angle, leaves were analyzed by dividing them into three areas: top, middle, and lower. When using angle data of the top region of BLB-infected leaves, qio-1ba-8 was detected with the LOD score of 4.58 in RM22499-RM22334 of chromosome 8. The qio-1ba-8 was able to explain the phenotypic variation of 36%, and was derived from the allele of Nagdong. In the middle region, qio-2ba-8 and qio-2ba-12 were detected in RM22499-RM22334 of chromosome 8 and RM12-RM247 of chromosome 12, respectively. The LOD score of qio-2ba-8 was 3.39, 35%, which could explain the phenotypic variation, and was derived from the allele of Nagdong. The LOD score of qio-2ba-12 was 59.32, and the explainable phenotypic variation was 97%, derived from the allele of Cheongcheong. In the lower, qio-3ba-8 was detected. The qio-3ba-8 had the LOD score of 3.66 in RM6999-RM22334 of chromosome 8, 35% of the explainable phenotypic variation, and was derived from a Nagdong allele (Table 2).
A physical map was constructed focusing on regions detected with an LOD score of 3.0 or higher when QTL mapping was performed using the results of analyzing the thickness and angle of BLB-infected leaves by dividing them into abaxial and adaxial (Figure 4). Various open reading frames (ORFs) related to plant defense were screened in RM811-RM14323 of chromosome 1, RM22499-RM23314 of chromosome 8, and RM12-RM247 region of chromosome 12. 3 WRKY family genes, 5 plant defense genes, 2 hormone signaling genes, and 3 secondary metabolites genes were searched for the regions repeatedly detected with an LOD score of 3.0 or higher. In the WRKY family genes, genes related to WRKY transcription factor were detected such as Similar to WRKY transcription factor 34 gene, Similar to WRKY 1 gene, and Similar to WRKY transcription factor 10 gene. In the plant defense genes group, the Similar to Resistance gene analog PIC23 gene, Similar to Resistance protein candidate gene, Glyoxalase/bleomycin resistance protein/dioxygenase gene, Disease resistance protein family gene, Ferredoxin I gene, and chloroplast precursor gene were searched. Zinc finger gene and Similar to Fertility restorer gene were searched in the group related to hormone signaling. In the secondary metabolites group, Similar to Cytochrome P450 71C1 gene, Similar to Cytochrome P450 71C4 gene, and Cytochrome P450 family gene were searched (Table 3).
To classify the 120 CNDH population into BLB-resistant and susceptible groups, the lesion length that occurred in leaves after Xoo inoculation was analyzed (Figure 5A). And finally, Nagdong, CNDH23, CNDH100, CNDHJ105, and CNDH112, which had little or very short lesion length, were classified as resistant group, and Cheongcheong, CNDH49, CNDH99, CNDH106, and CNDH115, whose leaves were completely browned or completely withered, were classified as a susceptible group. Using these groups, the relative expression level after Xoo inoculation was analyzed. The BLB-resistant lines had a higher relative expression level than all BLB-susceptible lines from 1 h to 72 h after inoculation (Figure 5B).

4. Discussion

BLB causes serious damage not only to rice but also to various crops and is a major cause of decline in yields of major crops worldwide [24]. Xanthomonas oryzae pv. oryzae is a bacterial pest that causes BLB, and it proliferates in the xylem and phloem of the plant and interferes with the movement of nutrients and water. In the end, nutrients cannot move in plants, and leaves turn white and photosynthesis is disturbed, which is a major cause of reduction in yield and deterioration of taste. Pathogen that cause BLB continues to mutate. Therefore, research related to the current continuous tracking of races and the discovery of resistance genes corresponding to each race is essential for solving future food problems in response to current climate change. The most effective method for BLB control currently reported is to cultivate resistant varieties. However, since the causative bacteria inducing BLB have a very fast appearance of races, it is essential to develop resistant varieties using new resistance genetic resources to match their speed [25,26]. Therefore, it is essential to analyze the characteristics of the rice BLB progenitor and to analyze the various phenotypic changes of the plant in response to the pathogen inoculation to explore the resistance gene [25]. Recently, an accurate, efficient, and fast breeding system has been essential to develop high-yield varieties in response to unpredictable climate change and use them to develop rice varieties that can adapt to various climates and stressful environments. It is phenomics that makes these technologies a reality [27]. Phenomics is a key base technology for innovative development of agricultural biotechnology, and it is beneficially used for analysis of valuable gene functions of crops, molecular markers, and early selection of excellent lines for molecular breeding through phenotype-based trait evaluation [28]. In particular, image analysis for phenotyping was used in various ways to select disease-resistant varieties of plants [29,30]. Because accurate evaluation of each trait is very important to improve crop traits, it is very important to reliably and accurately determine disease resistance and specific traits in large quantities. To date, various phenotypic data have been used to map genes related to BLB resistance, but in this study, OCT was utilized for phenotyping that minimized subjective factors. The microscopic phenotype data of the rice leaf surface extracted from the OCT image results showed that the rice CNDH population was infected with BLB. Necrosis of the internal cells and tissues of the rice leaf was apparent, which reduced the rice leaf thickness. The closing angle was significantly larger in inoculated plants, demonstrating that the internal rice leaf tissue and cells were damaged by pathogens. BLB inoculation impacted basic plant functions, such as reducing the photosynthesis rate [31].
Recently, OCT has visualized important plant tissues using optical methods and has allowed the morphological and functional status of plant tissues to be evaluated in vivo [32]. This analytical method enables real-time monitoring of the morphological and functional state of the tissue in a time of 2–5 s in intact plants without removing them from the habitat [9]. In this study, QTLs related to BLB resistance were mapped using OCT. The 120 CNDH population is a population created by another culture of F1 made by crossing Cheongcheong and Nagdong. Generation has progressed in the field of Kyungpook National University since 2010, and it has a very diverse phenotype and genotype. The 120 CNDH population is currently used as an intermediate model and is also used to analyze the functions of newly discovered genes [33,34]. After inoculating the 120 CNDH population with Xoo, which induced BLB, leaf analysis was performed using OCT. When the phenotype of the 120 CNDH population after BLB inoculation was analyzed using OCT, there was a difference in leaf thickness and leaf angle between the group resistant to BLB and the group susceptible to BLB.
Leaves were classified into adaxial and abaxial, and QTLs related to BLB resistance were mapped using the data analyzed for leaf thickness and leaf angle of the 120 CNDH population after Xoo inoculation. When the normal distributions of leaf adaxial thickness, leaf abaxial thickness, and leaf abaxial angle were analyzed after Xoo inoculation of 120 CNDH populations, either the normal distribution followed or the normal distribution was skewed to the right. Following a normal distribution means that no one gene related to BLB resistance acts, but various genes interact and participate [35].
QTLs related to BLB resistance were mapped using phenotyping data using OCT. QTLs with the LOD score of 3.0 or higher were detected on chromosomes 1, 6, 8, and 12. Among them, qio-3t-6 of chromosome 6 is a region where only the thickness data of the adaxial lower region were detected, and the remaining QTLs were regions where various traits were repeatedly detected. ORFs related to resistance to various stresses, including BLB, were searched around the commonly detected region. These regions contain 23% of WRKY family genes associated with BLB resistance, 38% of plant defense genes, 15% of hormone signaling genes, and 23% of secondary metabolite genes. When plants are exposed to various stressful environments, various gene expression changes occur [36,37]. Plants are also immobile and must protect themselves from attack by various pathogens [38]. Therefore, plants have a more developed defense system than other species.
In particular, numerous genes involved in stress are regulated at the transcription level, and genes are up-regulated and down-regulated by various transcription factors including the WRKY transcription factor [39]. Plant hormones act quickly and precisely to confer resistance to stressful environments. In addition, since plants cannot move, various structures and histologies have been evolved to overcome stress, and the production of secondary metabolites is particularly important among them. Plants cannot move, and they live in the first place. Therefore, secondary metabolites that play an important function in plant resistance are as essential as primary metabolites [40]. In this study, key genes related to plant stress resistance and plant defense were detected in the regions mapped with QTLs related to BLB resistance. Therefore, it can also be used as a disease-resistance-related molecular marker centered on the detected region. We also focused on WRKY family genes among BLB resistance candidate genes searched for BLB resistance. Among these WRKY family genes, WRKY transcription factor 34 (OsWRKY34q1) was used to analyze the relative expression level using the resistant or susceptible group after Xoo inoculation.
After Xoo inoculation in the 120 CNDH population, the lesion length was analyzed and divided into resistant and susceptible groups. The relative expression level of OsWRKY34q1 was high in the resistant group, and there was no difference in the sequence of OsWRKY34q1 in the resistant and susceptible group (data not shown). Currently, numerous QTL mappings have been attempted to discover genes associated with BLB resistance. In 2008 Piz-5, pi1, and pita associated with BLB resistance were mapped on chromosomes 6, 11, and 12, respectively [41]. In 2000, BLB resistance-related genes were mapped for two consecutive years, and QTLs related to BLB resistance were repeatedly mapped on chromosomes 1, 2, 3, and 5 [42]. The reason why QTLs related to BLB resistance were mapped at similar locations or various other chromosomes in previous studies was because the number, size, and environmental factors of the population used in the study were different [43].
WRKY family genes are responsible for very important functions such as development stage, defense system, and signaling in plants [44]. Therefore, OsWRKY34q1 screened in this study can be effectively used to develop BLB resistant varieties. In particular, since it was phenotyping data using OCT, candidate genes related to BLB resistance have been additionally discovered using accurate and objective data. These can be used very effectively to develop key resistant varieties in response to the differentiation of existing Xoo species.

5. Conclusions

For centuries, humans have consciously domesticated animals and plants according to their needs, and the history of phenotype investigations predates those of the genotypes. In recent years, the rapid development of high-throughput sequencing technology has facilitated simple and rapid genotype analyses. However, due to the dynamics and complexity of plant phenotypes, phenotype research lags behind genotype research. Agricultural breeding to select for pathogen resistance is necessary to combat the continuous deterioration of environmental resources and the increasingly severe food crisis. However, we observed a recent bottleneck in research on macroscopic visualization traits. Thus, we developed high-throughput OCT technology to observe the microscopic traits of plants. Using micro-traits data for QTL analysis, we successfully screened out WRKY transcription factor 34, which confers resistance to BLB. Additionally, other candidate genes for related resistance in different intervals were screened out. Moreover, our QTL results showed that the target interval identified using the QTL results before and after the BLB inoculation coincided perfectly with those obtained using OCT microscopic trait data. These findings demonstrate that the application of microscopic traits is effective and accurate for QTL analysis and molecular breeding.

Supplementary Materials

The following are available online at https://0-www-mdpi-com.brum.beds.ac.uk/article/10.3390/agronomy11081630/s1, Figure S1. Schematic of the SS-OCT system. A: attenuator; C: collimator; DM: dichroic mirror; DAQ, data acquisition board; L: lens; M: mirror; OL: objective lens; PC: polarization controller; SMF: single-mode fiber [23].

Author Contributions

Conceptualization, X.-X.D. and J.-R.P.; methodology and investigation, J.-R.P., H.K., B.-J.Y., M.J.; analysis, X.-X.D. and S.A.S.; writing—original draft preparation, X.-X.D. and J.-R.P.; writing—review and editing, J.-R.P.; supervision, K.-M.K. All authors have read and agreed to the published version of the manuscript.

Funding

This research received no external funding.

Data Availability Statement

The data presented in this study are available from the authors on request.

Acknowledgments

This work was supported by the National Research Foundation of Korea Grant funded by the Korean Government (NRF-2021M3E5E6022715).

Conflicts of Interest

The authors declare no conflict of interest.

References

  1. International Rice Research Institute World Rice Statistics 2013; IRRI: Los Banos, Philippines, 2013.
  2. Shankar, K.R.; Guddanti, N. Handbook of Climate Change Adaptation; Springer: Berlin/Heidelberg, Germany, 2021. [Google Scholar] [CrossRef]
  3. Dixit, S.; Singh, U.M.; Singh, A.K.; Alam, S.; Venkateshwarlu, C.; Nachimuthu, V.V.; Yadav, S.; Abbai, R.; Selvaraj, R.; Devi, M.N.; et al. Marker Assisted Forward Breeding to Combine Multiple Biotic-Abiotic Stress Resistance/Tolerance in Rice. Rice 2020. [Google Scholar] [CrossRef] [PubMed]
  4. Jiang, N.; Yan, J.; Liang, Y.; Shi, Y.; He, Z.; Wu, Y.; Zeng, Q.; Liu, X.; Peng, J. Resistance Genes and their Interactions with Bacterial Blight/Leaf Streak Pathogens (Xanthomonas oryzae) in Rice (Oryza sativa L.)—An Updated Review. Rice 2020. [Google Scholar] [CrossRef] [Green Version]
  5. Zou, G.; Zhai, G.; Feng, Q.; Yan, S.; Wang, A.; Zhao, Q.; Shao, J.; Zhang, Z.; Zou, J.; Han, B.; et al. Identification of QTLs for eight agronomically important traits using an ultra-high-density map based on SNP. J. Exp. Bot. 2012, 63, 5451–5462. [Google Scholar] [CrossRef] [Green Version]
  6. Bustos-Korts, D.; Malosetti, M.; Chenu, K.; Chapman, S.; Boer, M.P.; Zheng, B.; Van Eeuwijk, F.A. From QTLs to Adaptation Landscapes: Using Genotype-To-Phenotype Models to Characterize G×E Over Time. Front. Plant Sci. 2019, 10, 1540. [Google Scholar] [CrossRef] [PubMed]
  7. Khahani, B.; Tavakol, E.; Shariati, V.; Fornara, F. Genome wide screening and comparative genome analysis for Meta-QTLs, ortho-MQTLs and candidate genes controlling yield and yield-related traits in rice. BMC Genom. 2020, 21, 294. [Google Scholar] [CrossRef] [PubMed] [Green Version]
  8. Smith, B.R.; Macdonald, S.J. Dissecting the genetic basis of variation in Drosophila sleep using a multiparental QTL mapping resource. Genes 2020, 11, 294. [Google Scholar] [CrossRef] [Green Version]
  9. Ravichandran, N.K.; Wijesinghe, R.E.; Shirazi, M.F.; Park, K.; Lee, S.-Y.; Jung, H.-Y.; Jeon, M.; Kim, J. In vivo monitoring on growth and spread of gray leaf spot disease in capsicum annuum leaf using spectral domain optical coherence tomography. J. Spectrosc. 2016. [Google Scholar] [CrossRef] [Green Version]
  10. Trojanowski, M.; Kraszewski, M.; Strąkowski, M.R.; Pluciński, J. Optical Coherence Tomography for nanoparticles quantitative characterization. Nanoimaging Nanospectrosc. III 2015. [Google Scholar] [CrossRef]
  11. Barreiro, P.; Zheng, C.; Sun, D.-W.; Sanchez, N.H.; Perez-Sanchez, J.; Ruiz-Cabello, J. Non-destructive seed detection in mandarins: Comparison of automatic threshold methods in FLASH and COMSPIRA MRIs. Postharvest. Biol. Technol. 2008, 47, 189–198. [Google Scholar] [CrossRef] [Green Version]
  12. Van As, H. Intact plant MRI for the study of cell water relations, membrane permeability, cell-to-cell and long distance water transport. J. Exp. Bot. 2007, 58, 743–756. [Google Scholar] [CrossRef] [Green Version]
  13. Meglinski, I.V.; Buranachai, C.; Terry, L.A. Plant photonics: Application of optical coherence tomography to monitor defects and rots in onion. Laser Phys. Lett. 2010, 7, 307–310. [Google Scholar] [CrossRef]
  14. Lee, C.; Lee, S.Y.; Jung, H.Y.; Kim, J. The application of optical coherence tomography in the diagnosis of marssonina blotch in apple leaves. J. Opt. Soc. Korea 2012, 16, 133–140. [Google Scholar] [CrossRef]
  15. Kutis, I.S.; Sapozhnikova, V.V.; Kuranov, R.V.; Kamenskii, V.A. Study of the morphological and functional state of higher plant tissues by optical coherence microscopy and optical coherence tomography. Russ. J. Plant Physiol. 2005, 52, 559–564. [Google Scholar] [CrossRef]
  16. Wijesinghe, R.E.; Lee, S.-Y.; Ravichandran, N.K.; Shirazi, M.F.; Kim, P.; Jung, H.-Y.; Jeon, M.; Kim, J. Biophotonic approach for the characterization of initial bitter-rot progression on apple specimens using optical coherence tomography assessments. Sci. Rep. 2018, 8, 15816. [Google Scholar] [CrossRef] [PubMed]
  17. Manattayil, J.K.; Ravichandran, N.K.; Wijesinghe, R.E.; Shirazi, M.F.; Lee, S.-Y.; Kim, P.; Jung, H.-Y.; Jeon, M.; Kim, J. Non-destructive classification of diversely stained capsicum annuum seed specimens of different cultivars using near-infrared imaging based optical intensity detection. Sensors 2018, 18, 2500. [Google Scholar] [CrossRef] [PubMed] [Green Version]
  18. Park, H.; Jeesook, E.; Kim, S.H. Crops Disease Diagnosing Using Image-Based Deep Learning Mechanism. In Proceedings of the 2018 International Conference on Computing and Network Communications (CoCoNet), Astana, Kazakhstan, 15–17 August 2018; pp. 23–26. [Google Scholar] [CrossRef]
  19. Shimada, Y.; Nakagawa, H.; Sadr, A.; Wada, I.; Nakajima, M.; Nikaido, T.; Otsuki, M.; Tagami, J.; Sumi, Y. Noninvasive cross-sectional imaging of proximal caries using swept-source optical coherence tomography (SS-OCT) in vivo. J. Biophotonics 2014, 7, 506–513. [Google Scholar] [CrossRef] [PubMed]
  20. Lee, G.H.; Yun, B.W.; Kim, K.M. Analysis of QTLs associated with the rice quality related gene by double haploid populations. Int. J. Genom. 2014. [Google Scholar] [CrossRef] [PubMed] [Green Version]
  21. Kauffman, H.E. An improved technique for evaluat-ing resistance of rice varieties to Xanthomonas oryzae. Plant Dis. Rep. 1973, 57, 537–541. [Google Scholar]
  22. Kim, H.; Du, X.X.; Kim, S.; Kim, P.; Wijesinghe, R.E.; Yun, B.J.; Kim, K.M.; Jeon, M.; Kim, J. Non-invasive morphological characterization of rice leaf bulliform and aerenchyma cellular regions using low coherence interferometry. Appl. Sci. 2019, 9, 2104. [Google Scholar] [CrossRef] [Green Version]
  23. McCough, S.R.; Doerge, R.W. QTL mapping in rice. Trends Genet. 1995, 11, 482–487. [Google Scholar] [CrossRef]
  24. Yasmin, S.; Zaka, A.; Imran, A.; Zahid, M.A.; Yousaf, S.; Rasul, G.; Arif, M.; Mirza, M.S. Plant growth promotion and suppression of bacterial leaf blight in rice by inoculated bacteria. PLoS ONE 2016, 11, e0160688. [Google Scholar] [CrossRef] [PubMed] [Green Version]
  25. Khan, M.A.; Naeem, M.; Iqbal, M. Breeding approaches for bacterial leaf blight resistance in rice (Oryza sativa L.), current status and future directions. Eur. J. Plant Pathol. 2014, 139, 27–37. [Google Scholar] [CrossRef]
  26. Muhammad, S.; Tahira, B.; Hafiz, U.F.; Zulqarnain, H.; Imad, N.; Abid, M.; Muhammad, A. Molecular screening of rice (Oryza sativa L.) germplasm for Xa4, xa5 and Xa21 bacterial leaf blight (BLB) resistant genes using linked marker approach. Afr. J. Biotechnol. 2016, 15, 2317–2324. [Google Scholar] [CrossRef] [Green Version]
  27. Borrill, P.; Harrington, S.A.; Uauy, C. Applying the latest advances in genomics and phenomics for trait discovery in polyploid wheat. Plant J. 2019, 97, 56–72. [Google Scholar] [CrossRef]
  28. Furbank, R.T.; Jimenez-Berni, J.A.; George-Jaeggli, B.; Potgieter, A.B.; Deery, D.M. Field crop phenomics: Enabling breeding for radiation use efficiency and biomass in cereal crops. New Phytol. 2019, 223, 1714–1727. [Google Scholar] [CrossRef] [Green Version]
  29. Bock, C.H.; Poole, G.H.; Parker, P.E.; Gottwald, T.R. Plant disease severity estimated visually, by digital photography and image analysis, and by hyperspectral imaging. CRC Crit. Rev. Plant Sci. 2010, 29, 59–107. [Google Scholar] [CrossRef]
  30. Easlon, H.M.; Bloom, A.J. Easy Leaf Area: Automated Digital Image Analysis for Rapid and Accurate Measurement of Leaf Area. Appl. Plant Sci. 2014, 2, 1400033. [Google Scholar] [CrossRef]
  31. Kumar, A.; Guha, A.; Bimolata, W.; Reddy, A.R.; Laha, G.S.; Sundaram, R.M.; Pandey, M.K.; Ghazi, I.A. Leaf gas exchange physiology in rice genotypes infected with bacterial blight: An attempt to link photosynthesis with disease severity and rice yield. Aust. J. Crop Sci. 2013, 7, 32–39. [Google Scholar]
  32. Hettinger, J.W.; De La Peña Mattozzi, M.; Myers, W.R.; Williams, M.E.; Reeves, A.; Parsons, R.L.; Haskell, R.C.; Petersen, D.C.; Wang, R.; Medford, J.I. Optical coherence microscopy. A technology for rapid, in vivo, non-destructive visualization of plants and plant cells. Plant Physiol. 2000, 123, 3–15. [Google Scholar] [CrossRef] [Green Version]
  33. Park, J.-R.; Yun, S.; Jan, R.; Kim, K.-M. Screening and Identification of Brown Planthopper Resistance Genes OsCM9 in Rice. Agronomy 2020, 10, 1865. [Google Scholar] [CrossRef]
  34. Kim, E.; Yun, S.; Park, J.; Kim, K.-M. Identification of F3H, Major Secondary Metabolite-Related Gene That Confers Resistance against Whitebacked Planthopper through QTL Mapping in Rice. Plants 2021, 10, 81. [Google Scholar] [CrossRef] [PubMed]
  35. Sulewski, P. Normal distribution with plasticizing component. Commun. Stat.-Theory Methods 2020, 1–30. [Google Scholar] [CrossRef]
  36. Javed, T.; Shabbir, R.; Ali, A.; Afzal, I.; Zaheer, U.; Gao, S.J. Transcription factors in plant stress responses: Challenges and potential for sugarcane improvement. Plants 2020, 9, 491. [Google Scholar] [CrossRef]
  37. Liu, J.; Ding, G.; Gai, Z.; Zhang, W.; Han, Y.; Li, W. Changes in the gene expression profile of Arabidopsis thaliana under chromium stress. Ecotoxicol. Environ. Saf. 2020, 193, 110302. [Google Scholar] [CrossRef] [PubMed]
  38. Bhadouriya, S.L.; Mehrotra, S.; Basantani, M.K.; Loake, G.J.; Mehrotra, R. Role of Chromatin Architecture in Plant Stress Responses: An Update. Front. Plant Sci. 2021, 11. [Google Scholar] [CrossRef] [PubMed]
  39. Meraj, T.A.; Fu, J.; Raza, M.A.; Zhu, C.; Shen, Q.; Xu, D.; Wang, Q. Transcriptional Factors Regulate Plant Stress Responses through Mediating Secondary Metabolism. Genes 2020, 11, 346. [Google Scholar] [CrossRef] [PubMed] [Green Version]
  40. Kliebenstein, D.J. Making new molecules-evolution of structures for novel metabolites in plants. Curr. Opin. Plant Biol. 2013, 16, 112–117. [Google Scholar] [CrossRef] [PubMed]
  41. Han, Q.D.; Chen, Z.W.; Deng, Y.; Lan, T.; Guan, H.Z.; Duan, Y.L.; Zhou, Y.C.; Lin, M.C.; Wu, W.R. Fine Mapping of qBlsr5a, a QTL Controlling Resistance to Bacterial Leaf Streak in Rice. Acta Agron. Sin. 2008, 34, 587–590. [Google Scholar]
  42. Tang, D.; Wu, W.; Li, W.; Lu, H.; Worland, A.J. Mapping of QTLs conferring resistrance to bacterial leaf streak in rice. Theor. Appl. Genet. 2000, 101, 286–291. [Google Scholar] [CrossRef]
  43. Xiao, J.; Li, J.; Yuan, L.; Tanksley, S.D. Identification of QTLs affecting traits of agronomic importance in a recombinant inbred population derived from a subspecific rice cross. Theor. Appl. Genet. 1996, 92, 230–244. [Google Scholar] [CrossRef] [PubMed]
  44. Wani, S.H.; Anand, S.; Singh, B.; Bohra, A.; Joshi, R. WRKY transcription factors and plant defense responses: Latest discoveries and future prospects. Plant Cell Rep. 2021. [Google Scholar] [CrossRef] [PubMed]
Figure 1. Rice leaf surface before and after inoculation causing large-scale necrosis of rice leaf tissue due to the influence of Xanthomonas oryzae pv. oryzae (Xoo), which led to thinning and atrophy of rice leaves. Because when the rice leaves are infected, the internal tissue cells are destroyed and the thickness of the leaves is thinned. The angle is increased due to Xoo infection. MV: mid-vain; LEC: lower epidermis cells. (a) Leaf thickness before Xoo infection, (b) Leaf thickness after Xoo infection, (c) Leaf angle before Xoo infection, (d) Leaf angle after Xoo infection.
Agronomy 11 01630 g001
Figure 2. The frequency of distribution of optical coherence tomography (OCT) leaf thickness and angle in the 120 Cheongcheong/Nagdong double haploid (CNDH) population. Adaxial thickness, abaxial thickness, and abaxial angle were all analyzed with normal distribution. Also, these traits are all quantitative traits, and more than one gene controls the trait. (a) Frequency of distribution of leaf thickness and leaf angle in a 120 CNDH population under normal conditions, (b) Frequency of distribution of leaf thickness and leaf angle in a 120 CNDH population under infection conditions using Xoo. C; Cheongcheong, N; Nagdong.
Agronomy 11 01630 g002
Figure 3. The chromosomal location of quantitative trait loci (QTLs) related to adaxial thickness, abaxial thickness, and abaxial angle. RM8111-RM14323 of chromosome 1, RM20158-RM217 of chromosome 6, RM22499-RM23314, RM6999-RM22334 of chromosome 8, and RM12-RM274 of chromosome 12 are regions detected with the limit of detection (LOD) score of 3.0 or higher. In particular, in the region detected on chromosome 8, all characteristics of adaxial thickness, abaxial thickness, and abaxial angle were obtained.
Agronomy 11 01630 g003
Figure 4. Physical map related to adaxial thickness, abaxial thickness, abaxial angle based on using OCT in rice. Chromosomes 1, 8, and 12 contain regions in which various traits are commonly detected. All of these areas have an LOD score of 3.0 or higher. Open reading frames (ORFs) existing in the detected region were searched, and WRKY transcription factor was screened among them.
Agronomy 11 01630 g004
Figure 5. Analysis of various phenotypes and expression level of OsWRKY34q1 after Xoo inoculation. (A) Various phenotypic changes after Xoo inoculation in BLB-resistant and susceptible groups. The resistant group showed little lesion length and no change in leaf color. However, in the sensitive group, the lesion length was long, and the leaf color turned yellowish. (B) When the relative expression level of OsWRKY34q1 was analyzed after Xoo inoculation, the relative expression level of the BLB-resistant group was higher than that of the sensitive group.
Agronomy 11 01630 g005
Table 1. Analysis of changes in adaxial thickness, abaxial thickness, and abaxial angle in Cheongcheong, Nagdong, and CNDH populations after Xoo inoculation.
TraitsParentsDH z Population
CheongcheongNagdong
ControlInfectionControlInfectionControlInfection
AdaxialThickness (mm)Top1.97 ± 0.831.10 ± 0.811.40 ± 0.680.68 ± 0.740.93 ± 0.880.48 ± 0.45
Middle2.02 ± 0.811.14 ± 0.901.20 ± 0.690.69 ± 0.920.93 ± 0.880.47 ± 0.45
Lower2.10 ± 0.931.13 ± 0.861.17 ± 0.920.64 ± 0.670.95 ± 0.900.49 ± 0.46
AbaxialThickness (mm)Top2.08 ± 0.791.31 ± 0.811.76 ± 0.790.60 ± 0.911.04 ± 0.980.49 ± 0.47
Middle2.08 ± 0.811.50 ± 0.911.38 ± 0.620.63 ± 0.841.01 ± 0.950.51 ± 0.50
Lower2.06 ± 0.891.16 ± 0.731.44 ± 0.910.71 ± 0.690.97 ± 0.910.49 ± 0.46
Angle (°)Top72.83 ± 0.92108.06 ± 0.79139.0 ± 0.80151.74 ± 0.6554.21 ± 51.9769.64 ± 66.08
Middle71.90 ± 0.82105.64 ± 0.81158.13 ± 0.93156.21 ± 0.9364.93 ± 61.8867.95 ± 64.34
Lower106.98 ± 0.7478.13 ± 0.85158.55 ± 0.91145.58 ± 0.9171.39 ± 67.5164.60 ± 61.61
z DH, double haploid.
Table 2. QTLs related to the spikelet fertility and 1000 grain weight of the Cheongcheong/Nagdong double haploid population.
CharacteristicsQTLChromosomeInterval Markers zLODAdditive Effect yR2 xIncreasing Effects w
AdaxialThicknessTopControlqco-1t-88RM22499-RM233144.85−0.380.33Nagdong
Infectionqio-1t-88RM6999-RM223343.52−0.180.36Nagdong
MiddleControlqco-2t-11RM8111-RM1432352.230.850.97Cheongcheong
qco-2t-88RM22499-RM223344.58−0.360.38Nagdong
Infectionqio-2t-88RM6999-RM223344.81−0.200.39Nagdong
LowerControlqco-3t-11RM8111-RM1432348.490.860.95Cheongcheong
qco-3t-88RM6999-RM233144.36−0.370.34Nagdong
Infectionqio-3t-6 6RM20158-RM2172.960.140.31Cheongcheong
AbaxialThicknessTopControlqco-1bt-88RM22499-RM223344.68−0.430.36Nagdong
Infectionqio-1bt-11RM8111-RM1432334.850.450.93Cheongcheong
qio-1bt-88RM22499-RM223343.86−0.190.36Nagdong
MiddleControlqco-2bt-88RM22499-RM223345.22−0.450.38Nagdong
Infectionqio-2bt-88RM6999-RM233143.48−0.190.31Nagdong
LowerControlqco-3bt-88RM6999-RM223343.18−0.340.35Nagdong
qco-3bt-1212RM12-RM24757.780.880.96Cheongcheong
Infectionqio-3bt-88RM6999-RM233145.09−0.220.37Nagdong
AngleTopControlqc0-1ba-88RM22499-RM223343.67−20.350.34Nagdong
Infectionqio-1ba-88RM22499-RM223344.58−29.360.36Nagdong
MiddleControlqco-2ba-88RM6999-RM223343.71−24.790.35Nagdong
Infectionqio-2ba-88RM22499-RM223343.39−24.640.35Nagdong
qio-2ba-1212RM12-RM24759.3262.100.97Cheongcheong
LowerControlqco-3ba-88RM6999-RM223343.66−26.070.34Nagdong
Infectionqio-3ba-88RM6999-RM223343.66−24.960.35Nagdong
z Interval markers are those within the significance threshold on each border of the quantitative trait loci (QTL) range. y Positive values of the additive effect indicate that alleles from Cheongcheong are in the direction of increasing the traits. x The proportion of evaluated phenotype variation attributable to a particular QTL was estimated by the coefficient of determination (R2). w Increased allele is the source of the allele causing an increase in the measured trait.
Table 3. Thirty four candidate genes identified between RM15749-RM15689, RM149-RM23191 markers and their ORFs.
ChromosomeMarker IntervalLocusDescription
3RM15749-RM15689Os03g0686900Glycoside hydrolase, family 13, N-terminal domain containing protein
Os03g0692000Glycosyl transferase, family 14 protein
Os03g0692500Galectin, galactose-binding lectin family protein
Os03g0693600Similar to Indole-3-acetate beta-glucosyltransferase (EC 2.4.1.121)
Os03g0693700Similar to Oxalate oxidase 1 (EC 1.2.3.4) (Germin)
Os03g0693800Similar to Oxalate oxidase 1 (EC 1.2.3.4) (Germin)
Os03g0693900Similar to Oxalate oxidase 1 (EC 1.2.3.4) (Germin)
Os03g0694000Similar to Oxalate oxidase 1 (EC 1.2.3.4) (Germin)
Os03g0695600Proteasome subunit beta type 2 (EC 3.4.25.1) (20S proteasome alpha subunit D)
Os03g0695700Similar to Chloride channel protein CLC-d (AtCLC-d)
Os03g0696300CCAAT-binding transcription factor, subunit B family protein
Os03g0698800Zinc finger, CCCH-type domain containing protein
Os03g0698900Alkaline phytoceramidase family protein
Os03g0701200Similar to Sugar-starvation induced protein (Fragment)
Os03g0702000UDP-glucuronosyl/UDP-glucosyltransferase family protein
Os03g0702500UDP-glucuronosyl/UDP-glucosyltransferase family protein
Os03g0703000Similar to Beta-glucosidase
Os03g0703100Similar to Beta-glucosidase
Os03g0703200Protein kinase-like domain containing protein
Os03g0704700Oxysterol-binding protein family protein
Os03g0706900Zinc finger, RING-type domain containing protein
Os03g0707600OsGAI
Os03g0708100Phytanoyl-CoA dioxygenase family protein
Os03g0708900Zinc finger, RanBP2-type domain containing protein
Os03g0710100Protein kinase-like domain containing protein
Os03g0710500Similar to Luminal binding protein 2 precursor (BiP2)
8RM149-RM23191Os08g0439000Phosphofructokinase family protein
Os08g0439900Mitochondrial glycoprotein family protein
Os08g0440100Similar to Temperature stress-induced lipocalin
Os08g0442300Similar to Calcineurin-like protein
Os08g0452500Auxin responsive SAUR protein family protein
Os08g0452900Non-protein coding transcript, unclassifiable transcript
Os08g0453200Dormancyauxin associated family protein
Os08g0459700Similar to Adenosine diphosphate glucose pyrophosphatase precursor
Publisher’s Note: MDPI stays neutral with regard to jurisdictional claims in published maps and institutional affiliations.

