Article

Identification of Drought Tolerance on the Main Agronomic Traits for Rice (Oryza sativa L. ssp. japonica) Germplasm in China

College of Agronomy and Biotechnology, China Agricultural University, Beijing 100193, China
*
Authors to whom correspondence should be addressed.
Submission received: 2 July 2021 / Revised: 13 August 2021 / Accepted: 16 August 2021 / Published: 30 August 2021
(This article belongs to the Special Issue Plant Responses to Stress and Environmental Stimulus)

Abstract

:
Drought is a major abiotic factor restricting rice yield; therefore, to cope with this stress, 2030 japonica rice accessions from China and other countries were evaluated in Beijing in 2017 and 2018. This was the first time six agronomic traits in the large-scale germplasm of rice under lowland and upland conditions with an augmented randomized complete block design (ARCBD) were analysed. The genotypes revealing drought resistant grade (DRG) scores of 1, 1–3, 3 and 3–5 were considered drought-tolerant and comprised 10% of the assessed germplasm. These findings were consistent with the agglomerative hierarchical cluster (AHC) analysis that classified germplasm in nine clusters. The generated clusters were further grouped in A, B, C and D classes based on the stress response. Approximately half of the genotypes with an upland ecotype were distributed in drought-resistant class A (cluster VII and VI) and moderately resistant class B (VIII and IX). The majority of the genotypes from China, Korea and Japan fall in drought-susceptible classes C and D. Genotypes of DRG 1, 1–3 and 3 belonged to the clusters VII and VI. Finally, we screened out 42 elite genotypes including seven improved upland rice lines (D78, LB37-13, NSU77, Handao 385, Handao 306, SF83 and HF6-65-119), three upland released varieties (Liaogeng 27, Hanfeng 8 and IRAT109) and three traditional lowland cultivars (Hongmaodao, Weiguo 7 and Xiaohongbandao). These genotypes might be used as priority parents in drought-tolerant rice breeding programmes and some of them could be recommended directly to farmers in water-deficient rice areas of China.

1. Introduction

Drought is a direct result of water scarcity, in particular the long-term lack of precipitation that could result in low soil moisture content, reduced crop yields, and increased water demand for irrigation (low runoff) and groundwater extraction [1]. Although China accounts for 6% of the world’s freshwater, a total volume of 2.8 × 10¹² m3 per capita water availability is just 25% of the global average and the lowest among Asian countries [2]. Rice (Oryza sativa L.), a major food crop for over half of the world’s population, is cultivated worldwide in over 95 countries, with around 90% of the world’s rice being produced and consumed in Asia, providing 35% to 60% of the dietary calories for more than 3 billion people [3]. Yet, due to industrial and urban development, declining supply because of resource depletion, pollution and population growth, water is becoming readily shorter in supply [4], and its supply for rice production is becoming limited. Therefore, there is a need for another production system for rice, especially for the areas with reduced labour resources and supply of water.
Germplasm banks are warehouses of the crop plants, and its pools characterize a large capability for resources of stress tolerance. The Institute of Crop Sciences at the Chinese Academy of Agricultural Sciences (CAAS), Beijing, China has maintained a genetic pool of rice genotypes—mostly landraces or breeding materials of Oryza sativa, Oryza glaberrima, representative species of the genus Oryza and other wild species. The future improvement of crops is based on the genetic variability from traditional varieties and concerned wild species to manage many abiotic and biotic stresses that impacted the production of rice in the whole world [5]. The vast array of rice genotypic variation in the national germplasm of China presents an outstanding prospect to identify and screen genotypes for stress adaptability and to research the genetic characteristics which allow those accessions to withstand the negative impact of stress on yield and growth of rice. To mitigate the increasing food crisis, it is imperative to recognize or cultivate rice varieties that could endure the stress of water scarcity and generate cost-effective yields. The maximum amounts of improved varieties that are cultivated in water-deficient rain-fed lowlands were grown under watered conditions and were not chosen for resistance to drought [6]. While breeding attempts for lowland, aerobic, and upland rice make considerable developments of new rice varieties for drought-prone conditions [7,8,9,10,11], more sources of drought tolerance are required to tackle reduction problems in yield under a variety of drought conditions. Additionally, yield assessment under normal environments is critical for the recognition of accessions that would be valuable for agriculturists tackling water scarcity in some years and adequate rainwater in others [6].
In the previous decade, a lot of strategies have been adopted to assess the drought resistance of crops [12,13,14]. Even utilizing transgenic methods, several genes have been found and bred for enhancing water-deficiency tolerance; yet, the majority of the research was carried out in the controlled conditions, e.g., in greenhouses [15]. Accurately and effectively examining the tolerance against drought in the rice field has turned out to be a crucial goal for breeding against drought-tolerance. For breeding resources, screening based on drought adaptive and physio-morphological traits, phenotyping is considered main tool [16,17]. Therefore, experiments were conducted to check heat and drought interactive effects during flowering and grain filling phases in divergent rice cultivars sown in the field environments [18]. Further, screening based on the sole grain yield trait turned out to be ineffective [19]; nevertheless, Torres et al. (2013) utilized the same method for screening the germplasm of 988 accessions in a trial in IRRI. Similarly, sole agglomerative hierarchical cluster (AHC) analysis resulted in poor performance due to the merging errors [20]. On the other hand, AHC proved to be reliable for the identification of drought-tolerant genotypes when the selection was made on multiple traits [21].
It is appropriate to develop a methodology to breed drought-resistant upland rice which is accurate and rapid to differentiate drought resistance among different rice cultivars displaying a good combination of important agronomic attributes cumulatively imparting to enhanced yields [22]. Normally, selection would aim at accessions with comparatively increased yields under both optimal and stressed conditions to adapt them better to climate change. Thus, it is necessary to determine the relative drought stress susceptibility (RDS) of test genotypes using AHC. For this, core yield attributes of rice are pertinent for drought identification and screening consist of the following: plant height to leaf and panicle (PHL and PHP), aboveground biomass plant−1 (ABP−1), grain yield plant−1 (GYP−1) and harvest index (HI). Days to flowering (DF) are imperative as well, while breeding for drought stress at the terminal phase as this assist drought escape [23]. This is the first time an integrated selection based on combined results from RDS, drought resistance grade (DRG) and AHC from large-scale rice germplasm under lowland and upland conditions applying augmented randomized complete block design (ARCBD) has been made. Controlled water application-based selection, with the support of RDS and AHC, presents efficient yield-based genotype screening, permitting for identification of better yielding genotypes under both stressed and watered environments.
The study aimed to uncover the genetic variability for drought resistance among miscellaneous rice accessions based on agronomic characters and to sort out improved promising lines for breeding. In this work, 2030 Oryza sativa ssp. japonica accessions from various regions of China, Japan, South Korea, the Ivory Coast and Brazil were subjected to field trials conducted to find out the drought-tolerant and -susceptible genotypes which can be used in future breeding programs, and also if a few of them can be grown directly in farmers’ field.

2. Materials and Methods

2.1. Experimental Site and Plant Material

The field trials were carried out from May to October at Shangzhuang Agricultural Research Station (40°08′13.4″ N, 116°11′06.6″ E), China Agricultural University, Beijing, China in 2017 and 2018 to identify drought-resistant genotypes. For this study, 2000 japonica rice accessions were supplied by the Institute of Crop Sciences from the Chinese Academy of Agricultural Sciences (CAAS) and the Rice Research Centre, CAU provided 30 genotypes. The evaluated germplasm was distributed among China (1900), South Korea (70), Japan (57), the Ivory Coast (2) and Brazil (1). Concerning China, the maximum number of genotypes originated from Liaoning (336), Jilin (330), Jiangsu (328) and Heilongjiang (244) (Table 1). Soil observations including weather conditions for two consecutive years of experiments are shown in Figure 1 and Table S1. Various types of genotypes were included like traditional cultivars, several exotic varieties, promising lines and released varieties with two main ecotypes of lowland and upland (Table S2).
These accessions accompanied by three control genotypes namely B1 [24] and Handao 277 [25] as tolerant controls and 297-28 as a susceptible control [24] were assessed in lowland and upland environments. The Beijing-approved upland variety, Handao 277 is widely cultivated by farmers in Huang (Yellow) and in the Huai River basins of China. From 2004 to 2019, National Upland Rice Variety Regional Trials of China utilized this genotype as a control in the same river basin areas of the country. B₁ was developed from IAPAR9 through mutation by γ-ray radiation and characterized as a semi-dwarf mutant with high drought resistance. However, 297-28 is a drought-susceptible mutant derived from Handao 297 by the same exposure to the same radiations. This mutant was characterized by slender leaves, culms, roots and more tiller plants−1 from its wild-type under lowland conditions but leaves wilt readily under drought stress, leading to a decline in yield. Agronomic traits were solely considered for the screening of drought-tolerant accessions for two years of the experiments.

2.2. Field Management

Before conducting the trials, the experimental field was levelled. The lowland and upland experiments were established under irrigated non-puddled and rain-fed conditions, respectively. Before sowing, the seeds of all germplasm were handled with the fungicide-suggested dosage. Both experiments were manually established by seeding directly into the dry soil at a depth of 2–3 cm per genotype in two shallow groves spread out at a distance of 28 cm with approximately 80 grains per genotype for lowland conditions and 25 cm spaced two rows with 100 seeds per accession for the upland conditions.
The row lengths for lowland and upland were kept 1.45 m and 0.80 m, respectively, with no specific plant-to-plant distance. The wet condition was maintained in non-stress experiments from the date of sowing until maturity by either natural rainfall or supplementary irrigation as required. General cultural procedures were performed in two trials. The applied basal fertilizers contained 48 kg·ha−1 of nitrogen (N), 120 kg·ha−1 of phosphorus pentaoxide (P₂O₅), 100 kg·ha−1 of potassium oxide (K₂O), 22.5 kg·ha−1 of zinc sulphate (ZnSO₄) and 30 kg·ha−1 of iron sulphate (FeSO₄) and were applied in both conditions. Later, at the seedling stage, nitrogen was placed in the amount of 45 kg·ha−1. Additionally, dried sheep manure was supplied at a rate of 3.75 t·ha−1 consisting of 5% N. The chemical properties of the 0 cm to 30 cm soil layer of the study site in 2017 were as follows: extracted mineral N (Nmin) 7.0 mg·kg−1, pH (H₂O) 7.7, Olsen-P 21.2 mg·kg−1, NH4OAc-K 106.1 mg and organic matter 15.2 g·kg−1 [26]. In upland experiments, unwanted plants and weeds were restricted by 2–3 times of cultural hoeing in each season, by uprooting, and along borders by spraying herbicide. According to the requirement of the experimental layout, the upland-released variety Handao 297 was utilized as a border crop, which protected the experimental area of 0.24 ha in lowland and 0.81 ha in upland conditions.

2.3. Drought Trials and Investigations in the Field

Drought experiments were carried out in upland conditions to avoid rainfall-associated water accumulation during the stress period. Under drought conditions, water was supplied only once just after sowing for the sake of germination. Even after the onset of drought, the germplasm was not irrigated again despite the severity of the stress, except for the upland condition in 2017, when it was irrigated a second time after herbicide spraying. For the lowland condition, irrigation was applied for the entire growth period to maintain a shallow layer of water on the surface and a wet state in the experimental field. Investigation of the characters was conducted at maturity just before harvesting with an exception for phenology. We investigated 28 plant and soil traits in total, including visually scored parameters (Table S3), but for selection, six core plant traits were used. For the whole experiment, the investigated traits’ detailed information is shown in Table 2. TRIME-PICO32 instrument (IMKO Micromodultechnik GmbH, Ettlingen, Germany) was utilized to record volumetric soil moisture content with a soil depth of 15 cm in three random locations of the upland field. The drought was categorized as slight, mild, moderate, severe and extremely severe based on the volumetric soil moisture content of 30% to 25%, 25% to 20%, 20% to 15%, 15% to 10% and less than 10% in the topsoil.

2.4. Large-Scale Germplasm Adjustments for Screening

Augmented randomized complete block design (ARCBD), widely used to phenotype large populations [27,28,29,30], was implemented to lowland and upland field trials. The study was amended for large-scale germplasm to manage the capital, land and resources. Under ARCBD experimental design, all the control genotypes were sown adjacently and on average, there was one control group (B1, Handao 277 and 297-28) for 127 and 120 genotypes under lowland conditions in 2017 and 2018, respectively. While under upland conditions, on average each control group was assigned to 79 and 83 genotypes in 2017 and 2018, correspondingly. The number of control groups was 26 in 2017 and 24 in 2018 for upland conditions, while there were 16 groups in total for the lowland condition in each season. In ARCBD, the number of blocks must be the same as that of control groups. For the reduction in environmental errors in these uni-replicate experiments, accessions were planted in two rows, and means were computed from measured values of traits from three selected sample genotypes−1. ABP−1, GYP−1 and HI were measured in 2018 only to adjust labour and capital. The year factor was pooled for graphical representation of population distribution for all the traits. To calculate the relative drought stress susceptibility for traits (RDST; Eq. [5]), we marked 1118 genotypes whose flowering and filling phases across both conditions in each season were not affected by the cool temperature of Beijing. Shared variation by RDST was utilized for trait statistical ranking based on SD/s2. We also compared relative drought stress susceptibility (RDS) for specific traits in both seasons, as well as in pooled situation owing to same-scaled data for all the traits.

2.5. Statistical Analysis

2.5.1. Phenotypic Data Analysis

Following the previously described procedure to minimize the effects of environmental variation [27,28,29,30], the 2 years of phenotypic data were fitted with a linear mixed model that included the effects of genotypes, conditions, years, blocks, genotypes × conditions, genotypes × years, conditions × years and genotypes × conditions × years. R version 3.6.2 [31] was run for statistical and graphical analysis of data. Further, agricolae [32] and augmentedRCBD [33] libraries were loaded to compare treatment means by Tukey’s honestly significant difference (HSD) at 5% probability. Four standard errors (SE) of the mean difference for ARCBD were calculated in the following equations:
S c = 2 M S e r
S b = 2 M S e
S v = 2 M S e 1 + 1 c  
S v c = M S e ( 1 + 1 r + 1 c + 1 r c )
Here, Sc is the dissimilarity between the control genotypes, Sb and Sv are the dissimilarities concerning evaluated genotypes in the same and different blocks, respectively, and Svc is the dissimilarity about the control and evaluated genotypes. c and r represent the number of controls and the number of blocks in the experiment. The first three SE were multiplied by q(t, v; α) to calculate Tukey’s HSD, where q was the studentized range statistic for the total number of group means (t) with degrees of freedom for error (v) at a specific significance level (α), whereas q(t, v; α) was multiplied by M S e H to compute the value of HSD for Svc and here, H‘ was the harmonic mean of the coefficients for standard errors of a difference. In our study, we used the relative drought stress susceptibility index for a particular trait (RDST) already utilized by Huang et al. (2018).
R D S T   % = T p T s T p × 100
R D S   % = 1 n i = 1 n R D S T   %
R D S T w   % = R D S T   % × w   % 100
R D S I   % = i = 1 n R D S T w   %
WTp is the performance of a particular trait in the lowland condition, Ts is the performance of a particular trait in the upland condition, RDS is the average of RDST for all the traits under investigation, n is the total number of traits and w is the weighted factor. Weighted RDS for a particular trait (RDSTw) was estimated directly from RDST by multiplying with w and then aggregated to compute the integrated relative drought stress susceptibility (RDS-I). While summing up RDST and RDSTw to RDS and RDS-I correspondingly, the respective value of DF was subtracted due to its adverse direction from the breeding point of view. RDS and RDS-I were utilized to compute drought-resistance ranking of genotypes and to obtain the drought resistance grade (DRG). RDS and RDS-I values were directly proportional to the susceptibility rate, i.e., the higher the value of RDS and RDS-I, the more susceptible was the genotype and the lower the value, the more resistant was the investigated genotype. DRG was derived by dividing the total range of phenotypic expression under RDS-I into nine defined classes that were consistent with visual score practice of standard evaluation system (SES) in rice [34]. DRG values ranged from one to nine responsible for drought resistance level, with grades “1” and “9” revealing the “strongest” and “weakest” response against stress, respectively. Descriptive and genetic variability statistics were estimated by loading augmentedRCBD library [33] in R.

2.5.2. Graphical Representation

Package ggplot2 [35] accompanied by additional packages were loaded in R software for all graphical visualization of data with the exception of the agglomerative hierarchical cluster (AHC) plot. R function cor with the Pearson method was used to calculate trait correlations, corr.test from the psych package utilized to determine p-values and the package ggcorrplot was used for its graphical interpretation. To draw AHC, we loaded dendextend and heatmaply packages in R, and for scatter graph visualization, a scales package along with the previously mentioned libraries were used. The map in this article was created using ArcGIS® software by Esri. ArcGIS® and ArcMap™ are the intellectual property of Esri and are used herein under license. For more information about Esri® software, please visit www.esri.com (accessed on 16 August 2021).

3. Results

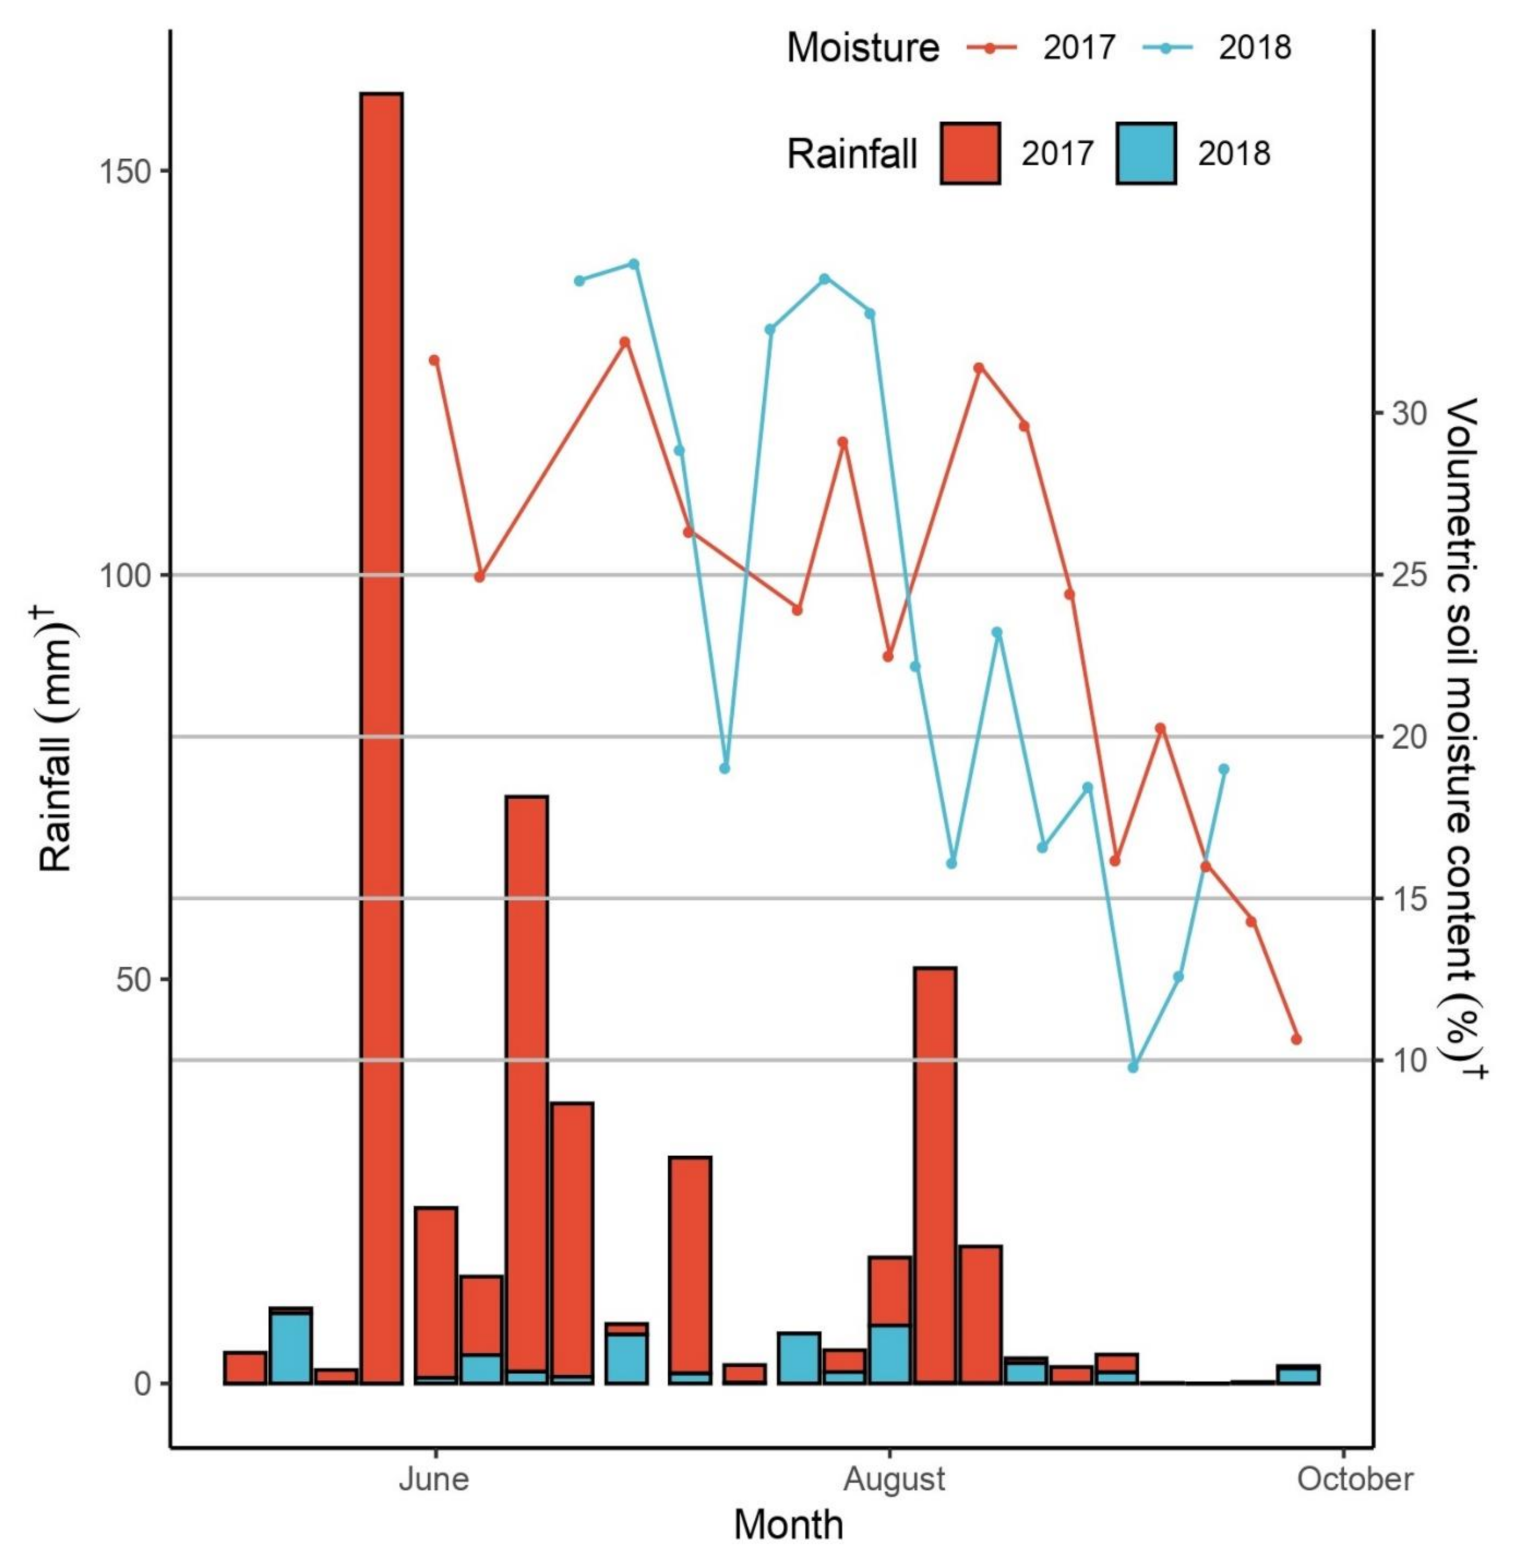
3.1. Meteorological and Soil Observations

During the rice-growing season from May to September, total rainfall in trial fields was 430.6 mm and 235.8 mm in 2017 and 2018, respectively (Figure 1).
The entire water availability to crops involving rainfall and irrigation was 565.5 mm to 595.5 mm and 310.8 mm to 340.8 mm, respectively. That water supply was lower than the required range of 750 mm to 1400 mm for aerobic rice [36]. The range of mean minimum and maximum temperatures (Tmin and Tmax) from May to October was 15.0 °C to 27.7 °C and 15.2 °C to 27.7 °C in 2017 and 2018, respectively. As a whole, in 2017, the drought stress trend under upland conditions was mild to moderate. Though a little rainfall deficit was observed at the seedling stage in May and June, the soil was not dry because the field was irrigated a second time to control weeds by application of herbicide. The drought stress from the tillering (late June) to filling phase (early September) was slight to mild as there was a 30% to 20% volumetric soil moisture content at 15 cm depth. Yet, stress became moderate to severe from mid-September to early October until harvesting (moisture decreased from 20% dropping close to 10%). However, in 2018, stress was generally moderate to severe. Seedlings in May and June suffered from drought stress caused by more than one month of high temperature without rain. Furthermore, from late August to the whole of September, volumetric soil moisture decreased from 20% to below 10% (moderate and severe drought). Only in July to August, the stress was slight to mild with moisture contents ranging from 35% to 20%.

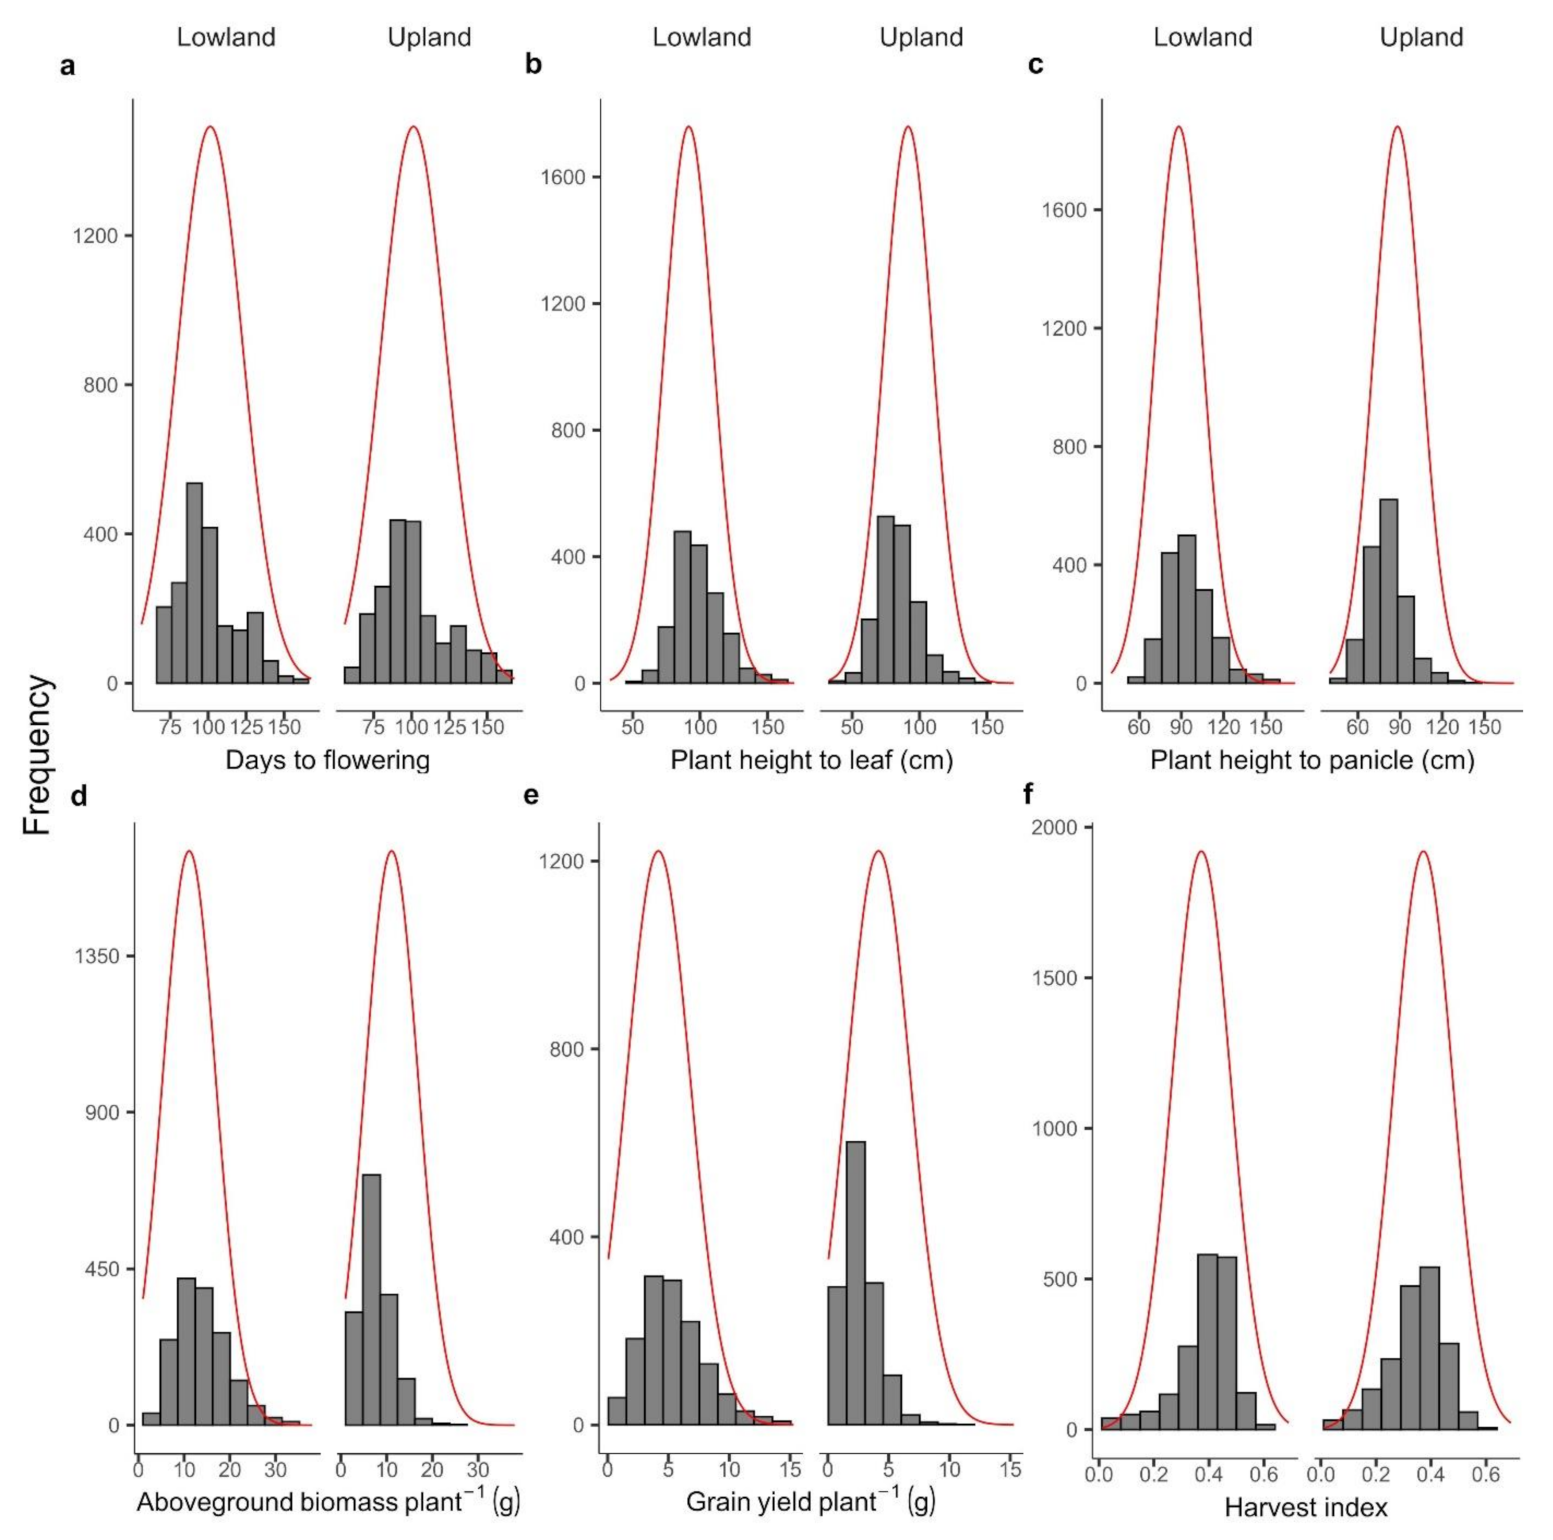
3.2. Variation of Main Agronomic Traits among Controls and Populations

Table 3 represents the abridged outcomes of the statistical assessment of the effects of genotype, condition and year for the measured traits. All the main effects exhibited significant differences excluding plant height to leaf (PHL), which was not affected by year. The mean values of days to flowering (DF) and plant height to panicle (PHP) were reduced in 2018 as compared to 2017. Genotype and year interactions expressed significance for DF, PHP and PHL. With respect to condition × year effects, those were highly significant for all the observed parameters. Interaction of genotype, condition and year affected PHP only. Table 4 shows pooled traits including DF, PHL, PHP, aboveground biomass plant−1 (ABP−1), grain yield plant−1 (GYP−1) and harvest index (HI) for genotypes and controls with post hoc mean comparison analysis (HSD) that was performed after ARCBD analysis. Entries and controls denoted significant differences among considered traits. Control 297-28 expressed higher values of DF and PHL and lower ABP−1, GYP−1 and HI in comparison with other controls under both conditions with an exception for high HI under lowland conditions while comparing to control B1. For plant height, B1 was the shortest control, whereas Handao 277, being a released upland rice cultivar, performed best in GYP−1, ABP−1 and HI. Control B1 revealed a more consistent measurement of the same trait despite being measured in lowland and upland conditions. Contrary to this, control 297-28 exhibited obvious differences for lowland and upland environments. After summarizing all assessments, Handao 277 proved to be the best control, control B1 was the runner up and 297-28 obtained the third rank regarding yield and yield attributes. While focusing on core trait for genotypes, GYP−1 in the lowland condition was 103.4% higher on average than that of the upland condition. That could be attributed to ABP−1 accumulation in the lowland condition. The HI was also significantly different between the two cultivated conditions.
Regarding population distribution, the six examined traits of germplasm depicted vast phenotypic variability as shown in Figure 2. Most of the traits revealed normal distribution to skewness and kurtosis and that was endorsed by q-q plot (Figure S1). Differences between conditions were clear in the comparative population (lowland and upland) histograms. Among the measured traits, the spread of genotypes in days to flowering skewed to earlier in lowland condition in contrast to upland condition. That was accredited to North China germplasm and traditional upland cultivars. Comparing both conditions, germplasm expressed higher plant height, dry biomass and harvest index under the lowland situation. Plant height distributed among genotypes was somewhat similar in both ecotypes with a little left skewness in the lowland environment.

3.3. Determination of Genetic Variation

A wide range of variation among the 2030 rice genotypes was observed for all the traits (Table 5). The phenotypic coefficient of variation (PCV) in 2017 and 2018 of all traits was higher than the genotypic coefficient of variation (GCV) in both trials. The PCV and GCV for all the traits recorded under drought were higher compared to lowland conditions, with some exception as GCV for PHP 2018, GYP−1 and HI and PCV for PHP 2018 and GYP−1 were higher in the lowland condition. In the upland condition, the highest PCV (49.58%) was recorded for the GYP−1 followed by ABP−1 (42.28%). The lowest PCV was recorded for PHP 2018 (16.07%) under drought stress. Similarly, the highest GCV was recorded for GYP−1 (34.52%) under the lowland situation, followed by GYP−1 (33.08%) under the upland situation. GCV ranged from 16.36% to 34.52% and 13.17% to 33.08% in lowland and upland conditions, respectively, with PHP 2018 possessing the lowest and GYP−1 possessing the highest values in drought condition. Broad sense heritability (H2) estimates showed that traits such as DF, PHL, and PHP were highly heritable for both years, but the H2 of HI was high only in lowland situation. The rest of the traits showed medium heritability. The highest H2 (95.72%) was recorded for DF 2018 in lowland condition followed by DF 2017 (94.52%), and DF 2018 (92.29%) in the upland condition.

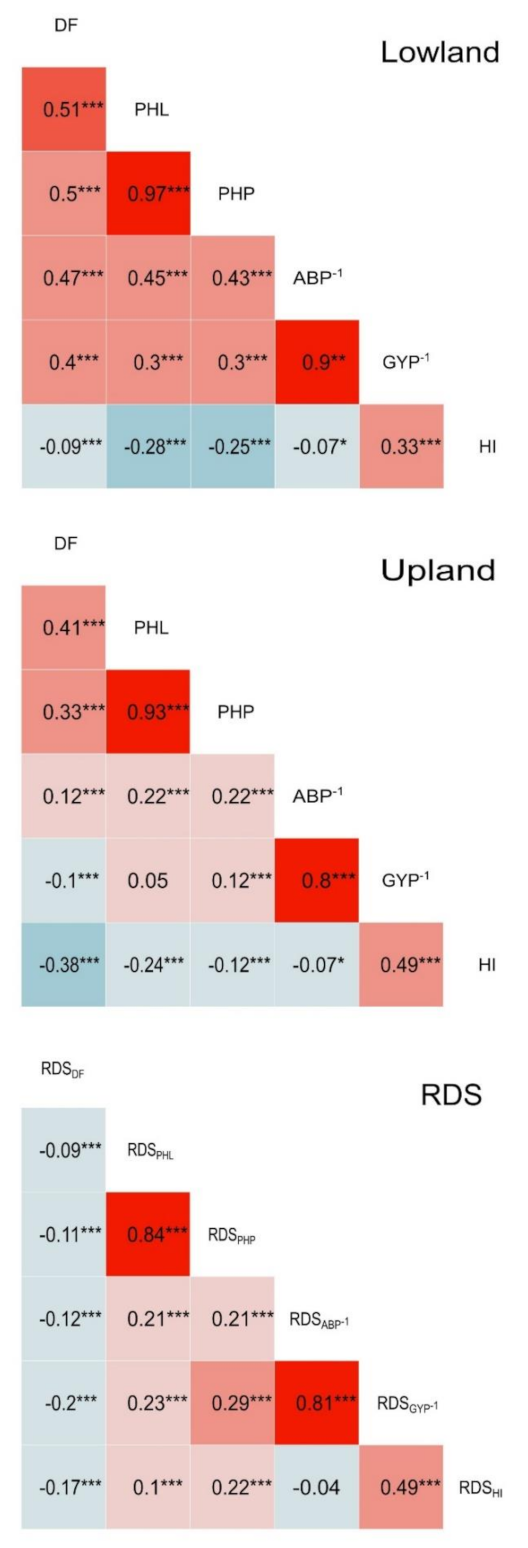
3.4. Correlational Studies of Traits in Lowland and Upland Conditions along with Their RDS Index

Traits observed in lowland and upland conditions with their respective RDS were subjected to correlational studies. To determine the association of days to flowering, plant height, dry biomass and harvest index, a correlation matrix was implemented with significance based on p-values (Figure 3). There was a mostly high significant relationship in both conditions including RDS. Lowland conditions revealed a strong association among measured traits, followed by upland conditions and RDS. Accessions that had high grain yield under lowland and upland conditions and RDS also had high ABP−1, PHP and HI. PHL showed a high correlation with PHP and DF in lowland and upland conditions, and under RDS except for its negative correlation to DF in RDS. DF, PHL, PHP and ABP−1 denoted a negative relationship with HI in both cultivated conditions indicating that less growth duration imparted better yield. Opposite to this, under RDS, higher HI is attributed to taller plant height, higher ABP−1, and earlier days to flowering.

3.5. Relative Drought Stress Susceptibility (RDS) and Drought Resistance Grade (DRG) of Genotypes

Traits under RDS were significant at the 5% level of significance from each other, except for PHL, PHP and HI so representing the same letters when applied Tukey’s honestly significant difference (HSD; Table 6). GYP−1 ranked first due to the highest difference of performance in lowland to upland (37.44%), while DF ranked last having the least value of RDS (0.21%). Then, these traits were ranked again according to their practical importance for final selection and accuracy in field condition. Pooled variation, such as variance and standard deviation for RDS, was in harmony to those of shared variation by RDS, and here GYP−1 showed maximum variability (576.29), followed by ABP−1 (509.97) and HI (361.97). On the other hand, days to flowering was accredited with the least variation (38.9). As shown in Equation (6), RDS was derived by taking an average of RDST for each trait to obtain RDS ranking for all the genotypes (Table S2). In that ranking, the North Chinese germplasm was mostly top ranked, followed by Central Chinese and South Chinese germplasms. While the trend of RDS-I ranking was somewhat similar to the RDS ranking, there were some exceptions as well. Some germplasms of RDS ranking degraded in subsequent rankings due to either less dry biomass (ABP−1 and GYP−1) or a lower plant height (PHL and PHP). Conversely, some lower-grade genotypes were upgraded because they possessed higher dry biomass or plant height. Nonetheless, on average, the germplasm distribution pattern was similar to the RDS ranking.
Drought resistance grade (DRG) was computed from RDS-I from the mean of DRG 1 being −28.92, followed by the means of DRGs 1–3 and 3 that were −18.36 and −8.81 individually (Table 7). Each DRG was distinct from each other whether they were compared by concerning means or discrete trait values of RDS-I. Tables S4 and S5 indicated that drought resistance of the majority of germplasms (73.79%) from the designated 1118 genotypes was somewhat weak, with DRG scores of 7 (weak), 5–7 (relatively weak) and 7–9 (weaker) corresponding to 29.34%, 22.36% and 22.09% of the population proportion under study.
Most of the genotypes from Yunnan and Jiangsu seemed weaker (7–9). In comparison with major “weak” type germplasms, the “strong” genotypes in the top four DRGs (1, 1–3, 3 and 3–5) were less than 10% and the number was even lower than 3% for the top three DRGs particularly. However, there were some selectable genotypes in DRG 5 (moderate) that was 12.61% of the whole population. The potential genotypes with better drought resistance were mainly from Northmost (Heilongjiang, and Jilin) and North Central China (Liaoning, Ningxia and CAU, Beijing). Remarkably, the elite genotypes in DRG 1, 1–3 and 3 were not only identified in upland rice ecotypes, but also lowland rice ecotypes. There were the top 25 genotypes (Table S2) in which we obtained four upland rice genotypes (IRAT109 with DRG 1; originated from the Ivory Coast and released in Jiangsu, Hupiheimangdao with DRG 3; a traditional cultivar in Xinjiang and two promising lines D78 and LB37-13 from CAU, Beijing with DRG 3) and 21 lowland genotypes. Concerning those lowland genotypes, nine were distributed in Heilongjiang with DRG 1 (Wunongqiyi), DRG 1–3 (Hejiang 21, Songjing 17 and Puzhan 6) and DRG 3 (Zaoshuqingsen, Longjing 4, Songzhan 1, Puxuan 10 and Hejiang 20), five originated from Jilin with DRG 1–3 (Jijing 101 and Yanjing 22) and DRG 3 (Jiudao 31, Jijing 88 and Ji 89–60), four from Liaoning with DRG 3 (Fuyou 33, Liaoxing 4, Xinyu 4 and Tiejing 5) and one of each with DRG 3 from Jiangsu (Huainuo 9702) and Yunnan (Yunjing 32). The last one was the traditional lowland cultivar Fanlongdao from Heilongjiang.

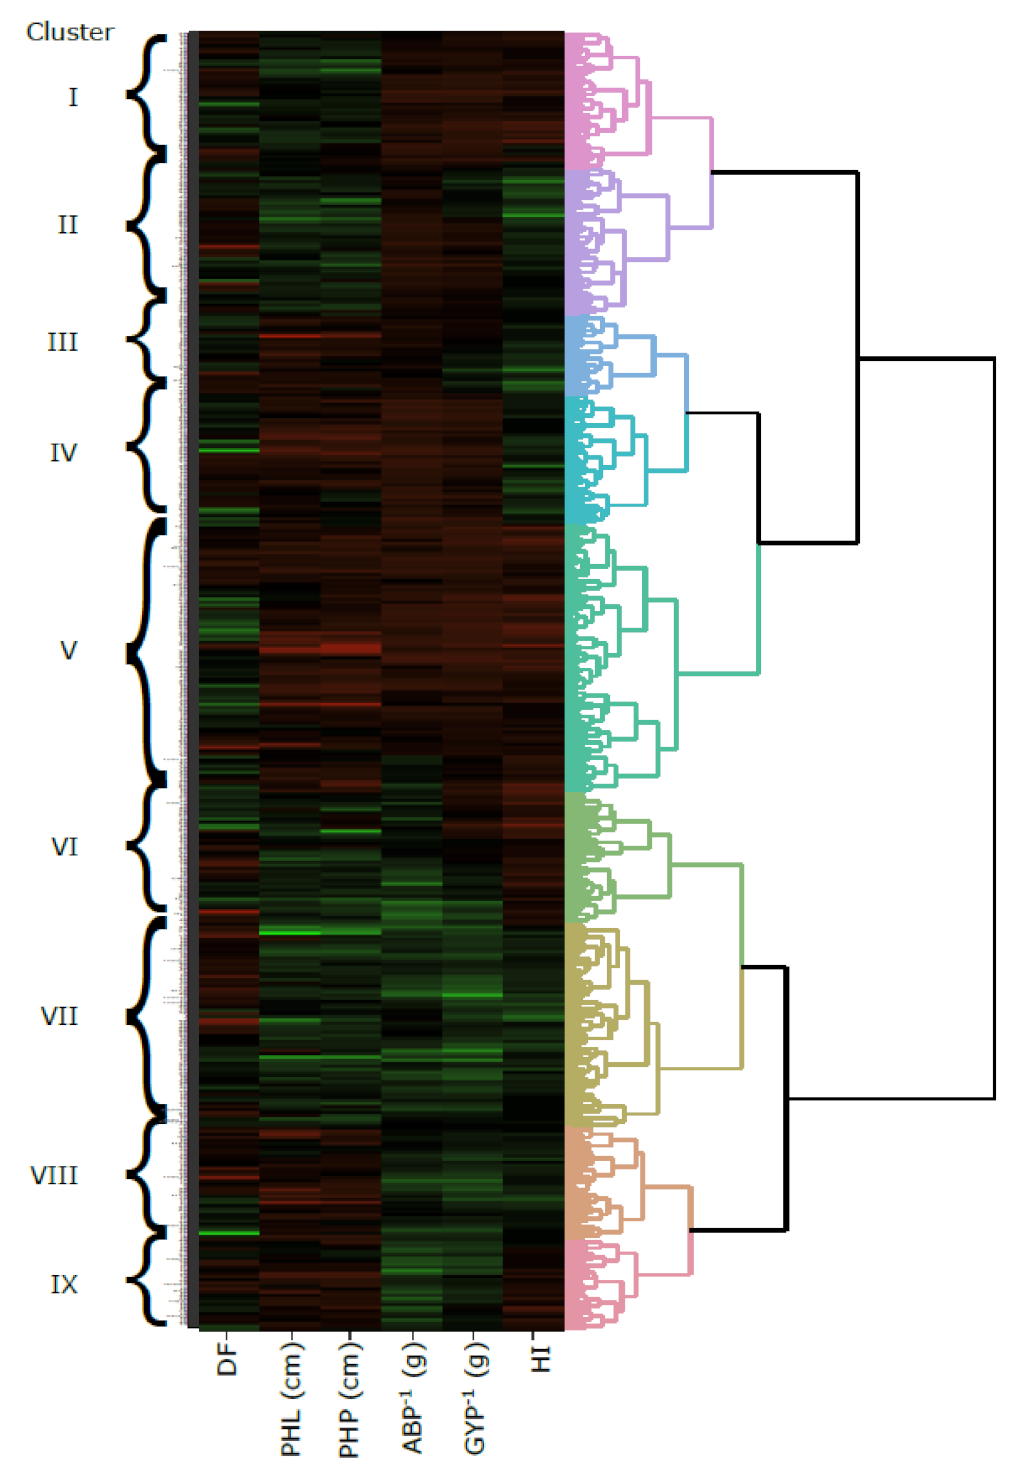
3.6. Agglomerative Hierarchical Clustering (AHC)

A distance matrix was calculated applying the “Canberra” method using RDS-I of the investigated traits, and cluster analysis was performed to identify grouping among genotypes using the “Ward.D2” [37] hierarchical agglomerative method (Figure 4 and Figure S2). The summary of this analysis is shown in Table 8, while detailed information is provided as Table S2. AHC resulted in nine clusters that were categorized subsequently in four classes, A, B, C and D, regarding drought-resistant performance. The nine clusters and four classes revealed different characteristics responsible for drought stress in different germplasms. The RDS-I of dry biomass and plant height in clusters VII (ABP−1 = 7.43, GYP−1 = 2.20, PHL = 1.76 and PHP = 0.58) and VI (ABP−1 = 6.18, GYP−1 = 5.57, PHL = 2.12 and PHP = 0.81) was lower as compared to the other seven clusters. We concatenated those two clusters in class A (drought-resistant) that possessed drought-resistant genotypes and contained all the genotypes with DRG 1 and 1–3 and the majority of genotypes from DRG 3, 3–5 and 5. On the contrary, class D consisted of clusters III, IV and V whose RDS-I of dry biomass (ABP−1; 19.44 to 26.68 and GYP−1; 5.6 to 8.87) and plant height (PHL; 6.22 to 6.42 and PHP 1.96 to 2.35) was higher in comparison with the other six clusters, and therefore attributed as a drought-susceptible class. Between class A and D, class B covered clusters VIII and IX that were just opposite to class C (clusters I and II). The RDS-I for dry biomass was lower, and that of plant height was higher in class B, hence drought resistance ranged from moderate (DRG 5) to strong (DRG 3–5 and 3), whereas RDS-I for dry biomass was higher, and that of plant height was lower in class C, which resulted in weak drought resistance among most of the genotypes in that class, with mostly DRGs 7, 5–7 and 9.
Table S2 displayed that there were different distribution proportions of genotypes in A and B in terms of regions. Half of the germplasms in those classes distributed in Northmost (Heilongjiang, Jilin, Xinjiang, and Inner Mongolia), one third in North Central (Liaoning, Ningxia, Hebei, Beijing, Shandong, Henan and Tianjin) and exotic regions (Japan and Korea), and one fourth originated from North–South and South China. It was concluded that the majority of the genotypes from China, Korea, and Japan, except for the Northeast and Northwest of China, fall into classes C and D. Table 8 and Table S4 show that the results from the analysis of AHC and DRG for genotypes were highly coherent. Further, out of 25 elite genotypes mentioned in the subheading, 3.5, 13 and 8 belonged to cluster VII and VI (class A), while 4 falls in class B. Concerning the control group, while susceptible control 297-28 was categorized in cluster V, those of resistant controls such as B1 and Handao 277 were classified in cluster VII.

3.7. Integrated Elite Genotypes Selection

By integrated screening according to the outcomes based on analysis of DRG, AHC and the performance of the six traits, particularly absolute dry biomass (ABP−1 and GYP−1) under drought stress, we achieved 42 top genotypes excluding controls from 1118 genotypes (Table S6). All the listed genotypes except Handao 277 and 297-28 exhibited a DRG of 1 to 5. The number of genotypes in DRGs with scores of 1, 1–3, 3, 3–5 and 5 were 1, 3, 6, 17 and 15, respectively. In the elite selection, 23 and 10 screened genotypes were from clusters VII and VI (class A), while there were only five and four genotypes from clusters VIII and IX (class B), respectively. Further, the means of ABP−1 and GYP−1 under the upland condition for 42 prime genotypes were 13.82 g (9.14 g to 26.47 g) and 5.32 g (3.49 g to 10.08 g) correspondingly that were noticeably higher than those of 7.28 g (1.22 g to 26.47 g) and 2.51 g (0.05 g to 10.08 g) the designated germplasm under study. There were seven improved upland rice lines (D78, LB37-13, NSU77, Handao 385, Handao 306, SF 83, and HF6-65-119 from CAU), three upland released varieties (Liaojing 27 and Hanfeng 8 from Liaoning, and IRAT109 originated from the Ivory Coast and released in Jiangsu), and three traditional lowland cultivars (Hongmaodao and Weiguo 7 form Liaoning and Xiaohongbandao from Ningxia). However, a maximum of them (29) were released breeding lowland rice varieties of which 24 were from Northmost (Heilongjiang and Jilin) and North Central (Liaoning and Ningxia) China, and the rest of them originated from Beijing, Yunnan, Korea, and Japan.
Furthermore, to visualize the relationship of grain yield to growth duration under drought stress, a scatter plot of those 45 genotypes (controls involved) was drawn (Figure 5) with yield plant−1 on x-axis and days to flowering on the y-axis. Two groups among those genotypes were marked for better yield and fewer days to flowering. IRAT109 and Ningzi 786 were elite accessions while Longjing 12, Xaiohongbandao, Ji 85-34, Hongmaodao, Yangjing 22, Jingjing 106, Liajing 27, Songjing 7, Luyu, Songjing 22, Jijing 101 and 2014H020 were attributed with better yield and shorter growth duration. Selected genotypes distinctly expressed better performance from controls particularly from B1 and 297-28. Susceptible control positioned at right bottom of the graph with more number of DF together with less GYP−1. However, there was a slightly negative relationship between DF and GYP−1 which was somewhat according to the correlation among the same traits when it was calculated for the whole germplasm.

4. Discussion

4.1. Why Field Identification?

Drought stress is considered the most important constraint in rice production in many rice-growing areas of China [38]. This calls for screening of advanced breeding lines and varieties to provide the farmers with drought-tolerant strains. For this, a single laboratory experiment was questionable and there was a need to conduct multiple stress trials to test accessions against water scarcity [39]. Therefore, 2030 accessions from various regions of China, South Korea, Japan, the Ivory Coast and Brazil were evaluated against drought. The movement behind consideration of large-scale germplasm was that it served as the foundation of a rice breeding program being the source of important traits necessary for improving and developing new breeds of rice varieties [40]. As drought traits were controlled by multiple quantitative trait loci (QTLs) [41], traits such as days to flowering (DF), plant height to leaf and panicle (PHL and PHP), aboveground biomass plant−1 (ABP−1), grain yield plant−1 (GYP−1) and harvest index (HI) were used to exhibit the mechanism of drought tolerance under field conditions, otherwise it was complex due to variations in plant phenology. The utilization of agro-morphological traits was the most common approach conducted to estimate relationships between genotypes [42]. This approach was already employed to assess diversity on ancestral lines of improved rice varieties in the Philippines [40], the indigenous rice in Yunnan, China [43] and the rice landraces in Nepal [42]. There were watered and water-stressed conditions in the field and studied traits responded differently to both conditions with the influence of all the environmental factors which could not be possible in greenhouse, growth chamber or laboratory experiments. Owing to an experiment in natural drought conditions, this would be beneficial directly for farmers, breeders, and scientists.

4.2. Augmented Randomized Complete Block Design (ARCBD) Application in Rice Phenotyping

Although augmented randomized complete block design (ARCBD) is widely used for the phenotyping of large populations under lowland and upland conditions in maize crops [27,28,29,30], in this article we report for the first time on the application of the ARCBD analysis under the same two conditions for rice germplasm phenotyping. Significant differences were observed for genotypes, conditions, years and all their possible interactions (Table 3 and Table 4), and obtained results, particularly those for controls were consistent with previous studies in the same station under randomized complete block design (RCBD) [24,44]. However, 297-28, a susceptible control with a long growth duration, never reached maturity in some blocks; therefore, we skipped the days to maturity trait for further analysis. That was the only disadvantage of ARCB as the variation estimate of genotypes solely depends on controls.

4.3. Traits Investigated under Drought Stress

Much of the initial efforts to improve GYP−1 under drought focused on the improvement of secondary traits such as DF, PHL, PHP, ABP−1, and HI as studied by Mahalle et al. (2020) [45]. In our study, DF came out with the highest broad sense heritability (H2) of 94.59 and 93.83 under lowland and upland conditions one-to-one. The trait was selected as a secondary trait because of its high relationship with grain yield [46], convenience in measurement and a highly effective way to improve drought adaptation under terminal stress [47]. Piveta et al. (2020) also measured PH and tillers number to observe drought in rice [48]. Growth duration or days to maturity was another phenologically important trait like DF but it was not used for the final selection of accessions due to limited comparative optimum temperature particularly for rice, and the weather used to become cold earlier in our research station area. We also ignored spike fertility for the same reason. Plant height to leaf and panicle were positively associated (0.21) with ABP−1 under RDS, making them suitable traits for breeding that was directly associated with grain yield with a significant correlation of 0.8. However, high ABP−1 did not always guarantee high grain yield [49]. Nevertheless, to attain GYP−1 above 4.5 g under drought stress, it was necessary to accumulate a total ABP−1 of at least 9 g. On the other hand, plant height was negatively related to the HI under lowland and upland conditions [50]. However, there was a minimum height below which yield limitation was evident [51]. In a recent study, Lanna et al. (2020) concluded that different secondary traits such as PH and ABP−1 should be considered along with grain yield for an effective breeding approach [52]. Under drought, the H2 for some secondary traits remained high [53], which was also supported by our results by showing H2 of 93.83, 80.04, 76.94 and 58.57 for DF, PHL, PHP and ABP−1, respectively. This is also endorsed by genetic advance (GA) of DF (lowland: 50.29, upland: 56.59), PHL (lowland: 45.27, upland: 31.44), and PHP (lowland: 41.93, upland: 28.25) that is higher than GA of ABP−1 (lowland: 4.23, upland: 4.08), GYP−1 (lowland: 2.64, upland: 1.29) and HI (lowland: 0.15, upland: 0.07). Therefore, using indirect selection based on secondary traits became an attractive strategy in the study.
In our germplasm, some genotypes under measured traits outperformed in the upland condition as compared to the lowland counterparts, particularly DF, by exhibiting shorter duration in drought stress. This could be attributed to the germplasm proportion of North China (947 accessions) which was very sensitive to a slight rise in temperature at the vegetative stage. Secondly, the soil temperature of the water-deficit condition was higher than the watered condition, which also influenced plant growth [54]. Lastly, but not least, the case was credible when investigated genotypes were traditional upland rice because, from many years of field research experience in Shangzhuang, we had already observed taller plant height and higher aboveground biomass and grain yield under drought conditions than normal lowland. A similar phenomenon of higher grain yield under drought stress was expressed by two indica accessions in a trial run by IRRI [49].

4.4. Integrated Relative Drought Stress Susceptibility (RDS-I) Derivation and Estimation

Typically, selection should target genotypes with relatively high productivity under lowland and upland conditions. Hence, there was a need to determine the relative drought stress susceptibility (RDS; Table 6 and Table S1) for their improved adaptability to contrasting conditions. The RDS for GYP−1 ranged between −62.47% to 73.11%, discriminating tolerant and susceptible genotypes. Huang et al. (2018) reported the same drought index but for ABP−1 with a narrow range of −52.1% to −8.1% as he just assessed six genotypes. Statistical ranking of each trait under RDS was based on shared variation, i.e., the higher the variation exhibited by a parameter, the better it would be in the ranking. Instead of that, the practical ranking was based on actual field conditions faced during observation of traits. For instance, statistically, GYP−1 ranked first but practically it was placed in the third position due to an earlier decrease in temperature in the period of grain filling stage of rice in Beijing, as practically variation in GYP−1 was interfered by an early cool season. Further, several earlier studies reported low selection efficiency for grain yield under drought stress [55,56,57]. However, ABP−1 and PHL were not much affected by that, so ranked first and second, respectively. As discussed earlier, phenology was affected by adaptation; therefore, DF achieved the fifth position and HI was last due to its indirect computation from ABP−1 and GYP−1. As the weighted factor (w) was concerned, the shared RDS variation for each trait was assigned to w in descending order while keeping the focus of practical ranking. For example, practical ranks of 1, 2 and 3 had values of 37.44, 30.60 and 11.58, respectively, from a shared RDS variation (Table 6). That weighed factor of each trait was multiplied directly to the RDST to get RDSTw value as shown in Equation (7). Finally, RDSTw was summed up to obtain RDS-I (8) to rank the genotypes with accuracy. That ranking was true due to adjustment with the actual field conditions.

4.5. Conclusions

For the first time, a large-scale germplasm of 2030 rice (Oryza sativa L. ssp. japonica) genotypes was subjected to augmented randomized complete block design (ARCBD) under lowland (irrigated) and upland (drought) conditions, which resulted in significant differences for days to flowering (DF), plant height to leaf (PHL), plant height to panicle (PHP), aboveground biomass plant−1 (ABP−1), grain yield plant−1 (GYP−1) and harvest index (HI). Here, we made an integrated elite selection of 42 genotypes based on integrated relative drought stress susceptibility (RDS-I), drought-resistance grade (DRG) and agglomerative hierarchical cluster (AHC) analysis. Findings from these experiments also elucidated that North China was a rich source to find drought-resistant rice germplasms. Further, both ecotypes such as lowland and upland should be researched for genotypes that could withstand the stress. The mean DF of the elite 42 genotypes was 89.38, which was remarkably less than that of the germplasm, which was 100.17. Further, elite genotypes resulted in doubled ABP−1 and GYP−1 mean performance of 13.54 g and 5.21 g, correspondingly as compared to mean performance of the germplasm, which was 7.99 g and 2.83 g, respectively. Similarly, the mean HI of these 42 genotypes and the investigated germplasm was 0.39 and 0.36, respectively, depicting significant differences. Therefore, these elite genotypes could be used in future breeding programs, and also if a few of them can be grown directly in farmers’ fields. Additionally, 12 genotypes namely Longjing 12, Songjing7, Songjing 22, Jijing 101, Jijing 106, Yanjing 22, Ji 85-34, Liaojing 27, Xiaohongband, 2014H020 and Hongmaodao were identified with better yield with less growth duration, so are suitable for cultivation in areas with terminal drought stress. Further narrowing down the selection, IRAT109 and Ningzi 784 are highly recommended for drought resistance with better yield.

Supplementary Materials

The following are available online at https://0-www-mdpi-com.brum.beds.ac.uk/article/10.3390/agronomy11091740/s1, Figure S1: Quantile-Quantile plots for investigated six traits under lowland (irrigated) and upland (drought) conditions in 2017 and 2018 at Shangzhuang Agricultural Research Station, China Agricultural University, Beijing, China.; Figure S2: Agglomerative hierarchical cluster analysis (AHC) and heat map of agronomic traits of rice genotypes regarding integrated relative drought stress susceptibility.; Table S1: Basic physical property parameters of soil at different depths in Shangzhuang Agricultural Research Station, Beijing.; Table S2. DRG and Clusters results, and RDS and RDS-I ranking based on RDST and RDSTw performance of the six traits, respectively. Footnote at the end of table., Table S3: All the plant and soil traits measured in 2017 and 2018 for the field experiments under lowland and upland conditions.; Table S4: Drought resistance grades (DRG) along with the genotypes distribution among different ecotypes, regions, and clusters.; Table S5: Genotypes distribution of drought resistance grade (DRG) in different regions of China and other countries.; Table S6: The elite 42 genotypes selected from the designated germplasm of 1118 genotypes, their background information, performance in six traits, RDS ranking, RDS-I ranking, drought resistance grade (DRG) and cluster.

Author Contributions

Conceptualization, H.W.; methodology, M.S.A., B.W. and H.W.; software, M.S.A.; validation, M.S.A. and H.W.; formal analysis, M.S.A.; investigation, M.S.A., B.W. and H.W.; resources, M.S.A., B.W. and H.W.; data curation, H.W. and M.S.A.; writing—original draft preparation, H.W. and M.S.A.; writing—review and editing, H.W. and M.S.A.; visualization, M.S.A.; supervision, D.K. and H.W.; project administration, M.S.A., B.W. and H.W.; funding acquisition, H.W. All authors have read and agreed to the published version of the manuscript.

Funding

This work was supported by the National Key Research and Development Program of China (grant numbers 2016YFD0100101-09).

Data Availability Statement

Relevant data are already provided in the article and in Supplementary Materials.

Acknowledgments

We are thankful to the Institute of Crop Sciences, Chinese Academy of Agricultural Sciences, Beijing for providing seeds of 2000 japonica rice genotypes. We are also thankful to John Kafwambira for his help with data entry.

Conflicts of Interest

The authors declare no conflict of interest. The funders had no role in the design of the study; in the collection, analyses, or interpretation of data; in the writing of the manuscript; or in the decision to publish the results.

References

  1. Estrela, T.; Vargas, E. Drought management plans in the European Union. The case of Spain. Water Resour. Manag. 2012, 26, 1537–1553. [Google Scholar] [CrossRef]
  2. Liu, J.; Diamond, J. China’s environment in a globalizing world. Nature 2006, 435, 1179–1186. [Google Scholar] [CrossRef]
  3. Rice around the world. In Rice Almanac; Global Rice Science Partnership, International Rice Research Institute: Los Banos, Philippines, 2013; pp. 79–260. ISBN 978-9712203008. Available online: http://books.irri.org/9789712203008_content.pdf (accessed on 16 August 2021).
  4. Belder, P.; Spiertz, J.H.J.; Bouman, B.A.M.; Lu, G.; Tuong, T.P. Nitrogen economy and water productivity of lowland rice under water-saving irrigation. Field Crop. Res. 2005, 93, 169–185. [Google Scholar] [CrossRef]
  5. Jockson, M.T. International Rice Genebank Operations Manual; International Rice Research Institute: Los Banos, Philippines, 2000. [Google Scholar]
  6. Kumar, A.; Bernier, J.; Verulkar, S.; Lafitte, H.R.; Atlin, G.N. Breeding for drought tolerance: Direct selection for yield, response to selection and use of drought-tolerant donors in upland and lowland-adapted populations. Field Crop. Res. 2008, 107, 221–231. [Google Scholar] [CrossRef]
  7. Jongdee, B.; Pantuwan, G.; Fukai, S.; Fischer, K. Improving drought tolerance in rainfed lowland rice: An example from Thailand. Agric. Water Manag. 2006, 80, 225–240. [Google Scholar] [CrossRef]
  8. Lafitte, H.R.; Li, Z.K.; Vijayakumar, C.H.M.; Gao, Y.M.; Shi, Y.; Xu, J.L.; Fu, B.Y.; Yu, S.B.; Ali, A.J.; Domingo, J.; et al. Improvement of rice drought tolerance through backcross breeding: Evaluation of donors and selection in drought nurseries. Field Crop. Res. 2006, 97, 77–86. [Google Scholar] [CrossRef]
  9. Bernier, J.; Atlin, G.N.; Serraj, R.; Kumar, A.; Spaner, D. Breeding upland rice for drought resistance. J. Sci. Food Agric. 2008, 88, 927–939. [Google Scholar] [CrossRef]
  10. Luo, L.J. Breeding for water-saving and drought-resistance rice (WDR) in China. J. Exp. Bot. 2010, 61, 3509–3517. [Google Scholar] [CrossRef] [Green Version]
  11. Vikram, P.; Swamy, B.P.M.; Dixit, S.; Ahmed, H.U.; Teresa Sta Cruz, M.; Singh, A.K.; Kumar, A. qDTYI1.1, a major QTL for rice grain yield under reproductive-stage drought stress with a consistent effect in multiple elite genetic backgrounds. BMC Genet. 2011, 12, 89. [Google Scholar] [CrossRef] [Green Version]
  12. Liu, S.; Wang, X.; Wang, H.; Xin, H.; Yang, X.; Yan, J.; Li, J.; Tran, L.-S.P.; Shinozaki, K.; Yamaguchi-Shinozaki, K.; et al. Genome-wide analysis of ZmDREB genes and theirassociation with natural variation in drought tolerance at seedling stage of Zea mays L. PLoS Genet. 2013, 9, e1003790. [Google Scholar] [CrossRef] [Green Version]
  13. Huang, Q.; Wang, Y. Overexpression of taNAC2D displays opposite responses to abiotic stresses between seedling and mature stage of transgenic Arabidopsis. Front. Plant Sci. 2016, 7, 1–13. [Google Scholar] [CrossRef]
  14. Shamsudin, N.A.A.; Swamy, B.P.M.M.; Ratnam, W.; Cruz, M.T.S.; Sandhu, N.; Raman, A.K.; Kumar, A.; Abd, N.; Shamsudin, A.; Swamy, B.P.M.M.; et al. Pyramiding of drought yield QTLs into a high quality Malaysian rice cultivar MRQ74 improves yield under reproductive stage drought. Rice 2016, 9, 21. [Google Scholar] [CrossRef] [Green Version]
  15. Oladosu, Y.; Rafii, M.Y.; Samuel, C.; Fatai, A.; Magaji, U.; Kareem, I.; Kamarudin, Z.S.; Muhammad, I.; Kolapo, K. Drought resistance in rice from conventional to molecular breeding: A review. Int. J. Mol. Sci. 2019, 20, 3519. [Google Scholar] [CrossRef] [Green Version]
  16. Monneveux, P.; Jing, R.; Misra, S.C. Phenotyping for drought adaptation in wheat using physiological traits. Front. Physiol. 2012, 3, 429. [Google Scholar] [CrossRef] [Green Version]
  17. Passioura, J.B. Phenotyping for drought tolerance in grain crops: When is it useful to breeders? Funct. Plant Biol. 2012, 39, 851–859. [Google Scholar] [CrossRef]
  18. Lawas, L.M.F.; Shi, W.; Yoshimoto, M.; Hasegawa, T.; Hincha, D.K.; Zuther, E.; Jagadish, S.V.K. Combined drought and heat stress impact during flowering and grain filling in contrasting rice cultivars grown under field conditions. Field Crop. Res. 2018, 229, 66–77. [Google Scholar] [CrossRef]
  19. Bolaños, J.; Edmeades, G.O. Eight cycles of selection for drought tolerance in lowland tropical maize. II. Responses in reproductive behavior. Field Crop. Res. 1993, 31, 253–268. [Google Scholar] [CrossRef]
  20. Zhao, Y.; Karypis, G. Evaluation of hierarchical clustering algorithms for document datasets. In Proceedings of the Eleventh International Conference on Information and Knowledge Management, McLean, VA, USA, 4–9 November 2002; Association for Computing Machinery: New York, NY, USA, 2002; pp. 515–524. [Google Scholar]
  21. Kumar, S.S.; Dwivedi, S.K.; Basu, S.; Kumar, G.; Mishra, J.S.; Koley, T.K.; Rao, K.K.; Choudhary, A.K.; Mondal, S.; Kumar, S.S.; et al. Anatomical, agro-morphological and physiological changes in rice under cumulative and stage specific drought conditions prevailed in eastern region of India. Field Crop. Res. 2020, 245, 107658. [Google Scholar] [CrossRef]
  22. Tardieu, F. Any trait or trait-related allele can confer drought tolerance: Just design the right drought scenario. J. Exp. Bot. 2012, 63, 25–31. [Google Scholar] [CrossRef] [PubMed] [Green Version]
  23. Ahmad, M.S.; Wu, B.; Wang, H.; Kang, D. Field screening of rice germplasm (Oryza sativa L. ssp. japonica) based on days to flowering for drought escape. Plants 2020, 9, 609. [Google Scholar] [CrossRef]
  24. Zu, X.; Lu, Y.; Wang, Q.; Chu, P.; Miao, W.; Wang, H.; La, H. A new method for evaluating the drought tolerance of upland rice cultivars. Crop. J. 2017, 5, 488–498. [Google Scholar] [CrossRef]
  25. Xu, J.; Zhang, L.; Li, T.; Wu, H.; Cui, H. Breeding report on the new upland rice variety of Jiaohan No. 1 with high yield and good quality. J. Henan Agric. Sci. 2011, 40, 64–65. [Google Scholar]
  26. Gong, X.; Liu, X.; Pan, Q.; Mi, G.; Chen, F.; Yuan, L. Combined physiological, transcriptome and genetic analysis reveals a molecular network of nitrogen remobilization in maize. J. Exp. Bot. 2020, 71, 5061–5073. [Google Scholar] [CrossRef]
  27. Buckler, E.S.; Holland, J.B.; Bradbury, P.J.; Acharya, C.B.; Brown, P.J.; Browne, C.; Ersoz, E.; Flint-Garcia, S.; Garcia, A.; Glaubitz, J.C.; et al. The genetic architecture of maize flowering time. Science 2009, 325, 714–718. [Google Scholar] [CrossRef] [Green Version]
  28. Kump, K.L.; Bradbury, P.J.; Wisser, R.J.; Buckler, E.S.; Belcher, A.R.; Oropeza-Rosas, M.A.; Zwonitzer, J.C.; Kresovich, S.; McMullen, M.D.; Ware, D.; et al. Genome-wide association study of quantitative resistance to southern leaf blight in the maize nested association mapping population. Nat. Genet. 2011, 43, 163–168. [Google Scholar] [CrossRef]
  29. Tian, F.; Bradbury, P.J.; Brown, P.J.; Hung, H.; Sun, Q.; Flint-Garcia, S.; Rocheford, T.R.; Mcmullen, M.D.; Holland, J.B.; Buckler, E.S. Genome-wide association study of leaf architecture in the maize nested association mapping population. Nat. Genet. 2011, 43, 159–162. [Google Scholar] [CrossRef]
  30. Huang, C.; Chen, Q.; Xu, G.; Xu, D.; Tian, J.; Tian, F. Identification and fine mapping of quantitative trait loci for the number of vascular bundle in maize stem. J. Integr. Plant Biol. 2016, 58, 81–90. [Google Scholar] [CrossRef] [Green Version]
  31. R Core Team. R: A Language and Environment for Statistical Computing; R Foundation for Statistical Computing: Vienna, Austria, 2019; Volume 2. [Google Scholar]
  32. De Mendiburu, F. Agricolae: Statistical Procedures for Agricultural Research. 2020. [Google Scholar]
  33. Aravind, J.; Mukesh, S.S.; Wankhede, D.P.; Kaur, V. AugmentedRCBD: Analysis of Augmented Randomized Complete Block Designs. 2020. [Google Scholar]
  34. IRRI. Standard Evaluation System for Rice, 5th ed.; International Rice Research Institute: Manila, Philippines, 2013; ISBN 9781612099897. [Google Scholar]
  35. Wickham, H. ggplot2: Elegant Graphics for Data Analysis, 2nd ed.; Springer: New York, NY, USA, 2016; ISBN 9783319242750. [Google Scholar]
  36. Kato, Y.; Katsura, K. Rice adaptation to aerobic soils: Physiological considerations and implications for agronomy. Plant Prod. Sci. 2014, 17, 1–12. [Google Scholar] [CrossRef]
  37. Murtagh, F.; Legendre, P. Ward’s hierarchical agglomerative clustering method: Which algorithms implement Ward’s criterion? J. Classif. 2014, 31, 274–295. [Google Scholar] [CrossRef] [Green Version]
  38. Zhang, Q. Strategies for developing green super rice. Proc. Natl. Acad. Sci. USA 2007, 95, 1663–1668. [Google Scholar] [CrossRef] [Green Version]
  39. Blum, A. Osmotic adjustment is a prime drought stress adaptive engine in support of plant production. Plant Cell Environ. 2017, 40, 4–10. [Google Scholar] [CrossRef]
  40. Caldo, R.; Sebastian, L.; Hernandez, J. Morphology-based genetic diversity analysis of ancestral lines of Philippine rice cultivars. Philipp. J. Crop. Sci. 1996, 21, 86–92. [Google Scholar]
  41. Fleury, D.; Jefferies, S.; Kuchel, H.; Langridge, P. Genetic and genomic tools to improve drought tolerance in wheat. J. Exp. Bot. 2010, 61, 3211–3222. [Google Scholar] [CrossRef] [PubMed] [Green Version]
  42. Bajracharya, J.; Steele, K.A.; Jarvis, D.I.; Sthapit, B.R.; Witcombe, J.R. Rice landrace diversity in Nepal: Variability of agro-morphological traits and SSR markers in landraces from a high-altitude site. Field Crop. Res. 2006, 95, 327–335. [Google Scholar] [CrossRef]
  43. Yawen, Z.; Shiquan, S.; Zichao, L.; Zhongyi, Y.; Xiangkun, W.; Hongliang, Z.; Guosong, W. Ecogeographic and genetic diversity based on morphological characters of indigenous rice (Oryza sativa L.) in Yunnan, China. Genet. Resour. Crop. Evol. 2003, 50, 567–577. [Google Scholar] [CrossRef]
  44. Huang, M.; Xu, Y.; Wang, H. Field identification of morphological and physiological traits in two special mutants with strong tolerance and high sensitivity to drought stress in upland rice (Oryza sativa L.). J. Integr. Agric. 2019, 18, 970–981. [Google Scholar] [CrossRef]
  45. Mahalle, M.D.; Dey, P.C.; Chetia, S.K.; Baruah, A.R.; Ahmed, T.; Sarma, R.N.; Kaldate, R.C.; Kumar, A.; Singh, S.K.; Modi, M.K. Association mapping for yield traits under drought stress in Autumn rice germplasm collection of Assam. J. Plant Biochem. Biotechnol. 2020, 30, 26–36. [Google Scholar] [CrossRef]
  46. Bänziger, M.; Edmeades, G.O.; Beck, D.; Bellon, M. Secondary traits. In Breeding for Drought and Nitrogen Stress Tolerance in Maize: From Theory to Practice; CIMMYT: Texcoco, Mexico, 2000; pp. 39–46. ISBN 970-648463. [Google Scholar]
  47. Araus, J.L.; Slafer, G.A.; Reynolds, M.P. Plant breeding and drought in C3 cereals: What should we breed for? Ann. Bot. 2002, 89, 925–940. [Google Scholar] [CrossRef] [PubMed]
  48. Piveta, L.B.; Roma-Burgos, N.; Noldin, J.A.; Viana, V.E.; de Oliveira, C.; Lamego, F.P.; Avila, L.A. de Molecular and physiological responses of rice and weedy rice to heat and drought stress. Agriculture 2020, 11, 9. [Google Scholar] [CrossRef]
  49. Torres, R.O.; Mcnally, K.L.; Cruz, C.V.; Serraj, R.; Henry, A. Screening of rice genebank germplasm for yield and selection of new drought tolerance donors. Field Crop. Res. 2013, 147, 12–22. [Google Scholar] [CrossRef]
  50. Royo, C.; Álvaro, F.; Martos, V.; Ramdani, A.; Isidro, J.; Villegas, D.; García Del Moral, L.F. Genetic changes in durum wheat yield components and associated traits in Italian and Spanish varieties during the 20th century. Euphytica 2007, 155, 259–270. [Google Scholar] [CrossRef]
  51. Slafer, G.A.; Araus, J.L.J.L.; Royo, C.; García, L.F.; Moral, D.E.L.; Moral, L.F.G. Del Promising eco-physiological traits for genetic improvement of cereal yields in Mediterranean environments. Ann. Appl. Biol. 2005, 146, 61–70. [Google Scholar] [CrossRef]
  52. Lanna, A.C.; Coelho, G.R.C.; Moreira, A.S.; Terra, T.G.R.; Brondani, C.; Saraiva, G.R.; Lemos, F.D.S.; Guimarães, P.H.R.; Morais, O.P.; Vianello, R.P. Upland rice: Phenotypic diversity for drought tolerance. Sci. Agric. 2020, 78, 1–14. [Google Scholar]
  53. Bolaños, J.; Edmeades, G.O. The importance of the anthesis-silking interval in breeding for drought tolerance in tropical maize. Field Crop. Res. 1996, 48, 65–80. [Google Scholar] [CrossRef]
  54. Arai-Sanoh, Y.; Ishimaru, T.; Ohsumi, A.; Kondo, M. Effects of soil temperature on growth and root function in rice. Plant Prod. Sci. 2010, 13, 235–242. [Google Scholar] [CrossRef]
  55. Rosielle, A.A.; Hamblin, J. Theoretical aspects of selection for yield in stress and non-stress environment. Crop. Sci. 1981, 21, 943–946. [Google Scholar] [CrossRef]
  56. Blum, A. Plant breeding and yield stability. In Plant Breeding For Stress Environments; CRC Press: Boca Raton, FL, USA, 1988; pp. 15–42. ISBN 9781315896618. [Google Scholar]
  57. Edmeades, G.O.; Bolaños, J.; Lafitte, H.R.; Rajaram, S.; Pfeiffer, W.; Fischer, R.A. Traditional approaches to breeding for drought resistance in cereals. In Drought Resistance in Cereals; Baker, F.W.G., Ed.; CAB International: Wallingford, UK, 1989; pp. 27–52. [Google Scholar]
Figure 1. Rainfall (mm) and volumetric soil moisture content (%) situations at Shangzhuang Agricultural Research Station, Beijing, China for the study carried out consecutively in 2017 and 2018 from May to October. † Left and right axes have different scales.
Agronomy 11 01740 g001
Figure 2. Frequency distribution of the six traits in lowland and upland conditions. Note: (a) Days to flowering. (b) Plant height to leaf (cm). (c) Plant height to panicle (cm). (d) Aboveground biomass plant−1 (g). (e) Grain yield plant−1 (g). (f) Harvest index.
Agronomy 11 01740 g002
Figure 3. The relationship among days to flowering (DF), plant height to leaf (PHL; cm), plant height to panicle (PHP; cm), aboveground biomass plant−1 (ABP−1; g), grain yield plant−1 (GYP−1; g) and harvest index (HI) under lowland condition, upland condition and respective relative drought stress susceptibility (RDS) index. Note: * p < 0.05. ** p < 0.01. *** p < 0.001.
Agronomy 11 01740 g003
Figure 4. Agglomerative hierarchical cluster analysis (AHC) and heat map of agronomic traits of rice genotypes regarding integrated relative drought stress susceptibility. Note: comparative variable levels correspond to the colour temperature. The colour temperature scheme indicates relative variable levels ranging from minimum (green) to maximum (red) contents of the respective variable. DF = days to flowering; PHL = plant height to leaf; PHP = plant height to panicle; ABP−1 = aboveground biomass plant−1; GYP−1 = grain yield plant−1. For high resolution illustration, please refer to Figure S2.
Agronomy 11 01740 g004
Figure 5. Scatter diagram based on grain yield plant−1 (g) versus days to flowering distribution of 45 genotypes including controls (indicated within red circle). Note: two genotypes in the green circle were marked as prime genotypes. The genotypes in the blue circle were characterized by better grain yield along with the shorter growth duration. All encircled genotypes are presented with their names, whereas most of the remaining entries are symbolized by their accession codes.
Agronomy 11 01740 g005
Table 1. Origin, ecotype and type of germplasm evaluated in the study.
EcotypeLowlandUplandTotal
OriginExoticLineVarietyCultivarLineVarietyCultivar
China 19513512033128921900
Anhui 8 8
Beijing 37 318 76
Guizhou 6 6
Hebei 3120 354
Heilongjiang 19237 213244
Henan 67 4 71
Inner Mongolia 4 48
Jiangsu 1761501 1 328
Jilin 26351 115330
Liaoning 24741 1236336
Ningxia 8513 98
Shandong 196025 16120
Tianjin 2 24
Xinjiang 179 329
Yunnan 188 188
Brazil 1 1
Ivory Coast 2 2
Japan56 1 57
South Korea70 70
Total12619513522033031922030
Note. Exotic = exotic variety with unknown type; line = promising line; variety = released variety; cultivar = traditional cultivar.
Table 2. Selected traits of study, their abbreviations and measurement details.
TraitDescription
DFDays to flowering was recorded as the number of days from sowing to the time when inflorescences had emerged above the flag leaf sheath for more than half of the individuals of a landrace.
PHL (cm)Measured height from ground to the highest leaf tip with a meter rod.
PHP (cm)Measured height from ground to panicle tip with a meter rod.
ABP1 (g)Shoot dry weight, including the grain yield and straw, were weighed for each plant after being dried in an oven at 105 °C for 30 min and at 80 °C for 23.5 h.
GYP1 (g)Total grain weight plant1 was weighed after drying at 105 °C for 30 min and then 80 °C for 23.5 h in an oven.
HIThe harvest index was computed as the ratio of filled spikelet weight to total aboveground biomass.
Note. DF = days to flowering; PHL = plant height to leaf; PHP = plant height to panicle; ABP−1 = aboveground biomass plant−1; GYP−1 = grain yield plant−1; HI = harvest index.
Table 3. Summary of the analysis of variance (ANOVA) for the effects of genotype (G), condition (C), year (Y), and their possible interactions on rice phenotypic traits.
TraitGCYG × CG × YC × YG × C × Y
DF0.0000.0000.0000.0000.0120.0000.979
PHL0.0000.0000.9970.0020.0150.0000.535
PHP0.0000.0000.0000.0000.0000.0000.004
ABP−10.0000.000 0.006
GYP−10.0000.000 0.001
HI0.0000.000 0.221
Note: above-mentioned data are depicted as p-values. DF = days to flowering; PHL = plant height to leaf; PHP = plant height to panicle; ABP−1 = aboveground biomass plant−1; GYP−1 = grain yield plant−1; HI = harvest index.
Table 4. Performance of measured six traits for genotypes and controls under lowland and upland conditions in 2017 and 2018 along with condition × year.
FactorDFPHL (cm)PHP (cm) ABP −1 (g) GYP −1 (g) HI
Genotype100.07 ± 20.8891.52 ± 19.1088.21 ± 18.2811.09 ± 5.794.17 ± 2.610.372 ± 0.11
Control98.69 ± 8.4793.44 ± 18.3789.15 ± 19.6111.09 ± 4.664.06 ± 2.30.348 ± 0.12
B196.04 ± 6.5375.34 ± 7.8668.12 ± 7.619.48 ± 2.843.49 ± 1.40.36 ± 0.07
HD-27794.39 ± 5.6796.41 ± 10.3794.68 ± 10.3312.88 ± 4.445.52 ± 1.970.43 ± 0.07
297-28106.2 ± 7.82109.24 ± 15.83105.3 ± 15.8911 ± 5.533.24 ± 2.60.26 ± 0.12
Condition (C)
Lowland 99.17 ± 17.94 98.62 ± 16.82 95.63 ± 15.93 13.93 ± 6.04 5.39 ± 2.82 0.39 ± 0.11
Upland 100.27 ± 21.02 84.29 ± 14.24 80.77 ± 13.09 7.99 ± 3.77 2.83 ± 1.55 0.36 ± 0.11
Year (Y)
2017 103.8 ± 20.8 91.02 ± 19.96 88.57 ± 19.3
2018 96.05 ± 19.63 92.18 ± 18.13 87.94 ± 17.35 11.09 ± 5.75 4.16 ± 2.6 0.371 ± 0.11
HSD0.05
Sc 7.007.117.214.822.170.11
Sb 55.9664.4565.2930.6313.770.60
Sv68.5474.4375.4335.3515.940.65
Svc34.5337.4437.9417.908.050.45
C0.2760.4090.3790.2670.1180.0055
Y0.276NS0.378
C × Y0.5530.8210.758
DF = days to flowering; PHL = plant height to leaf; PHP = plant height to panicle; ABP−1 = aboveground biomass plant−1; GYP−1 = grain yield plant−1; HI = harvest index; HSD = Tukey’s honestly significant difference; Sc = difference between two control genotypes; Sb = difference between two test genotypes in the same block; Sv = difference between two test genotypes in different blocks; Svc = difference between a control and test entry; NS = non-significant.
Table 5. Descriptive statistics of days to flowering, plant height to leaf, plant height to panicle, above-ground biomass plant−1, grain yield plant−1 and harvest index under lowland and upland conditions in 2017 and 2018.
TraitYearC Mean Min Max CV (%) SEM SD (±) GCV (%) PCV (%) H2 (%) GA (%) HSD0.05
Days to flowering2017L 104.1 67 174 9.23 0.44 19.73 16.36 18.78 75.91 30.63 50.16
U 101.9 61 170 4.96 0.51 21.84 20.76 21.36 94.52 42.43 31.41
2018L 94.24 671383.93 0.37 16.16 18.6 19.01 95.72 35.38 18.90
U 96.92 551556.19 0.47 19.64 21.63 22.51 92.29 41.54 29.37
Plant height to leaf (cm)2017L 99.67 43.8 187 6.82 0.5 19.43 17.45 18.74 86.64 33.39 35.90
U 81 33 149.33 8.77 0.43 16.47 19.41 21.35 82.63 29.48 35.28
2018L 97.2 42178.337.09 0.41 16.94 18.6 19.9 87.36 34.85 34.95
U 85.84 45139.679.56 0.42 15 27.03 31.76 72.43 2.27 39.15
Plant height to panicle (cm)2017L 97.62 44 191 6.55 0.48 18.59 16.92 18.15 86.93 31.77 33.68
U 78.2 25.6 147.67 8.68 0.4 15.57 18.91 20.86 82.17 27.66 33.70
2018L 93.25 541856.84 0.4 16.39 18.58 19.79 88.15 33.56 32.30
U 82.41 45139.679.27 0.38 14.1 13.17 16.07 67.12 18.34 36.36
Aboveground biomass plant −1 (g)L 13.93 2.5048.6633.58 0.15 6.04 24.81 41.83 35.18 4.23 24.05
U 7.99 1.2226.4728.19 0.1 3.77 32.36 42.28 58.57 4.08 10.48
Grain yield plant −1 (g)L 5.39 0.117.3636.1 0.07 2.82 34.52 50.22 47.26 2.64 10.07
U 2.83 0.0510.6539.18 0.04 1.55 33.08 49.58 44.5 1.29 5.03
Harvest index L 0.39 0.010.6915.36 0.002 0.11 22.23 27.07 67.43 0.15 0.31
U 0.36 0.010.6524.6 0.003 0.11 16.22 28.99 31.28 0.07 0.48
Note. C = conditions; CV = coefficient of variation; SEM = standard error of the mean; SD = standard deviation; GCV = genotypic coefficient of variation; PCV = phenotypic coefficient of variation; H2 = broad sense heritability; GA = genetic advance; HSD = Tukey’s honestly significant difference; L = lowland; U = upland.
Table 6. Statistical analysis of RDS, derivation of weighted factor (w), range and variation of RDS for six traits in 2017, 2018 as well as pooled data.
VariableFactorDFPHLPHPABP−1GYP−1HI
RDS20172.12 ± 7.89 NS17.52 ± 12.69 ***18.32 ± 13.31 ***
2018−3.32 ± 8.59 ***9.53 ± 12.82 ***10.3 ± 13.21 ***42.72 ± 27.91 ***52.45 ± 26.57 ***16.56 ± 26.44 ***
Pooled−0.3 ± 8.25 *** d13.82 ± 12.76 *** c14.39 ± 13.26 *** c42.78 ± 27.91 *** b52.34 ± 26.57 *** a16.19 ± 26.44 *** c
Weighted Factor CalculationShared RDS variation (%)0.219.8910.2930.6037.4411.58
Original ranking654213
Practical ranking524136
Weighted factor (w; %)9.8930.6010.2937.4411.580.21
Minimum2017−56.16−49.46−65.50
2018−60.22−61.90−80.69−66.06−120.60−111.98
Pooled−60.22−61.90−80.69−66.06−120.60−110.98
Maximum201753.5967.2874.54
201829.6346.8452.4291.7598.7398.60
Pooled30.6757.0049.9691.7598.7398.60
Range2017109.76116.74140.03
201889.84108.75133.11157.81219.33210.57
Pooled90.88118.90130.65157.81219.33209.57
Variance (s2)201762.21161.13177.07
201873.87164.43174.54779.19705.76699.27
Pooled68.04162.78175.81779.19705.76699.27
Standard Deviation (SD)20177.8912.6913.31
20188.5912.8213.2127.9126.5726.44
Pooled8.2512.7613.2627.9126.5726.44
Note: RDS = relative drought stress susceptibility; DF = days to flowering; PHL = plant height to leaf; PHP = plant height to panicle; ABP−1 = aboveground biomass plant−1; GYP−1 = grain yield plant−1; HI = harvest index; NS = non-significant. Pooled traits having the same letter are not different from each other according to Tukey’s honestly significant difference (HSD0.05). *** p < 0.001. S h a r e d   R D S   v a r i a t i o n   % = R D S T   S D / R D S T   S D   × 100 , where RDST SD is the standard deviation of RDS for a particular trait.
Table 7. Drought resistance grade (DRG), number of genotypes in each grade, mean of six traits under integrated relative drought stress susceptibility (RDS-I), mean of each grade, clusters, groups, ecotypes and origin of genotypes in each grade.
DRGG. N.DFPHLPHPABP⁻¹GYP⁻¹HIMeanClusterClassEcotypeOrigin a
120.912.081.16−22.53−10.50−0.037−28.92VIIARUNorth, Ivory Coast
1–350.06−1.780.03−14.44−2.250.025−18.36VI, VIIA North
3180.051.490.59−10.72−0.270.035−8.81VI, VII, VIII, IXA, BTL, IU, TUNorth, Centre, South
3–5670.202.250.96−2.761.730.0392.42V, VI, VII, VIII, IXA, B, CTL, IU, RU, TUNorth, Centre, South, South Korea, Japan
51410.123.121.094.702.930.02511.98V, VI, VII, VIII, IXA, B, CTL, IU, RU, TUNorth, Centre, South, South Korea, Japan
5–72500.043.451.1812.644.930.02322.27I, II, III, V, VI, VII, VIII, IXA, B, C, DTL, IU, RU, TUNorth, Centre, South, South Korea, Japan
7328−0.074.391.4819.547.000.03032.36I, II, III, IV, V, VI, VII, VIII, IXA, B, C, DTL, IU, RU, TUNorth, Centre, South, South Korea, Japan
7–9247−0.145.461.9325.958.820.04142.06I, II, III, IV, V, VIIIB, C, DTL, IU, RU, TUNorth, Centre, South, South Korea, Japan, Brazil
960−0.297.902.8729.6910.020.06450.26I, IV, VC, DTL, RU, TUNorth, Centre, South, South Korea, Japan
SD 0.322.550.7617.515.990.03
SEM 0.110.850.255.842.000.01
Note. G. N. = number of genotypes; DF = days to flowering; PHL = plant height to leaf; PHP = plant height to panicle; ABP⁻¹ = aboveground biomass plant⁻¹; GYP⁻¹ = grain yield plant⁻¹; HI = harvest index; SD = standard deviation; SEM = standard error of means; RU = released upland rice variety; TL = traditional lowland rice cultivar; IU = improved upland rice breeding line; TU = traditional upland rice cultivar. a North = North China, Centre = Central China, South = South China.
Table 8. Clusters with integrated relative drought stress susceptibility (RDS-I) for six traits and their relation to drought resistance grade (DRG).
ClusterG. N.StatisticDFPHLPHPABP−1GYP−1HITotalRDS-I PerformanceClassDRG with G. (%)
VI113Mean−0.142.120.816.185.570.0814.62Dry biomass (ABP−1 and GYP−1) and plant height (PHL and PHP) were lowest or lower, thus genotypes have strong drought resistance (all the genotypes in top DRGs 1 and 1–3 and the majority of them from DRGs 3, 3–5 and 5 fall in these clusters)A1100
Min−2.42−6.51−2.85−23.28−1.910.03−22.771–3100
Max2.65.52.1416.3110.1831.66377.78
VII176Mean0.211.760.587.422.200.0012.183–568.66
Min−1.04−13.18−2.43−24.71−13.99−0.11−35.85565.25
Max1.98.422.5817.396.070.0932.915–7 a47.2
VIII97Mean0.006.132.078.883.050.0120.13Comparatively, dry biomass was lower but plant height was higher. Hence, drought resistance of genotypes varied with moderate (DRG 5) to somewhat strong resistance (DRG 3–5 and 3)B322.22
Min−3.412.410.86−10.79−2.29−0.07−5.23–529.85
Max1.9317.444.3615.885.870.0337.87534.04
IX76Mean0.105.832.021.563.850.0613.425–733.2
Min−1.153.640.86−19.81−0.090.02−10.8275.18
Max3.0412.814.7112.926.620.1330.257–90.4
I117Mean−0.052.691.0422.908.510.0635.16Contrary to class B above, dry biomass and plant height were higher and lower, respectively. Therefore, drought resistance of the majority of genotypes was weak (DRG 7)C
Min−1.96−2.58−1.6916.366.28−0.1920.165–713.6
Max2.335.912.0133.2211.360.1848.45746.04
II126Mean0.062.000.6522.316.60−0.0131.617–922.67
Min−1.55−3.94−1.9016.001.99−0.1720.1893.33
Max2.096.911.9631.6110.000.0345.33
III69Mean−0.086.421.9619.445.60−0.0233.33Both dry biomass and plant height were highest or higher (highly drought susceptible); thus, drought resistance of genotypes was weak to weakest (DRG 7 to 9)D
Min−1.474.440.416.030.95−0.1424.143–51.49
Max1.5816.444.0224.277.220.0347.7950.71
IV113Mean−0.086.232.0326.688.240.0043.105–76
Min−3.34.21−0.1420.856.33−0.1234.06745.12
Max2.4410.893.834.3110.60.0558.527–976.92
V231Mean−0.226.222.3522.078.870.0839.38996.67
Min−4.112.691.19−16.466.170.044.99
Max2.0714.25.1533.4811.450.255.38
SD 0.132.140.719.182.440.04
SEM 0.040.710.243.060.810.01
G. N. = number of genotypes; DF = days to flowering; PHL = plant height to leaf; PHP = plant height to panicle; ABP−1 = aboveground biomass plant−1; GYP−1 = grain yield plant−1; HI = harvest index; G. = genotypes; SD = standard deviation; SEM = standard error of means. a DRG 7 was skipped in class A to adjust the table.
Publisher’s Note: MDPI stays neutral with regard to jurisdictional claims in published maps and institutional affiliations.

