Article

Genetic Mapping Reveals Novel Exotic and Elite QTL Alleles for Salinity Tolerance in Barley

by
Mohammed Abdelaziz Sayed
1,2,*,
Saad Mohamed Nassar
3,
Ehab Soudi Moustafa
3,
Mohamed Tharwat Said
1,
Andreas Börner
2,* and
Alhosein Hamada
1
1
Agronomy Department, Faculty of Agriculture, Assiut University, Assiut 71526, Egypt
2
Resources Genetics and Reproduction, Gene Bank, Leibniz Institute of Plant Genetics and Crop Plant Research (IPK), D-06466 Seeland, Germany
3
Desert Research Center, Plant Breeding Unit, Department of Plant Genetic Resources, Cairo 11753, El-Matarya, Egypt
*
Authors to whom correspondence should be addressed.
Submission received: 5 July 2021 / Revised: 15 August 2021 / Accepted: 24 August 2021 / Published: 3 September 2021

Abstract

:
Soil salinity is one of the constraints of crop production in Egypt. The aims of this study were to identify genomic regions associated with grain weight and its related traits along with their salinity tolerance indices and to identify the most salinity tolerant and high-yielding genotypes. Therefore, we evaluated an advanced backcross mapping population of barley in newly reclaimed soil under two salinity levels of groundwater aquifers in South of Sinai, Egypt. We detected significant QTL associated with grain weight related attributes and the salinity tolerance index (STI) distributed throughout the whole genome of barley, which can be used to enhance salinity tolerance. Moreover, the markers bPb-3739 (4H, 96.3 cM), AF043094A (5H, 156 cM), bPb-8161 (7H, 2.22 cM), and bPb-5260 (7H, 115.6 cM), were the most important identified genomic regions corresponding to vernalization, dwarfing and dehydrin genes, which are correlated with salinity tolerance. Additionally, the doubled haploid lines SI001, SI043, SI044, SI028, SI242, SI035, and SI005 had the highest STI values based on yield average. The present study demonstrated that wild and elite barley do harbor novel valuable alleles, which can enrich the genetic basis of cultivated barley and improve quantitative agronomic traits under salinity conditions.

1. Introduction

Soil salinization is increasing around the world, especially in arid and semi-arid regions, mainly due to climate change [1,2], and has significant impact on agricultural productivity and sustainability [3]. It has been reported that about one-fifth of the world’s total irrigated lands are salt-affected, and Egypt is one of the most significantly impacted countries [4]. The River Nile is the primary source of irrigation water in Egypt; however, in newly reclaimed areas, especially in coastal regions, groundwater is used for irrigating certain crops [5]. Soil salinity, or irrigating crops with saline water, reduces growth and development of plants, and consequently reduces the final yield [1,6].
Cultivated barley (Hordeum vulgare L.) is the fourth most widely cultivated cereal in the world, and the main crop grown at a large scale in the North Coastal Region of Egypt, as well as in newly reclaimed areas with saline soils and a shortage of fresh water under different irrigation systems [7,8]. Cultivated barley originated from wild barley, and was domesticated within the Fertile Crescent and Tibet, and shows significant narrowing of the genetic base due to the domestication process [9]. However, wild barley germplasm is a rich source of useful genes for salinity tolerance improvement in barley. Variations in shoot Na+ accumulation and other salinity tolerance traits among H. vulgare ssp. spontaneum accessions have been demonstrated. This subspecies is widely distributed in the Middle East [10]. The accession ISR 42-8 is an exotic wild barley (H. vulgare L. ssp. spontaneum) which show high tolerance/resistance to drought and salt/Al stress [1,11].
Monitoring the genetic diversity within genetic resources of a crop for trait tolerance to salinity in order to identify salinity-tolerant genotypes is an efficient approach to reduce yield loss [12]. To do this, several selection indices, such as the salinity tolerance index (STI), have been suggested as a screening- method based on the mathematical relationships between control and stress conditions [13]. However, little is known about the genetic control of the salinity tolerance index as a phenotypic criteria associated with salinity tolerance-related traits. Salinity tolerance is a complex trait which is governed by quantitative trait loci (QTL) [14]. Hence, detection of salinity tolerance loci using molecular markers is necessary to assist in the breeding of salt-tolerant crops. QTL mapping in segregated populations is an important strategy to create more stress-tolerant crops, by identifying inherited markers associated with loci with exotic or elite alleles contributions. These loci control the trait of interest, particularly complex quantitative traits such as salt tolerance and its related characteristics.
Numerous studies have reported the QTL for salt tolerance in barley at different growth stages. For instance, the major salinity tolerance locus HvNax3 was mapped on chromosome 7HS in a bi-parental population originating from crossing the wild barley CPI-71284-48 (Hordeum vulgare ssp. spontaneum) and the cultivar Barque-73 [15]. Mano and Takeda [16] detected the QTL for salinity tolerance on chromosomes 1H and 5H in the Harrington × TR306 population, and on 4H, 5H, and 6H in the Steptoe × Morex population. Elucidating natural variation and genetic control of yield related traits under salinity conditions could help to improve barley production worldwide and particularly in Egypt. The aims of this study in barley were (1) to examine the natural phenotypic and genetic variation of grain yield and its related traits in response to salt stress in 301 doubled haploid lines; (2) to identify the valuable exotic and elite alleles for salinity tolerance; and (3) to identify the most salinity tolerant and high-yielding BC2DH lines that could be used for yield improvement under salt stress.

2. Materials and Methods

2.1. Plant Materials and Genotyping

A mapping population containing 301 BC2DH lines (designated as S42) from the cross Scarlett × ISR 42-8 and both parents were studied in four field trials under two salinity levels for two growing seasons, in newly reclaimed desert soil. Scarlett is a German barley cultivar, whereas ISR 42-8 is a Hordeum vulgare ssp. spontaneum accession. Details on the development of the DH-lines are given in von Korff et al. [17]. The S42 population was genotyped with 371 DNA markers, including 10 gene-specific DNA markers referred to by Wang et al. [18], 255 diversity array technology (DArT) markers following Sayed et al. [19], and 106 simple sequence repeats (SSRs) based on von Korff et al. [17], in order to perform the QTL analysis.

2.2. Experimental Site, Design, and Trial Management

The experiment was carried out at Ras Sudr experimental station (29°35′59″ N, 32°42′05″ E), Desert Research Center (DRC), Western Sinai Peninsula, South Sinai Governorate, Egypt, during the 2017–2018 and 2018–2019 growing seasons. The region is described as a semi-arid area with very low precipitation, and limited available freshwater, and the ground-water is highly affected by salt [20]. The average monthly temperature and monthly cumulative precipitation during the two growing seasons are presented in Table 1. Soil samples were collected to determine soil chemical properties (four samples per replicate) before sowing at 0–30 cm soil depth in both growing seasons. The soil type is sandy loam, with pH of 7.8 on average in both growing seasons (Table 2). Electrical conductivity (EC) of the soil was estimated using the EC1:1 method, by adding 100 mL distilled water to 100 g oven-dried soil, and the mixture was shaken for 30 min [21,22]. After preparing the extract, the EC was determined using conductivity meter. The average electrical conductivity of the soil water extract (1:1) was 8.82 ds/m. Irrigation depends on the use of two different sources of groundwater (wells) affected by salinity (Well 1 = 9.35 ds/m = 6500 ppm and Well 2 = 13.5 ds/m = 9500 ppm). Irrigation water from the two different wells is also affected by salinity (8.35 ds m−1).
In each growing season, two different adjacent groundwater sources (referred to as salinity treatments) were used to provide plants with water. The experimental design was a split plot with three replications. The main plots were allocated for salinity levels, while the sub-plots were assigned for the 303 genotypes. Additionally, the genotypes were sown in plots with a size of 3.5 m × 2 m = 7 m2; each plot contained ten rows, one row for each entry, 20 cm apart from each other, at the seed rate of 120 kg ha−1 for each replication. The first and the last row in each plot were duplicated to avoid a border effect. In each treatment, the plants were irrigated through drip irrigation twice a week from their own well, and this was cutoff two weeks before harvest. Sowing was at the end of November in both growing seasons. Agronomic practices, including fertilizer application and weed management, were carried out as recommended for this area.

2.3. Data Collection

Observations on grain yield (weight) and its attributes were taken from the middle one linear meter per entry. The heading date (HD) represents the days required for heading of 50% plants of each entry from the date of sowing. Plant height (PH; cm) was measured as an average of five middle plants per entry in each plot. Number of spikes per linear meter (NSPLM), biological weight per linear meter (BWPLM; g), and grain weight per linear meter (GWPLM; g) were measured on the middle-linear meter for each genotype in each plot. For thousand grain weight (TGW; g), 1000 grains from each entry were weighed and recorded in grams. Harvest index (HI; %) was calculated from the ratio of the grain and biological weights.

2.4. Data Analysis

A combination of two salinity levels and two years were regarded to be four environments. The data of the studied traits were subjected to the analysis of variance by using PROC GLM SAS Software [23], to test the significance of the main effects and interactions. Broad sense heritability (H2b) was estimated according to Padi [24], as follows:
H b 2 = σ g 2 σ p 2 ,                σ p 2 = ( σ g 2 ) + ( σ g × y 2 s l ) + ( σ g × s l 2 y ) + ( σ g × y 2 × s l r ) + ( σ e 2 y s l r )
where, σ g 2 is genotypic variance, σ p 2 is phenotypic variance, σ g × y , 2 σ g × s l , 2 σ g × y × s l , 2   and   σ e , 2 are the genotype × year, genotype × salinity levels, genotype × year × salinity levels interaction, and pooled error variances, respectively. y is the number of years, sl the number of salinity levels, and r the number of replications.
The genotypic coefficient of variation (GCV%) and phenotypic coefficient of variation (PCV%) were calculated as proposed by Singh and Chaudhary [25], as follows:
G C V % = ( σ g 2 X ¯ ) × 100                   P C V % = ( σ p 2 X ¯ ) × 100
where X ¯ is the grand mean of the trait.
Salinity tolerance index (STI): calculated for all measured traits as proposed by Fernandez [26], as follows:
S T I = ( Y p × Y s ) / ( X ¯ p ) 2
where Ys and Yp are the traits of interest of the tested genotypes under salinity (stress) and non-stress conditions, and X ¯ p is the mean value of the trait under non-stress conditions.
The position of the QTL and their genetic effects were assessed using GenStat 15 [27]. Data of the studied traits and salinity tolerant index were subjected to the QTL mapping approach to detect the most significant QTL based on the main effects and QTL by environment interaction as additive effects (single trait in multiple environments). In addition, detection of putative QTL was achieved through three steps: first, a genome-wide scan by simple interval mapping (SIM); second, scanning for the most significant QTL effects through composite interval mapping (CIM); and third, selection of QTL candidates. The graphical linkage map and QTL placement were performed by the software of MapChart 2.2 [28].

3. Results

3.1. Phenotypic Variations and Heritability Estimates

The analysis of variance revealed highly significant main effects for years, salinity levels, and genotypes for all investigated traits (Table 3), and their interactions were highly significant in most cases as well. Large phenotypic and genotypic coefficients were detected for plant height, number of spikes lm−1, grain weight lm−1, biological weight lm−1, and 1000-grain weight. This indicates the influence of salinity and seasonal conditions on the investigated traits. Broad sense heritability was estimated for each trait overall in the genotypes and ranged between 23.9% (HI) and 94.5% (TGW). The variation among studied traits was reflected in the transgressive segregation which was observed among the DHLs of the S42 population (Table S1).
The reduction percentages due to increased salinity levels and the salinity tolerance index values of the S42 population and its parents calculated in each season for all measured traits are shown in Table S2. A significant reduction was observed in all traits due to increasing salinity levels, from 9.35 to 13.5 ds/m, in both seasons. The reduction percentage ranged from 9.2% (HD, second season) to 58.2% (GWPLM, first season) in the S42 population. It also varied between parents, and showed approximately the same reduction in the days to heading to avoid the stress effects of extreme salinity. ISR 42-8 showed remarkable tolerance to salinity by exhibiting a low reduction in PH and NSPLM compared to Scarlett, which may be due to an increasing number of infertile tillers of ISR 42-2. The STI was different for the studied characteristics; and the genotypes with high values of STI were categorized as salt tolerant. ISR 42-8 had high STI values in PH (in the first year), GWPLM, BWPLM, and HI. Scarlett had high values of STI in NSPLM and TGW. For the DHLs, closed values of the STI in both seasons were noted for all traits. The DHLs SI001, SI043, SI044, SI028, SI242, SI035, and SI005 had high STI values, ranging between 1.5 and 3. These lines could be characterized as salt tolerant. The DHLs SI261, SI203, SI190, SI205, SI085, SI206 and SI209 had low values of STI ranged between 0.05 and 0.10, and were considered intolerant to salinity (Table S3).
Days to heading was associated significantly and negatively with all measured traits under the two salinity levels, except with HI, which was non-significant. Positive and high significant correlations were observed between PH and each of NSPLM, GWPLM, and BWPLM under both salinity levels. Furthermore, strong positive and significant correlations were obtained between NSPLM and each of GWPLM and BWPLM under both salinity levels. Grain weight lm−1 was associated significantly and positively with BWPLM and TGW under both treatments. A negative and highly significant correlation was observed between HI and BWPLM (Table S4).

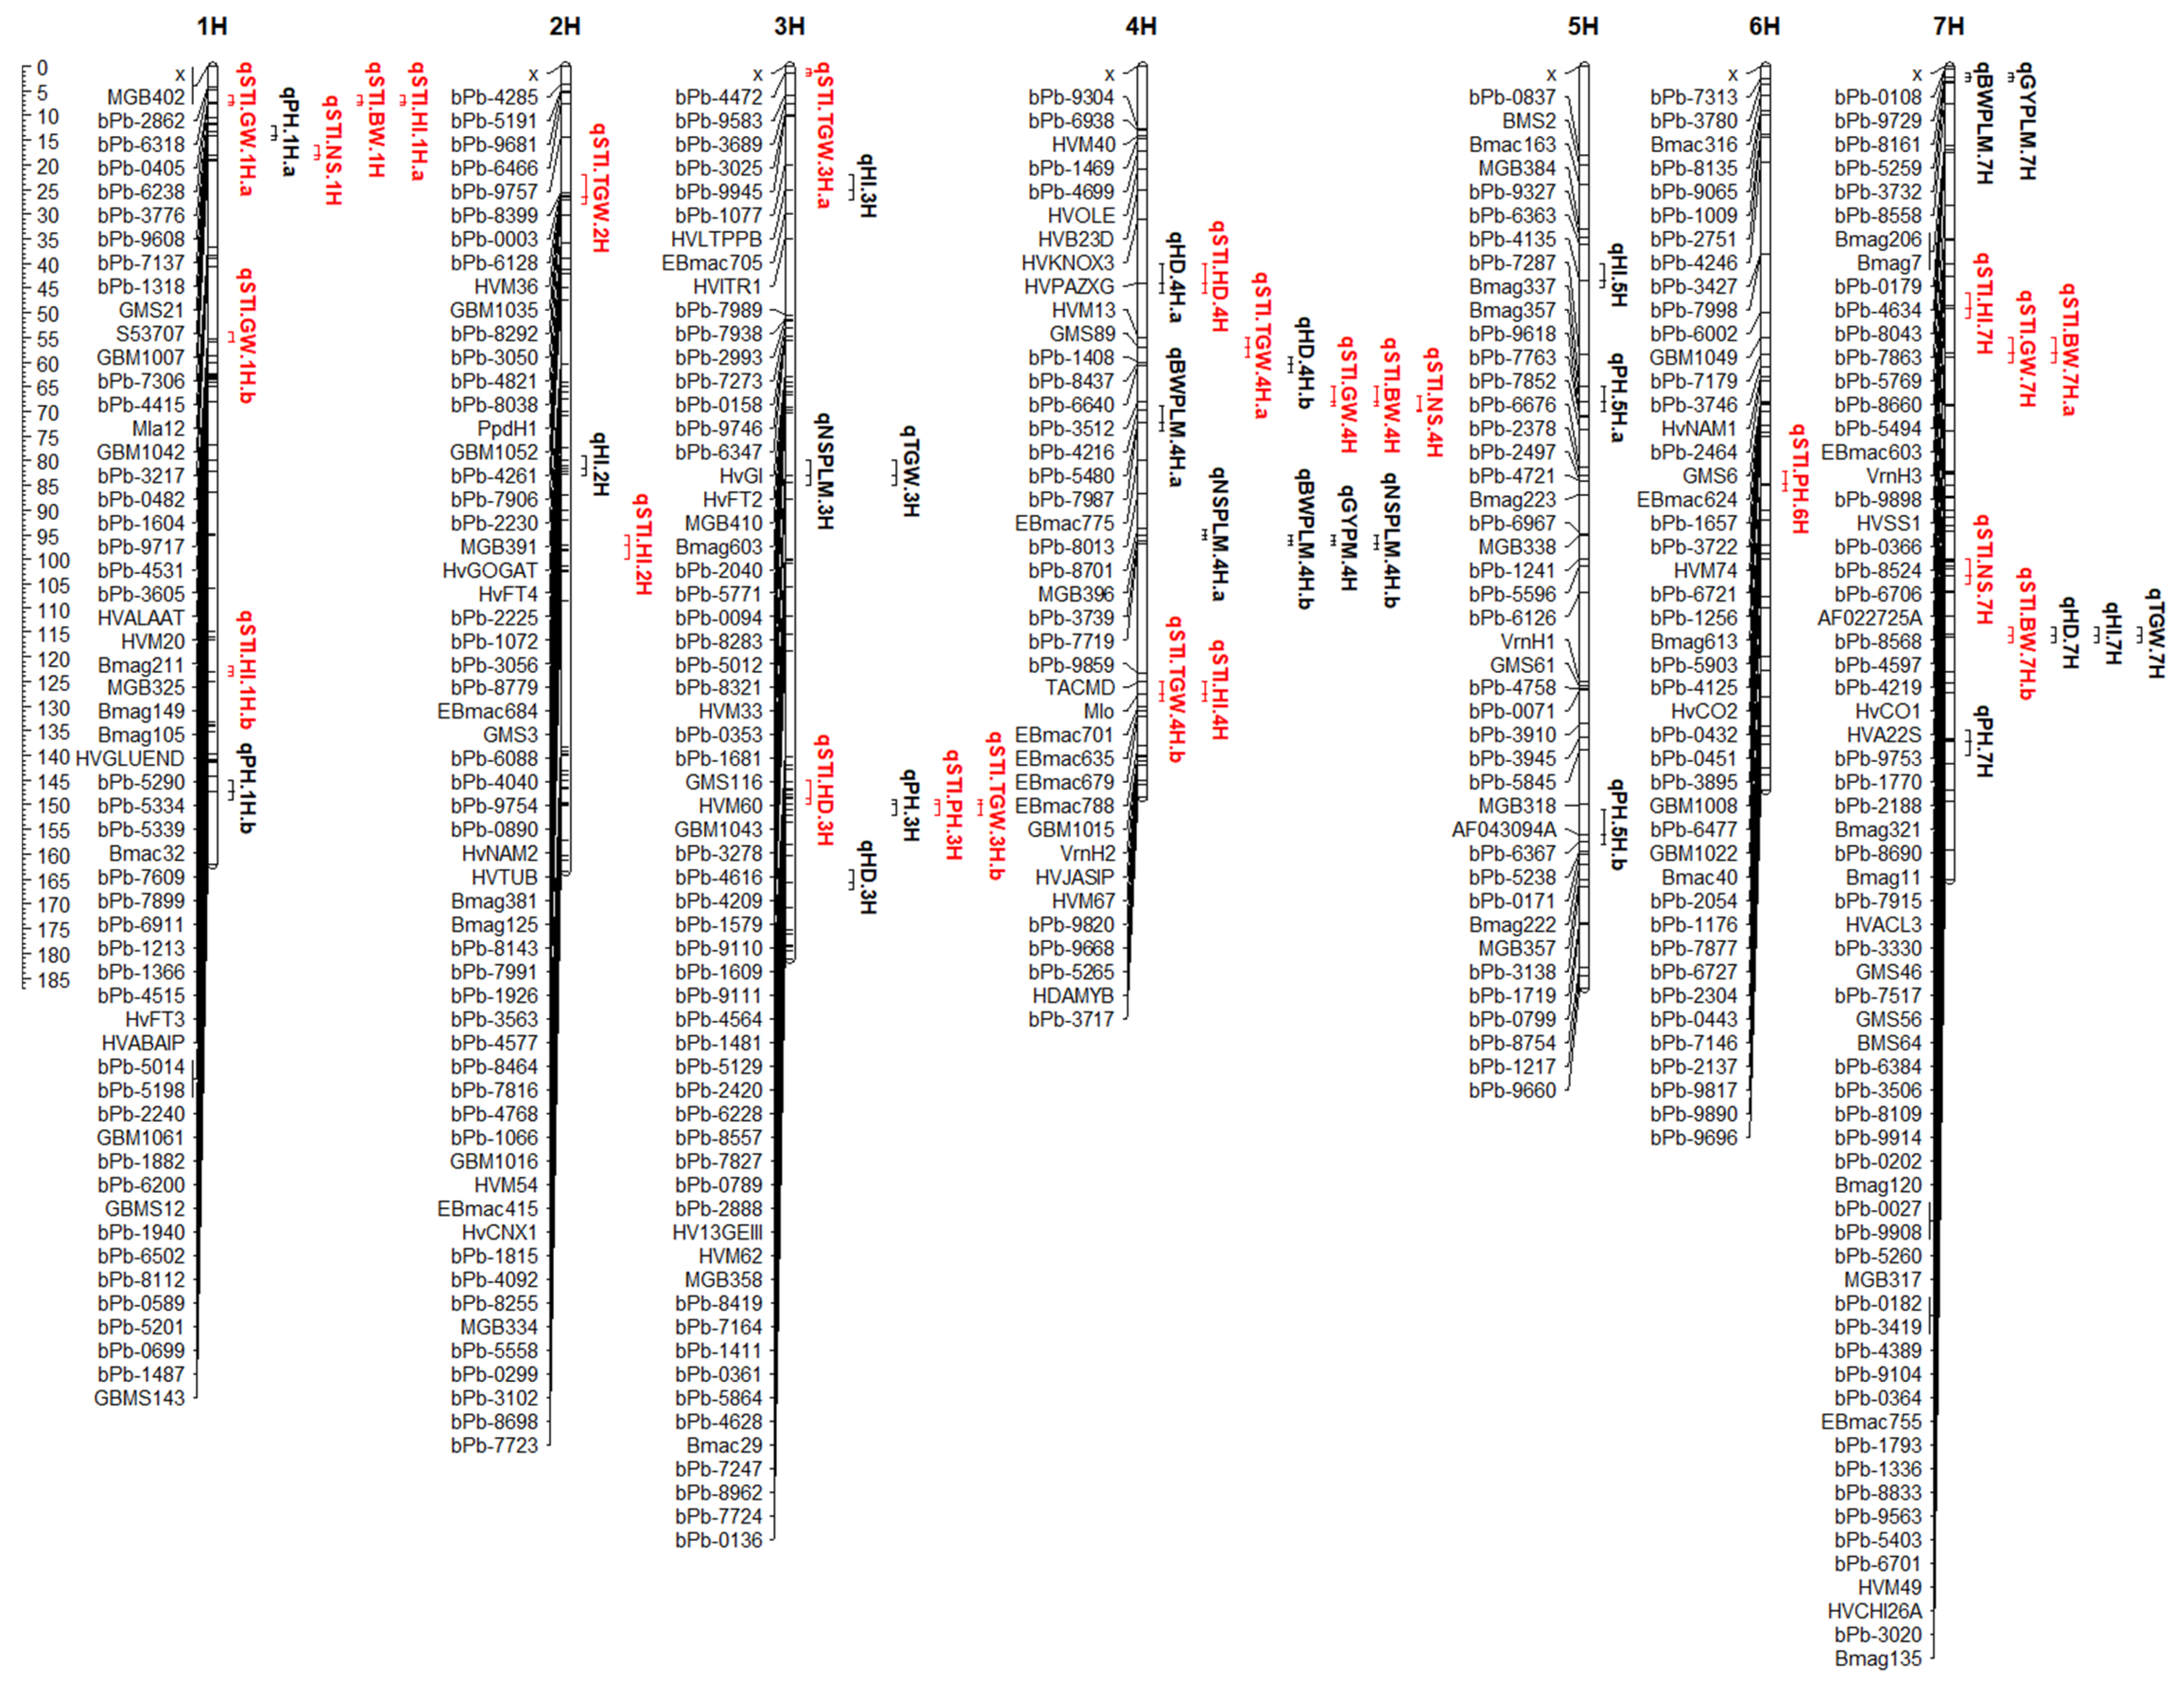
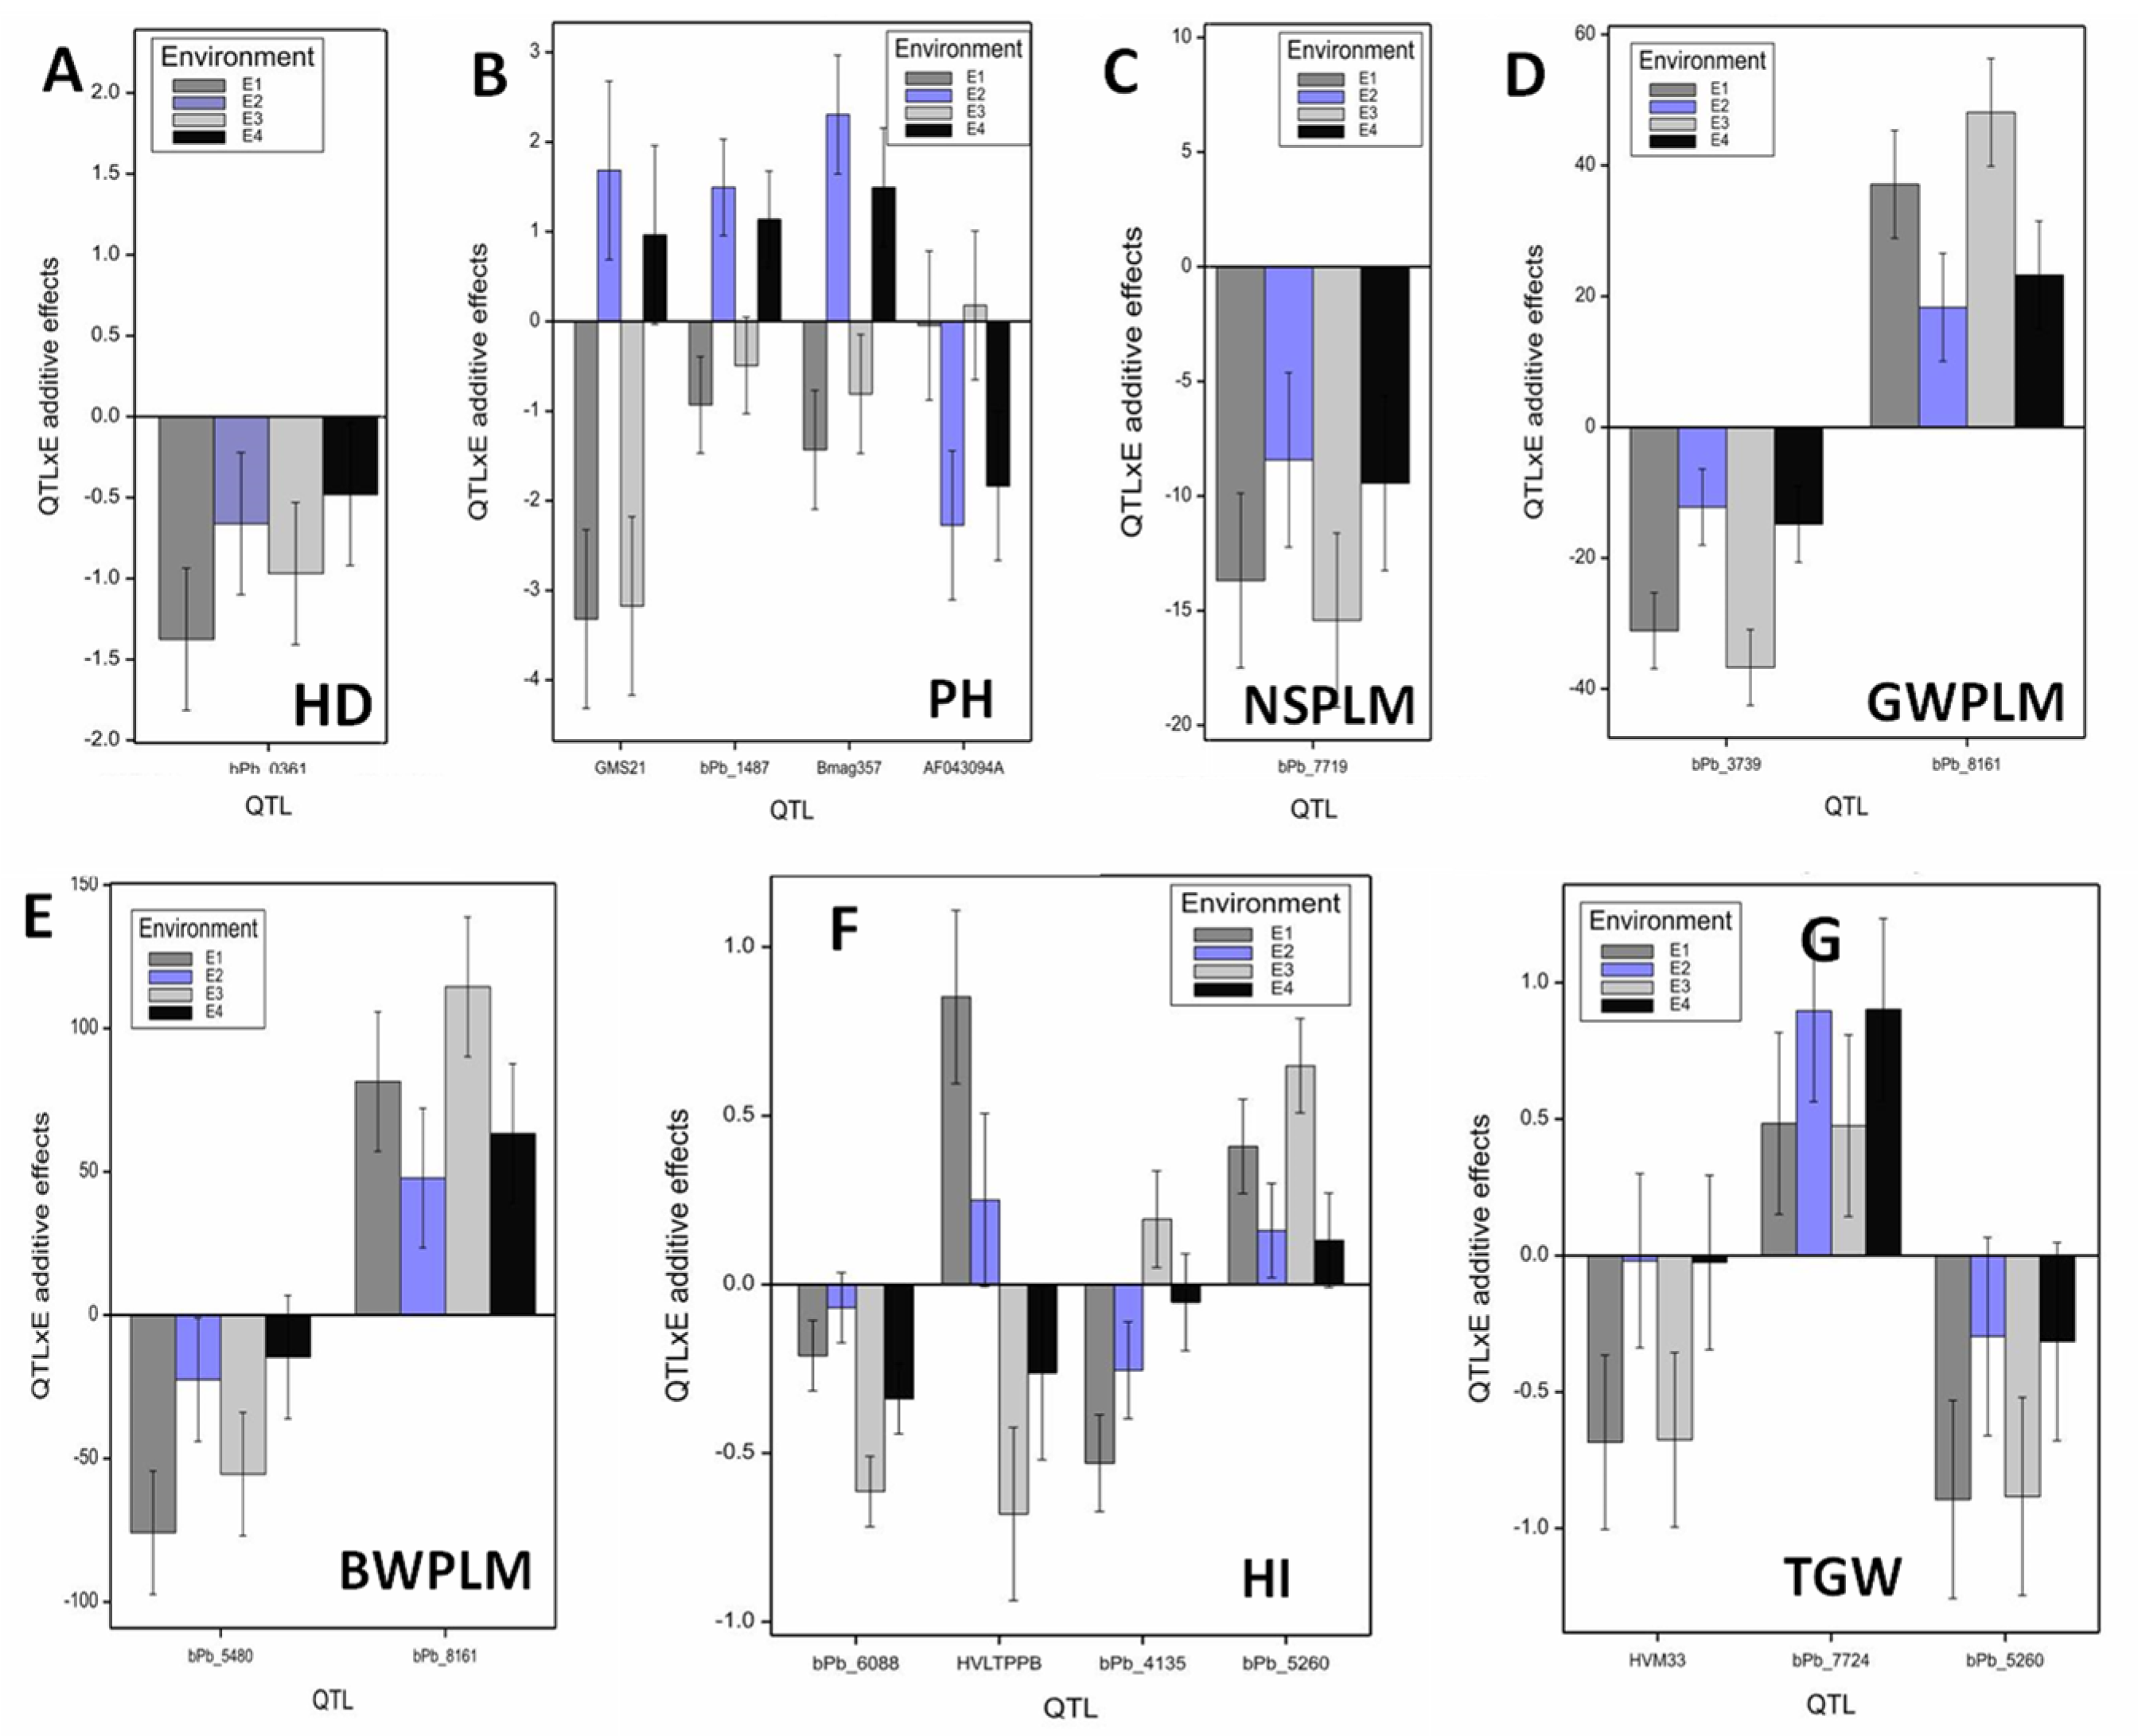
3.2. Identification of QTL

A total of 25 putative QTL marker main effects and marker × environments additive interactions were detected for seven measured traits across two salinity levels and over two seasons (Table 4 and Figure 1). The detected QTL were mapped on all chromosomes of barley except 6H. Among these loci, eight (32%) QTL showed a marker main effect, twelve (48%) QTL showed marker × environment additive interaction effects (Figure 2), and five (20%) QTL showed both effects. Four QTL were identified for HD and mapped on 3H, 4H, 5H, and 7H. In addition, the QTL qHD.3H displayed QTL by environment additive interaction effects (Figure 2A). The exotic alleles showed a desirable performance in terms of reducing days to heading at this locus. Three QTL showed QTL additive main effects, and the strongest QTL was at marker locus bPb-5260 (7H, 115.6 cM) and explained 9.49% of the phenotypic variance. Three chromosomal regions were responsible for reducing HD due to the presence of the elite alleles. The QTL analysis revealed six QTL for PH, localized on chromosomes 1H, 3H, 5H and 7H. Four regions showed QTL by environment additive interaction effects (Figure 2B) and two showed QTL with additive main effect. The strongest QTL effect, qPH.3H was detected on 3H where an exotic allele accounted for 22.51% of the phenotypic variance.
Three QTL for NSPLM were identified on chromosomes 3H and 4H. The marker locus bPb-7719 (4H, 96.78 cM) showed a QTL × E additive interaction effect (Figure 2C) and explained 3.40% of the phenotypic variance. At this region, the elite alleles exhibited desirable performance in increasing NSPLM under higher salinity levels. The SSR markers HVM33 (3H, 83 cM) and MGB396 (4H, 95 cM) exhibited QTL main additive effects and accounted for 1.48 and 6.66% of the total variance, respectively. High additive values were detected for both QTL, since the exotic and elite alleles led to an increase of the NSPLM in the DHLs carrying these alleles under salinity conditions. Additionally, two significant QTL qGWPM.4H and qGWPM.7H control GWPLM and were found on 4H and 7H, with the nearest markers bPb-3739 and bPb-8161, respectively. Both regions showed QTL main additive and QTL × E additive interaction effects (Figure 2D) of 23.71 and 31.70, respectively. Interestingly, at these loci, the elite and exotic alleles showed desirable performances in increasing GWPLM under higher salinity levels (Table S5).
Three QTL for biological weight per linear meter were detected on chromosomes 4H and 7H. The marker locus bPb-5480 (4H, 72.2 cM) showed QTL × E additive interaction effects (Figure 2E) and explained 3.20% of the phenotypic variance. In addition, a QTL placed on 7H with the nearest marker of bPb-8161 was associated with BWPLM, and showed both effects. Four QTL for HI were identified on chromosomes 2H, 3H, 5H, and 7H. The marker loci bPb-6088 (2H, 81.7 cM) and bPb-5260 (7H, 115.6 cM) showed QTL main additive and QTL × E additive interaction effects (Figure 2F), and explained 4.80 and 4.58% of the phenotypic variance, respectively. Three QTL for TGW were mapped on chromosomes 3H and 7H, and showed QTL × E additive effects (Figure 2G). The elite alleles exhibited a desirable performance in increasing TGW under salinity levels at the marker loci HVM33 (3H, 83 cM) and bPb-5260 (7H, 115.6 cM), whereas at the marker locus bPb-7724 (3H, 179.5 cM), the exotic alleles showed preferable performance for TGW under salinity conditions.
Altogether, 24 QTL were detected for the STI of the measured traits, distributed on all chromosomes except 5H (Table 5 and Figure 1). Two QTL, qSTI.HD.3H and qSTI.HD.4H, controlling the STI (HD), were mapped on 3H and 4H, with the nearest markers bPb-0789 and HVPAZXG, and were affected by the presence of Scarlett and ISR 42-8 alleles, respectively. Two QTL as main additive effects were detected for the STI (PH) and located on 3H and 6H, since the exotic alleles contributed to both QTL. For NSPLM, three QTL were identified for the STI of this trait and placed on 1H, 4H, and 7H. The SSR marker S53707 (1H, 18 cM) showed QTL × E additive interactions and accounted for 9.1% of the phenotypic variance. Four QTL were detected for the STI (GWPLM) and located on 1H, 4H, and 7H. The marker loci bPb-0405 (1H, 7.21 cM) and bPb-1604 (1H, 55.77 cM) exhibited QTL × E additive interaction and main effects, respectively. The exotic alleles contributed to these QTL and explained 17.8 and 8.7% of the phenotypic variance, respectively. Four QTL identified for the STI (BWPLM) were located on 1H, 4H, and 7H. The marker loci bPb-0405 (1H, 7.21 cM) and bPb-6706 (7H, 58.17 cM) exhibited QTL × E additive effects. The exotic alleles contributed to these QTL and explained 16 and 15.4% of the phenotypic variance, respectively. Five QTL were mapped on 1H, 2H, 4H, and 7H, and associated with the STI (HI). The strongest QTL was qSTI.HI.7H, with the nearest SSR marker HVSS1 (7H, 49 cM), and explain 20.4% of the phenotypic variance. This QTL showed QTL × E additive interaction effects and was influenced by the presence of exotic alleles. Four QTL were detected for the STI (TGW) and located on chromosomes 2H, 3H, and 4H. Three QTL out of them showed QTL × E additive interaction effects and explained R2 values ranging from 3 to 7.8%.

3.3. Co-Location of QTL under Salinity Conditions

Altogether, ten QTL displayed pleiotropic effects, are presented in Table S6. A genomic region on chromosome 1H at marker locus position bPb_0405 (7.21 cM) harbors three co-located QTL, which were qSTI.GY.1H.a, qSTI.BY.1H, and qSTI.HI.1H.a. Exotic alleles contributed to these QTL. Furthermore, a genomic region of 3H at position 83 cM carries two co-located QTL, including qNSPM.3H and qTGW.3H.a. Another genomic position on 3H at marker locus HV13GEIII (150 cM) harbors three co-located QTL which were qSTI.PH.3H, qSTI.TGW.3H.b, and qPH.3H. Four genomic regions on chromosomes 4H carry two co-located QTL for each. Additionally, three genomic regions showed co-located QTL on chromosome 7H. Significant QTL for days to heading, plant height, harvest index, STI (BYPM), and 1000-grain weight under both conditions were found to co-localize on specific regions at marker locus bPb-5260 (7H, 115.6 cM). The elite alleles at this genomic region tend to increase both days to heading, 1000-grain weight, and STI of the biological weight under salinity conditions. For harvest index, we found that exotic alleles were associated with an increasing harvest index under both salinity levels, since this QTL showed QTL × E additive and main additive effects.

4. Discussion

4.1. The Barley Population’s Wild Genetic Background and Salinity Tolerance

Barley is one of the most salinity tolerant cereal crops [29], and exhibits a wide genetic variation [30]. However, improvement of salinity tolerance is still an important target for barley breeding, especially in arid and semi-arid regions. Soil salinity and/or salty irrigation water is one of the constraints facing barley production in Egypt. Moreover, the lack of suitable barley cultivars, especially for high salinity soils and newly reclaimed land, is considered another important constraint. The wild barley Hordeum vulgare ssp. spontaneum is still widely distributed in the extremely dry areas of the Fertile Crescent Mediterranean region, and penetrates into desert environments [31]. It has the potentiality of adaptive genetic diversity against biotic and abiotic stresses, which could be used as a source for salt- and drought-resistant alleles for breeding purposes [32]. Therefore, we evaluated an advanced backcross (AB) mapping population of barley in newly reclaimed soil under two salinity levels from groundwater aquifers in the south of Sinai. We aimed to identify novel and beneficial QTL alleles for salinity tolerance, and to introduce them into newly released barley cultivars. Significant differences were observed between the two wells, and both salinity levels significantly affected all studied traits in both growing seasons. We observed a clear significant reduction in all measured traits with increasing salinity stress. For instance, the average grain weight was reduced by 57.8%, while heading date was reduced by 9.65%, due to increasing salinity stress from 9.35 to 13.5 ds/m. This result is logical, because both salinity levels are considered extremely stressful conditions.

4.2. Stress Tolerance Index and Heritability

Furthermore, a highly significant variation was noted among the BC2DH lines for salinity tolerance, since a wide range was observed for all studied traits under both salinity levels. The transgressive segregation which was observed among the DHLs of the S42 population indicates the quantitative inheritance of investigated traits among the segregating population, derived from genetically contrasting parents. Transgressive segregation in barley and other crops is commonly observed in segregating populations for quantitative traits [33]. In addition, trait associations and moderate to high broad sense heritability estimates were observed in the current study, reflecting the size of variation in the population; providing information on the magnitude of the inheritance of quantitative traits could obtain the best predictors of yield under high stress conditions [13,34]. This result suggests that the phenotypic expression of one genotype that can be superior to another at the same salinity level, but inferior at the second level of salinity, and this consequently affects heritability estimates. Our findings agreed with other reports, where high heritability estimate values were observed under adverse conditions [35,36,37,38]. Many reports confirmed that the salt-tolerance index is a better selection tool for highly salt-tolerant and productive genotypes under salinity [13,37,38]. Where STI takes into consideration trait of interest performance of the genotype under both of control and salt conditions, which allowing to identify the genotypes that perform well under both of conditions [13]. We applied the STI for both seasons, and we found that the DHLs SI001, SI043, SI044, SI028, SI242, SI035, and SI005 had the highest STI values based on grain weight average. This finding suggests that these doubled haploid lines possess sufficient plasticity to respond to soil and water salinity constraints, as well as implying significant salt tolerance mechanisms. The results are in accordance with those obtained by Thabet et al. [37] and Mwando et al. [38]. On the other hand, twenty-six QTL were detected for the STI of the measured traits and covered the whole genome except chromosome 5H. More than half of the detected QTL for the STI showed main additive effects, revealing genetic regions with stable effects under different environmental conditions. Additionally, different loci showed pleiotropic effects with the salinity tolerance index of several traits. In addition, exotic and elite parental alleles contributed to increasing the STI for all studied traits, but further studies are required to understand and validate the effect of these markers. Consistent with our results, Mwando et al. [39]. Identified 19 the QTL for salinity tolerance index of germination across the barley genome.

4.3. Candidate Genes with Potential Functions and Corresponding QTL under Salinity Stress

We performed a BLAST search in the Ensemble Plants barley database to identify the genes co-segregated with the significant QTL detected in this study [40]. Several genomic regions were overlapped or located very close to candidate genes (Tables S7 and S8). The most important gene, HORVU7Hr1G100410, has been annotated as within the MFS transporter superfamily (The Major Facilitator Superfamily), accounting for the variation of grain and biological weights under high salinity conditions. MFS transporters can play important determinant roles in plant tolerance to environmental stresses, such as salinity, drought, and heavy metals [41,42,43], through proteins that function as transporters for a range of solutes, including micro- and macroelements [15,44]. In addition, we found that the pleiotropic locus bPb-8161 on 7H (2.22 cM) govern grain and biological weight, which was most closely associated with the DArT marker bPb-1209 and the SSR marker GBM1519 detected by Shavrukov et al. [15]. Interestingly, our detected locus was closely linked to the major salinity tolerant gene HvNax3 (1.3-cM, 7H) reported by Shavrukov et al. [45], which reduced shoot Na+ accumulation by 10–25% in barley plants grown in 150 mM NaCl. At both loci, wild accession alleles contributed to the salinity tolerance by limiting Na+ accumulation in the shoots under saline conditions. Additionally, Fan et al. [46] detected a locus on 7H, but at different position, and nearest to the marker bPb-6821 (82.3 cM) linked to salt tolerance in our study. Further, Gorham et al. [47] suggested that barley chromosomes 6H and 7H could enhance Na+ exclusion or K+/Na+ ratios in the barley background. One of the strategies to avoid Na+ toxicity in plants is sequestering excess Na+ in the vacuoles, or by reducing net Na+ entry into the transpiration stream and subsequent accumulation in vegetative tissues [48]. Again, a specific region at marker locus bPb-5260 (115.6 cM) on 7H was the most important region, showing colocation with several traits, since it governed HD, PH, HI, TGW, and STI(BY). Forster [49] found mutations on 5H at the Eri-e locus, where the semidwarf growth habit was associated with low shoot Na+ accumulation. We reported significant QTL associated with yield attributes on chromosomes 3H, 4H and 7H, like number of spikes, biological yield, harvest index, and 1000-grain weight. Forster et al. [50] detected QTL for growth and yield traits on barley chromosomes 4H and 5H under saline conditions.
Similarly, the SSR markers Bmag357 (68 cM) and AF043094A (156 cM) on 5H controlling plant height were associated with salt tolerance in barley. At the marker locus AF043094A, the gene HORVU5Hr1G103460 annotates dehydrins (DHNs), or group 2 LEA (Late Embryogenesis Abundant) proteins, which play fundamental roles in plant responses and adaptation to abiotic stresses. Moreover, exotic alleles contribute at this locus, and may contain one of the dehydrin genes which already exist in H. spontaneum [32]. In a study by von Korff et al. [51], it was found that the SSR marker HVABAIP (1H, 116 cM) corresponded to the vernalization gene Vrn-H3 published by Laurie et al. [52]. This SSR marker was associated with reduced HD under salinity conditions in the current study. Additionally, the SSR marker HV13GEIII (3H, 150cM) controls PH under salinity conditions; this marker corresponds to the denso dwarfing gene, as reported by von Korff et al. [51]. Zhou et al. [53] detected QTL for salinity tolerance in barley which correspond to vernalization genes; some of these were close to detected QTL in the current study. The findings obtained here probably reflect the small impact of vernalization, dwarfing, and dehydrin genes on salinity tolerance in the field experiments.

5. Conclusions

Genetic mapping detected significant QTL for biomass production -related traits and the salinity tolerance index of the S42 barley population. Many DHLs showed a remarkable performance for grain weight based on the salt-tolerance index, and they probably possess sufficient plasticity against salinity. In addition, some detected regions annotated unknown proteins, and there is a need for further genomic function investigation to understand and validate the effect of these regions. Chromosomes 4H, 5H, and 7H harbor valuable novel exotic and elite alleles for salinity tolerance, which could be effectively used in breeding programs.

Supplementary Materials

The following are available online at https://0-www-mdpi-com.brum.beds.ac.uk/article/10.3390/agronomy11091774/s1, Table S1: Mean comparison and summary statistics of all studied traits for parents and S42 population under each salinity level and each growing season, Table S2: Reduction percentage (R%) and salinity tolerance index (STI) for parents and S42 population calculated for all studied traits, Table S3: Average of salinity tolerance index (STI) for measured traits across two seasons. Table S4: Correlation coefficients for all studied traits under salinity level 1 (above diagonal) and salinity level 2 (below diagonal) over growing seasons, Table S5: Examples of detected QTL for heading date (HD) and grain weight/lm (GWPLM) showing doubled haploid lines (DHLs) which carrying the elite and exotic alleles. Table S6: Co-location of the detected QTL in current study. Table S7. The functional annotation of some putative candidate genes associated with the studied traits under salinity conditions. Table S8. Chromosome name, chromosomal position (cM), and DNA sequence of the detected QTL related to DArT and SSR markers.

Author Contributions

Conceptualization, M.A.S. and A.B.; Methodology, M.A.S., E.S.M. and S.M.N.; Software, A.B. and M.T.S.; Validation, M.A.S. and A.B.; Formal Analysis, M.A.S. and A.H.; Investigation, E.S.M. and S.M.N.; Resources, M.A.S. and A.B.; Data Curation, M.A.S., E.S.M. and S.M.N.; Writing—Original Draft Preparation, M.A.S. and A.B.; Writing—Review & Editing, M.A.S., A.B. and A.H.; Visualization, M.A.S.; Project Administration, M.A.S., E.S.M. and S.M.N. All authors have read and agreed to the published version of the manuscript.

Funding

This research received no external funding.

Institutional Review Board Statement

Not applicable.

Informed Consent Statement

Informed consent was obtained from all authors involved in the study.

Data Availability Statement

The data presented in this study are available in supplementary materials.

Acknowledgments

A special thanks to the Institute of Crop Science and Resource Conservation, Plant Breeding Department, University of Bonn, for providing seed material of S42 population. A sincere gratitude to the Ministry of Higher Education and Assiut University, Arab Republic of Egypt for the award of fully funded postdoctoral scholarship. The publication of this article was funded by the Open Access Fund of the Leibniz Association.

Conflicts of Interest

The authors declare no conflict of interest exists.

References

  1. Dai, H.; Shan, W.; Zhao, J.; Zhang, G.; Li, C.; Wu, F. Difference in response to aluminum stress among Tibetan wild barley genotypes. J. Plant Nutr. Soil Sci. 2011, 174, 952–960. [Google Scholar] [CrossRef]
  2. Islam, F.; Wang, J.; Farooq, M.A.; Yang, C.; Jan, M.; Mwamba, T.M.; Hannan, F.; Xu, L.; Zhou, W. Rice Responses and Tolerance to Salt Stress: Deciphering the Physiological and Molecular Mechanisms of Salinity Adaptation; Woodhead Publishing: Cambridge, UK; Elsevier: Amsterdam, The Netherlands, 2018; ISBN 9780128143322. [Google Scholar]
  3. Hassani, A.; Azapagic, A.; Shokri, N. Predicting long-term dynamics of soil salinity and sodicity on a global scale. Proc. Natl. Acad. Sci. USA 2021, 117, 33017–33027. [Google Scholar] [CrossRef] [PubMed]
  4. Sanower Hossain, M.; Sultan Ahmad Shah, J. Present Scenario of Global Salt Affected Soils, its Management and Importance of Salinity Research. Int. Res. J. Biol. Sci. Perspect. 2019, 1, 2663–5976. [Google Scholar]
  5. Abdel-Shafy, H.I.; Kamel, A.H. Groundwater in Egypt issue: Resources, location, amount, contamination, protection, renewal, future overview. Egypt. J. Chem. 2016, 59, 321–362. [Google Scholar] [CrossRef] [Green Version]
  6. Xu, G.; Zhang, Y.; Sun, J.; Shao, H. Negative interactive effects between biochar and phosphorus fertilization on phosphorus availability and plant yield in saline sodic soil. Sci. Total Environ. 2016, 568, 910–915. [Google Scholar] [CrossRef] [PubMed]
  7. Noaman, M.M.; El-Banna, M.N.; El-Gawad Nassar, M.A.A.; Boseely, M.A.E.-A. Evaluation of 16 Barley Genotypes under Calcareous Soil Conditions in Egypt. J. Agric. Sci. 2011, 3, 105. [Google Scholar] [CrossRef] [Green Version]
  8. Ouda, S.; Ewise, M.; Noreldin, T. Projection of productivity of cultivated crops in rain-fed areas in Egypt under climate change. Cogent Food Agric. 2016, 2, 1136256. [Google Scholar] [CrossRef]
  9. Dai, F.; Nevo, E.; Wu, D.; Comadran, J.; Zhou, M.; Qiu, L.; Chen, Z.; Beiles, A.; Chen, G.; Zhang, G. Tibet is one of the centers of domestication of cultivated barley. Proc. Natl. Acad. Sci. USA 2012, 109, 16969–16973. [Google Scholar] [CrossRef] [Green Version]
  10. Zohary, D.; Hopf, M. Domestication of Plants in the Old World: The Origin and Spread of Cultivated Plants in West Asia, Europe, and the Nile Valley; OUP E-Books; Oxford University Press: New York, NY, USA, 2000; ISBN 9780198503576. [Google Scholar]
  11. Qiu, L.; Wu, D.; Ali, S.; Cai, S.; Dai, F.; Jin, X.; Wu, F.; Zhang, G. Evaluation of salinity tolerance and analysis of allelic function of HvHKT1 and HvHKT2 in Tibetan wild barley. Theor. Appl. Genet. 2011, 122, 695–703. [Google Scholar] [CrossRef]
  12. Ashraf, M.Y.; Akhter, K.; Hussain, F.; Iqbal, J. Screening of different accessions of three potential grass species from cholistan desert for salt tolerance. Pakistan J. Bot. 2006, 38, 1589–1597. [Google Scholar]
  13. Allel, D.; Benamar, A.; Badri, M.; Abdelly, C. Evaluation of salinity tolerance indices in north african barley accessions at reproductive stage. Czech J. Genet. Plant Breed. 2019, 55, 61–69. [Google Scholar] [CrossRef] [Green Version]
  14. Roy, S.J.; Tucker, E.J.; Tester, M. Genetic analysis of abiotic stress tolerance in crops. Curr. Opin. Plant Biol. 2011, 14, 232–239. [Google Scholar] [CrossRef] [PubMed]
  15. Shavrukov, Y.; Bovill, J.; Afzal, I.; Hayes, J.E.; Roy, S.J.; Tester, M.; Collins, N.C. HVP10 encoding V-PPase is a prime candidate for the barley HvNax3 sodium exclusion gene: Evidence from fine mapping and expression analysis. Planta 2013, 237, 1111–1122. [Google Scholar] [CrossRef] [PubMed]
  16. Mano, Y.; Takeda, K. Mapping quantitative trait loci for salt tolerance at germination and the seedling stage in barley (Hordeum vulgare L.). Euphytica 1997, 94, 263–272. [Google Scholar] [CrossRef]
  17. Von Korff, M.; Wang, H.; Léon, J.; Pillen, K. Development of candidate introgression lines using an exotic barley accession (Hordeum vulgare ssp. spontaneum) as donor. Theor. Appl. Genet. 2004, 109, 1736–1745. [Google Scholar] [CrossRef] [PubMed]
  18. Wang, G.; Schmalenbach, I.; von Korff, M.; Léon, J.; Kilian, B.; Rode, J.; Pillen, K. Association of barley photoperiod and vernalization genes with QTLs for flowering time and agronomic traits in a BC2DH population and a set of wild barley introgression lines. Theor. Appl. Genet. 2010, 120, 1559–1574. [Google Scholar] [CrossRef] [PubMed] [Green Version]
  19. Sayed, M.A.; Schumann, H.; Pillen, K.; Naz, A.A.; Léon, J. AB-QTL analysis reveals new alleles associated to proline accumulation and leaf wilting under drought stress conditions in barley (Hordeum vulgare L.). BMC Genet. 2012, 13, 61. [Google Scholar] [CrossRef] [Green Version]
  20. Moustafa, E.S.A.; El-Sobky, E.S.E.A.; Farag, H.I.A.; Yasin, M.A.T.; Attia, A.; Rady, M.O.A.; Awad, M.F.; Mansour, E. Sowing date and genotype influence on yield and quality of dual-purpose barley in a salt-affected arid region. Agronomy 2021, 11, 717. [Google Scholar] [CrossRef]
  21. Jackson, M.L. Soil Chemical Analysis; Prentice Hall Inc.: Englewood Cliffs, NJ, USA, 1958; Volume 498, pp. 183–204. [Google Scholar]
  22. Zhang, H.; Schroder, J.L.; Pittman, J.J.; Wang, J.J.; Payton, M.E. Soil Salinity Using Saturated Paste and 1:1 Soil to Water Extracts. Soil Sci. Soc. Am. J. 2005, 69, 1146–1151. [Google Scholar] [CrossRef]
  23. SAS Institute. The SAS System for Windows; Release 9.2; SAS Inst.: Cary, NC, USA, 2011; Available online: http://www.sciepub.com/reference/166089 (accessed on 4 July 2021).
  24. Padi, F.K. Genotype × environment interaction and yield stability in a cowpea-based cropping system. Euphytica 2007, 158, 11–25. [Google Scholar] [CrossRef]
  25. Singh, R.K.; Chaudhary, B.D. Biometrical Methods in Quantitative Genetic Analysis; Kalyani Publishers: Ludhiana, India, 1979. [Google Scholar]
  26. Fernandez, G.C.J. Effective selection criteria for assessing plant stress tolerance. In Proceedings of the International Symposium on Adaptation of Vegetables and other Food Crops in Temperature and Water Stress, Shanhua, Taiwan, 13–16 August 1992; pp. 257–270. [Google Scholar] [CrossRef]
  27. Payne, R.W.; Murray, D.A.; Harding, S.A.; Baird, D.B.; Soutar, D.M. Genstat® for WindowsTM, 15th ed.; VSN International Ltd.: Oxford, UK, 2012. [Google Scholar]
  28. Voorrips, R.E. MapChart: Software for the graphical presentation of linkage maps and QTLs. J. Hered. 2002, 93, 77–78. [Google Scholar] [CrossRef] [Green Version]
  29. Lacolla, G.; Cucci, G. Reclamation of sodic-saline soils. Barley crop response. Ital. J. Agron. 2008, 3, 279–286. [Google Scholar] [CrossRef] [Green Version]
  30. Munns, R.; James, R.A.; Läuchli, A. Approaches to increasing the salt tolerance of wheat and other cereals. J. Exp. Bot. 2006, 57, 1025–1043. [Google Scholar] [CrossRef] [Green Version]
  31. Harlan, J.R.; Zohary, D. Distribution of Wild Wheats and Barley. Science 1966, 153, 1074–1080. [Google Scholar] [CrossRef]
  32. Nevo, E.; Chen, G. Drought and salt tolerances in wild relatives for wheat and barley improvement. Plant Cell Environ. 2010, 33, 670–685. [Google Scholar] [CrossRef]
  33. Sayed, M.A.; Hamada, A.; Lèon, J.; Naz, A.A. Genetic mapping reveals novel exotic QTL alleles for seminal root architecture in barley advanced backcross double haploid population. Euphytica 2017, 213, 1–16. [Google Scholar] [CrossRef]
  34. Abd El-Aty, M.; Amer, K.; Eldegwy, I.; El-Akhdar, A. Genetic Studies on Yield and Its Components in Some Barley Crosses. J. Plant Prod. 2011, 2, 1537–1550. [Google Scholar] [CrossRef] [Green Version]
  35. Saade, S.; Brien, C.; Pailles, Y.; Berger, B.; Shahid, M.; Russell, J.; Waugh, R.; Negrão, S.; Tester, M. Dissecting new genetic components of salinity tolerance in two-row spring barley at the vegetative and reproductive stages. PLoS ONE 2020, 15, e0236037. [Google Scholar] [CrossRef]
  36. Jabbari, M.; Fakheri, B.A.; Aghnoum, R.; Darvishzadeh, R.; Mahdi Nezhad, N.; Ataei, R.; Koochakpour, Z.; Razi, M. Association analysis of physiological traits in spring barley (Hordeum vulgare L.) under water-deficit conditions. Food Sci. Nutr. 2021, 9, 1761–1779. [Google Scholar] [CrossRef]
  37. Thabet, S.G.; Moursi, Y.S.; Sallam, A.; Karam, M.A.; Alqudah, A.M. Genetic associations uncover candidate SNP markers and genes associated with salt tolerance during seedling developmental phase in barley. Environ. Exp. Bot. 2021, 188, 104499. [Google Scholar] [CrossRef]
  38. Mwando, E.; Angessa, T.T.; Han, Y.; Zhou, G.; Li, C. Quantitative Trait Loci Mapping for Vigour and Survival Traits of Barley Seedlings after Germinating under Salinity Stress. Agronomy 2021, 11, 103. [Google Scholar] [CrossRef]
  39. Mwando, E.; Han, Y.; Angessa, T.T.; Zhou, G.; Hill, C.B.; Zhang, X.Q.; Li, C. Genome-Wide Association Study of Salinity Tolerance During Germination in Barley (Hordeum vulgare L.). Front. Plant Sci. 2020, 11, 212–226. [Google Scholar] [CrossRef] [Green Version]
  40. Hordeum_Vulgare–Ensembl Genomes 51. Available online: https://plants.ensembl.org/Hordeum_vulgare/Info/Index (accessed on 1 August 2021).
  41. Oyiga, B.C.; Palczak, J.; Wojciechowski, T.; Lynch, J.P.; Naz, A.A.; Léon, J.; Ballvora, A. Genetic components of root architecture and anatomy adjustments to water-deficit stress in spring barley. Plant Cell Environ. 2020, 43, 692–711. [Google Scholar] [CrossRef] [PubMed]
  42. Zhang, H.-X.; Blumwald, E. Transgenic salt-tolerant tomato plants accumulate salt in foliage but not in fruit. Nat. Biotechnol. 2001, 19, 765–768. [Google Scholar] [CrossRef] [PubMed]
  43. Remy, E.; Niño-González, M.; Godinho, C.P.; Cabrito, T.R.; Teixeira, M.C.; Sá-Correia, I.; Duque, P. Heterologous expression of the yeast Tpo1p or Pdr5p membrane transporters in Arabidopsis confers plant xenobiotic tolerance. Sci. Rep. 2017, 7, 1–14. [Google Scholar] [CrossRef] [Green Version]
  44. Niño-González, M.; Novo-Uzal, E.; Richardson, D.N.; Barros, P.M.; Duque, P. More Transporters, More Substrates: The Arabidopsis Major Facilitator Superfamily Revisited. Mol. Plant 2019, 12, 1182–1202. [Google Scholar] [CrossRef] [Green Version]
  45. Vysotskaya, L.; Hedley, P.E.; Sharipova, G.; Veselov, D.; Kudoyarova, G.; Morris, J.; Jones, H.G. Effect of salinity on water relations of wild barley plants differing in salt tolerance. AoB Plants 2010, 2010, plq006. [Google Scholar] [CrossRef]
  46. Fan, Y.; Shabala, S.; Ma, Y.; Xu, R.; Zhou, M. Using QTL mapping to investigate the relationships between abiotic stress tolerance (drought and salinity) and agronomic and physiological traits. BMC Genom. 2015, 16, 1–11. [Google Scholar] [CrossRef] [Green Version]
  47. Gorham, J. Salt tolerance in the triticeae: K/Na discrimination in Aegilops species. J. Exp. Bot. 1990, 41, 615–621. [Google Scholar] [CrossRef]
  48. Shavrukov, Y.; Gupta, N.K.; Miyazaki, J.; Baho, M.N.; Chalmers, K.J.; Tester, M.; Langridge, P.; Collins, N.C. HvNax3—A locus controlling shoot sodium exclusion derived from wild barley (Hordeum vulgare ssp. spontaneum). Funct. Integr. Genom. 2010, 10, 277–291. [Google Scholar] [CrossRef]
  49. Forster, B.P. Mutation genetics of salt tolerance in barley: An assessment of Golden Promise and other semi-dwarf mutants. Euphytica 2001, 120, 317–328. [Google Scholar] [CrossRef]
  50. Forster, B.P.; Phillips, M.S.; Miller, T.E.; Baird, E.; Powell, W. Chromosome location of genes controlling tolerance to salt (NaCl) and vigour in hordeum vulgare and H. chilense. Heredity 1990, 65, 99–107. [Google Scholar] [CrossRef] [Green Version]
  51. Von Korff, M.; Wang, H.; Léon, J.; Pillen, K. AB-QTL analysis in spring barley: II. Detection of favourable exotic alleles for agronomic traits introgressed from wild barley (H. vulgare ssp. spontaneum). Theor. Appl. Genet. 2006, 112, 1221–1231. [Google Scholar] [CrossRef] [Green Version]
  52. Laurie, D.A.; Pratchett, N.; Bezant, J.H.; Snape, J.W. RFLP mapping of five major genes and eight quantitative trait loci controlling flowering time in a winter X spring barley (Hordeum vulgare L.) cross. Genome 1995, 38, 575–585. [Google Scholar] [CrossRef]
  53. Zhou, G.; Johnson, P.; Ryan, P.R.; Delhaize, E.; Zhou, M. Quantitative trait loci for salinity tolerance in barley (Hordeum vulgare L.). Mol. Breed. 2012, 29, 427–436. [Google Scholar] [CrossRef]
Figure 1. Localization of detected QTL for grain weight and its attributes along with QTL mapped for salinity tolerance index (red color).
Agronomy 11 01774 g001
Figure 2. Detected QTL for measured traits that showed QTL by environment additive interaction under salinity conditions. Where (A) Heading date (HD), (B) Plant height (PH), (C) Number of spikes lm−1 (NSPLM), (D) Grain weight lm−1 (GWPLM), (E) Biological weight lm−1 (BWPLM), (F) Harvest index (HI), and (G) Thousand grain weight (TGW).
Agronomy 11 01774 g002
Table 1. Monthly average maximum temperature (ATmax, °C), minimum temperature (ATmin, °C), frost point (FP, °C), average relative humidity (RH, %) and total rainfall (Train, mm) in the two growing seasons.
2017–20182018–2019
AtmaxAtminFPRH%Prec.AtmaxAtminFPRH%Train
November22.912.68.961.227.423.914.19.858.66.4
December20.711.36.457.80.818.59.67.065.38.5
January17.57.95.866.114.817.47.11.852.60.7
February21.611.25.352.126.718.88.23.654.87.4
March26.312.55.242.50.421.19.24.852.98.2
April27.514.17.946.450.525.312.35.844.51.1
Monthly average weather data and the total rainfall of the experimental site from November to April for the two growing seasons (Weather station, Ras Sudr experimental station).
Table 2. Physical and chemical properties of soil and irrigated water.
CharacteristicsSoilWell 1Well 2
Soil particles distribution
Sand (%)81.53
Silt (%)9.77
Clay (%)8.70
Textural classSandy loam
Calcium carbonate (CaCO3, %)57.99
pH7.87.967.66
Electrical conductivity (dS/m) 8.829.35 (6500 ppm)13.50 (9500 ppm)
Saturation soluble extract cations and anions (mg/100 g)
Calcium (Ca++)25.223.519.3
Magnesium (Mg++)5.714.518.8
Sodium (Na+)57.866.1105.1
Carbonate (CO3=)0.00.00.0
Bicarbonate (HCO3-)6.26.507.5
Chloride (Cl–)61.957.6693.1
Sulphate (SO4=)26.429.2338.7
Table 3. Analysis of variance, genotypic coefficient of variation (GCV%), phenotypic coefficient of variation (PCV%), and broad-sense heritability estimates (H2b) for all studied traits under salinity levels and over growing seasons.
SourceDFHDPHNSPLMGWPLMBWPLMHITGW
Year (Y)1280.56 **10,030 **59,374 **453,690 **4,171,113 **33.81 *251.19 **
Y (Rep)41.3317.9245.82121.213,568.84.329.61
Salinity levels (SL)150,035 **108,881 **4,812,213 **33,022,079 **217,923,213 **11,749 **50,535 **
Y × SL1101.6766.8 *1202.5 *47,309 **183,453 **68.06 **20.51 **
Y × SL (Rep)4244.325.6123.4512.72106.91.780.83
Genotypes (G)302405.50 **586.6 **29,951 **68,532 **580,988 **21.16 **220.7 **
G × Y3024.63 **16.7 **1029.7 **1473.8 **15,905 **7.38 **0.04
G × SL3029.80 **209.6 **2766.8 **13,605 **98,932 **4.0310.33 **
G × Y × SL3021.0017.1 **497.2 **750.2 **6236 **4.870.26
Error24161.182.1548.9861.932807.43.990.235
GCV% 7.9712.4721.3131.9232.233.4511.85
PCV% 8.2315.2423.1135.7536.237.0512.19
Heritability (H2b) 93.9766.9985.0679.7279.1523.9894.51
*, ** Significant at 5% and 1% level of probability, respectively. HD is heading date (days), PH is plant height (cm), NSPLM is number of spikes per linear meter (spikes lm−1), GWPLM is grain weight per linear meter (g lm−1), BWPLM is biological weight per linear meter (g lm−1), HI is harvest index (%), and TGW is thousand grain weight (g).
Table 4. Characterization of detected QTL as marker main- and/or by environments additive effects for measured traits under salinity conditions.
Trait(1) QTL(2) Ch(3) Marker(4) Posi (cM)(5) Effect(6) F-Stat.(7) LOD(8) R2(9) Addi(10) Allele(11) S.E.(12) QTL by E Additive Effects and S.E.(15) S.E.-D
(13) E1E2E3E4
(14) A1R2A2R2A3R2A4R2
HDqHD.3H3HbPb-0361165.5M × E15.1 **11.62.13−0.79ISR 42–80.45−1.324.90−0.571.00−0.912.20−0.380.400.13
qHD.4H.a4HHVPAZXG44.0M10.45 **2.95.20−1.36Scarlett0.42Only main effect
qHD.4H.b4HbPb-664060.5M13.13 **3.55.41−1.35Scarlett0.37Only main effect
qHD.7H7HbPb-5260115.6M14.92 **4.09.49−1.79Scarlett0.46Only main effect
PHqPH.1H.a1HGMS2114M × E21.72 **12.99.480.96Scarlett1.00−3.3217.001.693.60−3.1716.000.961.300.81
qPH.1H.b1HbPb-1487147.2M × E15.03 **8.51.600.30ISR 42–80.54−0.931.301.492.80−0.490.401.141.900.44
qPH.3H3HHV13GEIII150M40.98 **9.222.513.31ISR 42–80.52Only main effect
qPH.5H.a5HBmag35768M × E22.42 **13.23.550.39ISR 42–80.66−1.433.202.316.80−0.811.001.503.200.54
qPH.5H.b5HAF043094A156M × E6.83 **3.82.910.99Scarlett0.83−0.050.02−2.276.600.180.10−1.844.900.67
qPH.7H7HbPb-1793137.2M9.26 **2.66.131.73Scarlett0.567Only main effect
qNSPM.3H3HHVM3383M5.91 *1.81.489.031ISR 42–83.71Only main effect
NSPLMqNSPM.4H.a4HMGB39695M13.14 **3.56.6612.92Scarlett3.56Only main effect
qNSPM.4H.b4HbPb-771996.78M × E5.32 **3.63.409.78Scarlett3.8611.724.106.461.7013.465.307.482.502.19
GWPLMqGWPLM.4H4HbPb-373996.31M, M × E17.79 **13.98.4323.71Scarlett5.80−31.109.0012.206.1036.7211.3014.817.304.15
qGWPLM.7H7HbPb-81612.22M, M × E12.45 **9.415.9831.70ISR 42–88.2437.1312.8018.3213.8048.1119.4023.2417.905.90
BWPLMqBWPLM.4H.a4HbPb-548072.2M × E6.9 **4.83.2042.15Scarlett21.49−75.916.70−22.522.20−55.473.20−14.680.7014.63
qBWPLM.4H.b4HbPb-373996.3M19.98 **5.09.5568.17Scarlett15.25Only main effect
qBWPLM.7H7HbPb-81612.2M, M × E7.51 **5.311.1076.74ISR 42–824.3181.447.7047.779.80114.4513.6063.2813.3016.55
HIqHI.2H2HbPb-608881.7M, M × E10.48 **7.84.800.31 Scarlett0.10−0.211.40−0.070.30−0.619.20−0.348.300.11
qHI.3H3HHVLTPPB25M × E9.08 **6.610.680.04ISR 42–80.260.8522.100.254.30−0.6811.30−0.265.000.27
qHI.5H5HbPb-413543.5M × E6.78 **4.73.530.16 Scarlett0.14−0.538.60−0.254.400.190.90−0.050.200.15
qHI.7H7HbPb-5260115.6M, M × E6.55 **4.54.580.34ISR 42–80.140.415.100.161.700.6510.300.131.200.15
TGWqTGW.3H.a3HHVM3383M × E19.44 **15.31.160.35 Scarlett0.32−0.682.30−0.020.01−0.682.30−0.030.010.11
qTGW.3H.b3HbPb-7724179.5M × E8.30 **6.02.830.69ISR 42–80.330.481.200.904.400.481.200.904.500.11
qTGW.7H7HbPb-5260115.6M × E12.34 **9.32.250.60 Scarlett0.36−0.893.90−0.300.50−0.884.00−0.320.600.12
(1) Description of quantitative trait locus. (2) Chromosome. (3) Linked DNA marker revealing strongest F-value (4) Centimorgan positions of associated DNA marker. (5) Effect of the DNA marker as QTL main additive effect (M) and QTL × Environment additive effect (M × E). (6) F-value. (7) Logarithm of the odds. (8) Genetic variance explained by QTL. (9) The additive effect (10) The contributed allele in the QTL effect. (11) Standard error of the additive effect. (12) QTL × E additive effect in each environment. (13) (salinity levels in each year). (14) Additive effect in each salinity level. (15) S.E. of the additive effect’s differences. *, ** Significant at 0.05 and 0.01 levels of probability; respectively.
Table 5. Characterization of detected QTL as marker main- and/or by environments additive effects for salinity tolerance index of all measured traits.
Trait(1) QTL(2) Chr.(3) Marker(4) Posi (cM)(5) Effect(6) F-Stat.(7) LOD(8) R2(9) Additive(10) Allele(11) S.E.(12) QTL by E Additive Effects and S.E.
(13) Y1R2Y2R2(14) SE. D
HDqSTI.HD.3H3HbPb-0789148.8M × E19.0 **7.18.50.05Scarlett0.013−0.05310.6−0.0416.30.003
qSTI.HD.4H4HHVPAZXG44M × E13.9 **4.22.70.03ISR 42-80.0130.0221.80.0313.50.002
PHqSTI.PH.3H3HHV13GEIII150M15.2 **4.08.70.07ISR 42-80.019Only main effect
qSTI.PH.6H6HbPb-412584.8M13.0 **3.55.50.06ISR 42-80.016Only main effect
NSPLMMqSTI.NSPLM.1H1HS5370718M × E7.9 **3.49.10.06ISR 42-80.0540.17312.40.1085.80.021
qSTI.NSPLM.4H4HbPb-421669.66M13.8 **3.710.5−0.15Scarlett0.041Only main effect
qSTI.NSPLM.7H7HbPb-9914103.37M10.2 **2.97.6−0.13Scarlett0.040Only main effect
GWPLMqSTI.GWPLM.1H.a1HbPb-04057.21M × E9.2 **6.817.80.33ISR 42-80.0930.38120.60.28814.90.022
qSTI.GWPLM.1H.b1HbPb-160455.77M12.0 **2.68.70.23ISR 42-80.077Only main effect
qSTI.GWPLM.4H4HbPb-351267.92M7.0 **3.34.9−0.17Scarlett0.050Only main effect
qSTI.GWPLM.7H7HbPb-670658.17M18.3 **2.114.40.30Scarlett0.113Only main effect
BWPLMqSTI.BWPLM.1H1HbPb-04057.21M × E10.7 **4.716.00.31ISR 42-80.0900.35218.50.26913.50.027
qSTI.BWPLM.4H4HbPb-351267.92M11.3 **3.14.8−0.17Scarlett0.050Only main effect
qSTI.BWPLM.7H.a7HbPb-670658.17M × E7.2 **3.115.40.30ISR 42-80.1130.34918.20.25912.50.034
qSTI.BWPLM.7H.b7HbPb-5260115.56M9.5 **2.75.6−0.18Scarlett0.059Only main effect
HIqSTI.HI.1H.a1HbPb-04057.21M15.74.114.90.04ISR 42-80.009Only main effect
qSTI.HI.1H.b1HbPb-2240123.09M18.0 **4.64.9−0.02Scarlett0.005Only main effect
qSTI.HI.2H2HBmag38197M13.4 **3.64.00.02ISR 42-80.005Only main effect
qSTI.HI.4H4HMlo127.5M17.6 **4.65.80.02ISR 42-80.006Only main effect
qSTI.HI.7H7HHVSS149M × E7.3 **3.220.40.04ISR 42-80.0170.0184.00.06436.80.017
TGWqSTI.TGW.2H2HHVM3626.5M12.4 **3.47.2−0.07Scarlett0.020Only main effect
qSTI.TGW.3H3HbPb-44721.48M × E5.0 *2.23.3−0.05Scarlett0.032−0.0493.4−0.0463.10.001
qSTI.TGW.4H.a4HGMS8957M × E14.4 **6.27.8−0.07Scarlett0.017−0.0747.9−0.0737.70.001
qSTI.TGW.4H.b4HMlo127.5M × E9.1 **4.03.00.05ISR 42-80.0180.0463.10.0452.90.001
(1) Description of quantitative trait locus. (2) Chromosome. (3) Linked DNA marker revealing strongest F-value. (4) Centimorgan positions of associated DNA marker. (5) Effect of the DNA marker as QTL main additive effect (M) and QTL × Environment additive effect (M×E). (6) F-value. (7) Logarithm of the odds. (8) Genetic variance explained by QTL. (9) The additive effect. (10) The contributed allele in the QTL effect. (11) Standard error of the additive effect. (12) QTL × E additive effect in each year. (13) (additive effect of the QTL in investigated years). (14) S.E. of the additive effect’s difference. *, ** Significant at 0.05 and 0.01 levels of probability; respectively.
Publisher’s Note: MDPI stays neutral with regard to jurisdictional claims in published maps and institutional affiliations.

