
Assessing the Adaptive Mechanisms of Two Bread Wheat (Triticum aestivum L.) Genotypes to Salinity Stress

 , ,
, ,  and
and 
Abstract
:1. Introduction
2. Materials and Methods
2.1. Plant Material, Germination Assay, and Stress Conditions
2.2. RNA Isolation and cDNA Synthesis
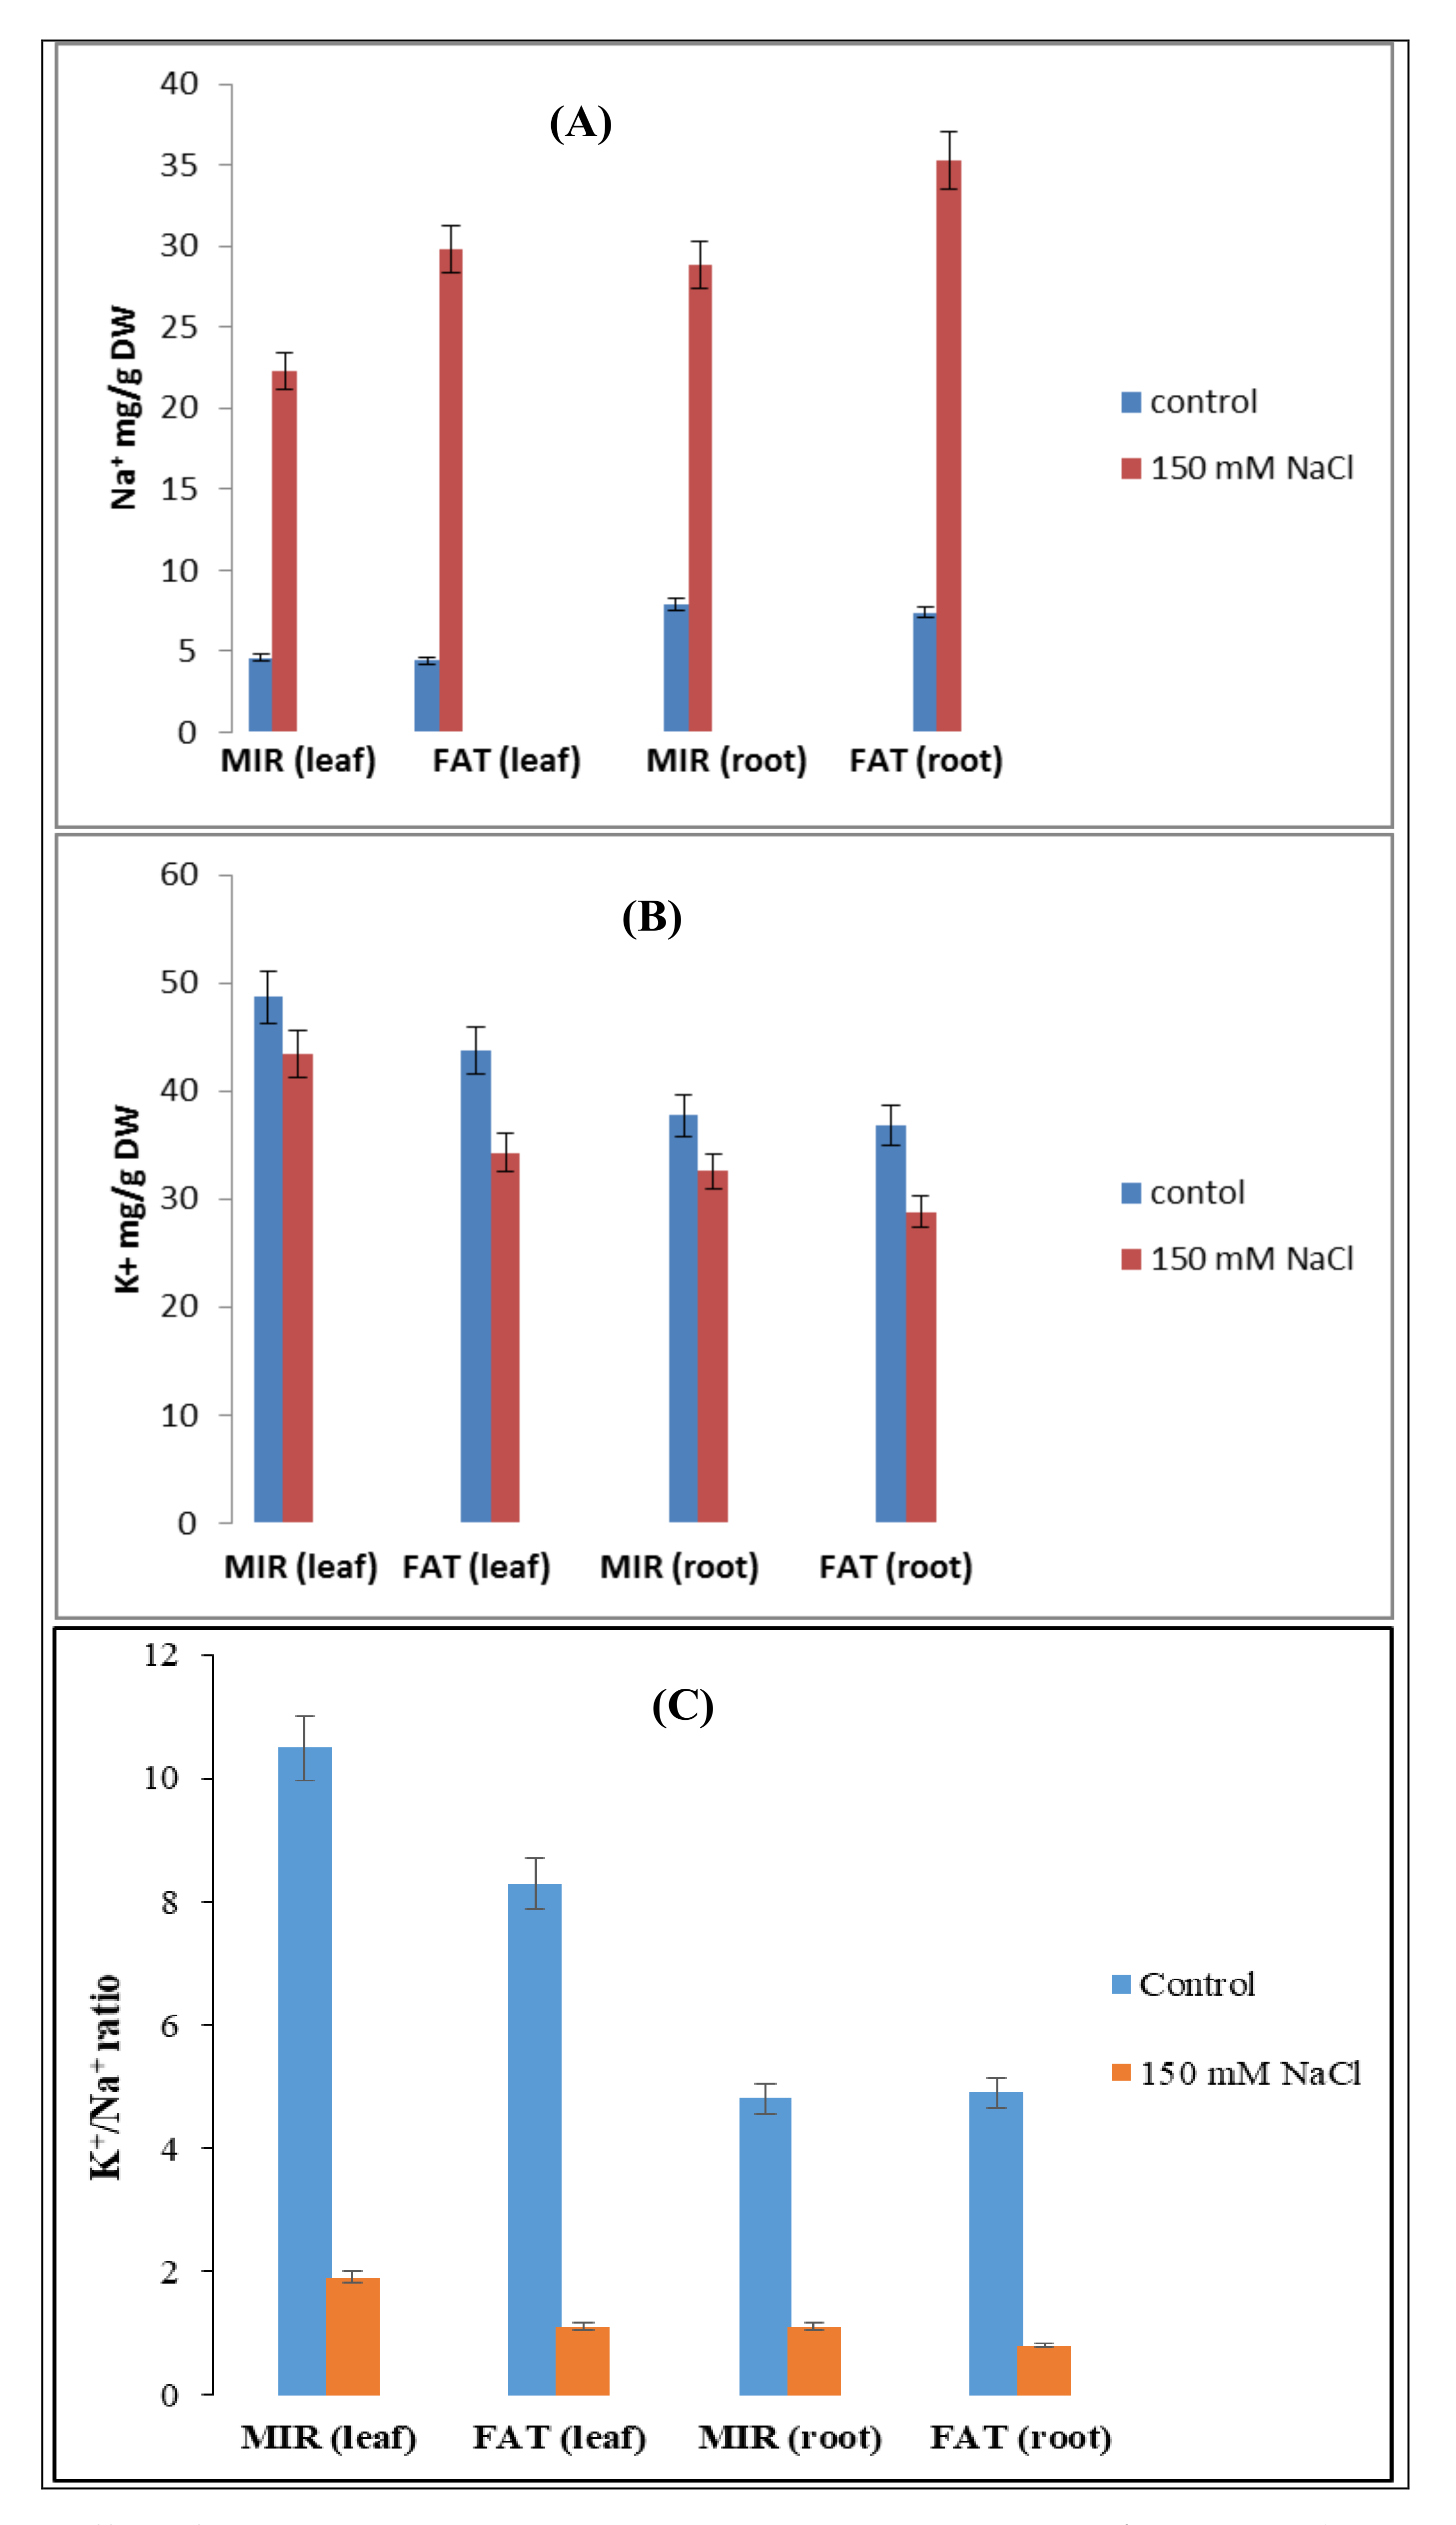
2.3. Measurement of Potassium and Sodium Ions
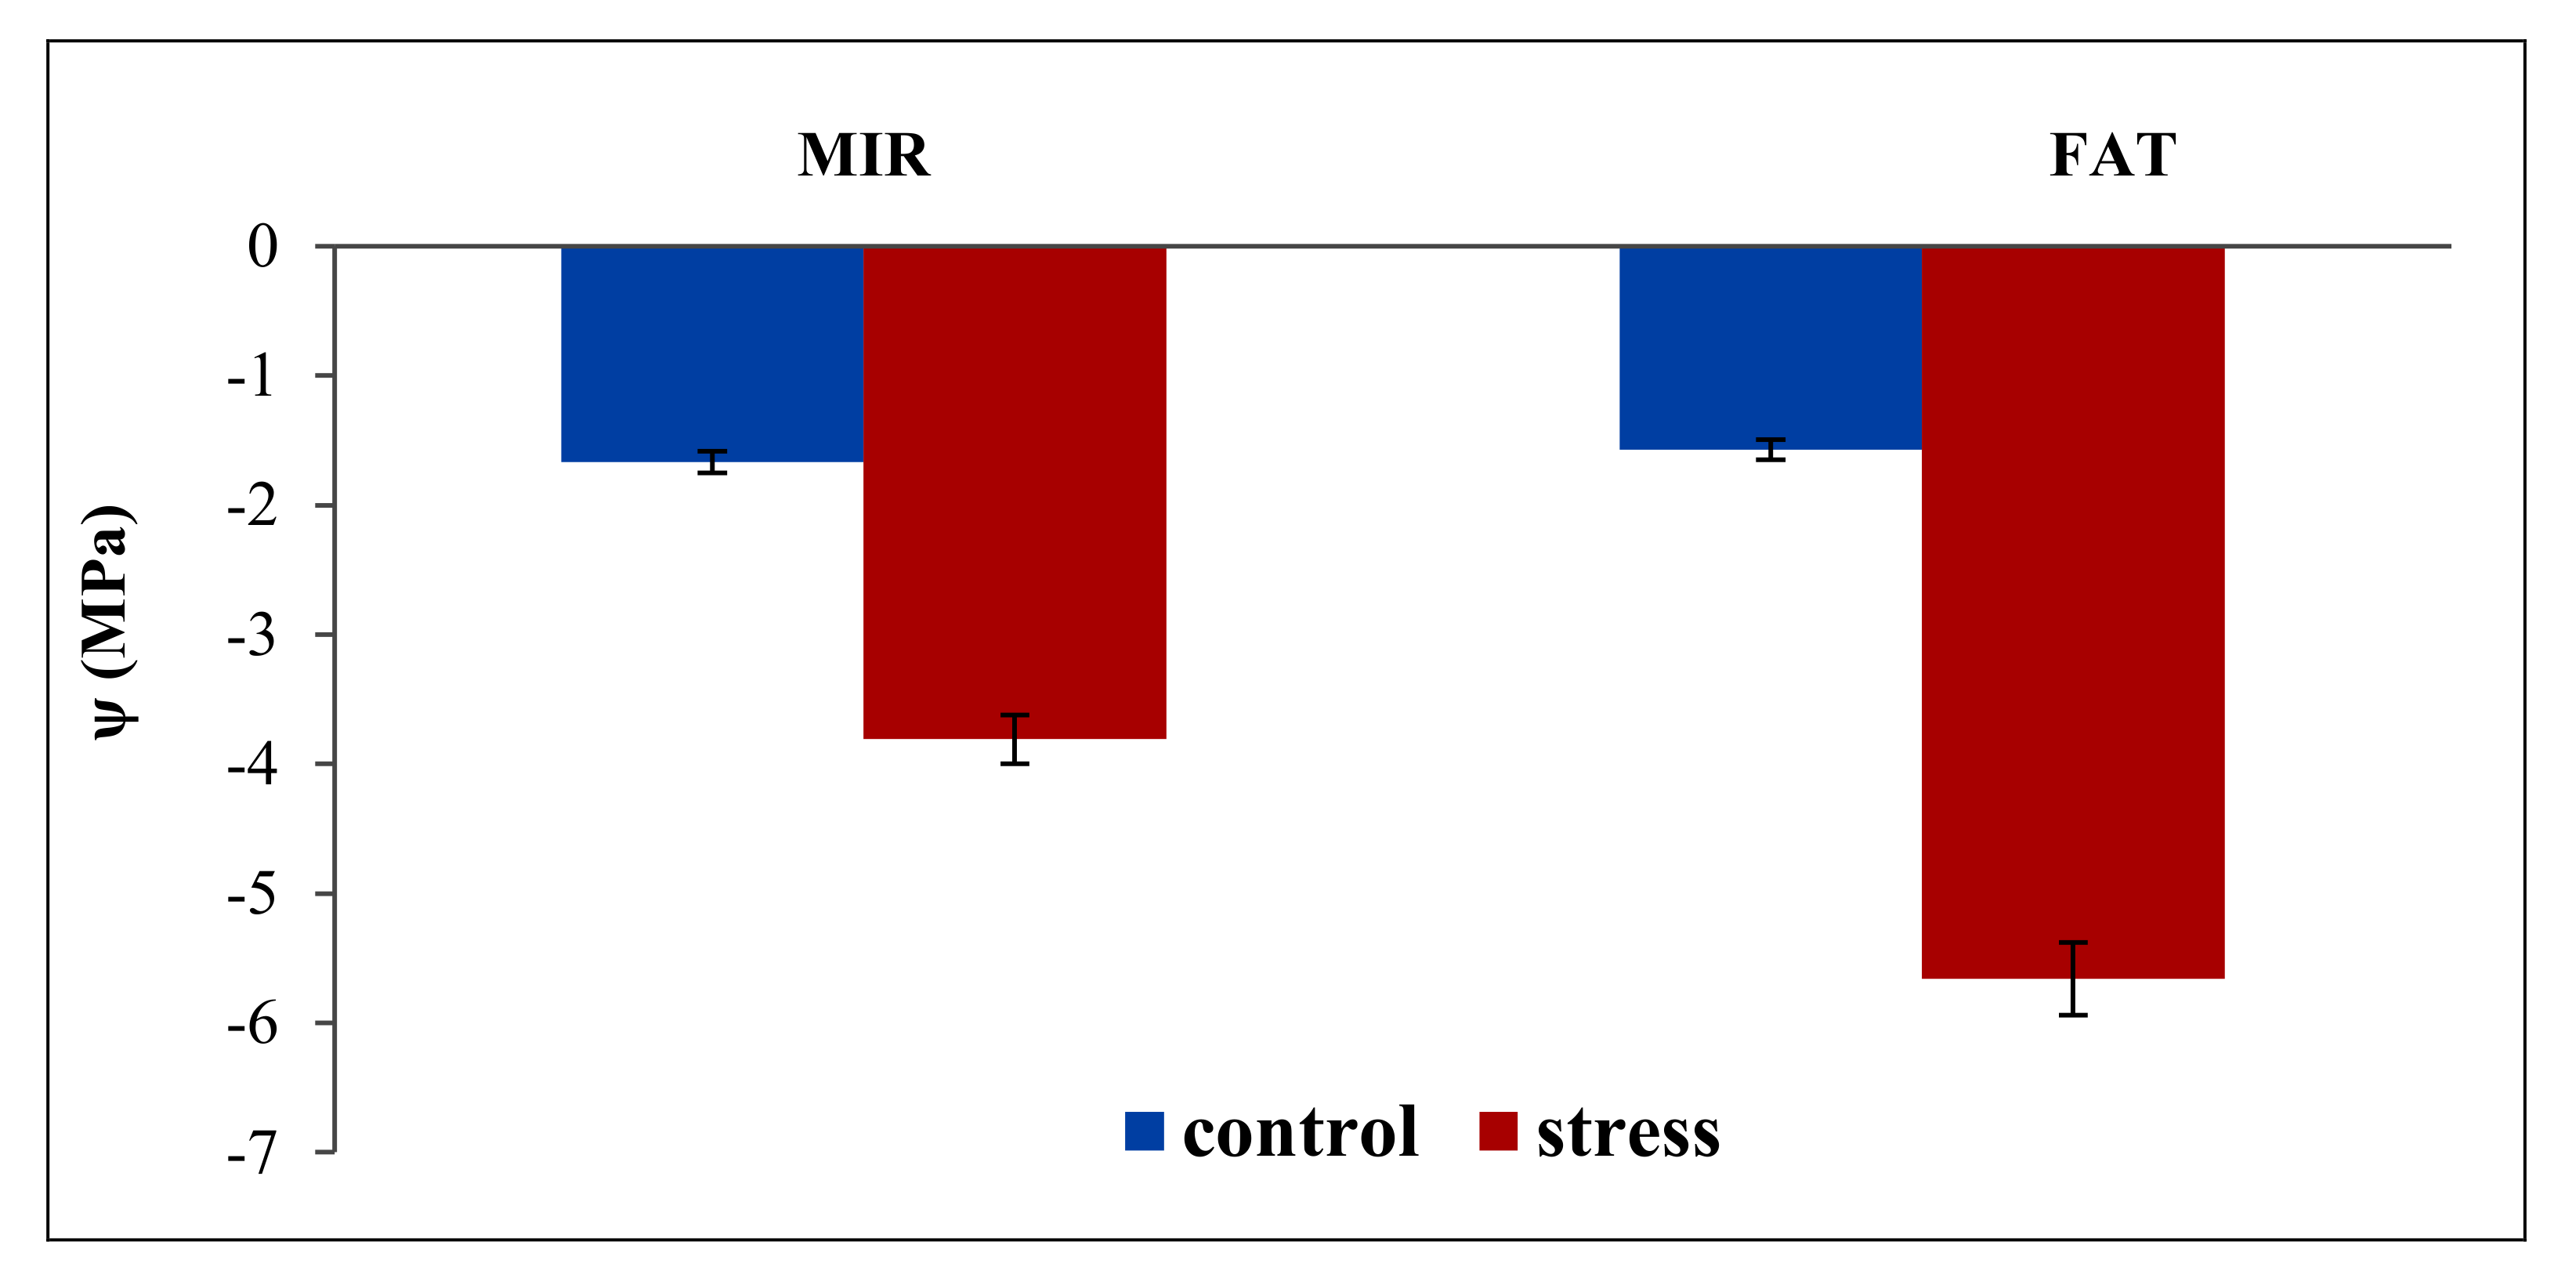
2.4. Measurement of Leaf Water Potential
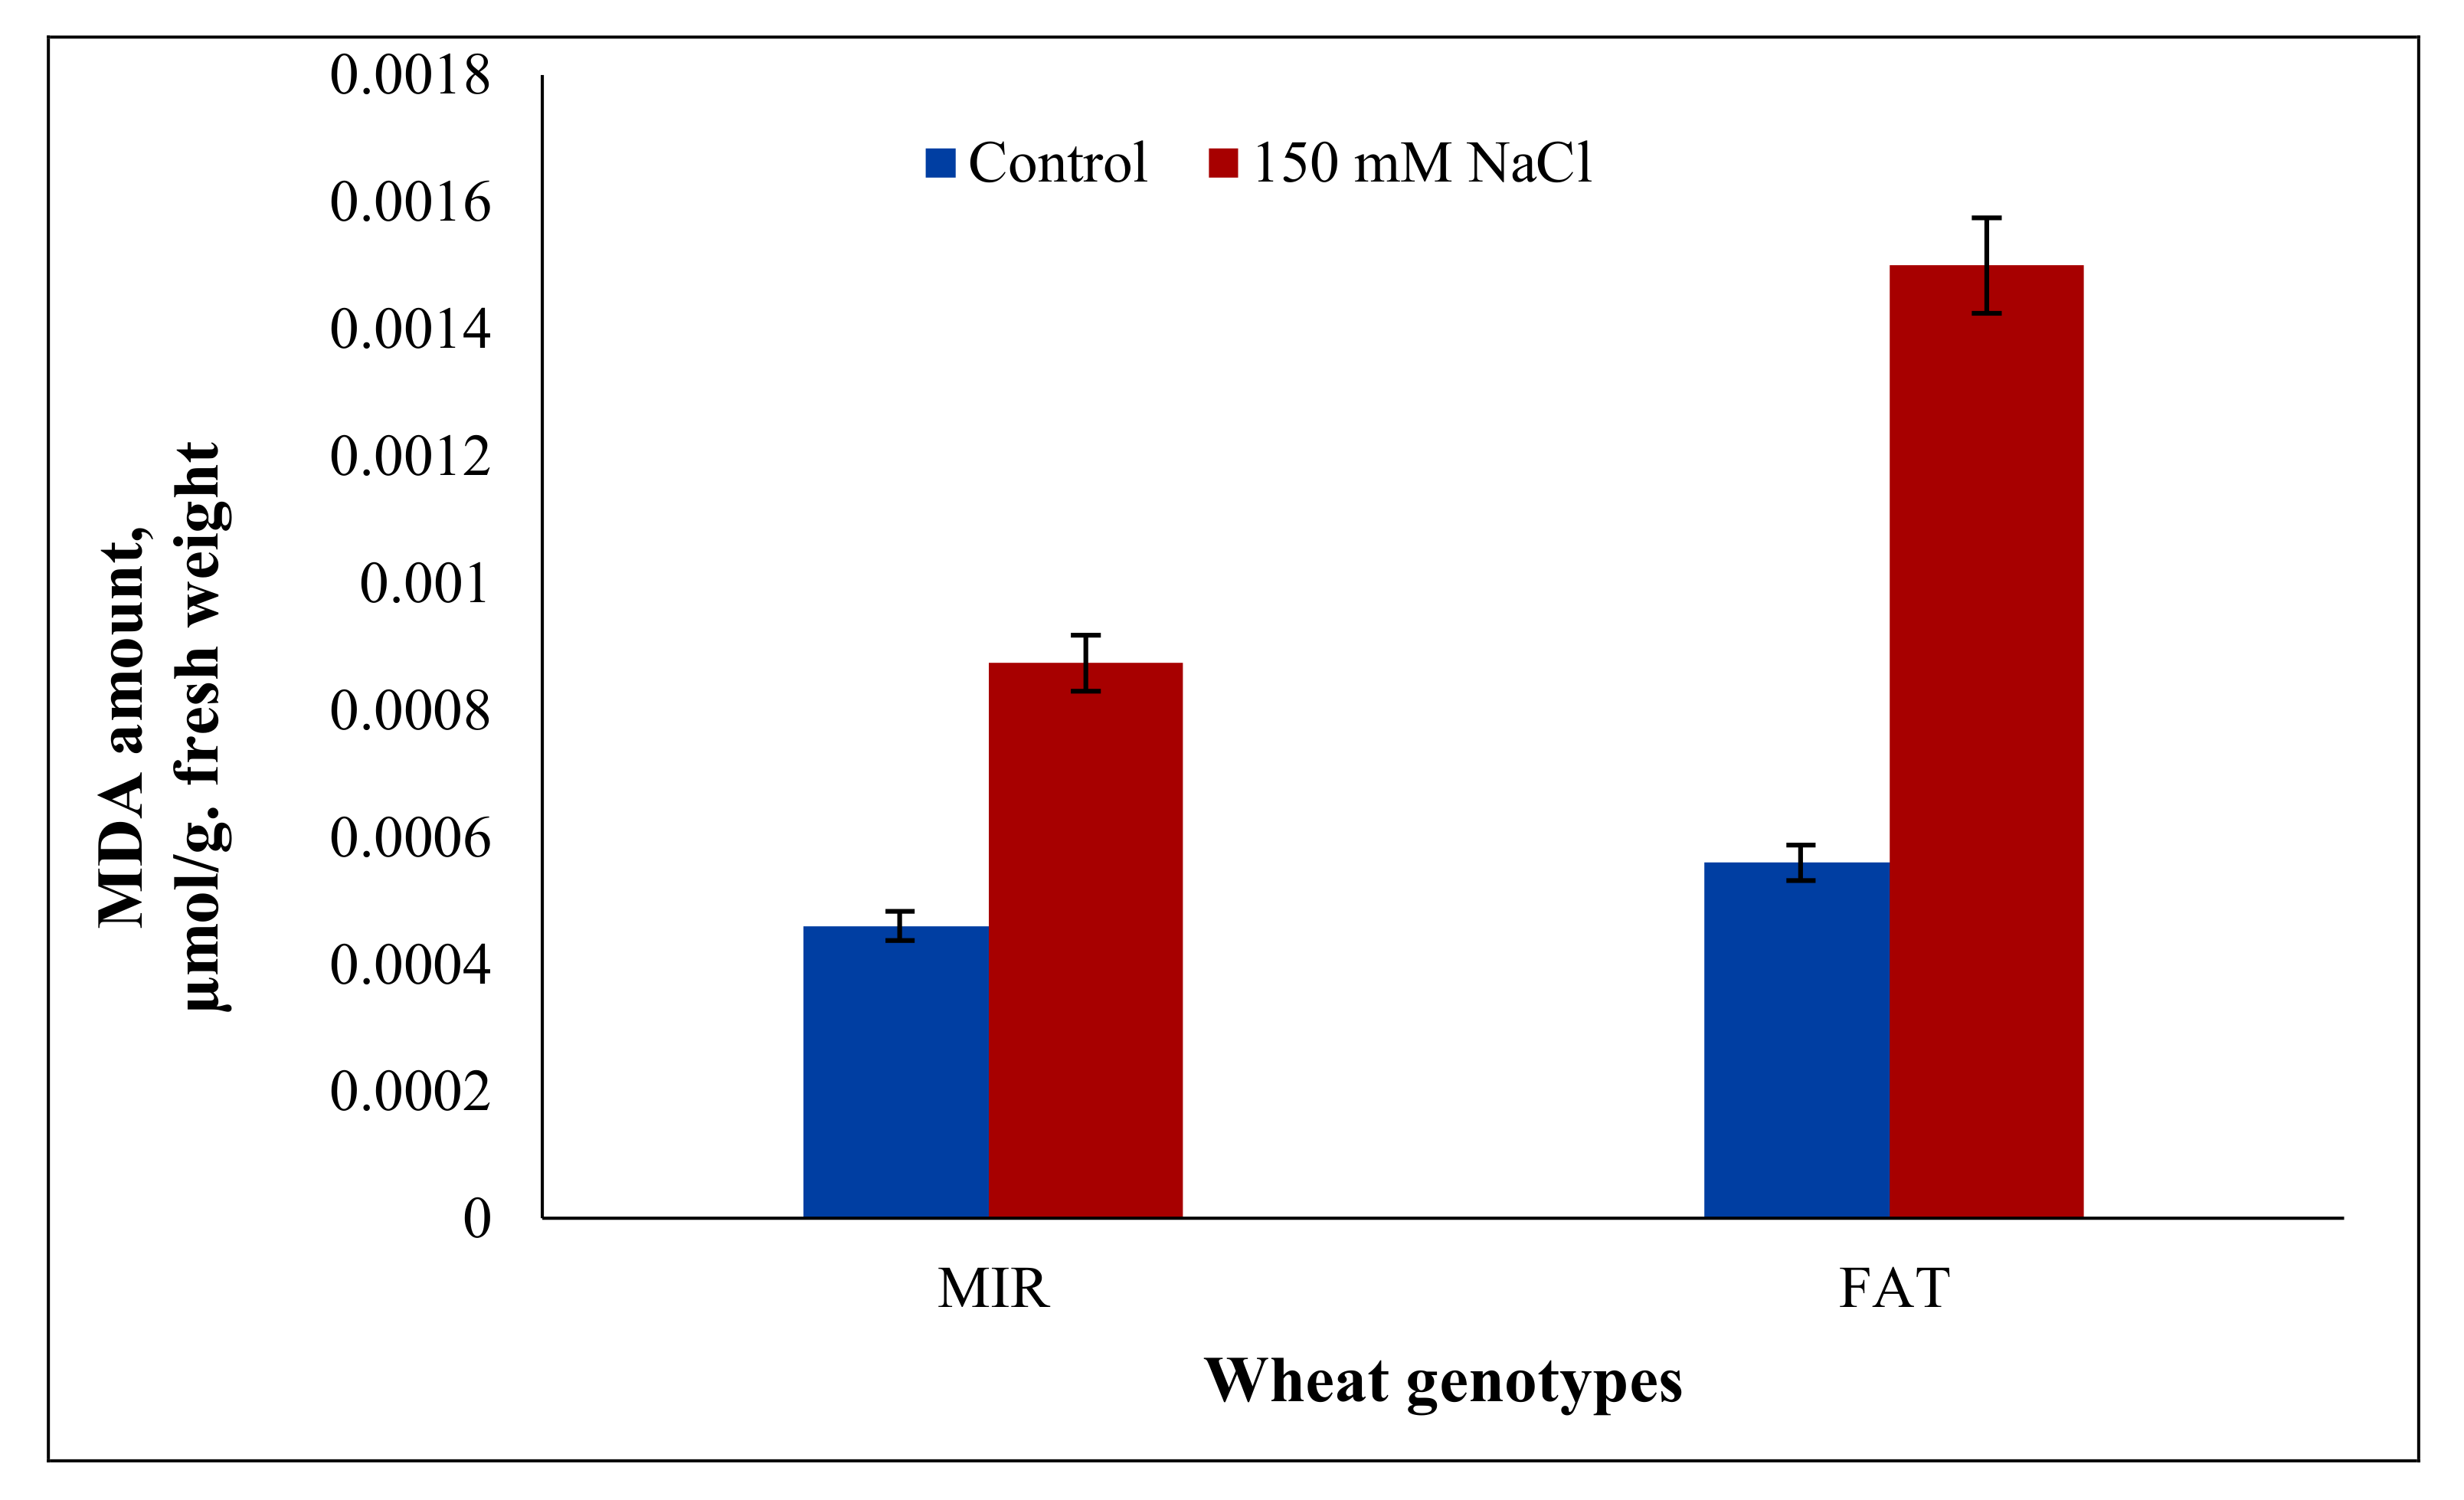
2.5. Determination of Malondialdehyde
2.6. Enzyme Extraction and Activity Determination
2.7. Determination of Proline and Soluble Sugars
2.8. Statistical Analysis
3. Results
4. Discussion
5. Conclusions
Author Contributions
Funding
Institutional Review Board Statement
Informed Consent Statement
Data Availability Statement
Acknowledgments
Conflicts of Interest
Appendix A

| Treatments | APX (µmol/mg Protein) | CAT (µmol/mg Protein) | Osmotic Potential | |||||||||
|---|---|---|---|---|---|---|---|---|---|---|---|---|
| Control | Salinity | Mean | CV (%) | Control | Salinity | Mean | CV (%) | Control | Salinity | Mean | CV (%) | |
| MIR | 1.03a | 2.22a | 1.63A | 7.18 | 0.63a | 1.10a | 0.87 | 19.25 | −0.58 | −3.68 | −2.13 | −36.27 |
| FAT | 0.99a | 1.63b | 1.31B | 0.61a | 0.83b | 0.72 | −1.57 | −5.67 | −3.62 | |||
| Mean | 1.01B | 1.93A | 0.62B | 0.97A | −1.08A | −4.67B | ||||||
| CV (%) | 5.47 | 6.77 | −31.11 | |||||||||
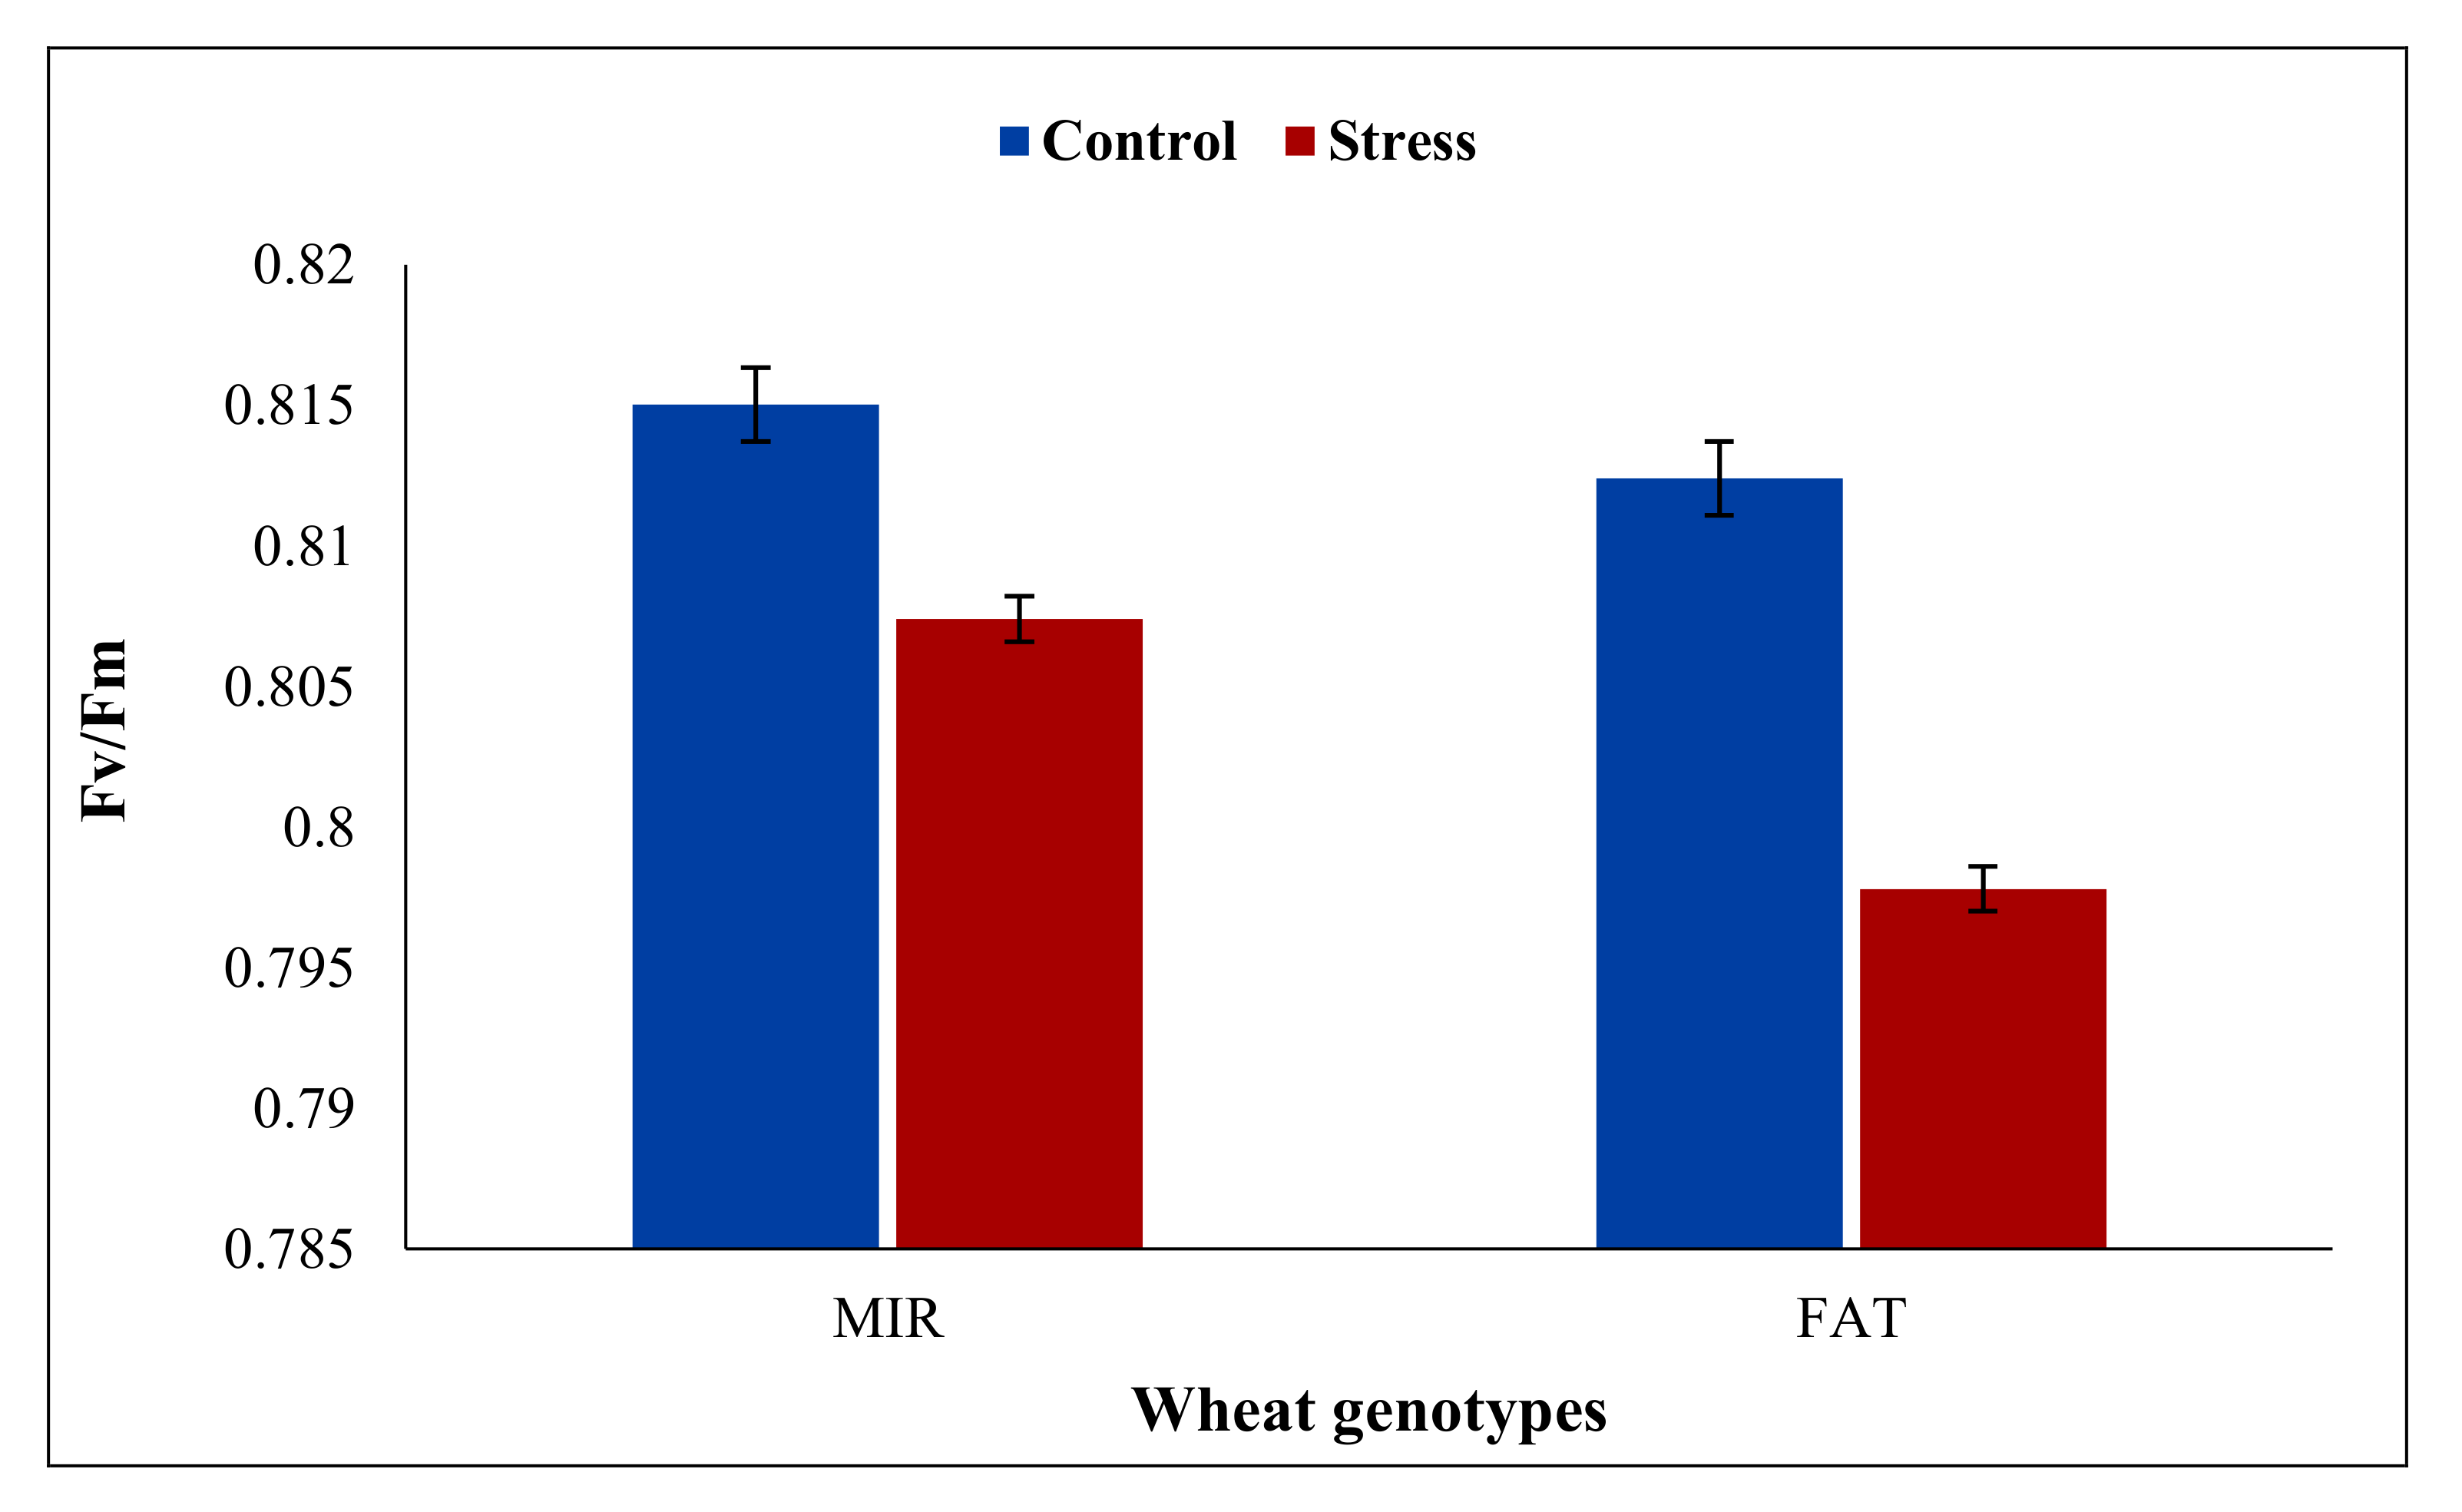
| Fv/Fm | MDA | |||||||||||
| MIR | 0.82 | 0.81 | 0.81 | 0.54 | 0.0005a | 0.0008b | 0.00065A | 16.09 | ||||
| FAT | 0.81 | 0.79 | 0.80 | 0.0006a | 0.0015a | 0.00105B | ||||||
| Mean | 0.81A | 0.80B | 0.00055A | 0.00115B | ||||||||
| CV (%) | 0.54 | 17.16 | ||||||||||
| Treatments | Leaves | |||||||||||
|---|---|---|---|---|---|---|---|---|---|---|---|---|
| K+ | Na+ | K+/Na+ | ||||||||||
| Control | Salinity | Mean | CV (%) | Control | Salinity | Mean | CV (%) | Control | Salinity | Mean | CV (%) | |
| MIR | 48.7 | 43.4 | 46.05A | 5.40 | 4.6a | 22.3b | 13.45B | 7.41 | 10.63 | 1.93 | 6.28 | 11.70 |
| FAT | 43.8 | 34.3 | 39.05B | 4.4a | 29.8a | 17.10A | 9.93 | 1.10 | 5.52 | |||
| Mean | 46.25A | 38.85B | 4.5A | 26.05B | 10.28A | 1.52B | ||||||
| CV (%) | 7.08 | 5.52 | 12.72 | |||||||||
| Roots | ||||||||||||
| MIR | 37.57 | 32.60 | 35.09 | 11.06 | 7.90a | 28.80b | 18.35B | 4.08 | 4.73 | 1.13 | 2.93 | 6.82 |
| FAT | 36.80 | 28.80 | 32.8 | 7.40a | 35.30a | 21.35A | 4.93 | 0.80 | 2.88 | |||
| Mean | 37.18A | 30.70B | 7.65A | 32.05 | 4.83A | 0.97B | ||||||
| CV (%) | 8.31 | 5.97 | 9.50 | |||||||||
References
- Gupta, B.; Huang, B. Mechanism of salinity tolerance in plants: Physiological, biochemical, and molecular characterization. Int. J. Genom. 2014, 2014, 701596. [Google Scholar] [CrossRef]
- Schmitt, F.J.; Renger, G.; Friedrich, T.; Kreslavski, V.D.; Zharmukhamedov, S.K.; Los, D.A.; Kuznetsov, V.V.; Allakhverdiev, S.I. Reactive oxygen species: Re-evaluation of generation, monitoring and role in stress-signaling in phototrophic organisms. Biochim. Biophys. Acta 2014, 1837, 835–848. [Google Scholar] [CrossRef] [PubMed] [Green Version]
- Almeida, D.M.; Oliveira, M.M.; Saibo, N.J. Regulation of Na+ and K+ homeostasis in plants: Towards improved salt stress tolerance in crop plants. Genet. Mol. Biol. 2017, 40, 326–345. [Google Scholar] [CrossRef] [PubMed] [Green Version]
- Shabala, L.; Zhang, J.; Pottosin, I.; Bose, J.; Zhu, M.; Fuglsang, A.T.; Velarde-Buendia, A.; Massart, A.; Hill, C.B.; Roessner, U.; et al. Cell-type-specific H+-ATPase activity in root tissues enables K+ retention and mediates acclimation of barley (Hordeum vulgare) to salinity stress. Plant Physiol. 2016, 172, 2445–2458. [Google Scholar] [CrossRef] [PubMed] [Green Version]
- Wu, H.H.; Zhang, X.C.; Giraldo, J.P.; Shabala, S. It is not all about sodium: Revealing tissue specificity and signalling roles of potassium in plant responses to salt stress. Plant Soil 2018, 431, 1–17. [Google Scholar] [CrossRef]
- Hilker, M.; Schmülling, T. Stress priming, memory, and signalling in plants. Plant Cell Environ. 2019, 42, 753–761. [Google Scholar] [CrossRef] [PubMed]
- Wang, N.; Wang, X.; Shi, J.; Liu, X.; Xu, Q.; Zhou, H.; Song, M.; Yan, G. Mepiquat chloridepriming induced salt tolerance during seed germination of cotton (Gossypium hirsutum L.) through regulating water transport and K+/Na+ homeostasis. Environ. Exp. Bot. 2019, 159, 168–178. [Google Scholar] [CrossRef]
- Brini, F.; Imen, A.; Kaouther, F.; Hanin, M.; Khoudi, H.; Masmoud, K. Physiological and molecular analyses of seedlings of two Tunisian durum wheat (Triticum turgidum L. subsp. Durum [Desf.]) varieties showing contrasting tolerance to salt stress. Acta Physiol. Plant 2009, 31, 145–154. [Google Scholar] [CrossRef]
- Garciadeblas, B.; Senn, M.E.; Banuelos, M.A.; Rodriguez-Navarro, A. Sodium transport and HKT transporters: The rice model. Plant J. 2003, 34, 788–801. [Google Scholar] [CrossRef]
- Huang, S.; Spielmeyer, W.; Lagudah, E.S.; Munns, R. Comparative mapping of HKT genes in wheat, barley and rice, key determinants of Na+ transport and salt tolerance. J. Exp. Bot. 2008, 59, 927–937. [Google Scholar] [CrossRef] [PubMed] [Green Version]
- Platten, J.D.; Cotsaftis, O.; Berthomieu, P.; Bohnert, H.; Davenport, R.J.; Fairbairn, D.J.; Horie, T.; Leigh, R.A.; Lin, H.X.; Luan, S.; et al. Nomenclature for HKT transporters, key determinants of plant salinity tolerance. Trends Plant Sci. 2006, 11, 372–374. [Google Scholar] [CrossRef]
- Jabnoune, M.; Espeout, S.; Mieulet, D.; Fizames, C.; Verdeil, J.L.; Conéjéro, G.; Rodríguez-Navarro, A.; Sentenac, H.; Guiderdoni, E.; Abdelly, C.; et al. Diversity in expression patterns and functional properties in the rice HKT transporter family. Plant Physiol. 2009, 150, 1955–1971. [Google Scholar] [CrossRef] [Green Version]
- Munns, R.; James, R.A.; Xu, B.; Athman, A.; Conn, S.J.; Jordans, C.; Byrt, C.S.; Hare, R.A.; Tyerman, S.D.; Tester, M.; et al. Wheat grain yield on saline soils is improved by an ancestral Na transporter gene. Nat. Biotechnol. 2012, 30, 360–366. [Google Scholar] [CrossRef] [PubMed]
- Ben Amar, S.; Brini, F.; Sentenac, H.; Masmoudi, K.; Very, A.A. Functional characterization in Xenopus oocytes of Na+ transport systems from durum wheat reveals diversity among two HKT1;4 transporters. J. Exp. Bot. 2014, 65, 213–222. [Google Scholar] [CrossRef] [PubMed] [Green Version]
- Suzuki, K.; Yamaji, N.; Costa, A.; Okuma, E.; Kobayashi, N.I.; Kashiwagi, T.; Katsuhara, M.; Wang, C.; Tanoi, K.; Murata, Y.; et al. OsHKT1;4-mediated Na+ transport in stems contributes to Na+ exclusion from leaf blades of rice at the reproductive growth stage upon salt stress. BMC Plant Biol. 2016, 16, 22. [Google Scholar] [CrossRef] [PubMed] [Green Version]
- Haushmand, S.; Arzani, A.; Mirmohammadi-Maibody, S. Effects of salinity and drough stress on grain quality of durum wheat. Commun. Soil Sci. Plant Anal. 2014, 45, 297–308. [Google Scholar] [CrossRef]
- Byrt, C.S.; Xu, B.; Krishnan, M.; Lightfoot, D.J.; Athman, A.; Jacobs, A.K.; Watson-Haigh, N.S.; Plett, D.; Munns, R.; Tester, M.; et al. The Na+ transporter, TaHKT1;5-D, limits shoot Na+ accumulation in bread wheat. Plant J. 2014, 80, 516–526. [Google Scholar] [CrossRef] [Green Version]
- Ibrahimova, U.; Zivcak, M.; Gasparovic, K.; Rastogi, A.; Allakhverdiev, S.I.; Yang, X.; Brestic, M. Electron and proton transport in wheat exposed to salt stress: Is the increase of the thylakoid membrane proton conductivity responsible for decreasing the photosynthetic activity in sensitive genotypes? Photosynth. Res. 2021, 1–17. [Google Scholar] [CrossRef]
- Allen, S.; Grimshaw, H.; Rowland, A. Chemical Analysis, Methods in Plant Ecology; Chapman, S.B., Moore, P.D., Eds.; Blackwell Scientific Publications: Oxford, UK, 1986. [Google Scholar]
- Kumar, G.N.M.; Knowles, N.R. Changes in lipid peroxidation and lipolytic and free-radical scavenging enzyme activities during aging and sprouting of potato (Solanum tuberosum) seed-tubers. Plant Physiol. 1993, 102, 115–124. [Google Scholar] [CrossRef] [Green Version]
- Kalaji, H.M.; Jajoo, A.; Oukarroum, A.; Brestic, M.; Zivcak, M.; Samborska, I.A.; Cetner, M.D.; Łukasik, I.; Goltsev, V.; Ladle, R.J. Chlorophyll a fluorescence as a tool to monitor physiological status of plants under abiotic stress conditions. Acta Physiol. Plant. 2016, 38, 102. [Google Scholar] [CrossRef] [Green Version]
- Bates, L.S.; Waldren, R.P.; Teare, I.D. Rapid determination of free proline for water-stress studies. Plant Soil 1973, 39, 205–207. [Google Scholar] [CrossRef]
- Fales, F.W. The assimilation and degradation of carbohydrates by yeast cells. J. Biol. Chem. 1951, 193, 113–124. [Google Scholar] [CrossRef]
- The R Development Core Team. R: A Language and Environment for Statistical Computing; R Foundation for Statistical Computing: Vienna, Austria, 2013; ISBN 3-900051-07-0. Available online: http://www.R-project.org/ (accessed on 2 February 2016).
- Aghaleh, M.; Niknam, V. Effect of salinity on some physiological and biochemical parameters in explants of two cultivars of soybean (Glyicine max L.). J. Phytol. 2009, 1, 86–94. [Google Scholar]
- Miyake, H.; Mitsuya, S.; Rahman, S. Ultrastructural effects of salinity stress in higher plants. In Abiotic Stress Tolerance in Plants; Rai, A.K., Takaba, T., Eds.; Springer: Dordrecht, The Netherlands, 2006; pp. 215–226. [Google Scholar]
- Azavedo-Neto, A.; Prisco, J.; Eneas-Filho, J.; de Abreu, C.E.B.; Gomes-Filho, E. Effect of salt stress on antioxidative enzymes and lipid peroxidation in leaves and roots of salt-tolerant and salt-sensitive maize genotypes. Environ. Exp. Bot. 2006, 56, 87–94. [Google Scholar] [CrossRef]
- Kuk, Y.; Shin, J.; Burgos, N.; Hwang, T.E.; Han, O.; Cho, B.H.; Jung, S.; Guh, J.O. Antioxidative enzymes offer protection from chilling damage in rice plants. Crop Sci. 2003, 43, 2109–2117. [Google Scholar] [CrossRef]
- Luna, C.; Pastori, G.M.; Driscoll, S.; Groten, K.; Bernard, S.; Foyer, C.H. Drought controls on H2O2 accumulation, catalase (CAT) activity and CAT gene expression in wheat. J. Exp. Bot. 2014, 56, 417–423. [Google Scholar] [CrossRef] [Green Version]
- Elsawy, H.I.; Mekawy, A.M.M.; Elhity, M.A.; Abdel-dayem, S.M.; Abdelaziz, M.N.; Assaha, D.V.; Ueda, A.; Saneoka, H. Differential responses of two Egyptian barley (Hordeum vulgare L.) cultivars to salt stress. Plant Physiol. Biochem. 2018, 127, 425–435. [Google Scholar] [CrossRef]
- Yassin, M.; El Sabagh, A.; Mekawy, A.M.M.; Islam, M.S.; Hossain, A.; Barutcular, C.; Alharby, H.; Bamagoos, A.; Liu, L.; Ueda, A.; et al. Comparative performance of two bread wheat (Triticum aestivum L.)under salinity. Appl. Ecol. Environ. Res. 2019, 17, 5029–5041. [Google Scholar] [CrossRef]
- Bhutta, W.M. Antioxidant activity of enzymatic system of two different wheat (Triticum aestivum L.) cultivars growing under salt stress. Plant Soil Environ. 2011, 57, 101–107. [Google Scholar] [CrossRef] [Green Version]
- Sofo, A.; Scopa, A.; Nuzzaci, M.; Vitti, A. Ascorbate peroxidase and catalase activities and their genetic regulation in plants subjected to drought and salinity Stresses. Int. J. Mol. Sci. 2015, 16, 13561–13578. [Google Scholar] [CrossRef] [PubMed] [Green Version]
- Tammam, A.; Abou Alhamd, M.F.; Hemeda, M. Study of salt tolerance in wheat (Triticum aestium L.) cultivar Banysoif 1. Aust. J. Crop. Sci. 2008, 1, 115–125. [Google Scholar]
- Marvi, H.; Heydari, M.; Armin, M. Physiological and biochemical responses of wheat cultivars under salinity stress. ARPN J. Agric. Biol. Sci. 2011, 6, 35–40. [Google Scholar]
- Sen, A.; Alikmanoglu, S. Effect of salt stress on growth parametres and antioxidant enzymes of different wheat (Triticum aestivum L.) varietes on in vitro tissue culture. PSP 2011, 20, 489–495. [Google Scholar]
- Elkahoui, S.; Hernández, J.A.; Abdelly, C.; Ghrir, R.; Limam, F. Effects of salt on lipid peroxidation and antioxidant enzyme activities of Catharanthus roseus suspension cells. Plant Sci. 2005, 709, 607–613. [Google Scholar] [CrossRef] [Green Version]
- Moller, I.S.; Gilliham, M.; Jha, D.; Mayo, G.M.; Roy, S.J.; Coates, J.C.; Haseloff, J.; Tester, M. Shoot Na+ exclusion and increased salinity tolerance engineered by cell typespecific alteration of Na+ transport in Arabidopsis. Plant Cell 2009, 21, 2163–2178. [Google Scholar] [CrossRef] [Green Version]
- Ahmad, P.; Kumar, A.; Ashraf, M.; Akram, N.A. Salt-induced changes in photosynthetic activity and oxidative defense system of three cultivars of mustard (Brassica juncea L.). Afr. J. Biotechnol. 2012, 11, 2694–2703. [Google Scholar]
- Azooz, M.M.; Youssef, A.M.; Ahmad, P. Evaluation of salicylic acid (SA) application on growth, osmotic solutes and antioxidant enzyme activities on broad bean seedlings grown under diluted seawater. Int. J. Plant Physiol. Biochem. 2011, 3, 253–264. [Google Scholar]
- Ibrahimova, U.F.; Mammadov, A.C.; Feyziyev, Y.M. The effect of NaCl on some physiological and biochemical parameters in Triticum aestivum L. genotypes. Plant Physiol. Rep. 2019, 24, 370–375. [Google Scholar] [CrossRef]
- Zeehan, M.; Lu, M.; Sehar, S.; Holford, P.; Wu, F. Comparison of biochemical, anatomical, morphological and physiological responses to salinity stress in wheat and barley genotypes differing to salinity tolerance. Agronomy 2020, 10, 127. [Google Scholar] [CrossRef] [Green Version]
- Koca, H.; Bor, M.; Özdemir, F.; Türkan, İ. The effect of salt stress on lipid peroxidation, antioxidative enzymes and proline ontent of sesame cultivars. Environ. Exp. Bot. 2007, 60, 344–351. [Google Scholar] [CrossRef]
- Ksouri, R.; Megdiche, W.; Debez, A.; Falleh, H.; Grignon, C.; Abdelly, C. Salinity effects on polyphenol content and antioxidant activities in leaves of the halophyte Cakile maritima. Plant Physiol. Biochem. 2007, 45, 244–249. [Google Scholar] [CrossRef]
- Shohan, M.U.S.; Sinha, S.; Nabila, F.H.; Dastidar, S.G.; Seraj, Z.I. HKT1;5 Transporter Gene Expression and Association of Amino Acid Substitutions With Salt Tolerance Across Rice Genotypes. Front. Plant Sci. 2019, 10, 1420. [Google Scholar] [CrossRef] [Green Version]
- Fallah, F.; Nokhasi, F.; Ghaheri, M.; Kahrizi, D.; Agha, A.B.A.; Ghorbani, T.; Kazemi, E.; Ansarypour, Z. Effect of salinity on gene expression, morphological and biochemical characteristics of Stevia rebaudiana Bertoni under in vitro conditions. Cell. Mol. Biol. 2017, 63, 102–106. [Google Scholar] [CrossRef] [PubMed]
- Tasmina, T.; Khan, A.R.; Karim, A.; Akter, N.; Islam, R. Physiological changes of wheat varieties under water deficit condition. Bangladesh Agron. J. 2017, 19, 105–114. [Google Scholar] [CrossRef] [Green Version]
- Worku, T.; Tanasch, L. Water potential as a selection criterion for drought tolerance by different durum wheat genotypes. In Genetic Aspects of Plant Mineral Nutrition; El Bassam, N., Dambroth, M., Loughman, B.C., Eds.; Springer: Dordrecht, The Netherlands, 1990; pp. 331–337. [Google Scholar]
- Blum, A.; Sullivan, C.Y. The comparative drought resistance of landraces of sorghum and millet from dry and humid regions. Ann. Bot. 1986, 57, 835–846. [Google Scholar] [CrossRef]
- Parida, A.K.; Das, A.B. Salt tolerance and salinity effects on plants: A review. Ecotoxicol. Environ. Saf. 2005, 60, 324–349. [Google Scholar] [CrossRef] [PubMed]
- Bjorkman, O.; Demmig-Adams, B. Regulation of photosynthesis light energy capture, conversion, and dissipation in leaves of higher plants. In Ecophysiology of Photosynthesis; Schulze, E.D., Caldwell, M.M., Eds.; Springer: Berlin/Heidelberg, Germany; New York, NY, USA, 1995; pp. 17–47. [Google Scholar]
- Oxborough, K. Imaging of chlorophyll a fluorescence: Theoretical and practical aspects of an emerging technique for the monitoring of photosynthetic performance. J. Exp. Bot. 2004, 55, 1195–1205. [Google Scholar] [CrossRef]
- Sun, X.; Xu, L.; Wang, Y.; Luo, X.; Zhu, X.; Kinuthia, K.B.; Nie, S.; Feng, H.; Li, C.; Liu, L. Transcriptome-based gene expression profiling identifies differentially expressed genes critical for salt stress response in radish (Raphanus sativus L.). Plant cell Rep. 2016, 35, 329–346. [Google Scholar] [CrossRef] [PubMed]
- Ibrahim, M.E.H.; Zhu, X.; Zhou, G.; Nimir, N.E.A. Comparison of germination and seedling characteristics of wheat varieties from China and Sudan under salt stress. Agron. J. 2016, 108, 85–92. [Google Scholar] [CrossRef]
- Byrt, C.S.; Munns, R.; Burton, R.A.; Gilliham, M.; Wege, S. Root cell wall solutions for crop plants in saline soils. Plant Sci. 2018, 269, 47–55. [Google Scholar] [CrossRef] [PubMed]
- Munns, R.; James, R.A.; Lauchli, A. Approaches to increasing the salt tolerance of wheat and other cereals. J. Exp. Bot. 2006, 57, 1025–1043. [Google Scholar] [CrossRef] [PubMed] [Green Version]
- Byrt, C.S.; Platten, J.D.; Spielmeyer, W.; James, R.A.; Lagudah, E.S.; Dennis, E.S.; Tester, M.; Munns, R. HKT1;5-like cation transporters linked to Na+ exclusion loci in wheat, Nax2 and Kna1. Plant Physiol. 2007, 143, 1918–1928. [Google Scholar] [CrossRef] [PubMed] [Green Version]
- Kumar, S.; Saxena, S.; Rai, A.; Radhakrishna, A.; Kaushal, P. Ecological, genetic, and reproductive features of Cenchrus species indicate evolutionary superiority of apomixis under environmental stresses. Ecol. Indic. 2019, 105, 126–136. [Google Scholar] [CrossRef]


| Salt Levels (mM NaCl) | Wheat Variety | APX (µmol/mg Protein) | CAT (µmol/mg Protein) | Soluble Sugars (mg/g DW) | Proline (µmol/g FW) |
|---|---|---|---|---|---|
| 0 | MIR | 1.03a | 0.63a | 36b | 4.97b |
| FAT | 0.99a | 0.61a | 39b | 5.07b | |
| 150 | MIR | 2.22a | 1.10a | 60a | 20.38a |
| FAT | 1.63b | 0.83a | 48a | 9.63a | |
| F-test | ** | ** | ** | ** | |
| CV (%) | 5.47 | 6.77 | 3.09 | 4.73 |
Publisher’s Note: MDPI stays neutral with regard to jurisdictional claims in published maps and institutional affiliations. |
© 2021 by the authors. Licensee MDPI, Basel, Switzerland. This article is an open access article distributed under the terms and conditions of the Creative Commons Attribution (CC BY) license (https://creativecommons.org/licenses/by/4.0/).
Share and Cite
Ibrahimova, U.; Suleymanova, Z.; Brestic, M.; Mammadov, A.; Ali, O.M.; Abdel Latef, A.A.H.; Hossain, A. Assessing the Adaptive Mechanisms of Two Bread Wheat (Triticum aestivum L.) Genotypes to Salinity Stress. Agronomy 2021, 11, 1979. https://0-doi-org.brum.beds.ac.uk/10.3390/agronomy11101979
Ibrahimova U, Suleymanova Z, Brestic M, Mammadov A, Ali OM, Abdel Latef AAH, Hossain A. Assessing the Adaptive Mechanisms of Two Bread Wheat (Triticum aestivum L.) Genotypes to Salinity Stress. Agronomy. 2021; 11(10):1979. https://0-doi-org.brum.beds.ac.uk/10.3390/agronomy11101979
Chicago/Turabian StyleIbrahimova, Ulkar, Zarifa Suleymanova, Marian Brestic, Alamdar Mammadov, Omar M. Ali, Arafat Abdel Hamed Abdel Latef, and Akbar Hossain. 2021. "Assessing the Adaptive Mechanisms of Two Bread Wheat (Triticum aestivum L.) Genotypes to Salinity Stress" Agronomy 11, no. 10: 1979. https://0-doi-org.brum.beds.ac.uk/10.3390/agronomy11101979