
Effects of Corn Stalks and Urea on N2O Production from Corn Field Soil

Abstract
:1. Introduction
2. Materials and Methods
2.1. Field Site
2.2. Incubation Experimental Design
2.3. Gas and Soil Sampling Analysis
2.4. DNA Extraction
2.5. Statistical Analysis
3. Results
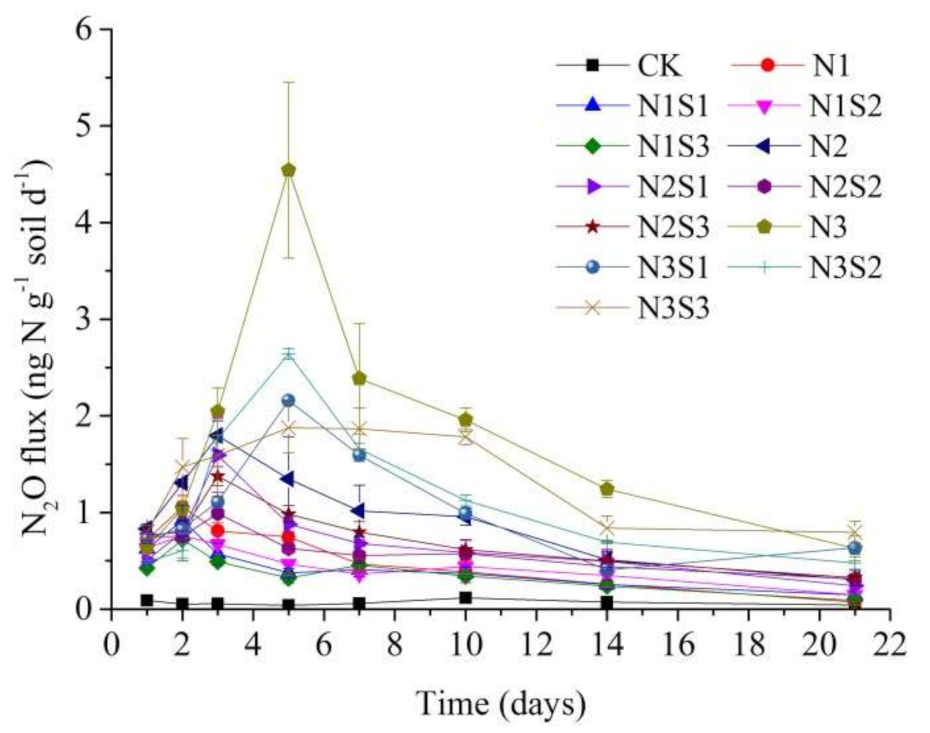
3.1. N2O Flux
3.2. N2O Accumulation
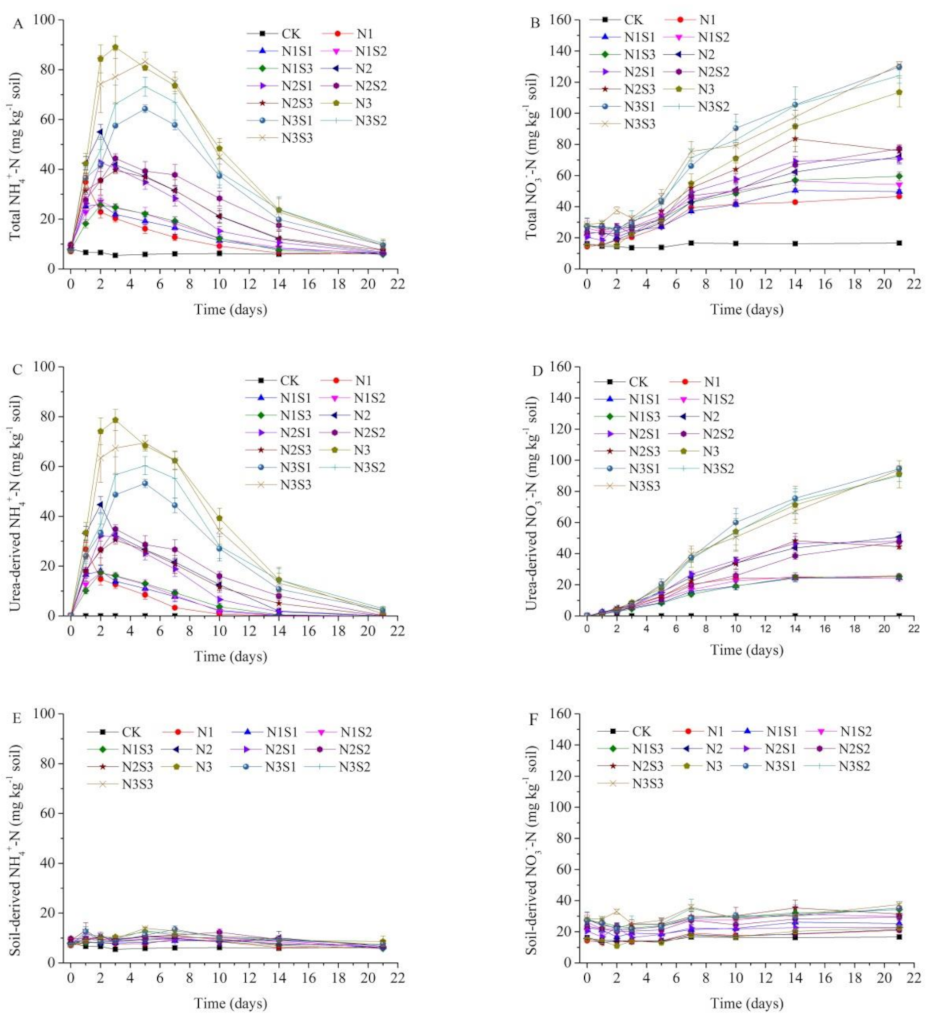
3.3. Soil Inorganic Nitrogen
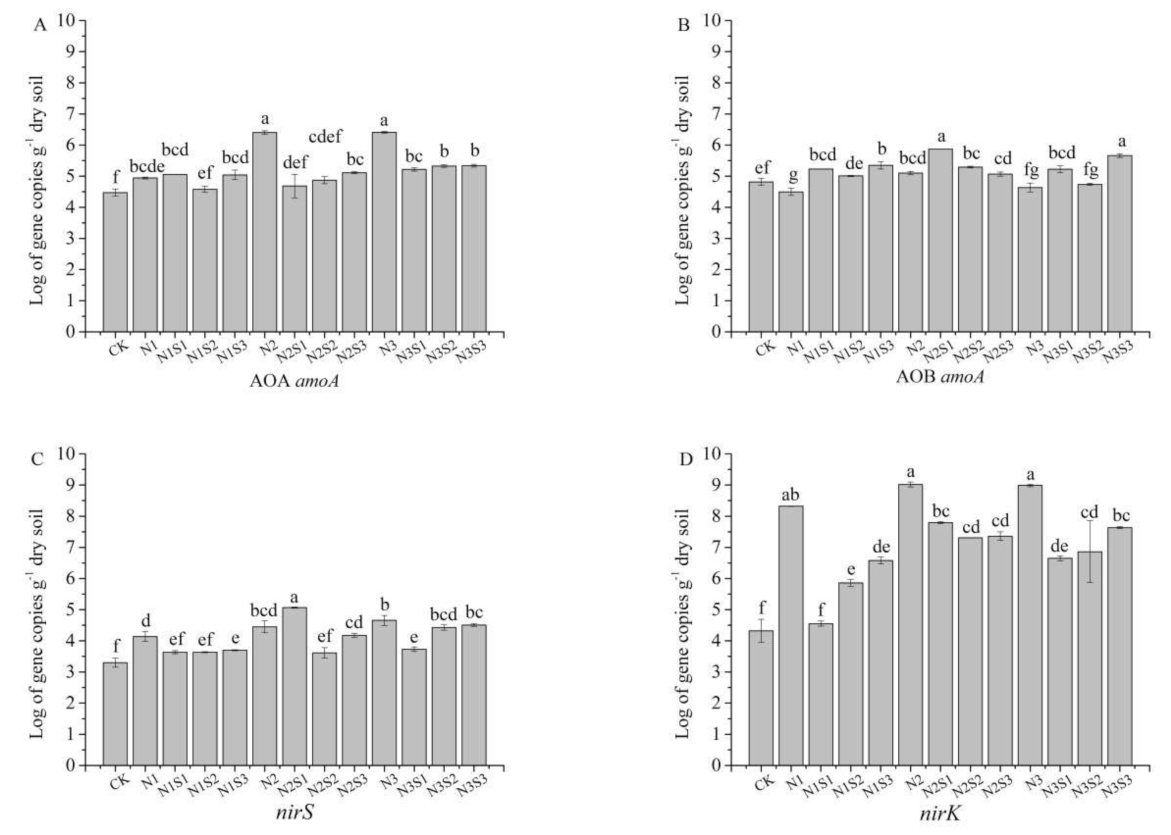
3.4. Abundance of Key N2O-Producing Genes
3.5. Pearson Correlation Analysis of N2O, Soil Properties and Gene Abundance
3.6. Comprehensive Effects of the Combined Application of Residue and Urea on N2O, Soil Inorganic Nitrogen and Gene Abundance
4. Discussion
5. Conclusions
Supplementary Materials
Author Contributions
Funding
Institutional Review Board Statement
Informed Consent Statement
Data Availability Statement
Acknowledgments
Conflicts of Interest
References
- Hu, H.W.; Chen, D.; He, J.Z. Microbial regulation of terrestrial nitrous oxide formation: Understanding the biological pathways for prediction of emission rates. FEMS Microbiol. Rev. 2015, 39, 729–749. [Google Scholar] [CrossRef]
- Yeboah, S.; Lamptey, S.; Cai, L.; Song, M. Short-Term Effects of Biochar Amendment on Greenhouse Gas Emissions from Rainfed Agricultural Soils of the Semi-Arid Loess Plateau Region. Agronomy 2018, 8, 74. [Google Scholar] [CrossRef] [Green Version]
- Zhou, S.; Sun, H.; Bi, J.; Zhang, J.; Riya, S.; Hosomi, M. Effect of water-saving irrigation on the N2O dynamics and the contribution of exogenous and endogenous nitrogen to N2O production in paddy soil using 15N tracing. Soil Till. Res. 2020, 200, 104610. [Google Scholar] [CrossRef]
- Hu, H.W.; Trivedi, P.; He, J.Z.; Singh, B.K. Microbial nitrous oxide emissions in dryland ecosystems: Mechanisms, microbiome and mitigation. Environ. Microbiol. 2017, 19, 4808–4828. [Google Scholar] [CrossRef] [Green Version]
- Akiyama, H.; Yan, X.; Yagi, K. Evaluation of effectiveness of enhanced-efficiency fertilizers as mitigation options for N2O and NO emissions from agricultural soils: Meta-analysis. Glob. Chang. Biol. 2010, 16, 1837–1846. [Google Scholar] [CrossRef]
- Ye, R.; Horwath, W.R. Nitrous oxide uptake in rewetted wetlands with contrasting soil organic carbon contents. Soil Biol. Biochem. 2016, 100, 110–117. [Google Scholar] [CrossRef] [Green Version]
- Lan, T.; Liu, R.; Suter, H.; Deng, O.; Gao, X.; Luo, L.; Yuan, S.; Wang, C.; Chen, D. Stimulation of heterotrophic nitrification and N2O production, inhibition of autotrophic nitrification in soil by adding readily degradable carbon. J. Soil. Sediment. 2020, 20, 81–90. [Google Scholar] [CrossRef]
- Mathieu, O.; Henault, C.; Leveque, J.; Baujard, E.; Milloux, M.J.; Andreux, F. Quantifying the contribution of nitrification and denitrification to the nitrous oxide flux using 15N tracers. Environ. Pollut. 2006, 144, 933–940. [Google Scholar] [CrossRef]
- Snider, D.; Thompson, K.; Wagner-Riddle, C.; Spoelstra, J.; Dunfield, K. Molecular techniques and stable isotope ratios at natural abundance give complementary inferences about N2O production pathways in an agricultural soil following a rainfall event. Soil Biol. Biochem. 2015, 88, 197–213. [Google Scholar] [CrossRef]
- Wu, K.K.; Gong, P.; Zhang, L.L.; Wu, Z.J.; Xie, X.S.; Yang, H.Z.; Li, W.T.; Song, Y.C.; Li, D.P. Yield-scaled N2O and CH4 emissions as affected by combined application of stabilized nitrogen fertilizer and pig manure in rice fields. Plant. Soil Environ. 2019, 65, 497–502. [Google Scholar] [CrossRef] [Green Version]
- Xia, L.L.; Yan, X.Y.; Cai, Z.C. Research progress and prospect of greenhouse gas mitigation and soil carbon sequestration in croplands of China. J. Agro-Environ. Sci. 2020, 39, 834–841. (In Chinese) [Google Scholar] [CrossRef]
- Zhang, Z.; Zhang, X.; Feng, L.S.; Zhang, Y.Q.; Liu, E.K.; Sun, Z.X. Effects of autumn mulching on water and fertilizer use efficiency and yield of spring maize in Western Liaoning Province. Trans. Chin. Soc. Agric. Eng. 2020, 36, 150–158. (In Chinese) [Google Scholar] [CrossRef]
- Breuillin-Sessoms, F.; Venterea, R.T.; Sadowsky, M.J.; Coulter, J.A.; Clough, T.J.; Wang, P. Nitrification gene ratio and free ammonia explain nitrite and nitrous oxide production in urea-amended soils. Soil Biol. Biochem. 2017, 111, 143–153. [Google Scholar] [CrossRef]
- Niraula, S.; Rahman, S.; Chatterjee, A.; Cortus, E.L.; Mehata, M.; Spiehs, M.J. Beef Manure and Urea Applied to Corn Show Variable Effects on Nitrous Oxide, Methane, Carbon Dioxide, and Ammonia. Agron. J. 2019, 111, 1448–1467. [Google Scholar] [CrossRef]
- Hartmann, T.E.; Guzman-Bustamante, I.; Ruser, R.; Mueller, T. Turnover of Urea in a Soil from the North China Plain as Affected by the Urease Inhibitor NBPT and Wheat Straw. Agronomy 2020, 10, 857. [Google Scholar] [CrossRef]
- Bell, M.J.; Hinton, N.; Cloy, J.M.; Topp, C.F.E.; Rees, R.M.; Cardenas, L.; Scott, T.; Webster, C.; Ashton, R.W.; Whitmore, A.P.; et al. Nitrous oxide emissions from fertilised UK arable soils: Fluxes; emission factors and mitigation. Agric. Ecosyst. Environ. 2015, 212, 134–147. [Google Scholar] [CrossRef]
- Liu, C.; Wang, K.; Meng, S.; Zheng, X.; Zhou, Z.; Han, S.; Chen, D.; Yang, Z. Effects of irrigation, fertilization and crop straw management on nitrous oxide and nitric oxide emissions from a wheat–maize rotation field in northern China. Agric. Ecosyst. Environ. 2011, 140, 226–233. [Google Scholar] [CrossRef]
- Bai, J.; Li, Y.; Zhang, J.; Xu, F.; Bo, Q.; Wang, Z.; Li, Z.; Li, S.; Shen, Y.; Yue, S. Straw returning and one-time application of a mixture of controlled release and solid granular urea to reduce carbon footprint of plastic film mulching spring maize. J. Clean. Prod. 2021, 280, 124478. [Google Scholar] [CrossRef]
- Qiu, Q.Y.; Wu, L.F.; Ouyang, Z.; Li, B.B.; Xu, Y.Y.; Wu, S.S.; Gregorich, E.G. Effects of plant-derived dissolved organic matter (DOM) on soil CO2 and N2O emissions and soil carbon and nitrogen sequestrations. Appl. Soil Ecol. 2015, 96, 122–130. [Google Scholar] [CrossRef]
- Huang, R.; Liu, J.; He, X.; Xie, D.; Ni, J.; Xu, C.; Zhang, Y.; Ci, E.; Wang, Z.; Gao, M. Reduced mineral fertilization coupled with straw return in field mesocosm vegetable cultivation helps to coordinate greenhouse gas emissions and vegetable production. J. Soil. Sediment. 2020, 20, 1834–1845. [Google Scholar] [CrossRef]
- Yao, Z.; Yan, G.; Zheng, X.; Wang, R.; Liu, C.; Butterbach-Bahl, K. Straw return reduces yield-scaled N2O plus NO emissions from annual winter wheat-based cropping systems in the North China Plain. Sci. Total Environ. 2017, 590, 174–185. [Google Scholar] [CrossRef]
- Velthof, G.L.; Kuikman, P.; Oenema, O. Nitrous oxide emission from soils amended with crop residues. Nutr. Cycl. Agroecosyst. 2002, 62, 249–261. [Google Scholar] [CrossRef]
- Shan, J.; Yan, X. Effects of crop residue returning on nitrous oxide emissions in agricultural soils. Atmos. Environ. 2013, 71, 170–175. [Google Scholar] [CrossRef]
- Wang, Q.; Hu, H.-W.; Shen, J.-P.; Du, S.; Zhang, L.-M.; He, J.-Z.; Han, L.-L. Effects of the nitrification inhibitor dicyandiamide (DCD) on N2O emissions and the abundance of nitrifiers and denitrifiers in two contrasting agricultural soils. J. Soil. Sediment. 2017, 17, 1635–1643. [Google Scholar] [CrossRef]
- Yu, C.; Xie, X.; Yang, H.; Yang, L.; Li, W.; Wu, K.; Zhang, W.; Feng, C.; Li, D.; Wu, Z.; et al. Effect of straw and inhibitors on the fate of nitrogen applied to paddy soil. Sci. Rep. 2020, 10, 21582. [Google Scholar] [CrossRef] [PubMed]
- Senbayram, M.; Chen, R.; Muhling, K.H.; Dittert, K. Contribution of nitrification and denitrification to nitrous oxide emissions from soils after application of biogas waste and other fertilizers. Rapid Commun. Mass Sp. 2009, 23, 2489–2498. [Google Scholar] [CrossRef] [PubMed]
- Xu, C.; Han, X.; Ru, S.; Cardenas, L.; Rees, R.M.; Wu, D.; Wu, W.; Meng, F. Crop straw incorporation interacts with N fertilizer on N2O emissions in an intensively cropped farmland. Geoderma 2019, 341, 129–137. [Google Scholar] [CrossRef]
- Ni, K.; Ding, W.; Cai, Z.; Wang, Y.; Zhang, X.; Zhou, B. Soil carbon dioxide emission from intensively cultivated black soil in Northeast China: Nitrogen fertilization effect. J. Soil. Sediment. 2012, 12, 1007–1018. [Google Scholar] [CrossRef]
- Bizimana, F.; Timilsina, A.; Dong, W.; Uwamungu, J.Y.; Li, X.; Wang, Y.; Pandey, B.; Qin, S.; Hu, C. Effects of long-term nitrogen fertilization on N2O, N2 and their yield-scaled emissions in a temperate semi-arid agro-ecosystem. J. Soil. Sediment. 2021, 21, 1659–1671. [Google Scholar] [CrossRef]
- Deppe, M.; Well, R.; Giesemann, A.; Spott, O.; Flessa, H. Soil N2O fluxes and related processes in laboratory incubations simulating ammonium fertilizer depots. Soil Biol. Biochem. 2017, 104, 68–80. [Google Scholar] [CrossRef]
- Ngoc Tuong Hoang, V.; Maeda, M. Interactive effects of ammonium application rates and temperature on nitrous oxide emission from tropical agricultural soil. Soil Sci. Plant. Nutr. 2018, 64, 767–773. [Google Scholar] [CrossRef] [Green Version]
- Hoben, J.P.; Gehl, R.J.; Millar, N.; Grace, P.R.; Robertson, G.P. Nonlinear nitrous oxide (N2O) response to nitrogen fertilizer in on-farm corn crops of the US Midwest. Glob. Chang. Biol. 2011, 17, 1140–1152. [Google Scholar] [CrossRef]
- Chen, Z.; Wang, Q.; Zhao, J.; Chen, Y.; Wang, H.; Ma, J.; Zou, P.; Bao, L. Restricted nitrous oxide emissions by ammonia oxidizers in two agricultural soils following excessive urea fertilization. J. Soil. Sediment. 2020, 20, 1502–1512. [Google Scholar] [CrossRef]
- Yang, L.; Liu, R.; Ju, X. Effect of carbon rate and type amended with ammonium or nitrate on nitrous oxide emissions in a strong ammonia oxidation soil. J. Soil. Sediment. 2020, 20, 1253–1263. [Google Scholar] [CrossRef]
- Song, X.; Ju, X.; Topp, C.F.E.; Rees, R.M. Oxygen Regulates Nitrous Oxide Production Directly in Agricultural Soils. Environ. Sci. Technol. 2019, 53, 12539–12547. [Google Scholar] [CrossRef]
- Hink, L.; Nicol, G.W.; Prosser, J.I. Archaea produce lower yields of N2O than bacteria during aerobic ammonia oxidation in soil. Environ. Microbiol. 2016, 19, 4829–4837. [Google Scholar] [CrossRef] [PubMed] [Green Version]
- Linzmeier, W.; Gutser, R.; Schmidhalter, U. Nitrous oxide emission from soil and from a nitrogen-15-labelled fertilizer with the new nitrification inhibitor 3,4-dimethylpyrazole phosphate (DMPP). Biol. Fert. Soils 2001, 34, 103–108. [Google Scholar] [CrossRef]
- Di, H.J.; Cameron, K.C. Sources of nitrous oxide from 15N-labelled animal urine and urea fertiliser with and without a nitrification inhibitor, dicyandiamide (DCD). Soil Res. 2008, 46, 76–82. [Google Scholar] [CrossRef]
- Shi, Y.; Liu, X.; Zhang, Q.; Gao, P.; Ren, J. Biochar and organic fertilizer changed the ammonia-oxidizing bacteria and archaea community structure of saline–alkali soil in the North China Plain. J. Soil. Sediment. 2020, 20, 12–23. [Google Scholar] [CrossRef]


| Treatments | Total N2O | Urea-Derived N2O | % | Soil-Derived N2O | % |
|---|---|---|---|---|---|
| ng N g−1 Soil | ng N g−1 Soil | ng N g−1 Soil | |||
| CK | 1.43 ± 0.12 h | — | — | 1.43 ± 0.12 h | 100.00% |
| N1 | 8.72 ± 0.24 fg | 0.77 ± 0.08 e | 8.77% | 7.96 ± 0.17 fg | 91.23% |
| N1S1 | 7.46 ± 1.06 g | 0.48 ± 0.10 e | 6.41% | 6.98 ± 0.96 g | 93.59% |
| N1S2 | 8.30 ± 0.44 fg | 0.59 ± 0.05 e | 7.06% | 7.71 ± 0.40 g | 92.94% |
| N1S3 | 6.54 ± 0.50 g | 0.35 ± 0.05 e | 5.42% | 6.18 ± 0.45 g | 94.58% |
| N2 | 17.47 ± 0.92 d | 2.20 ± 0.20 d | 12.57% | 15.28 ± 0.73 d | 87.43% |
| N2S1 | 12.90 ± 1.33 e | 1.05 ± 0.11 e | 8.15% | 11.85 ± 1.22 e | 91.85% |
| N2S2 | 11.31 ± 0.23 ef | 0.94 ± 0.02 e | 8.30% | 10.37 ± 0.24 ef | 91.70% |
| N2S3 | 13.79 ± 1.14 e | 1.36 ± 0.14 de | 9.85% | 12.43 ± 1.03 e | 90.15% |
| N3 | 35.99 ± 2.85 a | 7.70 ± 1.15 a | 21.41% | 28.29 ± 1.88 a | 78.59% |
| N3S1 | 19.78 ± 0.15 cd | 2.28 ± 0.03 d | 11.52% | 17.50 ± 0.13 cd | 88.48% |
| N3S2 | 22.81 ± 0.66 c | 3.39 ± 0.04 c | 14.86% | 19.42 ± 0.70 c | 85.14% |
| N3S3 | 27.10 ± 0.88 b | 4.48 ± 0.30 b | 16.52% | 22.62 ± 0.69 b | 83.48% |
| A | B | C | D | E | F | G | H | I | J | K | L | M | |
|---|---|---|---|---|---|---|---|---|---|---|---|---|---|
| A | 1 | ||||||||||||
| B | 0.959 ** | 1 | |||||||||||
| C | 0.997 ** | 0.932 ** | 1 | ||||||||||
| D | 0.915 ** | 0.836 ** | 0.924 ** | 1 | |||||||||
| E | 0.796 ** | 0.662 ** | 0.823 ** | 0.828 ** | 1 | ||||||||
| F | 0.926 ** | 0.856 ** | 0.932 ** | 0.997 ** | 0.823 ** | 1 | |||||||
| G | 0.891 ** | 0.778 ** | 0.91** | 0.865** | 0.953** | 0.867** | 1 | ||||||
| H | 0.612 ** | 0.481 ** | 0.641 ** | 0.785 ** | 0.665 ** | 0.735 ** | 0.64 ** | 1 | |||||
| I | 0.138 | 0.017 | 0.171 | 0.302 | 0.607 ** | 0.283 | 0.337 * | 0.387 * | 1 | ||||
| J | 0.711 ** | 0.698 ** | 0.704 ** | 0.58 ** | 0.38* | 0.582 ** | 0.525 ** | 0.424 ** | −0.196 | 1 | |||
| K | −0.037 | −0.142 | −0.006 | 0.037 | 0.205 | 0.016 | 0.122 | 0.191 | 0.316 * | −0.221 | 1 | ||
| L | 0.611 ** | 0.546 ** | 0.62 ** | 0.498 ** | 0.47 ** | 0.497 ** | 0.567 ** | 0.385 * | −0.027 | 0.434 ** | 0.2 | 1 | |
| M | 0.589 ** | 0.529 ** | 0.598 ** | 0.509 ** | 0.396 * | 0.506 ** | 0.489 ** | 0.408 ** | −0.051 | 0.604 ** | −0.035 | 0.686 ** | 1 |
| A | B | C | D | E | F | G | H | I | J | K | L | M | |
|---|---|---|---|---|---|---|---|---|---|---|---|---|---|
| Residue | 26 *** | 24 *** | 21 *** | 4 * | 4 * | 6 ** | 0 | 1 | 14 *** | 37 *** | 52 *** | 12 *** | 40 *** |
| Urea | 290 *** | 135 *** | 298 *** | 266 *** | 81 *** | 373 *** | 110 *** | 12 *** | 2 | 26 *** | 19 *** | 36 *** | 30 *** |
| Residue × Urea | 10 *** | 11 *** | 8 *** | 3 * | 1 | 5 ** | 0 | 0 | 0 | 10 *** | 16 *** | 20 *** | 4 ** |
Publisher’s Note: MDPI stays neutral with regard to jurisdictional claims in published maps and institutional affiliations. |
© 2021 by the authors. Licensee MDPI, Basel, Switzerland. This article is an open access article distributed under the terms and conditions of the Creative Commons Attribution (CC BY) license (https://creativecommons.org/licenses/by/4.0/).
Share and Cite
Wu, K.; Zhang, Z.; Feng, L.; Bai, W.; Feng, C.; Song, Y.; Gong, P.; Meng, Y.; Zhang, L. Effects of Corn Stalks and Urea on N2O Production from Corn Field Soil. Agronomy 2021, 11, 2009. https://0-doi-org.brum.beds.ac.uk/10.3390/agronomy11102009
Wu K, Zhang Z, Feng L, Bai W, Feng C, Song Y, Gong P, Meng Y, Zhang L. Effects of Corn Stalks and Urea on N2O Production from Corn Field Soil. Agronomy. 2021; 11(10):2009. https://0-doi-org.brum.beds.ac.uk/10.3390/agronomy11102009
Chicago/Turabian StyleWu, Kaikuo, Zhe Zhang, Liangshan Feng, Wei Bai, Chen Feng, Yuchao Song, Ping Gong, Yue Meng, and Lili Zhang. 2021. "Effects of Corn Stalks and Urea on N2O Production from Corn Field Soil" Agronomy 11, no. 10: 2009. https://0-doi-org.brum.beds.ac.uk/10.3390/agronomy11102009