Article

Understanding Growth Rate Patterns among Different Drought Resistant Sugarcane Cultivars during Plant and Ratoon Crops Encountered Water Deficit at Early Growth Stage under Natural Field Conditions

by
Jidapa Khonghintaisong
1,
Patcharin Songsri
1,2 and
Nakorn Jongrungklang
1,2,*
1
Department of Agronomy, Faculty of Agriculture, Khon Kaen University, Khon Kaen 40002, Thailand
2
Northeast Thailand Cane and Sugar Research Center, Faculty of Agriculture, Khon Kaen University, Khon Kaen 40002, Thailand
*
Author to whom correspondence should be addressed.
Submission received: 26 August 2021 / Revised: 2 October 2021 / Accepted: 15 October 2021 / Published: 19 October 2021

Abstract

:
Drought-tolerant sugarcane genotypes have been proposed to alleviate the issue of early water deficits; however, it is important to investigate the impact of phenology on the crop growth rate and growth patterns. This study aimed to investigate the responses of different water deficit-tolerant cultivars on crop growth rate patterns of both plant crop and ratoon under rain-fed and well-irrigated conditions, and to determine the relationship between final stalk dry weight and crop growth rates during water deficit, recovery, and maturity phases. A 2 × 6 split plot in a randomized complete block design with four replications was used. Two water regimes, namely, field capacity (FC) and rain-fed conditions, were assigned as the main plot, whereas six sugarcane cultivars differing in water deficit-tolerant levels were assigned as sub-plots. Sugarcane cultivar KK3 consistently possessed high potential and low reduction in dried shoot weight. A correlation was found between stalk dry weight and stem growth rate, shoot growth rate, and height growth rate (HGR) during the recovery period in the first season, and HGR at the recovery stage was correlated with the dry weight of ratoon. The recovery phase of early water deficit stress was a key stage for determining the final stalk dry matter. The desired cultivars having a good adaptation to water deficit stress at the formative stage, such as KK3, showed a gradually increased growth rate during the early water deficit stage, but this growth accelerated, and the maximum growth rate was reached, during the recovery period. This knowledge will help to clarify the selection of sugarcane cultivars in breeding programs that can resist water deficit at the early growth stage.

1. Introduction

Sugarcane occupies around 28,199,696 ha or 1.75% of the total global agricultural area and is distributed in tropical and sub-tropical regions, namely, South America, South Asia, Africa, Australia, Polynesia, and Melanesia [1]. This crop is a good material for ethanol and sugar production [2], contributing 80% of the total global sugar production; thus, it has become an important economic crop in many countries [3]. A combined share of 60% of sugar is produced by Brazil, China, India, and Thailand [1,3], and Thailand is now ranked as the world’s second largest sugar exporter after Brazil [4]. Increasing greenhouse gas emissions are significantly affecting crop production by causing climate variations [1]. Variations in precipitation significantly interfere with the growth and yield of crops, and are considered a critical problem. Water deficit is a detrimental factor for crop growth in most plant species, including in sugarcane, resulting in yield reduction [5,6,7]. In sugarcane, water deficit at the early growth stage is a major phenomenon commonly seen in the tropics, and this condition leads to yield reductions in both the main plants [2,8] and the ratoon [9]. Three plant mechanisms in response to water deficit are well understood, namely, drought escape, avoidance, and tolerance [10]. Drought escape implies rapid growth and development to complete the plant’s life cycle; however, this strategy is not suitable for perennial crops such as sugarcane [11]. Drought avoidance explains how plants experiencing water deficit can maintain water uptake, reduce water loss, and retain leaf water status. This allows plant recovery when the water stress is alleviated. This mechanism, however, leads to reduced dry matter accumulation due to large decreases in transpiration and photosynthesis activities [12,13]. Finally, drought tolerance allows crop species to maintain plant functions via osmotic adjustment, photosynthesis rate, chlorophyll content, and transpiration [12]. In general, drought tolerance during the vegetative phase of any crop is an essential trait required to reach a high yield [14]. Thus, an affordable means to alleviate this problem is by growing water deficit-tolerant sugarcane cultivars. Better understanding of crop growth rates and growth patterns is required for revealing the mechanism of sugarcane cultivars encountering water deficit stress.
The sugarcane growth process results in changes in the plant’s physiology, biochemical composition, and sugarcane shape and structure [15]. The crop growth pattern comprises three major stages, namely, early growth, grand growth, and maturity [16]. Both tillering and elongation stages are identified as critical phases of cane growth [15]. Thus, plants having different growth patterns result in different cane yields [14]. Sugarcane growth attributes, i.e., leaf area index (LAI), leaf area, net assimilation (NAR), and crop growth rate (CGR) are the major parameters used to estimate the growth [15], and the selection of genotypes depends on various parameters related to growth patterns via shoot dry weight accumulation throughout the cycle [17]. The parameters used to undertake crop growth rate (CGR) analysis are physiological and agronomic traits [14,18,19]. The mechanism involving CGR, as a rapid or slow increase in the growth rate under an optimum water regime, has an effect of increasing the yield, and the relationship between NAR, CGR, and sugarcane yield should be used to estimate yield [14]. CGR is increased up to 330 days after planting (DAP) and decreases thereafter, and CGR is related to NAR and LAI under normal conditions [20]. At 220 DAP, sugarcane growth has a peak CGR of 26 g m−2 day−1 [17]. In pot conditions, the relative height growth rate (HGR) of cane decreased under early season drought [21,22]. Stalk and leaf prolongation rates are highly sensitive descriptors of plant water status and irrigation [23]. In a plant cane experiment, sugarcane grown under conditions of withholding irrigation during 150–210 DAP had a lower LAI, NAR, CGR, and stalk elongation rate than that under 50% depletion of available soil moisture [16]. Dehydration at the early stage of plant cane may be different with ratoon, because ratoon has a shorter drought duration. In general, the first crop is harvested at 13–15 months after planting (MAP) in order to reach a peak of sugar accumulation [24,25]; subsequently, the second and third harvest, called the ratoon stage, are harvested at 10–12 months after harvest (MAH) [26]. Although previous reports noted the responses of CGR under water deficit at the formative phase, the CGR responses of sugarcane ratoon have not been reported.
In addition, information on the CGR and HGR patterns during the water deficit, recovery, and maturity phases of sugarcane plants and ratoons when subjected to a water deficit during the complete crop phase is still lacking. Therefore, this study aimed: (1) to investigate the responses of different water deficit-tolerant cultivars in terms of the crop growth rate patterns of both plant crop and ratoon under rain-fed and well-irrigated conditions; and (2) to determine the relationships between stalk dry weight at final harvest and CGR during water deficit, recovery, and maturity phases. The information gained in this study elucidates the patterns of sugarcane growth rates between water deficit-tolerant and susceptible sugarcane cultivars for breeding program purposes.

2. Materials and Methods

2.1. Experimental Design and Cultural Practices

The experiment was conducted under field condition at the Agronomy Research Station, Khon Kaen University, Khon Kaen, Thailand (16°28′ N, 102°48′ E, 200 m above sea level) in December 2015–February 2018 (sugarcane plant and ratoon crops). A 2 × 6 split plot in a randomized complete block design with four replications was used. Two water regime managements—field capacity (FC) (FC = 12.16%) and rain-fed conditions—were assigned as main plots. Six available Thai sugarcane cultivars—UT13, UT12, KKU99-02, KKU99-03, Kps01-12, and KK3—differing in water deficit-tolerant levels were assigned as sub-plots. UT13, KPS01-12, and KK3 cultivars were identified as high tolerance, whereas UT12, KKU99-02, and KKU99-03 cultivars were susceptible [27]. Cultivar UT13 had vertical leaf orientation equipped with slender and long leaves, whereas KK3, Kps01-12, UT12, KKU99-02, and KKU99-03 had horizontal leaf orientation, big leaf size, and high leaf surface area. KK3 had the highest leaf area per stool and leaf weight, followed by Kps01-12 and KKU99-03; UT13 had the lowest leaf area per stool. Two cultivars, UT12 and KKU99-02, had a small number of leaves and low leaf area per stool.
A sugarcane sett was planted in a plastic bag to generate uniform sugarcane seedlings. At 30 days after planting (DAP), sugarcane seedlings were transplanted to the field. Each main plot comprised of six sub-plots in which the sub-plot size was seven rows of 5.5 m long and plant spacing of 0.5 × 1.5 m, totaling 48 plots. The soil type was identified as siliceous, isohypothermic, Oxic Paleustults, Yasothon series; WRB: Arenosols, a sandy soil, composed of 84.93% sand, 5.07% clay, and 10.0% silt. The soil chemical properties were as follows: a pH of 5.51, a cation exchange capacity of 3.09 c mol kg−1, 0.85% organic matter, 0.03% total N, 32.28 mg kg−1 available P, 30.41 mg kg−1 exchangeable K, and 214.23 mg kg−1 exchangeable Ca. A chemical fertilizer formula at the rates of 50 kg N ha−1, 50 kg P ha−1, and 25 kg K ha−1 was applied 4 times: (1) basal fertilizer at transplanting date; (2) top dressing at tillering stage in the first year or 4 months after planting (MAP); (3) top dressing after harvest; and (4) top dressing at the tillering stage in the second year or ratoon (4 months after harvest/MAH). Weed control was manually carried out at 2, 4, 6, and 8 MAP/MAH to keep the plants free from weeds throughout the experimental period. A basal application of carbofuran (FMC AG company, Bangkok, Thailand)(2,3-dihydro-2,2-dimethyl benzofuran-7-ylmethylcarbamate 3% granular) was undertaken at the transplanting date. There was no serious outbreak of insects or diseases throughout the experiment; thus, chemical pesticide was not applied.
Irrigation water with a pH of 7.08 and an EC of 0.7 dS m−1 was derived from a pond located at the same research station. For FC treatment, drip irrigation was regularly applied to maintain the constant soil moisture at FC level (12.16%) from transplanting to harvest stages, and the soil moisture content was controlled with less than 1% deviation from FC level. The crop water requirement of sugarcane was first calculated following the formula of Jangpromma et al. [28]:
ETcrop = ETo × Kc
where ETcrop is the crop water requirement (mm day−1); ETo is the evapotranspiration of a reference crop under a specified condition calculated by the evaporation pan method (ETo = Kp × Epan; Kp = pan coefficient (class A plan with green fetch) and Epan = pan evaporation (mm day−1)); Kc is the crop water requirement coefficient for sugarcane (initial stage (0–60 days after planting; DAP) Kc = 0.31, tillering stage (61–130 DAP) Kc = 1.15, mid-season (131-300 DAP) Kc = 1.25, and late season (>300 DAP) Kc = 0.90) [29].
Then, the net irrigation rate was calculated as the actual crop water requirement applied throughout the experiment. This calculation considered several factors including soil mass (kg per plant), soil moisture content (%), ETcrop (mm day−1), and rainfall rate (mm). The details of the calculation steps and the formula can be found in Table S1. For the first year or the planting crop, the number of irrigations applied was 243 and the total net irrigation rate applied was 10,670.3 m3 ha−1, partitioned as follows: 3975.9 m3 ha−1 in the dry season, 3397.8 m3 ha−1 in the rainy season, and 3297.2 m3 ha−1 at maturity stage. For the second year or ratoon crop, the number of irrigations was 147 and the total net irrigation rate applied was 7198.3 m3 ha−1 partitioned into 1366.1 m3 ha−1 in the dry season, 1852.1 m3 ha−1 in the rainy season, and 3980.1 m3 ha−1 at maturity stage.
For rain-fed treatment, two periods of supplementary irrigation were applied at FC level as follows: from transplanting to 2 MAP for gaining a uniform plant stand and from harvest to 2 MAH for enhancing a ratoon formation. Water was then withheld from 2 MAP/MAH to the harvest stage. Thus, the available water under the soil during that period depended only upon the actual precipitation.
Sugarcane was harvested on February 2017 (13 MAP) and February 2018 (12 MAH) for the first year and ratoon crops, respectively.

2.2. Data Collection

Meteorological Conditions and Soil Moisture Content

Meteorological data were collected from December 2015 to February 2018. Rainfall, relative humidity, and maximum and minimum temperatures were collected daily throughout the experiment from the weather station at Agronomy Research Station, Faculty of Agriculture, Khon Kaen University, Khon Kaen, Thailand. The distance between the weather station and the experiment was about 1.5 km. During the experiment, the total rainfall was 2591.9 mm. Daily relative humidity ranged from 53.0 to 97.0%. The maximum daily air temperature ranged from 8.0 to 30.0 °C, whereas the minimum daily air temperature ranged from 22.5 to 43.0 °C.
Soil moisture content was measured at one month intervals from the transplanting date (1 MAP to 9 MAP) and from 1 MAH to 9 MAH using the gravimetric method at the soil depths of 0–15 cm and 15–30 cm (Table S2). The soil samples were weighed and oven-dried at 105 °C for 72 h. Then, the percentage of soil moisture was determined from the weights of both wet and dry soils and was calculated as follows:
soil   moisture   content =   wet   soil dry   soil dry   soil ×   100
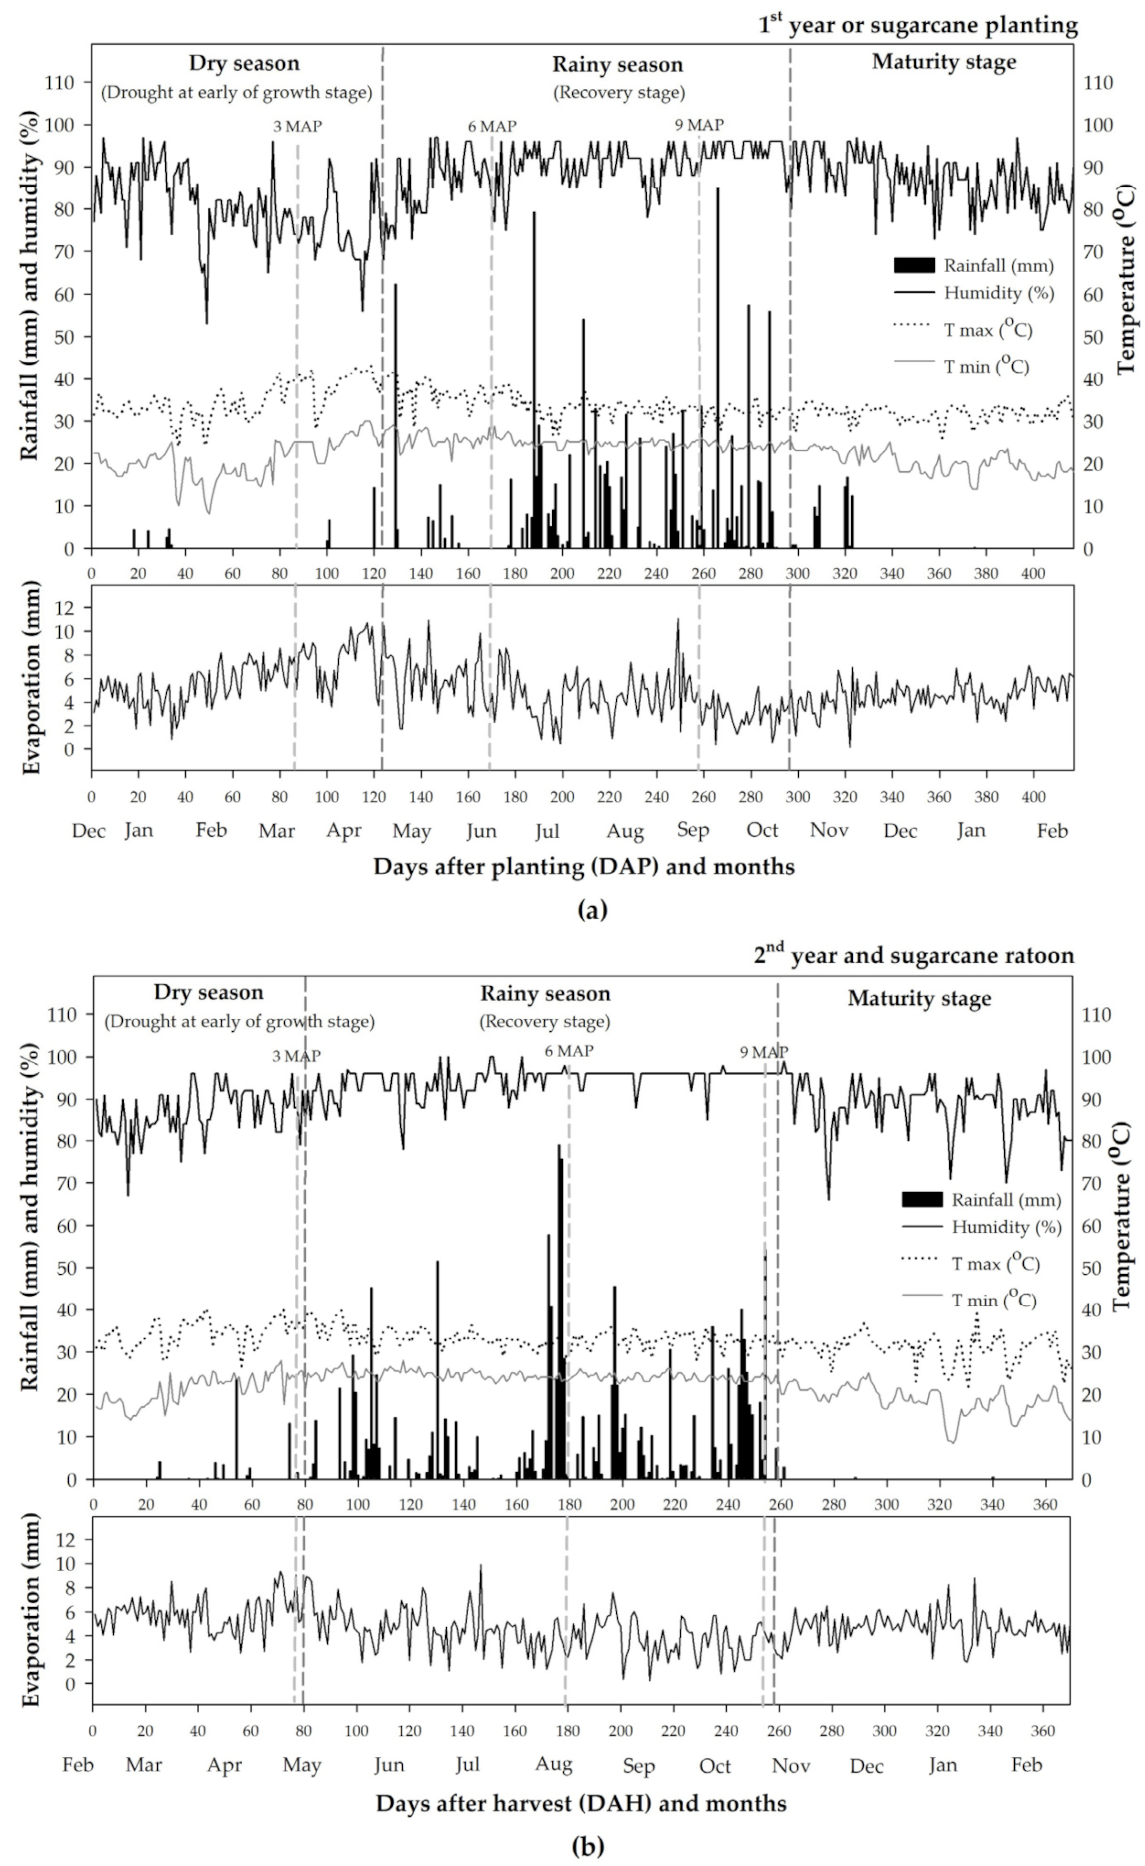
During the first-year crop, the total rainfall in dry season (from January to late April) was 39.3 mm, illustrating the presence of early water deficit stress under rain-fed condition. Daily relative humidity ranged from 25.3 to 76.9%. At establishment and tillering stages in the dry season, the maximum daily air temperature ranged from 24.0 to 40.5 °C, whereas the minimum daily air temperature was 8.0–25.5 °C. The first rainfall was as much as 62.4 mm at the recovery stage or the rainy season, and escalated to 1033.0 mm at the vegetative stage. Moreover, in the rainy season, the relative humidity was around 75.0–92.3%, and the minimum and maximum daily temperatures were 20.5–28.8 °C and 26.8–40.5 °C, respectively (Figure 1a).
After sugarcane harvest or ratoon stage, the total rainfall was 54.2 mm, which was greater than that during the first growing year during regeneration and canopy development periods. The minimum daily air temperature ranged from 14.0 to 28.0 °C and the maximum daily air temperature was 26.3–40.0 °C during the dry season, and the relative humidity was around 67.0–77.5%. These weather profiles represented the presence of water deficit stress at the early growth stage of ratoon plants. During the recovery phase of the second season, the total rainfall was 324.59 mm (rainfall during the recovery stage of the 2nd year was 1360.9 mm, and that of the 1st year was 1033.0 mm), which was higher than that of the first season, whereas 1360.9 mm of total rainfall was recorded from the first rainfall to the recovery stage. Daily relative humidity was around 66.0–99.6%, and the maximum and minimum daily temperature ranges were 23.0–36.5 °C and 8.5–26.0 °C, respectively. Therefore, re-watering during sugarcane growth depended on the rainfall period, but it was not based on months after planting or harvest (Figure 1b).
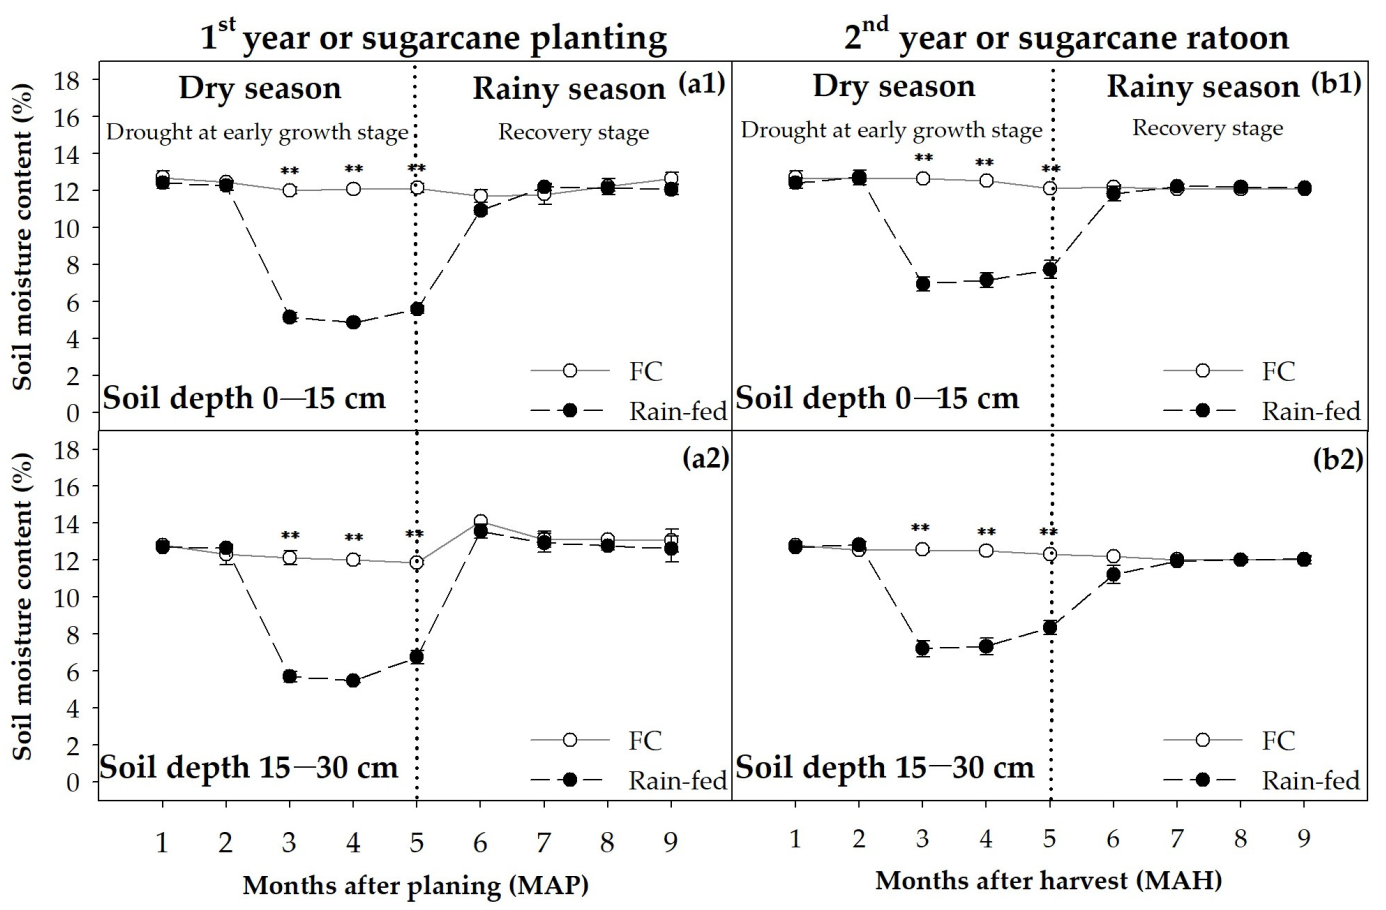
Two water systems, full capacity and rain-fed, were applied to all sugarcane cultivars and obviously altered the soil moisture content under both planting and ratoon seasons. The soil moisture content from 0 to 3 MAP of both sugarcane planting and sugarcane ratoon gradually decreased under the rain-fed condition, and these values became stable after the recovery stage (6–9 MAP) of sugarcane growth (Figure 2). Moreover, the soil moisture content during the planting season was lower than that of the ratoon season while experiencing water deficit stress under the rain-fed treatment. This was explained by the fact that the rainfall occurred early with high intensity in the ratoon season. Therefore, the sugarcane planting season (around ¼ available water (AW)) was exposed to a more severe water deficit than the ratoon season (around 2⁄₄ AW).

2.3. Phenotypic Data of Sugarcane Growth

Stem and leaf dry weights were measured for growth analysis at 3, 6, 9, 12 MAP and MAH. Each sample derived from four plants per sub-plot was oven-dried at 80 °C for 72 h or until constant weight, and the dry weight of both stem and leaf were recorded separately. Shoot dry weight was then determined as the total of leaf and stem dry weights. Then, the values of all three parameters were converted to g m−2. The general formula to calculate crop growth rate (CGR) was described by Abu-Ellail et al. [14] and Sulistiono et al. [15] as follows:
CGR =   W 2 W 1 T 2 T 1
where W represents dry weight and T represents time.
Using the same concept, the CGR of each sugarcane part, including shoot, stem, and leaf, was calculated. The CGR analysis was undertaken for 3, 6, 9, 12 MAP and MAH.
The tagged six main stalks from the six representative stools per sub-plot were used to determine the stalk height. Each stalk of the sample was measured from the ground to the upper exposed dewlap at 3, 6, 9, 12 MAP and MAH. Height growth rate (HGR) was calculated as follows:
HGR =   dH 2 dH 1 dT 2 dT 1
where dh represents the height difference (height at the second measurement − height at the first measurement), and dt represents the time interval of two measurements (second date − first date).
Stalk dry weight (SDW) was recorded at harvest in both years (sugarcane planting and ratoon). The harvest area of each plot was 16.5 m2 or 22 plants of plant density. Whole stalks of each plot sample were cut at the ground level and then cleaned from the leaves. The samples were oven-dried at 80 °C for 72 h or until constant weight. Then, the drought tolerance index (DTI) was calculated to compare the values between rain-fed and field capacity conditions. The closer the value of DTI to 1, the higher the drought tolerance of the crop. The formula used was according to Taratima et al. [30], as follows:
DTI = Data of stress treatment Data of non stress treatment
and the percentage of stalk dry weight (SDW) reduction was calculated as follows:
% reduction of   SDW = SDW of non stress treatment     SDW of stress treatment   ×   100 SDW of non stress treatment

2.4. Statistical Analysis

Analysis of variance on all observed parameters was carried out by following an additive model of a split plot design, using the Statistix 8 software program version 8.0 (Analytical Software, Tallahassee, FL, USA). Mean comparisons on significant variables were undertaken by least significant differences (LSD) at the 0.05 probability level. The correlations between stalk dry weight and CGR (stem growth rate, leaf growth rate, shoot growth rate, and height growth rate) were performed using simple linear correlation [31]. Data of CGR at 6 and 9 MAP/MAH were averaged for the recovery period, and the correlations between these parameters were then derived in both sugarcane planting and ratoon seasons.

3. Results

3.1. Stalk Dry Weight of Different Water Deficit-Tolerant Sugarcane Cultivars across Two Water Regimes

Analysis of variance showed significant differences between soil moisture level treatments for stalk dry weight, stem growth rate (3, 6, 9 MAP), shoot growth rate (3, 6 MAP), leaf growth rate (3, 6, 9 MAP), height growth rate (3, 6, 9, 12 MAP) in sugarcane planting season. There were also difference between soil moisture level treatments for stalk dry weight, leaf growth rate (6 MAH), height growth rate (3 MAH) in the ratoon period. The differences among sugarcane genotypes were significant for stem growth rate (9 MAP), shoot growth rate (9 MAP), and height growth rate (3,6 MAP) at the planting stage, whereas the differences in the sugarcane ratoon period were significant for stalk dry weight, stem growth rate (6 MAH), shoot growth rate (6 MAH), shoot growth rate (6 MAH), and height growth rate (6 MAH). The effect of water × genotype (W×G) interaction was significant for stem growth rate and shoot growth rate (6, 12 MAH) at the sugarcane ratoon stage (data not shown). Thus, the stalk dry weight was separately analyzed as the response of each genotype to different water regimes.
At 12 MAP, when water deficit occurred at the early growth stage under rain-fed conditions, the stalk dry weight of six sugarcane cultivars was reduced. KK3, UT13, and Kps01-12 were defined as water deficit-tolerant cultivars according to the drought tolerance index (DTI) values, which were 0.57, 0.51, and 0.71, respectively. KKU99-02, KKU99-03, and UT12 had DTI of 0.44, 0.36, and 0.48, respectively; thus, these cultivars were classified as susceptible to water deficit. In general, the stalk dry weight of six cultivars grown under rain-fed conditions was lower than that under field capacity (FC) treatment in the first growing year. These reductions were 19.2 (43.02%), 21.7 (50.20%), 10.2 (30.22%), 20.0 (56.10%), 25.6 (72.28%), and 16.3 (46.78%) t h−1 for KK3, UT13, Kps01-12, KKU99-02, KKU99-03, and UT12, respectively. Thus, these six cultivars could be categorized based on the potential and reduction in stalk dry weight into four groups: (1) KK3 and Kps01-12 as high potential and low reduction; (2) UT13 as high potential and high reduction; (3) UT12 as low potential and low reduction; and (4) KKU99-02 and KKU99-03 as low potential and high reduction (Figure 3a).
The reductions in stalk dry weight caused by early water deficit under rain-fed condition in the second year (ratoon crop) were also noted. According to the results, these six cultivars could be clustered into four groups: (1) KK3 KKU99-02 and UT12 as high potential and low reduction; (2) KKU99-03 as high potential and high reduction; (3) Kps01-12 as low potential and low reduction; and 4) UT13 as low potential and high reduction (Figure 3b). There was a slightly different clustering pattern of the six cultivars between planting and ratoon crops; however, the KK3 cultivar was stable, and belonged in the group with high potential and low reduction in stalk dry weight.

3.2. Crop Growth Rate Patterns under Natural Water Deficit at Early Stage

The shoot growth rate of six sugarcane cultivars showed different patterns under water deficit at the early growth phase. Under rain-fed conditions, the growth rate of the plant crop of sugarcane cultivars gradually increased during water deficit in the early growth stage, then accelerated and reached the maximum growth rate at the recovery stage (9 MAP). The growth rate declined during the maturity stage. Ratoon plants of sugarcane showed similar growth rate patterns to those of the plant crop, with the exception that, during the recovery period (6 MAH), they showed a faster growth rate pattern than the first crop due to rapid rainfall. The first group having a high potential and low reduction was represented by sugarcane cultivars KK3 and Kps01-11. KK3 and Kps01-12 were classified in the first group because these cultivars had shoot growth rates around 31.23 and 27.97 g day−1, respectively, under rain-fed treatment, which were close to those of under FC treatment. KK3 had a low adaptation at the early growth stage illustrated by the shoot growth rate pattern. Moreover, the shoot growth rate of KK3 under FC treatment increased during the re-watering phase. Rain-fed treatment of KK3 slightly changed the shoot growth rate at 6 MAP or the early recovery phase, and at 6 MAP the shoot growth rate rapidly increased (Figure 4a). Furthermore, Kps01-12 during the recovery phase had a slow increase in the shoot growth rate at 6 MAP, and this accelerated at 9 MAP under rain-fed conditions. Thereafter, it decreased during the maturity period; this outcome was not significantly different from that of the FC condition (Figure 4c). UT13, which was identified as a cultivar with high yield potential and reduction, revealed a similar shoot growth rate pattern to Kps01-12 in the first season, whereas the difference in the shoot growth rates during the recovery phase between FC and the rain-fed treatment of UT13 was greater than that of Kps01-12 (Figure 4b). Moreover, KK3, Kps01-12, and UT13 in the plant crop adapted well regarding their shoot growth rates during the re-watering period, indicating that crop growth rate in this phase could potentially promote final stalk dry weight under rain-fed conditions in the early growth stage. UT12, which was identified as a cultivar with low yield potential and reduction, had similar shoot growth rate when grown under FC and rain-fed conditions at 3 MAP. However, the shoot growth rate then slowed in rain-fed conditions, and differed between FC and rain-fed treatments during the recovery phase. Moreover, at the ripening stage, the UT12 growth was not significant and the shoot growth rate was reduced in both treatments (Figure 4d). Finally, among the low potential and high reduction group comprising KKU99-02 and KKU99-03, KKU99-02 showed a smaller increase in shoot growth rate under rain-fed conditions compared to the FC treatment in the range from 3 to 6 MAP. A significant shoot growth rate was shown for both treatments during the recovery stage, and thereafter reduced during the maturity phase of both treatments (Figure 4e). The KKU99-03 cultivar showed a different shoot dry weight of both treatments at 6 MAP; thereafter, these were not significant, whereas a slow increase in the shoot growth rate was seen during the late recovery and maturity phases. Although the shoot growth rate was extended during ripening, it did not support the stalk dry weight (Figure 4f). The shoot growth rates of all sugarcane genotypes during the first year were not significant under both conditions from germination to 3 MAP, or when water-limited at the early growth stage. Therefore, groups 3 and 4 showed that the shoot growth rate did not adapt during the recovery stage, indicating that it is essential to promote stalk dry weight, as presented in the water deficit-susceptible sugarcane cultivars.
All tested sugarcane cultivars in the second year or ratoon plants could be classified into four groups. The first group, having high potential and low reduction, comprised cultivars KK3, KKU99-02, and UT12. The shoot growth rate of KK3 was similar at the formative phase between FC and rain-fed treatments, and this result revealed a similar response during the first crop year. KK3 showed a gradual increase in the shoot growth rate after 4 MAH, which was faster in the ratoon season than the plant season because rainfall occurred earlier in the former season. Thereafter, the shoot growth rate of KK3 during the maturity stage was reduced in both treatments, but by less under rain-fed conditions than in the FC treatment (Figure 4g). The shoot growth rate of KKU99-02 increased more under rain-fed conditions than under the FC treatment during the recovery stage; thereafter, non-significant reductions in the shoot growth rate were seen under both the FC treatment and rain-fed conditions (Figure 4k). During the second year, there was no difference in the shoot growth rate of UT12 between FC and rain-fed treatments throughout the sugarcane growth, and the shoot growth rate was similar in FC and rain-fed treatments during the recovery phase (Figure 4j). KK3, KKU99-02, and UT12 cultivars had high stalk dry weights under the rain-fed treatment, and there were similar average CGR values in the FC and rain-fed treatments. At recovery, there was a large difference in the shoot growth rate for KKU99-02, and a smaller difference for UT12, which contributed to the stalk dry weight that had high potential and low reduction. KKU99-03 showed high potential and high reduction, and had a greater shoot growth rate under the FC treatment than the rain-fed treatment under drought during the early growth stage. Moreover, a different shoot growth rate was seen during the recovery phase in the FC and rain-fed treatments. At 9 MAH, the shoot growth rate of KKU99-03 decreased, and was constant at 12 MAH, but was not different in the FC and rain-fed treatments (Figure 4l). Kps01-12 showed low potential and low reduction; this pattern showed a small increase in the shoot growth rate during the water-limited stage until 6 MAH of both treatments. In the ripening phase, Kps01-12 showed a greater reduction in the shoot growth rate under the rain-fed treatment than the FC treatment (Figure 4i). UT13 showed low potential and high reduction; this was seen as a different shoot growth rate under the rain-fed treatment compared to the FC treatment throughout the sugarcane growth, expect at 9 MAH (Figure 4h). Moreover, the KK3 cultivar was classified to the first group (high potential and low reduction) of both crops, whereas each of the other sugarcane cultivars was placed into different groups for the sugarcane plant and ratoon seasons.
The stem growth rates of the six sugarcane cultivars were similar to their shoot growth rate patterns, with the exception of KKU99-02, which had a significantly different stem growth rate between FC and rain-fed treatments at 9 MAP and 9 MAH (Figure 5). Therefore, the response of shoot growth rate had a greater proportion of stem than leaf.
The six sugarcane cultivars had different leaf growth rate (LGR) patterns. During the planting season, KK3, KKU99-02, and KKU99-03 under the rain-fed treatment showed a slow increase in the leaf growth rate during 6–9 MAP, which was significantly different between FC and rain-fed treatments. Thereafter, a decrease in the leaf growth rate occurred at 12 MAP. UT13, Kps01-12, and UT12 showed a slow increase in the leaf growth rate at 6 MAP. Thereafter, a slow decrease in the leaf growth rate was seen until 12 MAP; this decrease was not different between FC and rain-fed treatments (Figure 6a–f). During the ratoon season, KK3 under the rain-fed treatment showed a slight increase in the leaf growth rate at 3 MAH; thereafter, it slowly reduced until 12 MAH, and no significant difference between FC and rain-fed treatments was seen (Figure 6g). UT13 showed an increase in leaf growth rate at 3 MAH and a reduced leaf growth rate during 6–9 MAH; thereafter, a small increase in leaf growth rate was seen at 12 MAH, and this was not significantly different between FC and rain-fed treatments (Figure 6h). UT12 and KKU99-03 had the same leaf growth pattern as that of UT13, whereas UT12 showed a low leaf growth rate under the rain-fed treatment at 3 MAH. By comparison, KKU99-03 showed a higher leaf growth rate at 6 and 12 MAH, and a low leaf growth rate at 9 MAH under the rain-fed treatment (Figure 6j,l). Kps01-12 had the same leaf growth rate pattern as that of KK3, whereas it showed a low leaf growth rate under the rain-fed treatment compared to the FC treatment at 3 MAH (Figure 6i). KKU99-02 showed an increase in leaf growth rate at 3 and 9 MAH, and a decreased leaf growth rate at 6 and 12 MAH. The leaf growth rates differed between FC and rain-fed treatments at 3, 6, and 12 MAH (Figure 6k).
Moreover, all sugarcane cultivars during the planting season showed similar height growth rate patterns, and differences in the height growth rates when comparing FC and rain-fed treatments at 3 and 6 MAP. The height growth rate under the FC condition was greater with early re-watering than during water deficit periods. Thereafter, the height growth rate of sugarcane increased under rain-fed conditions at 9 MAP, and rapidly reduced during the ripening stage. By comparison, groups 1 and 2, which comprised water deficit-tolerant sugarcane genotypes (KK3, Kps01-12, and UT13), showed larger increases in height growth rate than those of groups 3 and 4, which comprised the sugarcane cultivars susceptible to water deficit (KKU99-02, KKU99-03, and UT12). During the ratoon period, KK3 and Kps01-12 did not show a significant difference in the height growth rate throughout the sugarcane growth period, but the stalk dry weight of Kps01-12 decreased more than that of KK3. The height growth rate pattern of UT13 differed at 3 and 9 MAH, increasing under drought conditions at the early growth stage and decreasing in the late recovery phase under rain-fed conditions. KKU99-02, KKU99-03, and UT12 showed significant differences in the height growth rate at 3 MAH, but no differences otherwise (Figure 7).

3.3. Relationship between Stalk Dry Weight and Crop Growth Rate

There was no association between the stalk dry weight and the growth rates of leaf, stem, shoot, and height of sugarcane grown under rain-fed conditions at the early growth and maturity stages in the first and second years. High and positive correlations between stalk dry weight and growth rate (stem, shoot, and height) during the recovery phase were shown, indicating that these traits were important for sugarcane growth under water deficit. Moreover, stalk dry weight was positively correlated with height growth rate in sugarcane ratoon (Figure 8a–d). In addition, the stalk dry weight was not related to the leaf growth rate during the recovery period of both years. Therefore, the leaf growth rate did not contribute to the stalk dry weight.

4. Discussion

Sugarcane planted in the tropics usually experiences a water deficit during the early growing stage, from 2 to 4 MAP. Thereafter, the crop undergoes recovery due to the arrival of rainfall. The early season water deficit is a major factor that can limit sugarcane growth and production [8], and can reduce cane productivity by over 60% [32]. The general sugarcane production system has a two–three year growing period. In this system, the first year plants are harvested after 13–15 MAP under low temperature conditions; thus, climatic factors such as temperature and photoperiod are the main regulators of sugar accumulation [24,25]. Then, the ratoon crop (the second and third years) is harvested around 10–12 MAH [26]. In Thailand, the first year plants are usually harvested over 12 MAP (from December to March), according to the quota of sugarcane transport to the sugar factory [33]. As a result, the ratoon crop experiences a shorter water deficit duration in this system.
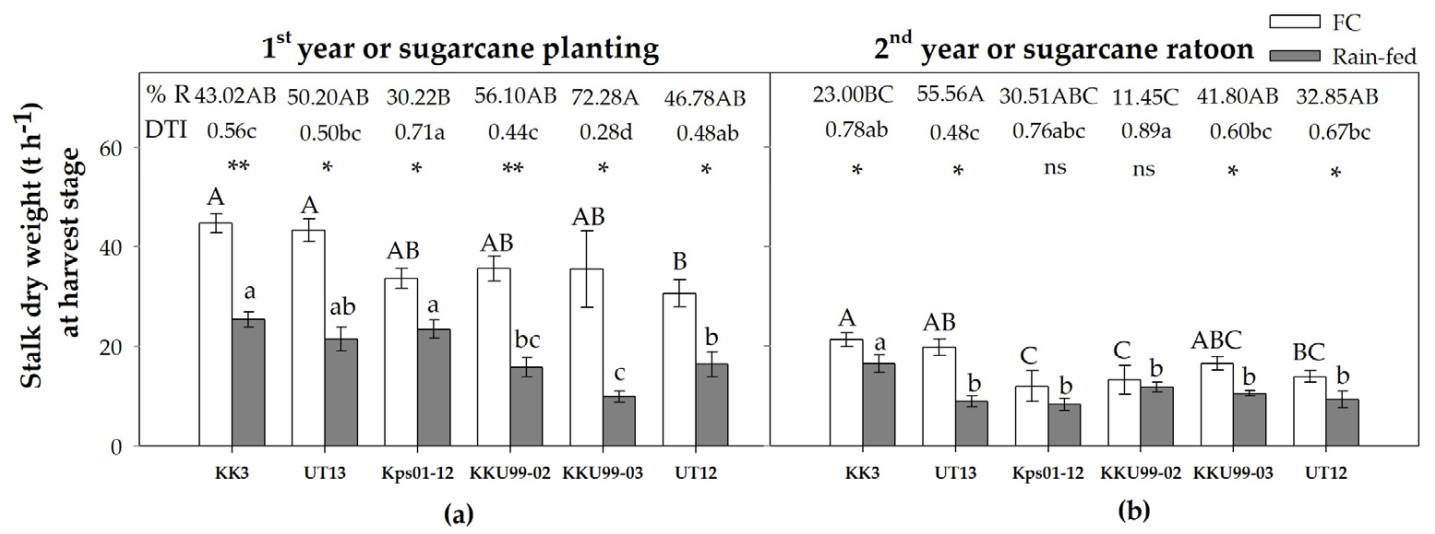
Among the six sugarcane cultivars, which differed in their level of water deficit tolerance, both potential and percent reduction in stalk dry weight differed significantly. Moreover, the average stalk dry weight of these cultivars derived from the cropping season was 41.81–55.81% higher than that derived from the ratoon season (Figure 3). This corroborates previous reports that the yield of sugarcane in Thailand is 22–36% lower in the ratoon crop compared to the plant crop [9]. On the contrary, in Egypt, no significant yield reduction in ratoon was found compared to the plant crop [14]. The variation in the ratoon yield of sugarcane may depend on the production system in individual regions. Although the grouping patterns of the tested cultivars differed slightly between the cropping and ratoon seasons, KK3 showed a consistent performance across the two years. A 25–30% lower yield shown by the tested cultivars in the ratoon season under rain-fed conditions was due to the reduced germination rate in the ratoon phase. This is expected because the germination rate is correlated with productivity in sugarcane [9]. In addition, water deficit-tolerant cultivars achieved a higher stalk dry weight than susceptible cultivars during the cane season. This corroborated the report of Silva et al. [21] that the resistance genotypes had higher yield, stalk height, and stalk weight than susceptible genotypes under water stress conditions. In addition, sugarcane productivity during the ripening period was affected by the joint impacts of crop management, genetic factors, and climate variables [27,34]. A multidisciplinary approach including physiological and molecular aspects is required to elucidate the defense mechanisms of sugarcane against water deficit stress. Several morphophysiological traits, such as photosynthesis and its efficiency, stomatal conductance, partitioning of dry weight, and green leaf numbers, promote shoot mass retention under water deficit stress [35], and the Fv/Fm can be applied to detect plant stresses at an early stage [36]. Gene expression levels and their bioactive molecules were studied to investigate the response of plants to abiotic stresses [37]. However, their function in determining the levels of tolerance against abiotic stress remains unknown. Thus, further investigations of the genetic functional assessment linked to the phenotypic performance of plants under field conditions are necessary [10].
CGR, LAI, NAR, and the stalk elongation rate of water regime treatments showed a continuous increase during the establishment period and a maximum increment in elongation growth. Thereafter, all parameters showed a tendency to decrease during the ripening stage. Moreover, all traits of sugarcane under severe water deficit conditions showed a greater reduction during early growth [16]. At the maturity stage, CGR increased until 330 days after planting (DAP) and decreased thereafter, and CGR was correlated with both NAR and LAI under normal conditions [20]. Total dry matter, CGR, maximum LAI, and NAR of sugarcane were lower in the ratoon crop than in the plant crop; CGR was reduced from 12.42 g m−2 day−1 in the plant crop to 11.11 g m−2 day−1 in the ratoon crop [38]. The peak of sugarcane CGR was found to be 26 g m−2 day−1 at 220 DAP or the elongation phase [17]. Sugarcane cultivars with high CGR were noted to achieve a high cane yield [14,
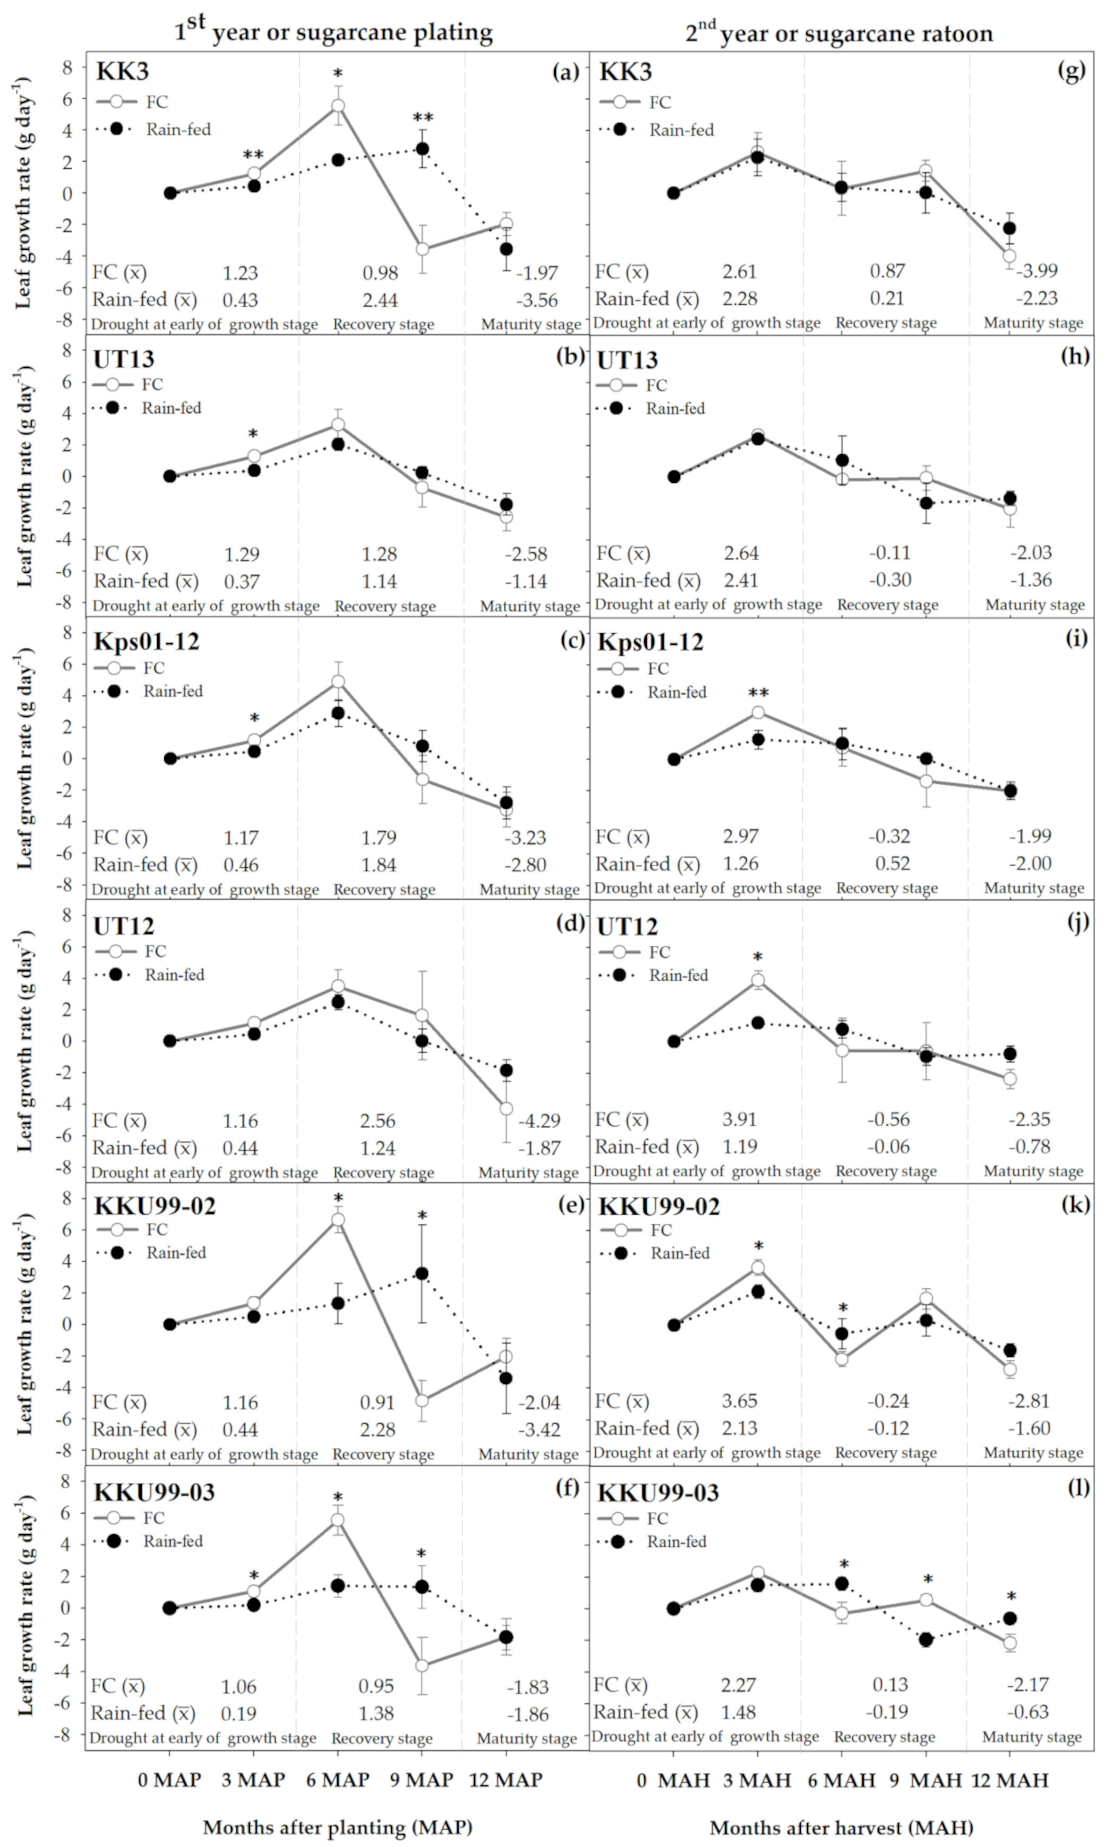
39]. In our study, LGR was evidently reduced by the early water deficit. This reduction was probably caused by two factors, namely, the unavailability of moisture and sugarcane plant acclimatization to improve the root/shoot ratio for maintaining water uptake [8]. The photosynthesis of sugarcane under water deficit conditions was disturbed because of low stomatal conductance, transpiration rate, internal CO2 concentration, and LAI [7,40,
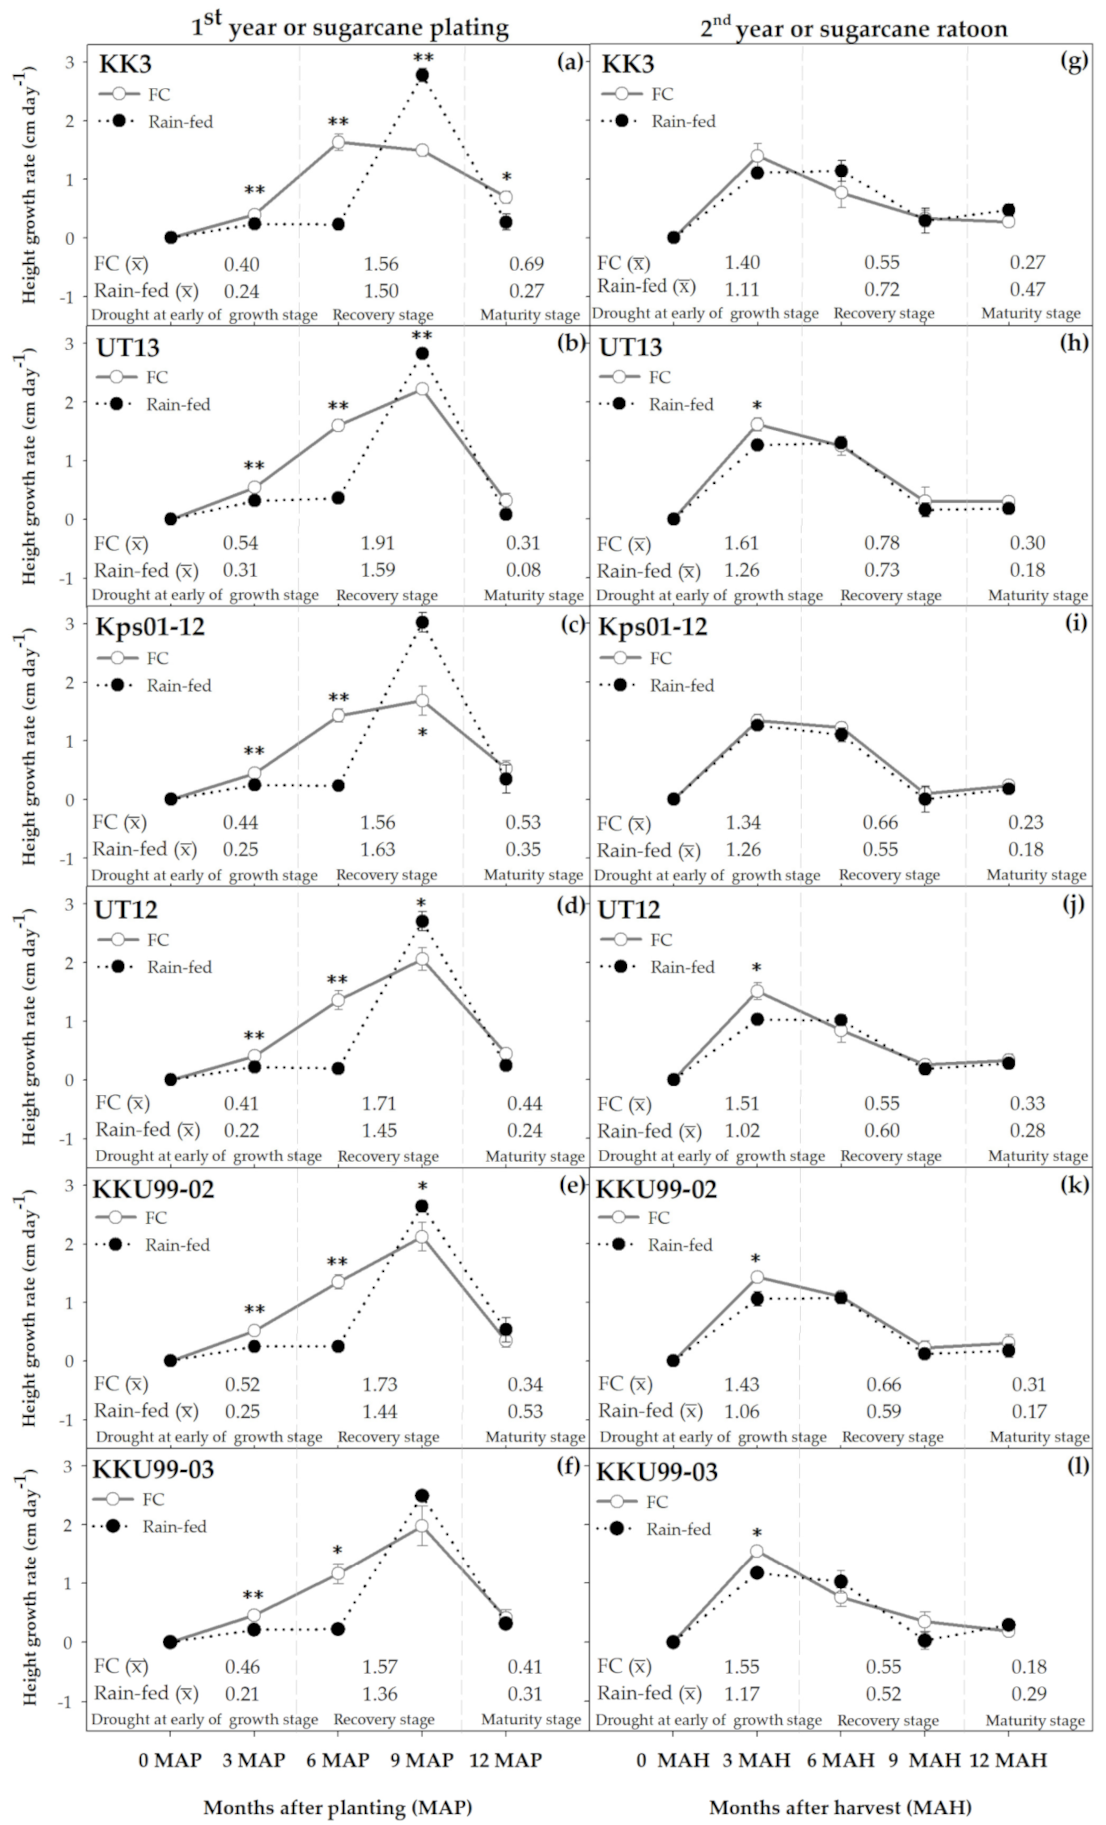
41]. The direct decrease in the supply of assimilates due to reduced photosynthesis may lead to a low LGR. In our study, the six sugarcane cultivars showed a similar reduction in HGR patterns during the early water deficit, and the HGR of these cultivars rapidly increased at 9 MAP (Figure 7). Jangpromma et al. [22] reported that the height growth of sugarcane was reduced under an early season water deficit at 110 DAP. Stalk and leaf elongation rates are quite sensitive descriptors of plant water status and irrigation [23]. In terms of biochemical substances, exogenous application of citric acid can induce abiotic stress tolerance by enhancing the chlorophyll content and maintaining plant growth under stress [42]. Moreover, the increase in the level of spermine, either endogenously in the plants or exogenously by manual application under water deficit conditions, can promote ROS scavenging activities and antioxidant defense mechanisms to protect plant membranes from any damage caused by abiotic stresses. Thus, this plays an important role as a signaling molecule to increase water deficit stress tolerance [
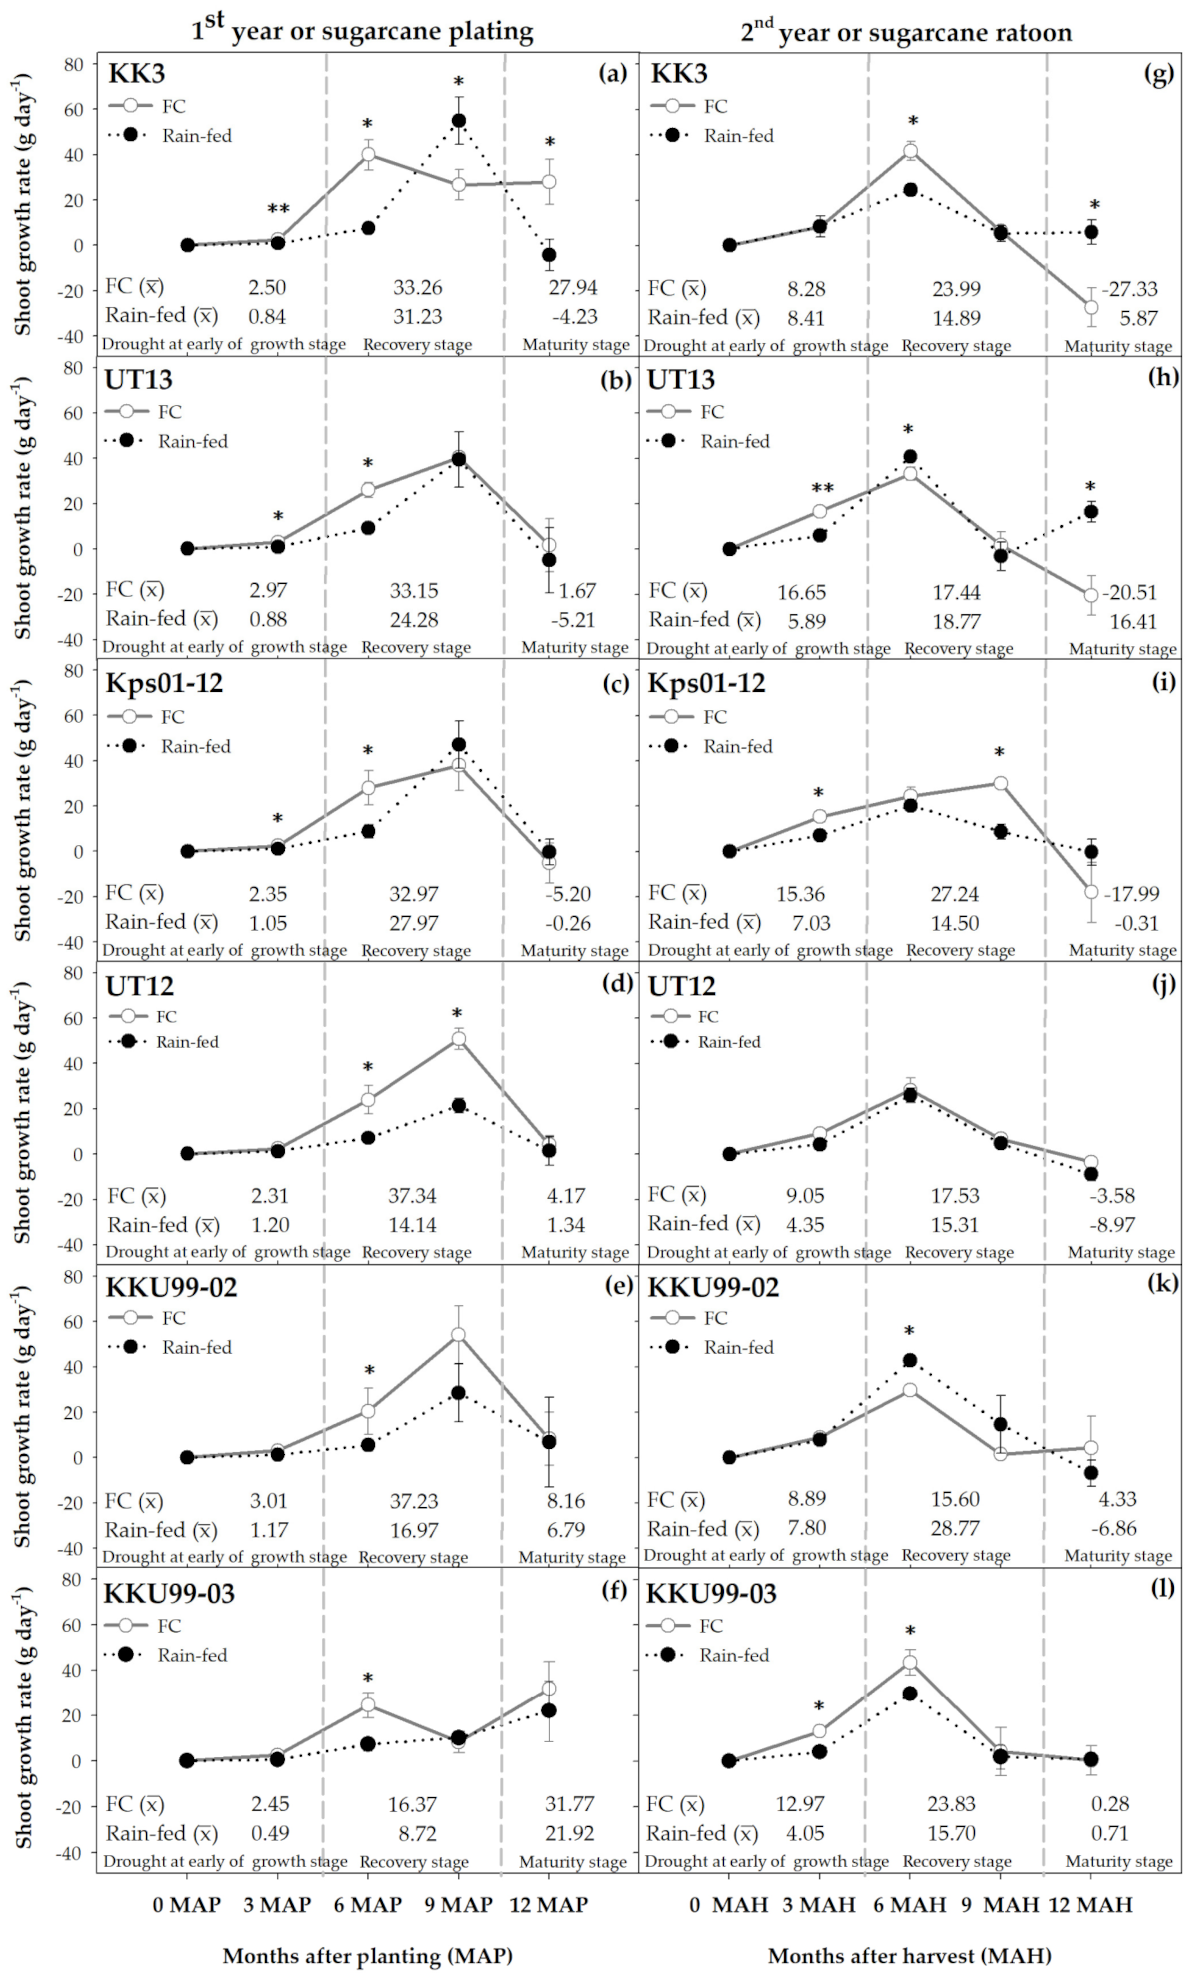
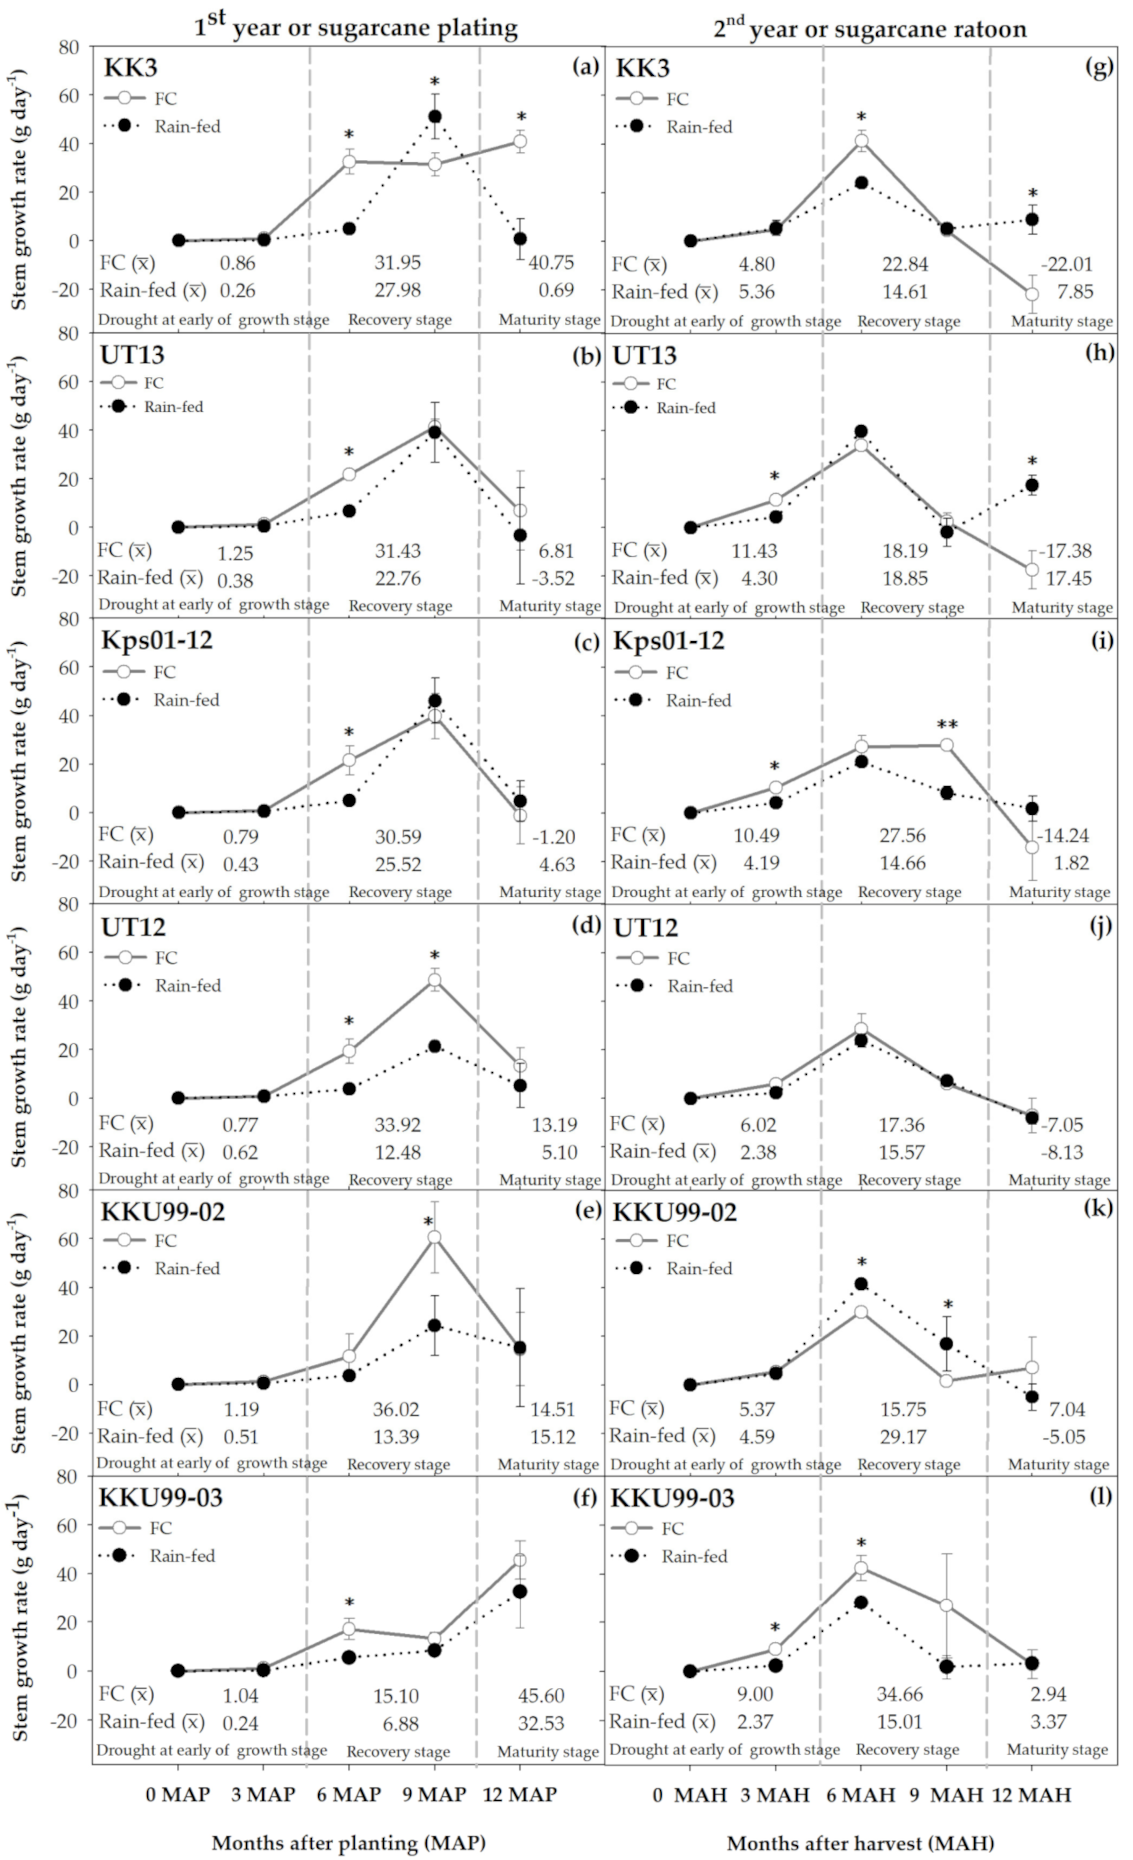
43]. The different water deficit tolerance levels of the six sugarcane cultivars can be illustrated in CGR patterns. Having a good ability to adapt to a water deficit, the KK3 cultivar showed a gradual increment in CGR during the early season water deficit, maximum CGR during the recovery stage (approximately 9 MAP), and a fast reduction in CGR during the maturity stage of the plant crop. By comparison, the ratoon crop had a similar CGR pattern to that of the plant crop, with the exception of during the recovery stage (approximately 6 MAH), when a faster increase in the growth rate than in the first crop was shown due to rapid rainfall (Figure 4 and Figure 5).
In this study, the KK3 cultivar was classified to the first group of both crops because the CGR values of the KK3 stem and shoot, under the FC and rain-fed treatments during the recovery stage, were not significantly different. This result indicates a good adaptability of the KK3 cultivar to the water deficit during the early growth stage. Therefore, a suitable sugarcane cultivar for growing areas under rain-fed conditions should possess a rapid adaptation in terms of CGR during the recovery phase. According to Khonghintaisong et al. [8], a superior sugarcane genotype under early water deficit conditions has good root adaptation via the root surface, root volume, and root length, thus providing more assimilates to the root systems to support better water uptake. The KK3 cultivar revealed a maximum tiller emergence during 3–4 MAP [27]. In addition, KK3 exposed to a low water potential induced by polyethylene glycol in hydroponics provided an assimilate proportion from photosynthesis to shoots rather than to roots, so underwent a rapid increment in stalk and leaf dry weights during the recovery phase [35]. Nitric oxide (NO) donors were reported to enhance a rapid recovery in photosynthesis after being exposed to a water deficit; thus, this approach may promote sugarcane growth and yield retention [44].
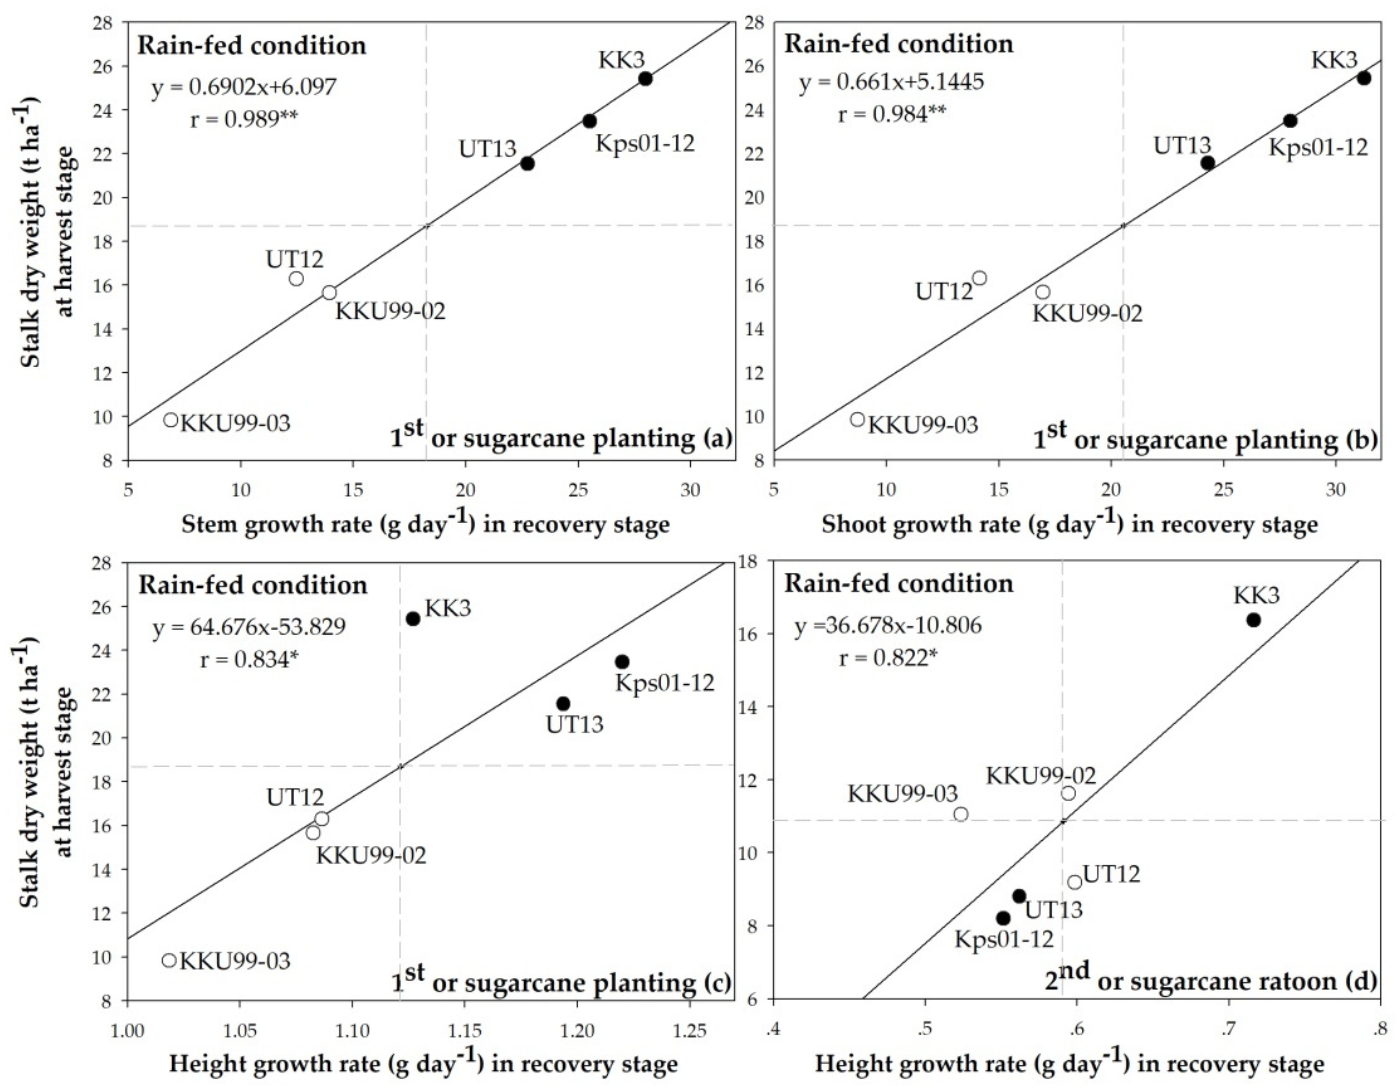
In this study, HGR during the recovery period was an important trait that contributed to stalk dry weight at final harvest for both plant (longer water deficit duration) and ratoon (shorter water deficit duration) crops. Therefore, we suggest HGR as an indirect approach for selection of high cane yield under water deficit conditions in the formative stage. In addition, HGR is a non-destructive method that allows users to select sugarcane clones with limited samples. During the recovery stage, the relationships between stalk dry weight and crop growth rates (stem, shoot, and height growth rates) under early season water deficit conditions of the six sugarcane varieties were positive in both years. Therefore, the recovery phase was an important stage to promote sugarcane productivity under water deficit conditions during early sugarcane growth (Figure 4). The results corroborated those of Abu-Ellail et al. [14] and Rao and Singh [45], who showed a positive correlation between CGR and cane production during the harvest phase in a sugarcane varietal evaluation. During grand growth, CGR revealed a significant positive relationship with total dry matter, regardless of water deficit level [16]. Therefore, the growth rate of the crop during the late developmental stage is a surrogate trait for yield that contributes to the productivity of sugarcane at harvest [14]. Despite positive correlations among LAI, sugarcane biomass yield, and CGR, the correlation coefficients between CGR and LAI (r = 0.49 **) and CGR and leaf number per plant (r = 0.44 **) were low [14]. Furthermore, the preferred characteristics of cane are those providing a significant recovery in physiological, rooting, and growth traits after experiencing an early season water deficit, and a greater proportion of assimilates to the shoots during the recovery period [8].

5. Conclusions

Six sugarcane cultivars were divided into four groups based on the cane potential yield and reduction percentage in the planting season: (1) high potential and low reduction in yields (KK3 and Kps01-12); (2) high potential and high reduction in yields (UT13); (3) low potential and low reduction in yields (UT12); and (4) low potential and high reduction in yields (KKU99-02 and KKU99-03). Although the grouping patterns of the six genotypes between planting and ratoon seasons were different, the KK3 genotype was stable in terms of having a high potential and low reduction in yield. The relationships between stalk dry weight and CGR of the stem, shoot, and height were high and positive. A similar correlation trend was noted between stalk dry weight and HGR during the recovery phase. Once exposed to a water deficit during the early growth stage, the KK3 cultivar showed a high CGR in plant cane during the recovery period, but the highest CGR in ratoon was noted earlier. HGR was a reliable trait that promoted sugarcane dry matter, as indicated by the positive correlation. Under rain-fed conditions, the CGR pattern during the recovery stage was an important parameter for revealing the crop adaptation to either short or long water deficit periods of both plant and ratoon crops. A rapid growth rate during the recovery phase was a key contributor to the high final stalk dry weight of sugarcane. HGR can be used as an alternative to CGR for similar experiments in which the plant sample is limited and destructive methods are prohibited.

Supplementary Materials

The following are available online at https://0-www-mdpi-com.brum.beds.ac.uk/article/10.3390/agronomy11102083/s1, Table S1: Crop water requirment, Table S2: %Soil moisture content.

Author Contributions

Conceptualization, N.J. and P.S.; methodology, N.J., J.K. and P.S.; software, N.J.; validation, N.J., J.K. and P.S.; formal analysis, J.K.; investigation, J.K. and N.J.; resources, N.J. and P.S.; data curation, J.K. and N.J.; writing—original draft preparation, J.K.; writing—review and editing, N.J.; visualization, N.J.; supervision, N.J. and P.S.; project administration, N.J. and P.S.; funding acquisition, N.J. All authors have read and agreed to the published version of the manuscript.

Funding

This study was funded by the Research Fund for Supporting Lecturer to Admit High Potential Student to Study and Research on His Expert Program Year 2020 in Khon Kaen University, grant number 631T219 and the APC was funded by Faculty of Agriculture, Khon Kaen University and the Thailand Research Fund for providing financial support through the Senior Research Scholar Project of Sanun Jogloy (Project no. RTA6180002).

Acknowledgments

This study was funded by the Northeast Thailand Cane and Sugar Research Center, Faculty of Agriculture, Khon Kaen, University, who provided financial supported. Assistance was also received from the Research Fund for Supporting Lecturer to Admit High Potential Student to Study and Research on His Expert Program Year 2020 in Khon Kaen University, grant number 631T219. Acknowledgement is extended to the Thailand Research Fund for providing financial support through the Senior Research Scholar Project of Sanun Jogloy (Project no. RTA6180002) and Abil Dermail for proof reading of the manuscript.

Conflicts of Interest

The authors declare no conflict of interest.

References

  1. FAO. Production. Available online: http://www.fao.org/faostat/en/#data/QC (accessed on 3 March 2021).
  2. Zingaretti, S.M.; Rodrigues, F.A.; da Graca, J.P.; de Matos Pereira, L.; Lourenco, M.V. Sugarcane Responses at Water Deficit Conditions, Water Stress. Available online: https://www.intechopen.com/books/water-stress/sugarcane-responses-at-water-deficit-conditions- (accessed on 15 May 2021).
  3. De Aquino, G.S.; de Contri Medina, C.; da Costa, D.C.; Shahab, M.; Santigo, A.D. Sugarcane straw management and its impact on production and development of ratoons. Ind. Crops Prod. 2017, 102, 58–64. [Google Scholar] [CrossRef] [Green Version]
  4. USDA. Thailand Sugar Annual 2019. Available online: https://apps.fas.usda.gov/newgainapi/api/report/downloadreportbyfilename?filename=Sugar%20Annual_Bangkok_Thailand_4-11-2019.pdf (accessed on 28 June 2021).
  5. Shao, H.B.; Chu, L.Y.; Jaleel, C.A.; Manivannan, P.; Panneerselvam, R.; Shao, M.A. Understanding water deficit stress-induced changes in the basic metabolism of higher plants-biotechnologically and sustainably improving agriculture and the ecoenvironment in arid regions of the globe. Crit. Rev. Biotechnol. 2009, 29, 131–151. [Google Scholar] [CrossRef] [PubMed]
  6. Anjum, S.A.; Xie, X.-Y.; Wang, L.-C.; Saleem, M.F.; Man, C.; Lei, W. Morphological, physiological and biochemical responses of plants to drought stress. Afr. J. Agric. Res. 2011, 6, 2026–2032. [Google Scholar]
  7. Da Silva, P.P.; Soares, L.; da Costa, J.G.; Viana, L.d.S.; Farias de Andrade, J.C.; Goncalves, E.R.; dos Santos, J.M.; de Souza Barbosa, V.G.; Nascimento, V.X.; Todaro, A.R.; et al. Path analysis for selection of drought tolerant sugarcane genotypes through physiological components. Ind. Crops Prod. 2012, 37, 11–19. [Google Scholar] [CrossRef]
  8. Khonghintaisong, J.; Songsri, P.; Toomsa, B.; Jongrungklang, N. Rooting and physiological trait responses to early drought stress of sugarcane cultivars. Sugar Tech 2018, 20, 396–406. [Google Scholar] [CrossRef]
  9. Chumphu, S.; Jongrungklang, N.; Songsri, P. Association of physiological responses and root distribution patterns of ratooning ability and yield of the second ratoon cane in sugarcane elite clones. Agronomy 2019, 9, 200–218. [Google Scholar] [CrossRef] [Green Version]
  10. Ferreira, T.H.S.; Tsunada, M.S.; Bassi, D.; Araujo, P.; Mattiello, L.; Guidelli, G.V.; Righetto, G.L.; Gonçalves, V.R.; Lakshmanan, P.; Menossi, M. Sugarcane water stress tolerance mechanisms and its implications on developing biotechnology solutions. Front. Plant. Sci. 2017, 8, 1077. [Google Scholar] [CrossRef]
  11. Kooyers, N.J. The evolution of drought escape and avoidance in natural herbaceous populations. Plant. Sci. 2015, 234, 155–162. [Google Scholar] [CrossRef]
  12. Blum, A. Drought resistance, water-use efficiency, and yield potential-are they compatible, dissonant, or mutually exclusive. Crop Pasture Sci. 2005, 56, 1159–1168. [Google Scholar] [CrossRef]
  13. Cominelli, E.; Conti, L.; Tonelli, C.; Galbiati, M. Challenges and perspectives to improve crop drought and salinity tolerance. New Biotechnol. 2013, 30, 355–361. [Google Scholar] [CrossRef]
  14. Abu-Ellail, F.F.B.; Gadallah, A.F.I.; El-Gamal, I.S.H. Genetic variance and performance of five sugarcane varieties for physiological, yield and quality traits influenced by various harvest age. J. Plant Prod. Mansoura Univ. 2020, 11, 429–438. [Google Scholar] [CrossRef]
  15. Sulistiono, W.; Taryono; Yudono, P.; Irham. Growth analysis of transplanted sugarcane bud chips seedling in the dry land. Int. J. Sci. Technol. Res. 2017, 6, 87–93. [Google Scholar]
  16. Ramesh, P. Effect of different levels of drought during the formative phase on growth parameters and its relationship with dry matter accumulation in sugarcane. J. Agron. Crop Sci. 2000, 185, 83–89. [Google Scholar] [CrossRef]
  17. Pedula, R.O.; Schultz, N.; Monteiro, R.C.; Pereira, W.; de Araújo, A.P.; Urquiaga, S.; Reis, V.M. Growth analysis of sugarcane inoculated with diazotrophic bacteria and nitrogen fertilization. Afr. J. Agric. Res. 2016, 11, 2786–2795. [Google Scholar]
  18. Robertson, M.J.; Wood, A.W.; Muchow, R.C. Growth of sugarcane under high input conditions in tropical Australia 1. Radiation use, biomass accumulation and partitioning. Field Crops Res. 1996, 48, 11–25. [Google Scholar] [CrossRef]
  19. Nava, S.C.; Huerta, A.J.; Cruz, J.M.P.l.; Rodriguez, E.M. Leaf growth and canopy development of three sugarcane genotypes under high temperature rainfed conditions in northeastern Mexico. Int. J. Agron. 2016, 2016, 2561026. [Google Scholar]
  20. Uddin, S.M.; Murayama, S.; Ishimine, Y.; Tsuzuki, E.; Harada, J. Studies on sugarcane cultivation II. Effects of the mixture of charcoal with pyroligneous acid on dry matter production and root growth of summer planted sugarcane (Saccharum officinarum L.). Jpn. J. Crop Sci. 1995, 64, 744–753. [Google Scholar] [CrossRef] [Green Version]
  21. Silva, M.A.; Silva, J.A.G.; Enciso, J.; Sharma, V.; Jifon, J. Yield components as indicators of drought tolerance of sugarcane. Sci. Agric. 2008, 65, 620–627. [Google Scholar] [CrossRef] [Green Version]
  22. Jangpromma, N.; Thammasirirak, S.; Jaisil, P.; Songsri, P. Effects of drought and recovery from drought stress on above ground and root growth, and water use efficiency in sugarcane (Saccharum officinarum L.). Aust. J. Crop Sci. 2012, 6, 1298–1304. [Google Scholar]
  23. Inman-Bamber, N. Sugarcane water stress criteria for irrigation and drying off. Field Crops Res. 2004, 89, 107–122. [Google Scholar] [CrossRef]
  24. Khonghintaisong, J.; Khruengpatee, J.; Songsri, S.; Gonkhamdee, S.; Jongrungklang, N. Classification of the Sugar Accumulation Patterns in Diverse Sugarcane Cultivars under Rain-fed Conditions in a Tropical Area. J. Agron. 2020, 19, 94–105. [Google Scholar] [CrossRef]
  25. Cardozo, N.P.; Sentelhas, P.C. Climatic effects on sugarcane ripening under the influence of cultivars and crop age. Sci. Agr. 2013, 70, 449–456. [Google Scholar] [CrossRef] [Green Version]
  26. Srijantr, T.; Molle, F.; Chompadist, C. Profitability and yield gap of sugar cane cultivation in the Mae Klong region. Thai Agri. Econ. J. 2002, 18, 53–69. [Google Scholar]
  27. Khonghintaisong, J.; Songsri, P.; Jongrungklang, N. Root characteristics of individual tillers and the relationships with above-ground growth and dry matter accumulation in sugarcane. Pak. J. Bot. 2020, 52, 101–109. [Google Scholar] [CrossRef]
  28. Jangpromma, N.; Songsri, P.; Thammasirirak, S.; Jaisil, P. Rapid assessment of chlorophyll content in sugarcane using a SPAD chlorophyll meter across different water stress conditions. Asian J. Plant Sci. 2010, 9, 368–374. [Google Scholar] [CrossRef] [Green Version]
  29. Cardoso, G.G.G.; de Oliveira, R.C.; Teixeira, M.B.; Dorneles, M.S.; Domingos, R.M.O.; Megguer, C.A. Sugar cane crop coefficient by the soil water balance method. Afr. J. Agric. Res. 2015, 10, 2407–2414. [Google Scholar]
  30. Taratima, W.; Ritmaha, T.; Jongrungklang, N.; Maneerattanarungroj, P.; Kunpratum, N. Effect of stress on the leaf anatomy of sugarcane cultivars with different drought tolerance (Saccharum offinarum, Poaceae). Int. J. Trop. Biol. 2020, 68, 1159–1170. [Google Scholar]
  31. Gomez, K.A.; Gomez, A.A. Statistical Procedures for Agricultural Research, 2nd ed.; John Wiley & Sons: New York, NY, USA, 1984; pp. 241–423. [Google Scholar]
  32. Robertson, M.J.; Inman-Bamber, N.G.; Mochow, R.C.; Wood, A.W. Physiology and productivity of sugarcane with early and mid-season water deficit. Field Crops Res. 1999, 64, 211–227. [Google Scholar] [CrossRef]
  33. Chetthamrongchai, P.; Auansakul, A.; Supawan, D. Assessing the transportation problems of the sugar cane industry in Thailand. Transp. Commun. Bull. Asia Pac. 2001, 70, 31–40. [Google Scholar]
  34. Scarpari, M.S.; Beauclair, E.G.F. Sugarcane maturity estimation through edaphic-climatic parameters. Sci. Agr. 2004, 61, 486–491. [Google Scholar] [CrossRef] [Green Version]
  35. Chapae, C.; Songsri, P.; Gonkhamdee, S.; Jongrungklang, N. Understanding drought responses of sugarcane cultivars controlled under low water potential conditions. Chil. J. Agric. Res. 2020, 80, 370–380. [Google Scholar] [CrossRef]
  36. Hajihashemi, S.; Brestic, M.; Kalaji, H.M.; Skalicky, M.; Noedoost, F. Environmental pollution is reflected in the activity of the photosynthetic apparatus. Photosynthetica 2020, 58, 529–539. [Google Scholar] [CrossRef] [Green Version]
  37. Lu, H.; Wang, Z.; Xu, C.; Li, L.; Yang, C. Multiomics analysis provides insights into alkali stress tolerance of sunflower (Helianthus annuus L.). Plant Physiol. Biochem. 2021, 166, 66–77. [Google Scholar] [CrossRef] [PubMed]
  38. Nadeem, M.; Tanveer, A.; Sandhu, H.; Javed, S.; Safdar, M.E.; Ibrahim, M.; Shabir, M.A.; Sarwar, M.; Arshad, U. Agronomic and economic evaluation of autumn planted sugarcane under different planting patterns with lentil intercropping. Agronomy 2020, 10, 644. [Google Scholar] [CrossRef]
  39. Singh, S.; Rao, P.N.G. Varietal differences in growth characteristics in sugar cane. J. Agric. Sci. Camb. 1987, 108, 245–247. [Google Scholar] [CrossRef]
  40. Inman-Bamber, N.; Smith, D. Water relations in sugarcane and response to water deficits. Field Crops Res. 2005, 92, 185–202. [Google Scholar] [CrossRef]
  41. Silva, M.D.A.; Jifon, J.L.; de Silva, J.A.G.; Sharma, V. Use of physiological parameters as fast tools to screen for drought tolerance in sugarcane. Braz. J. Plant Physiol. 2007, 19, 193–201. [Google Scholar] [CrossRef] [Green Version]
  42. Tahjib-Ul-Arif, M.; Zahan, M.I.; Karim, M.M.; Imran, S.; Hunter, C.T.; Islam, M.S.; Mia, M.A.; Hannan, M.A.; Rhaman, M.S.; Hossain, M.A.; et al. Citric acid-mediated abiotic stress tolerance in plants. Int. J. Mol. Sci. 2021, 22, 7235–7261. [Google Scholar] [CrossRef]
  43. Hasan, M.M.; Skalicky, M.; Jahan, M.S.; Hossain, M.N.; Anwar, Z.; Nie, Z.F.; Alabdallah, N.M.; Brestic, M.; Hejnak, V.; Fang, X.W. Spermine: Its emerging role in regulating drought stressresponses in plants. Cells 2021, 10, 261–276. [Google Scholar] [CrossRef]
  44. Silveira, N.M.; Prataviera, P.J.C.; Pieretti, J.C.; Seabra, A.B.; Almeida, R.L.; Machado, E.C.; Ribeiro, R.V. Chitosan-encapsulated nitric oxide donors enhance physiological recovery of sugarcane plants after water deficit. Environ. Exp. Bot. 2021, 190, 104593. [Google Scholar] [CrossRef]
  45. Rao, P.N.G.; Singh, S. Relationship of growth characteristics with yield and quality in sugarcane (Saccharum officinarum L.). Indian J. Plant Physiol. 1989, 32, 206–211. [Google Scholar]
Figure 1. Rainfall (mm), relative humidity (%), maximum daily temperature (°C), minimum daily temperature (°C), and evaporation (mm) in the first year or sugarcane planting (a) and the second year or sugarcane ratoon (b).
Agronomy 11 02083 g001
Figure 2. Soil moisture content (%)under field capacity (FC) and rain-fed conditions in the first year or sugarcane planting at 0–15 cm soil depths (a1) and at 15–30 cm soil depths (a2) and the second year or sugarcane ratoon at 0–15 cm soil depths (b1) and at 15–30 cm soil depths (b2). Means with ** in the same observation point are significantly different by least significance different (LSD) at 0.01 probability levels.
Agronomy 11 02083 g002
Figure 3. Stalk dry weight per hectare (t h−1) of six sugarcane cultivars (water deficit-tolerant cultivars: KK3, UT13, and Kps01-12 and water deficit-susceptible cultivars: KKU99-02, KKU99-03, and UT12) under field capacity; FC and rain-fed conditions during the first year or sugarcane planting (a) and the second year or sugarcane ratoon (b). Means of FC treatment (white bars) with different capital letters are significantly different by lest significance difference (LSD) at 0.05 probability level. Means of rain-fed treatment (gray bars) with different small letters are significantly different by LSD at 0.05 probability level. Means with * and ** between FC and rain-fed treatments are significantly different by least significance different (LSD) at 0.05 and 0.01 probability levels, respectively. Vertical bars represent standard errors of the mean values. %R is a percentage of reduction. DTI—drought tolerance index.
Agronomy 11 02083 g003
Figure 4. Shoot growth rate (g day−1) of six sugarcane cultivars under field capacity (FC) and rain-fed conditions in the first year or sugarcane planting (water deficit-tolerant cultivars: KK3 (a), UT13 (b), and Kps01-12 (c) and water deficit-susceptible cultivars: UT12 (d), KKU99-02 (e) and KKU99-03 (f)), and the second year or sugarcane ratoon (water deficit-tolerant cultivars: KK3 (g), UT13 (h), and Kps01-12 (i) and water deficit-susceptible cultivars: UT12 (j), KKU99-02 (k) and KKU99-03 (l)). Means with * and ** in the same observation point are significantly different by least significance different (LSD) at 0.05 and 0.01 probability levels, respectively. Vertical bars represent standard errors of the mean values. ( x ¯ ) is an average of shoot growth rate in each stage (drought, recovery, and maturity).
Agronomy 11 02083 g004
Figure 5. Stem growth rate (g day−1) of six sugarcane cultivars under field capacity (FC) and rain-fed conditions in the first year or sugarcane planting (water deficit-tolerant cultivars: KK3 (a), UT13 (b), and Kps01-12 (c) and water deficit-susceptible cultivars: UT12 (d), KKU99-02 (e) and KKU99-03 (f)), and the second year or sugarcane ratoon (water deficit-tolerant cultivars: KK3 (g), UT13 (h), and Kps01-12 (i) and water deficit-susceptible cultivars: UT12 (j), KKU99-02 (k) and KKU99-03 (l)). Means with * and ** in the same observation point are significantly different by least significance different (LSD) at 0.05 and 0.01 probability levels, respectively. Vertical bars represent standard errors of the mean values. ( x ¯ ) is an average of stem growth rate in each stage (drought, recovery, and maturity).
Agronomy 11 02083 g005
Figure 6. Leaf growth rate (g day−1) of six sugarcane cultivars (water deficit-tolerant cultivars: KK3 (a), UT13 (b), and Kps01-12 (c) and water deficit-susceptible cultivars: UT12 (d), KKU99-02 (e) and KKU99-03 (f)), and the second year or sugarcane ratoon (water deficit-tolerant cultivars: KK3 (g), UT13 (h), and Kps01-12 (i) and water deficit-susceptible cultivars: UT12 (j), KKU99-02 (k) and KKU99-03 (l)). Means with * and ** in the same observation point are significantly different by least significance different (LSD) at 0.05 and 0.01 probability levels, respectively. Vertical bars represent standard errors of the mean values. ( x ¯ ) is an average of stem growth rate in each stage (drought, recovery, and maturity).
Agronomy 11 02083 g006
Figure 7. Height growth rate (g day−1) of six sugarcane cultivars (water deficit-tolerant cultivars: KK3 (a), UT13 (b), and Kps01-12 (c) and water deficit-susceptible cultivars: UT12 (d), KKU99-02 (e) and KKU99-03 (f)), and the second year or sugarcane ratoon (water deficit-tolerant cultivars: KK3 (g), UT13 (h), and Kps01-12 (i) and water deficit-susceptible cultivars: UT12 (j), KKU99-02 (k) and KKU99-03 (l)). Means with * and ** in the same observation point are significantly different by least significance different (LSD) at 0.05 and 0.01 probability levels, respectively. Vertical bars represent standard errors of the mean values. ( x ¯ ) is an average of stem growth rate in each stage (drought, recovery, and maturity).
Agronomy 11 02083 g007
Figure 8. Relationship between stalk dry weight in the harvest stage and CGR (stem (a), shoot (b), and height growth rate (c)) in the recovery stage of sugarcane planting, and height growth rate in the recovery stage of sugarcane ratoon (d) of six sugarcane cultivars (water deficit-tolerant sugarcane cultivars via KK3 UT13 and Kps01-12 (●) and water deficit-susceptible sugarcane cultivars via KKU99-02, KKU99-03, and UT12 (○)) under rain-fed conditions (N = 6). * and ** significant at 0.05 and 0.01 probability levels, respectively.
Agronomy 11 02083 g008
Publisher’s Note: MDPI stays neutral with regard to jurisdictional claims in published maps and institutional affiliations.

