Article

Comparison and Characterization of Oxidation Resistance and Carbohydrate Content in Cd-Tolerant and -Sensitive Kentucky Bluegrass under Cd Stress

College of Pratacultural Science, Gansu Agricultural University, Lanzhou 730070, China
*
Author to whom correspondence should be addressed.
These authors have contributed equally to this work.
Submission received: 27 September 2021 / Revised: 14 November 2021 / Accepted: 18 November 2021 / Published: 21 November 2021
(This article belongs to the Special Issue Mechanisms of Environmental Stress Tolerance in Forage and Turfgrass)

Abstract

:
Kentucky bluegrass (Poa pratensis L.), a turf grass species that is hypertolerant of cadmium (Cd), is a potential phytoremediation material for soil polluted with Cd. However, the mechanism of Cd phytotoxicity in Kentucky bluegrass is unclear. Here, we compared the phenotype, induction of oxidative stress, and structural and non-structural carbohydrate contents between a Cd-tolerant genotype (‘Midnight’, M) and Cd-sensitive genotype (‘Rugby’, R). The results showed that both genotypes accumulated more Cd in the roots, whereas the R genotype distributed more Cd into the leaves compared with the M genotype. In both genotypes, Cd inhibited the length and fresh weight of the leaves and roots; increased the peroxidase (POD) activity but inhibited ascorbate peroxidase (APX) and catalase (CAT) activity; and increased the superoxide radical (O2), hydrogen peroxide (H2O2), and malondialdehyde (MDA) contents. However, the M genotype exhibited lower root length inhibition, and the H2O2 and MDA contents confirmed that the M genotype had increased Cd accumulation and resistance, while the R genotype exhibited a better distribution of Cd. Moreover, Cd stress significantly increased the soluble sugar, trehalose, and sucrose contents of both genotypes. Pectin, lignin, and cellulose were significantly increased to prevent the entry of Cd into the roots. The Cd-induced growth inhibition and physiological responses in Kentucky bluegrass were preliminarily explored herein, with the chelation of pectin, lignification, and antioxidant response being possible contributors to Cd detoxification in Kentucky bluegrass. In addition, the Cd-induced increase in trehalose, sucrose, and soluble sugar contents might play a pivotal role in the defense against Cd stress in Kentucky bluegrass.

1. Introduction

Human activities and natural elements such as mining, waste gas emission, wastewater irrigation, and volcanic eruptions have resulted in severe heavy mental pollution in recent years [1]. Heavy metal in the soil poisons plants and accumulates through food chains [2]. Cd is the main pollutant present in the environment [3]. It accumulates easily in plants and is transmitted to other animals through ingestion [4]. Excess Cd causes chronic intoxication of the human body, giving rise to kidney injury and skeletal lesions [5,6]. In plants, it is reported that low concentrations of Cd facilitate growth, and high concentrations can lead to wilting, chlorosis, and the inhibition of plant growth [7]. The environmental problems caused by Cd pollution are a serious threat to human development. Thus, remediating Cd contaminated soil is critical.
Numerous studies have indicated that the Cd absorbed by plants usually generates reactive oxygen species (ROS) in the roots and other organs, and excess ROS can impair pivotal DNA, protein, and biological membranes because of its high oxidation capacity [8]. To eliminate excess ROS, plants have evolved an integrated acclimation system. It is generally assumed that the anti-oxidant system and non-enzymatic antioxidants are the two main pathways by which plants balance stress-induced ROS accumulation [9]. Cd-induced O2 is catalyzed by SOD and produces H2O2, following which excess H2O2 is resolved by POD, catalase (CAT), and APX. Regarding non-enzymatic antioxidants, recent studies have showed that highly hydroxylated sugars in plants are prone to ROS attack and serve as ROS quenchers [10]. Sugar alcohols, which are synthesized by sugars, possess even more hydroxyl than their precursors are thus even more efficient ROS scavengers [11]. Glucose and fructose are a source of substrates that are involved in the pathway of oxidative pentose phosphate and generate NADPH, the latter participating in the monodehydroascorbate and ascorbate (ASC) cycle, which is followed by the catalysis of ascorbate and H2O2 by APX [10,12]. The increasing of glucose, sucrose, and fructose concentration plays an important role of osmotic homeostasis in plants. In addition, sugars are also involved in regulating the hormonal signaling pathways. It was identified that a high sugar concentration could activate the abscisic acid (ABA) synthesis pathway to regulate the plant development [13]. Glucose can regulate the cell division, cell wall biosynthesis, and energy production through the hexokinase (HXK) [14]. Moreover, trehalose-6-phosphate (T6P) is considered as a central signaling molecule to regulate the use and storge of sucrose [15]. The trehalose-6-phosphate/sucrose non-fermenting-related kinase (T6P/SnRK) pathway is involved in regulating the conservation or utilization of starch under stress condition [16]. Therefore, the multifunctional sugar signaling has a pivotal role in ROS detoxification and stress signal transduction.
In plants, most Cd is prevented from entering the plants and is bound by the cell wall, which is constructed of cellulose, hemicellulose, pectin, and lignin in different formations [17,18]. H2O2 is used as a co-substrate and is catalyzed by different POD isoenzymes for lignin polymerization [19]. Increased POD activity and lignin content have been identified under Cd stress in numerous previous studies [19,20,21]. Guo [22] et al. reported that Sedum alfredii Hance increased root cell-wall thickness through increasing the cellulose and lignin content under Cd stress. In addition, pectin contains negative charges that are beneficial for Cd compartmentalization in the cell wall [17]. A significant increase in pectin content was observed in Oryza sativa L. [23], Lycopersicon esculentum Mill. [24], and Miscanthus [25] under Cd stress.
Kentucky bluegrass is hypertolerant of Cd [18]. A previous study showed that the total Cd concentration of Kentucky bluegrass reached 418.6 mg·m−2, which was 17.1-fold higher than in Solanum nigrum L., a hyperaccumulator, under 40 mg·kg−1 Cd treatment [26]. Thus, it represents a potential phytoremediation material for Cd-contaminated soil. In our previous study, we identified a Cd-tolerant genotype ‘Midnight’ (M) and Cd-sensitive genotype ‘Rugby’ (R), and we used RNA sequencing technology to elucidate the molecular mechanisms through which these genotypes respond to 1000 μM Cd stress over 24 h [27]. The results showed that a large number of differentially expressed genes (DEGs) were involved in lignin biosynthesis and carbohydrate transport and metabolism [27]. However, the long-term impacts of Cd stress on cell wall components and carbohydrate content in the leaves and roots of Kentucky bluegrass remain unclear. Thus, this study aimed to: (1) investigate whether Cd stress could cause changes to the cell wall components and carbohydrate content of Kentucky bluegrass; (2) investigate the antioxidant characteristics that are induced by Cd in Kentucky bluegrass; and (3) compare the differences in the Cd stress between the M and R genotypes.

2. Materials and Methods

2.1. Seedling Cultivation and Cd Treatment

Seeds of Kentucky bluegrass varieties ‘M’ and ‘R’ provided by the Clover Ecological Technology Co., Ltd. (Beijing, China) were scattered into seedling pots (height: 8.5 cm, length and width: 10 × 10 cm) that had been filled with vermiculite, and 0.15 g of seeds were scattered in each pot and covered with a 0.5 cm thick layer of vermiculite. Distilled water was applied to maintain the essential moisture until the seedlings grew to 2 cm. Then, they were cultured in Hoagland’s nutrient solution and established for 60 days (until the 5–6-leaf stage) in an environmental chamber at a temperature of 25/20 ± 1 °C (day/night), a 14 h photoperiod (450 μmol m−2 s−1), and a relative humidity of 65% [28]. Following the establishment period, the seedlings of each genotype were divided into two groups, the control group (CK) and the treatment group (Cd). Each group included 6 pots of seedlings. The treatment method was based on our previous study [27]. Hoagland’s nutrient solution containing 1000 μM Cd was applied to the pots of the treatment groups until the soil was saturated, while the control groups were watered with standard Hoagland’s nutrient solution [27]. All of the leaves and roots of each treatment were cut into pieces and collected at 7 d, 14 d, 21 d, and 28 d after Cd treatment, respectively.

2.2. Plant Height, Root Length, Fresh Weight, and Cd Determination

After 28 d of Cd treatment, the vermiculite on the roots of each treatment was washed off with water to determine the plant height, root length, and fresh weight, and each treatment consisted of 20 biological replicates.
The Cd contents in the roots and leaves of the M and R genotypes were determined as follows [18]: after 28 days of Cd treatment, the seedlings of M-CK, M-Cd, R-CK, and R-Cd were collected, and the roots were flushed with distilled water to remove the vermiculite. Then, the roots of each treatment were dipped in 20 mM EDTA-Na2 solution for 20 min to release the Cd attached to them. All of the samples, including the leaves and roots, were dried at 105 °C for 10 min and then 75 °C for 6 h. The dried samples were crushed and sifted through a 100-mesh (0.15 mm) sieve. Three biological replicates of powdered samples (0.2 g) from each treatment were digested in a microwave digestion system (TOP wave, Analytik Jena AG, Jena, Germany) in 7 mL supra-pure concentrated HNO3 and 1 mL 30% H2O2. The control settings were as indicated in Table S1 [29]. The digested solution was made to a constant volume of 50 mL, and Cd content determination was performed by atomic absorption spectrophotometry (AA-6800, Shimazu, Japan).
The partitioning factor represents the ability of plants to translocate the heavy metal from the roots to leaves. The calculation formula of it is as below:
Partitioning   factor = C d   c o n c e n t r a t i o n   i n   t h e   l e a v e s C d   c o n c e n t r a t i o n   i n   t h e   r o o t s .

2.3. Determination of MDA, H2O2, and O2 Content

2.3.1. MDA Determination

The MDA was determined to identify the degree of membrane lipid peroxidation using the thiobarbituric acid (TBA) method [30]. First, 0.2 g of leaf or root samples with three biological replicates were homogenized by 5 mL of 5% trichloroacetic acid (TCA) and centrifugation at 3000× g for 20 min. Then, 2 mL of supernatant was mixed with 2 mL of 0.67% TBA and boiled for 30 min (water bath). The absorbance of the resulting solution was detected at 450 nm, 532 nm, and 600 nm.

2.3.2. Determination of H2O2 Content

The H2O2 content was determined using a Micro Hydrogen Peroxide (H2O2) Assay Kit (Solarbio, Beijing, China).

2.3.3. Determination of the Rate of O2 Generation

For the rate of O2 generation determination, the method of Niu [28] et al. was followed, with slight modifications. Leaf or root samples with three biological replicates of 0.2 g were homogenized and extracted in 1.6 mL of phosphate buffer (PBS, 0.05M, pH 7.8) in an ice-bath followed by centrifugation at 10,000× g for 20 min at 4 °C. Then, PBS (0.5 mL) and 0.5 mL of extract were mixed with 1 mL of hydroxylamine hydrochloride solution (10 mM) for 1 h at 25 °C. Then, 1 mL of sulfanilic acid solution (17 mM, dissolved in 25% glacial acetic acid) and 1 mL of α-naphthylamine solution (7 mM, dissolved in 75% glacial acetic acid) were added successively and incubated at 25 °C for 20 min. The absorbance of the resulting solution was detected at 530 nm.

2.4. Determination of POD, SOD, APX, CAT Activities, and Soluble Protein Content

For the extraction of antioxidant enzymes, 0.2 g of leaves or roots of Kentucky bluegrass with three biological replicates were homogenized and extracted in 1.6 mL of phosphate buffer (PBS, 0.05 M, pH 7.8) in an ice-bath followed by centrifugation at 12,000× g for 20 min at 4 °C. The supernatant was used to estimate the activities of POD, SOD, APX, CAT, and soluble protein content.
For the POD (EC: 1.11.1.7) activity determination [31], the enzyme extract (40 μL) was mixed with 3 mL of 0.2 M PBS (PH 6.0), 1.14 μL of 30% H2O2, and 1.68 μL of 0.056% (v/v) guaiacol. Then, the absorbance change during a 40 s reaction of 3.043 mL of reaction mixture was recorded at 470 nm.
For the SOD (EC: 1.15.1.1) activity determination [32], the enzyme extract (40 μL) was mixed with 2.9 mL of 0.05 M PBS (pH 7.8), 0.03 mL of 3 mM EDTA-Na2, 0.03 mL of 60 μM riboflavin, 0.03 mL of 2.25 mM nitro-blue tetrazolium, and 0.9 mL of 14.5 mM L-methionine. The 3.93 mL of mixture was placed into an illumination incubator to react under 4000 lx of illumination intensity for 20 min at 25 °C, following which the absorbance was read at 560 nm.
For the APX (EC: 1.11.1.11) activity determination [33], the enzyme extract (100 μL) was mixed with 2.6 mL of 0.1 mM EDTA-Na2 (dissolved in 0.05 M PBS at pH 7.0), 0.15 mL of 5 mM ascorbic acid (dissolved in 0.05 M PBS pH 7.0), and 0.15 mL of 20 mM H2O2. Then, the change in absorbance of 3 mL of the reaction mixture over a 40 s reaction was recorded at 290 nm to estimate the APX activity.
For the CAT (EC: 1.11.1.6) activity determination [34], the enzyme extract (40 μL) was mixed with 3 mL of 0.15 M PBS and 5 μL of 30% H2O2. Then, the change in absorbance of 3.045 mL of mixture over a 40 s reaction was recorded at 240 nm to estimate the CAT activity.
For the soluble protein content determination [35], 100 μL of enzyme extract was mixed with 2.9 mL of 0.1 mg·mL−1 Coomassie brilliant blue G-250, and the absorbance of the mixture was recorded at 595 nm after a 2 min reaction.

2.5. Determination of Reducing Sugar, Soluble Sugar, Sucrose, Trehalose, Fructose, and Glucose Content

2.5.1. Determination of Reducing Sugar and Soluble Sugar Content

For the reducing sugar and soluble sugar content estimation, the previous method of Miller [36] was followed, while the method of Sinay and Karuwal [37] was followed to estimate the soluble sugar content, with some modifications. Fresh leaves or roots (0.2 g) in each treatment were ground and homogenized in 5 mL of 80% ethanol, boiled for 30 min at 80 °C, and centrifuged in 3500× g for 10 min. The extraction solution was made to a constant volume of 10 mL for reducing sugar and soluble sugar determination. Two milliliters of extraction solution were boiled until evaporated (water bath), following which 10 mL of distilled water was added. Two milliliters of the redissolved solution and 2 mL 3, 5-dinitrosalicylic acid (0.044 M, dissolved in 2 M NaOH and mixed with 1.43 M NaKC4H4O6) were combined and boiled for 5 min, following which the absorbance was read at 540 nm for reducing sugar content estimation. Furthermore, 2 mL of redissolved solution was mixed with 0.5 mL of 0.1 M anthranone (dissolved by ethyl acetate) and 5 mL of concentrated H2SO4 and boiled for 1 min (water bath), following which the absorbance was read at 620 nm. Three biological replicates were tested for each treatment.

2.5.2. Determination of Sucrose, Trehalose, Fructose, and Glucose Content

The trehalose, fructose, and glucose contents were determined using a Trehalose Content Assay Kit (Solarbio, Beijing, China), Fructose Content Assay Kit (Solarbio, Beijing, China), and Glucose Content Assay Kit (Solarbio, Beijing, China).
Sucrose content determination followed Cadet and Offmann [38], with slight modifications. Kentucky bluegrass leaves or roots (0.2 g) with three biological replicates were ground and homogenized in 10 mL of distilled water and then centrifuged in 8000× g for 10 min. Then, one milliliter of supernatant was mixed with 0.1 mL of 2 M NaOH and boiled for 10 min at 100 °C in a water bath. Then, 1 mL of 1 mg·mL−1 resorcinol and 3 mL of 10 M HCl were added and boiled for 10 min at 100 °C in a water bath, and the absorbance was read at 500 nm.

2.6. Determination of Pectin, Lignin, and Cellulose Content

The pectin and lignin contents were determined using a Pectin Content Assay Kit (Solarbio, Beijing, China) and Lignin Content Assay Kit (Solarbio, Beijing, China, BC4200).
Determination of cellulose content followed Viles and Silverman [39], with some modifications. In brief, 0.2 g of sample with three biological replicates was ground and homogenized in 100 mL of 60% H2SO4 at 4 °C for 12 h to complete the cellulose hydrolysis, following which the samples were centrifuged at 4000× g for 15 min. One milliliter of the supernatant was mixed with 0.5 mL of 2% anthrone (dissolved in ethyl acetate) and 5 mL of concentrated H2SO4 for 1 min. Then, the absorbance was read at 620 nm.

2.7. Statistical Analysis

GraphPad Prism version 9.0.0 for Windows (GraphPad Software, San Diego, CA, USA, www.graphpad.com, 22 October 2020) was used to perform Student’s t-tests and one-way analysis of variance (ANOVA).

3. Results

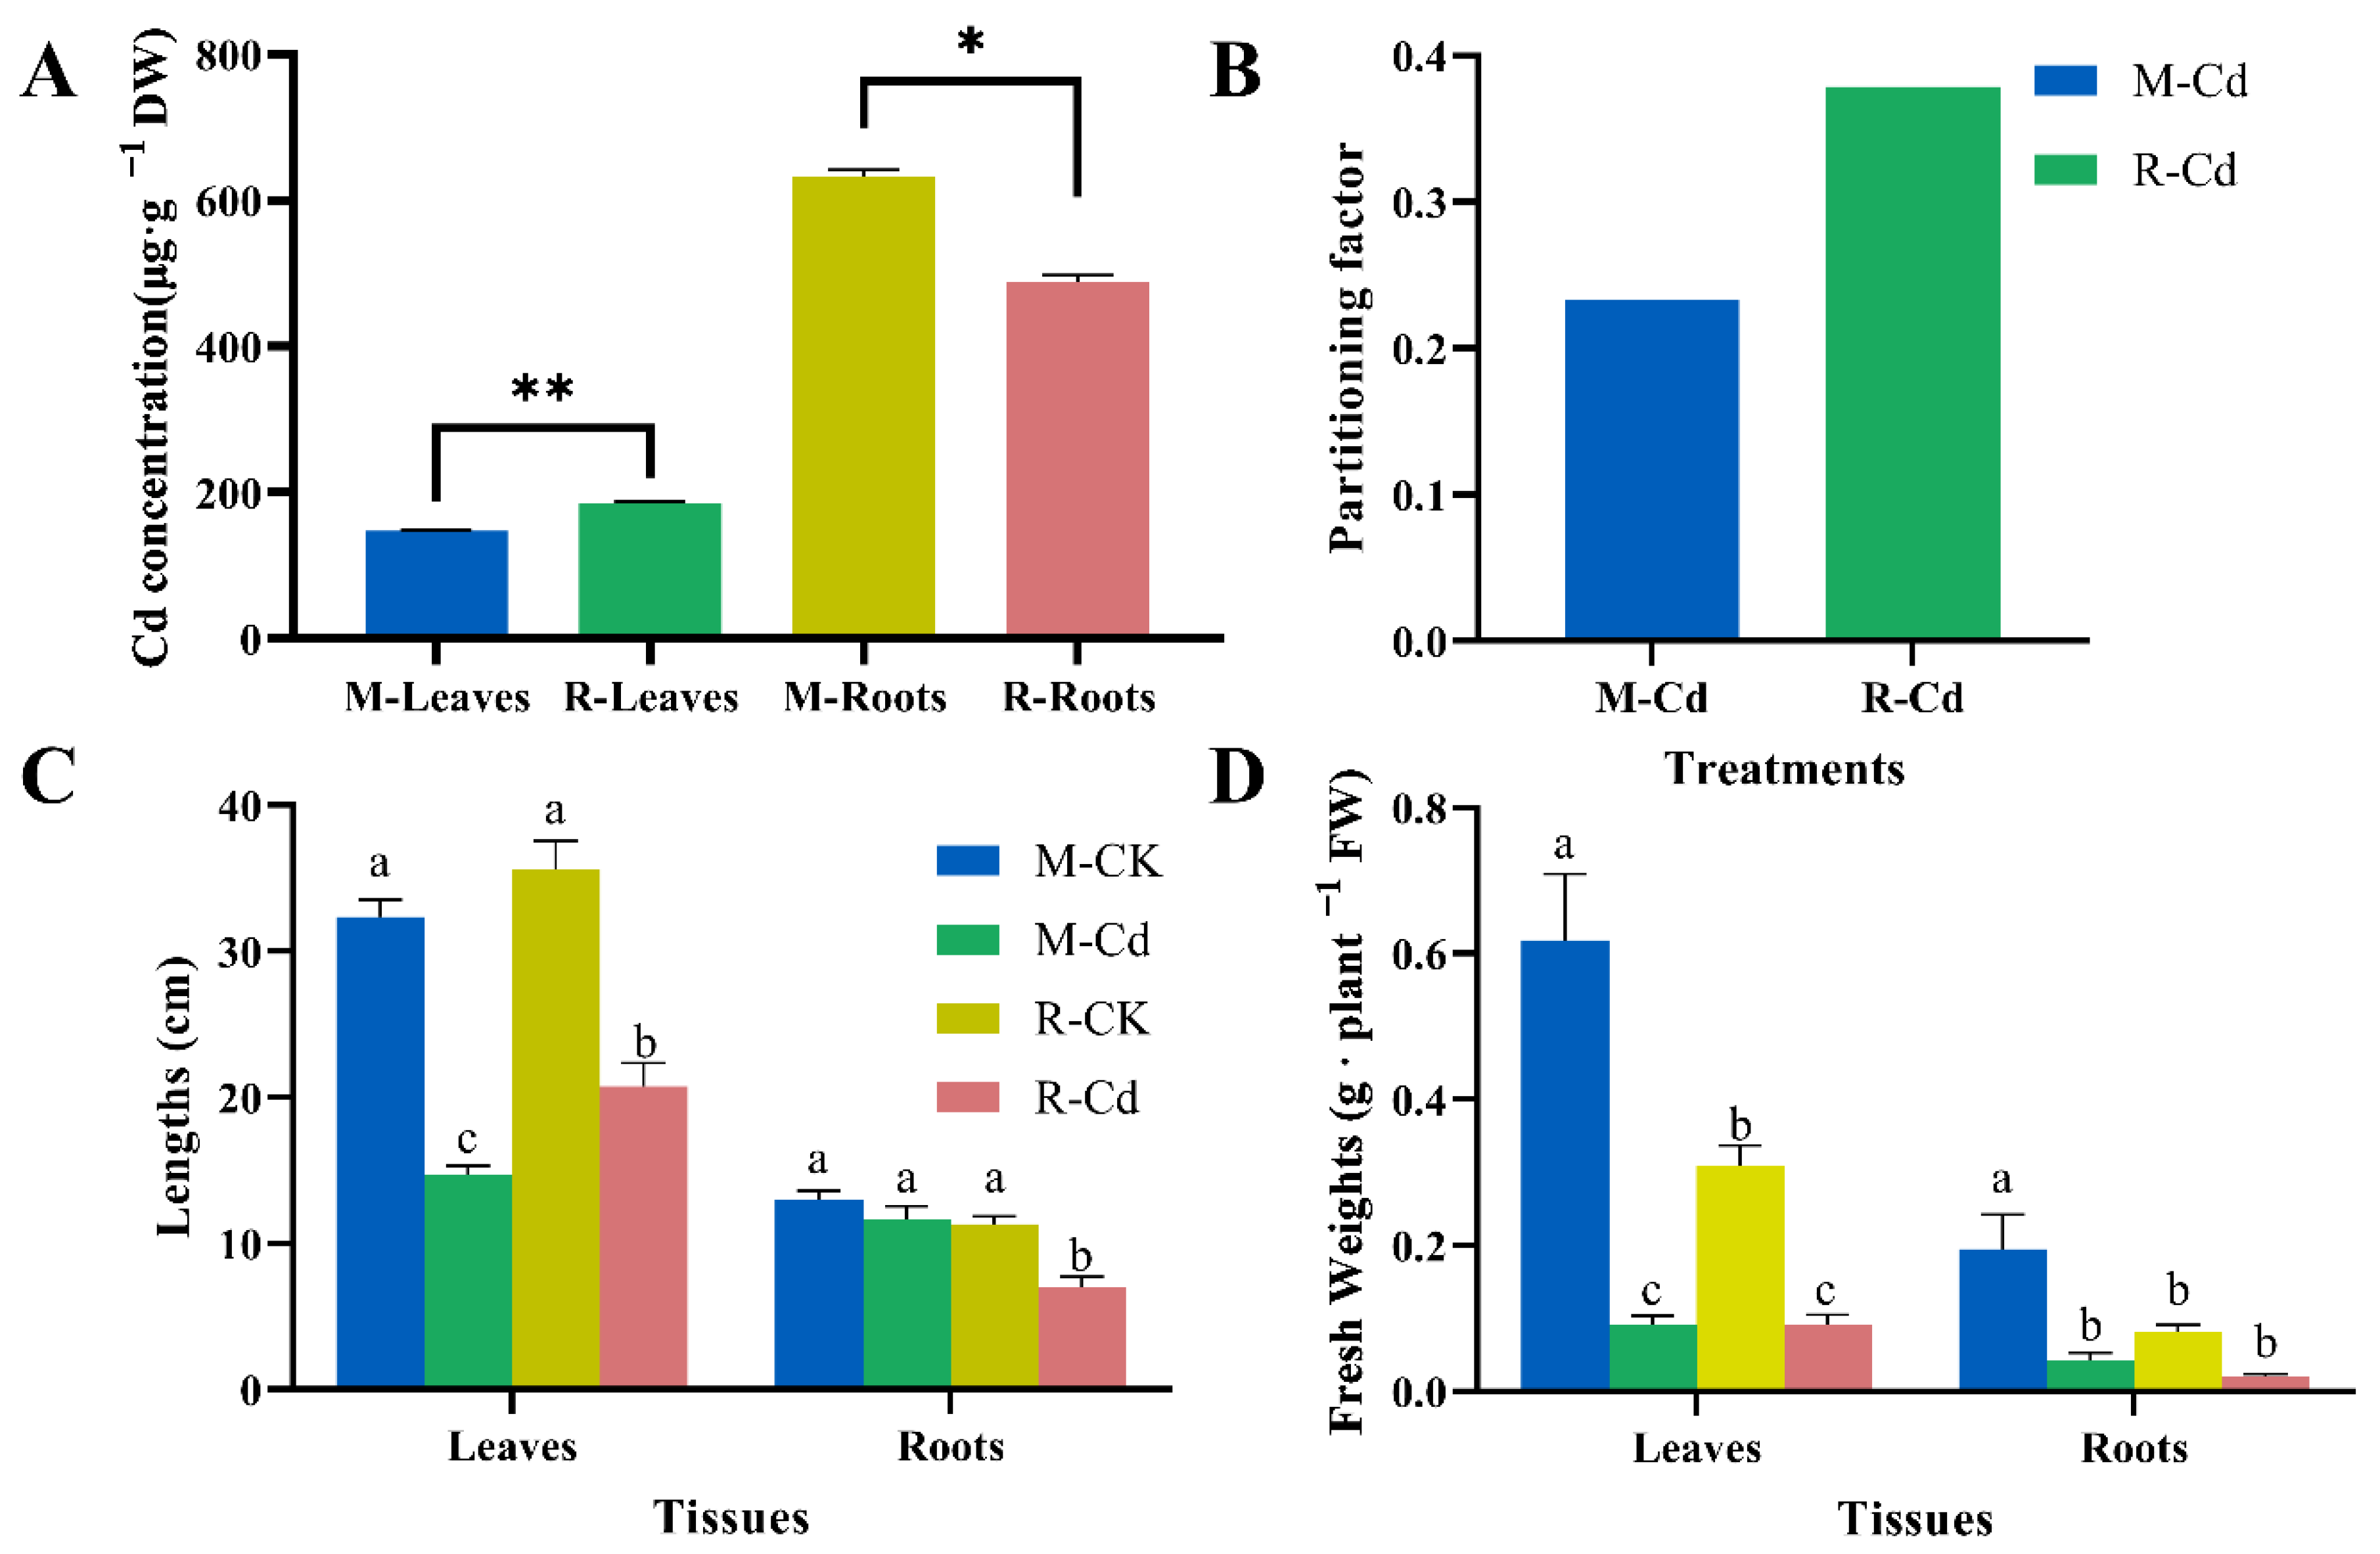
3.1. Cd Accumulation and Distribution and the Effect of Cd Stress on the Growth Status of Kentucky Bluegrass

After 28 d of Cd exposure, the Cd concentration in the different tissues of M and R were determined. As observed in other plants, Cd mainly accumulated in the roots of Kentucky bluegrass. In addition, the M genotype accumulated more Cd in the roots compared with R (Figure 1A). However, the Cd content in the leaves of the M genotype was significantly lower than in the R genotype (p < 0.01), and the partitioning factor of the M genotype was lower than the R genotype under Cd stress (Figure 1A,B).

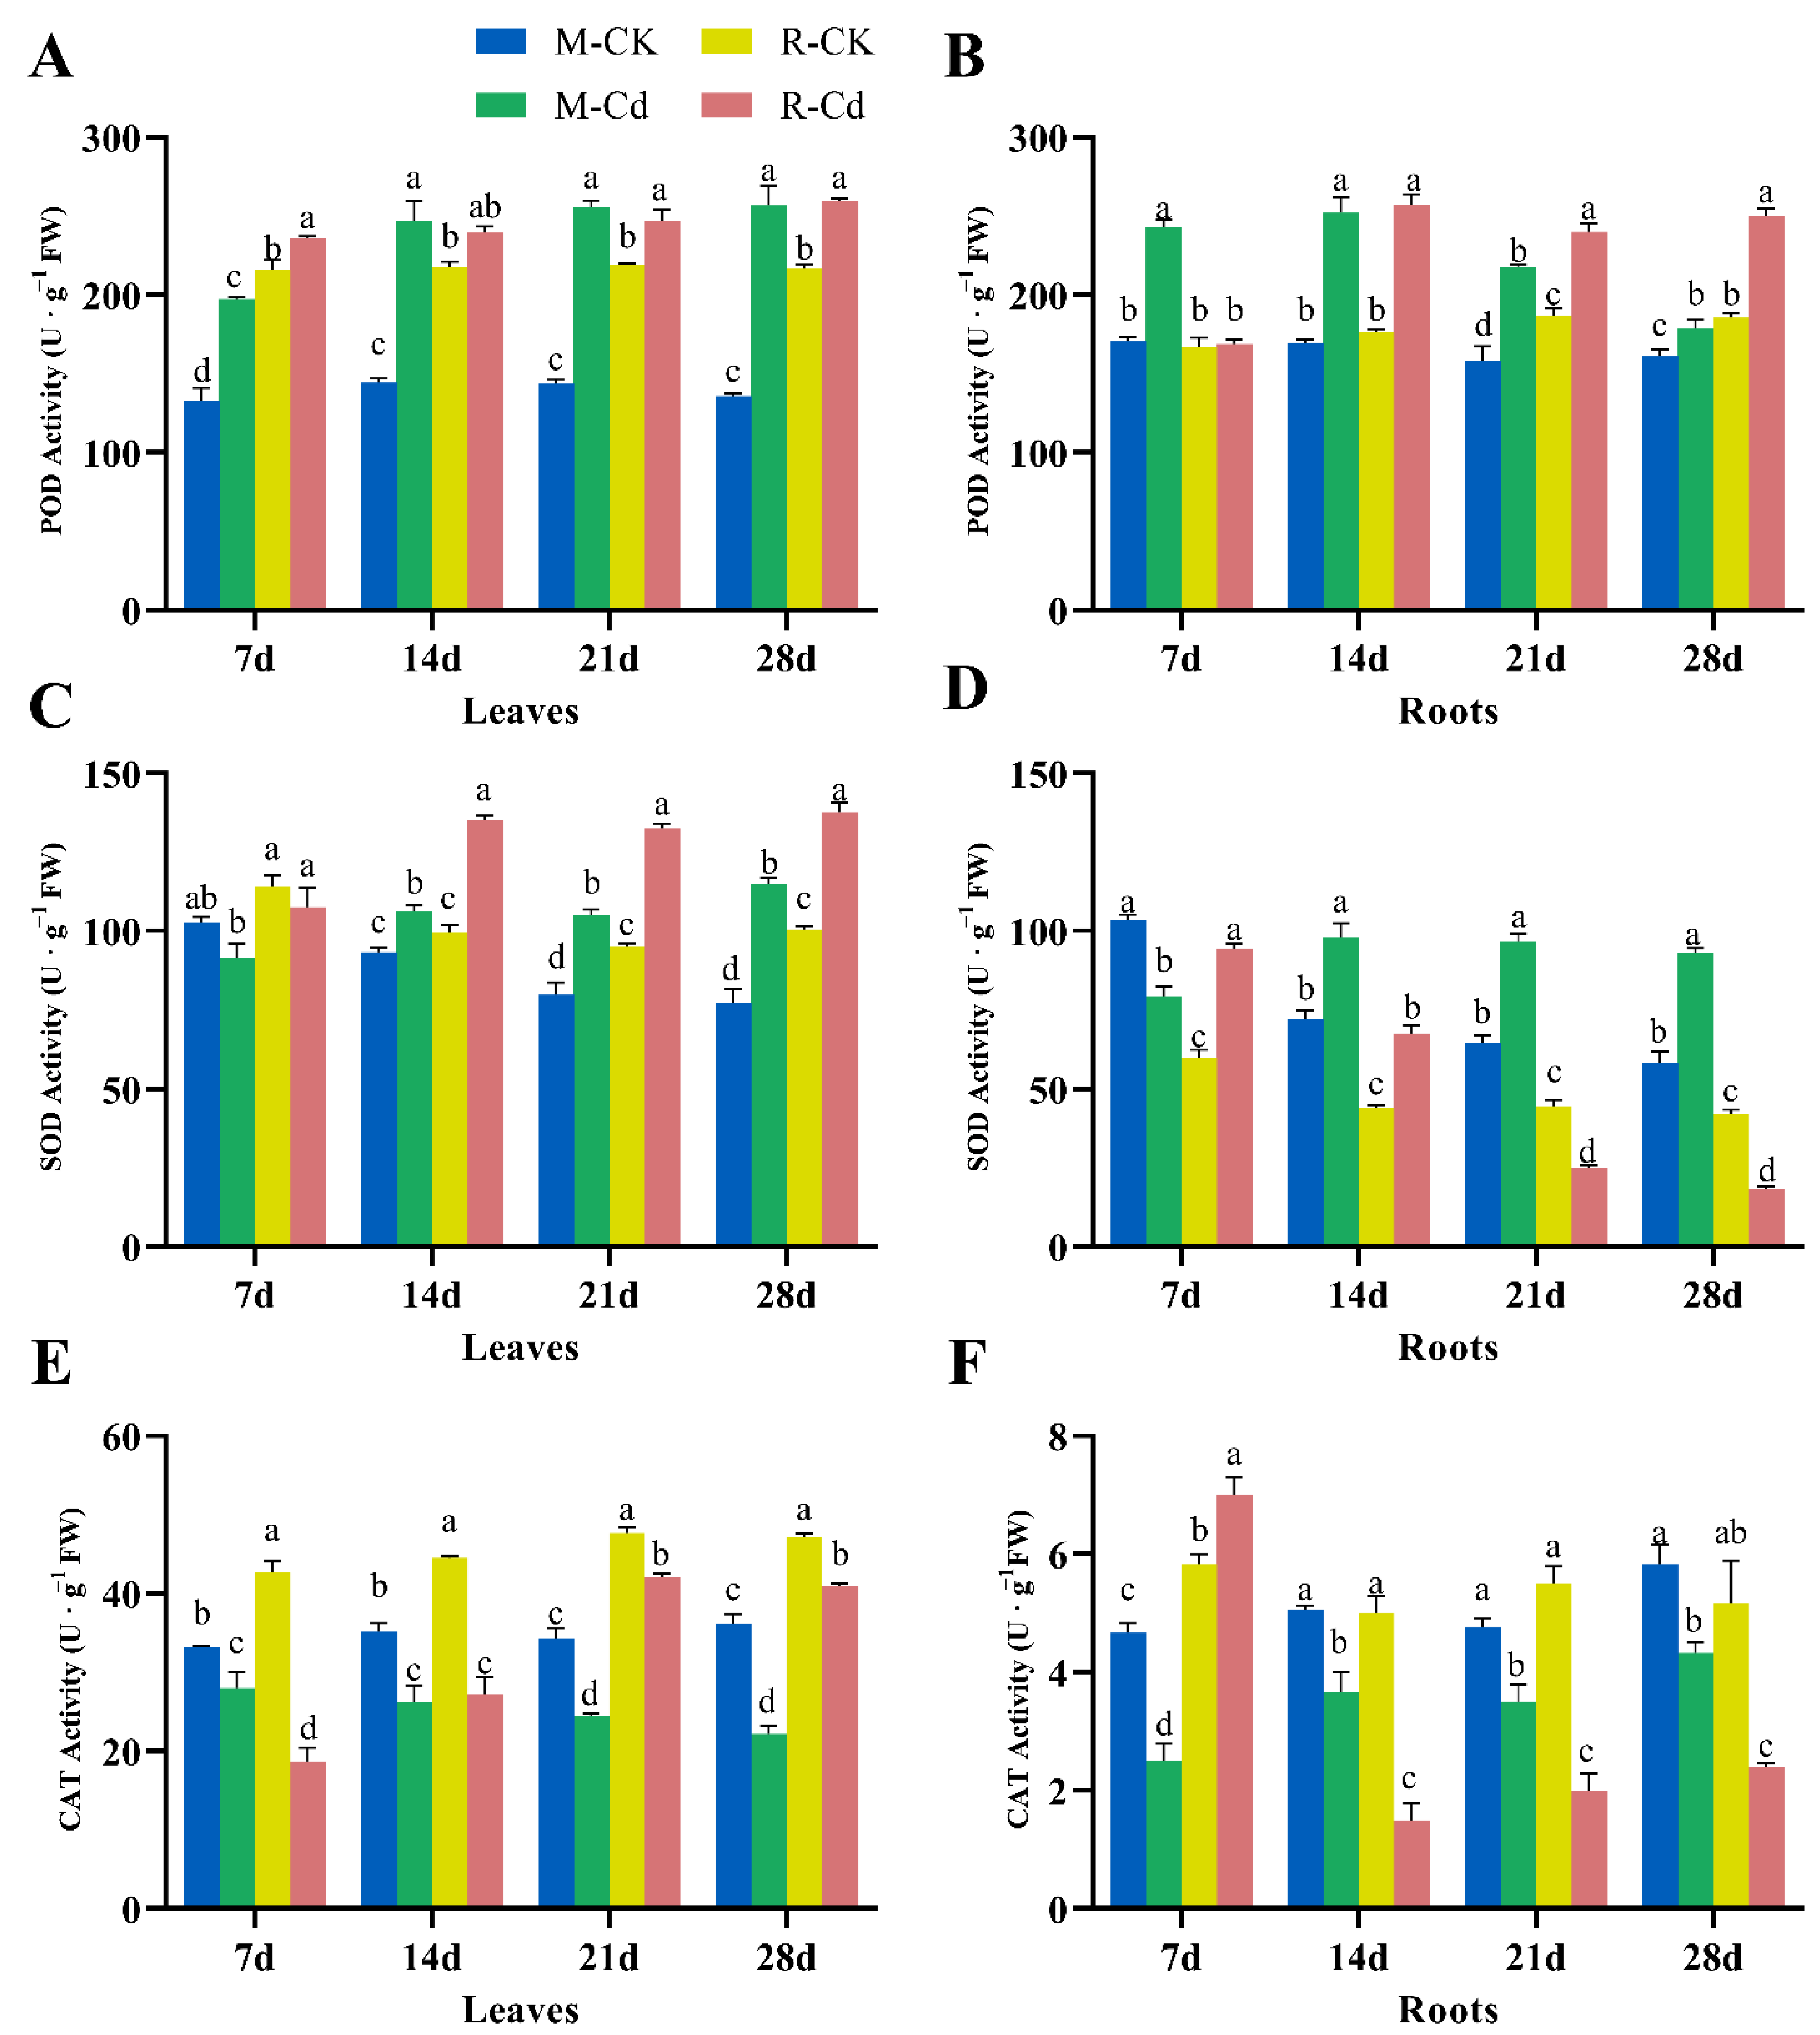
3.2. Effects of Cd on Antioxidant Enzyme Activity
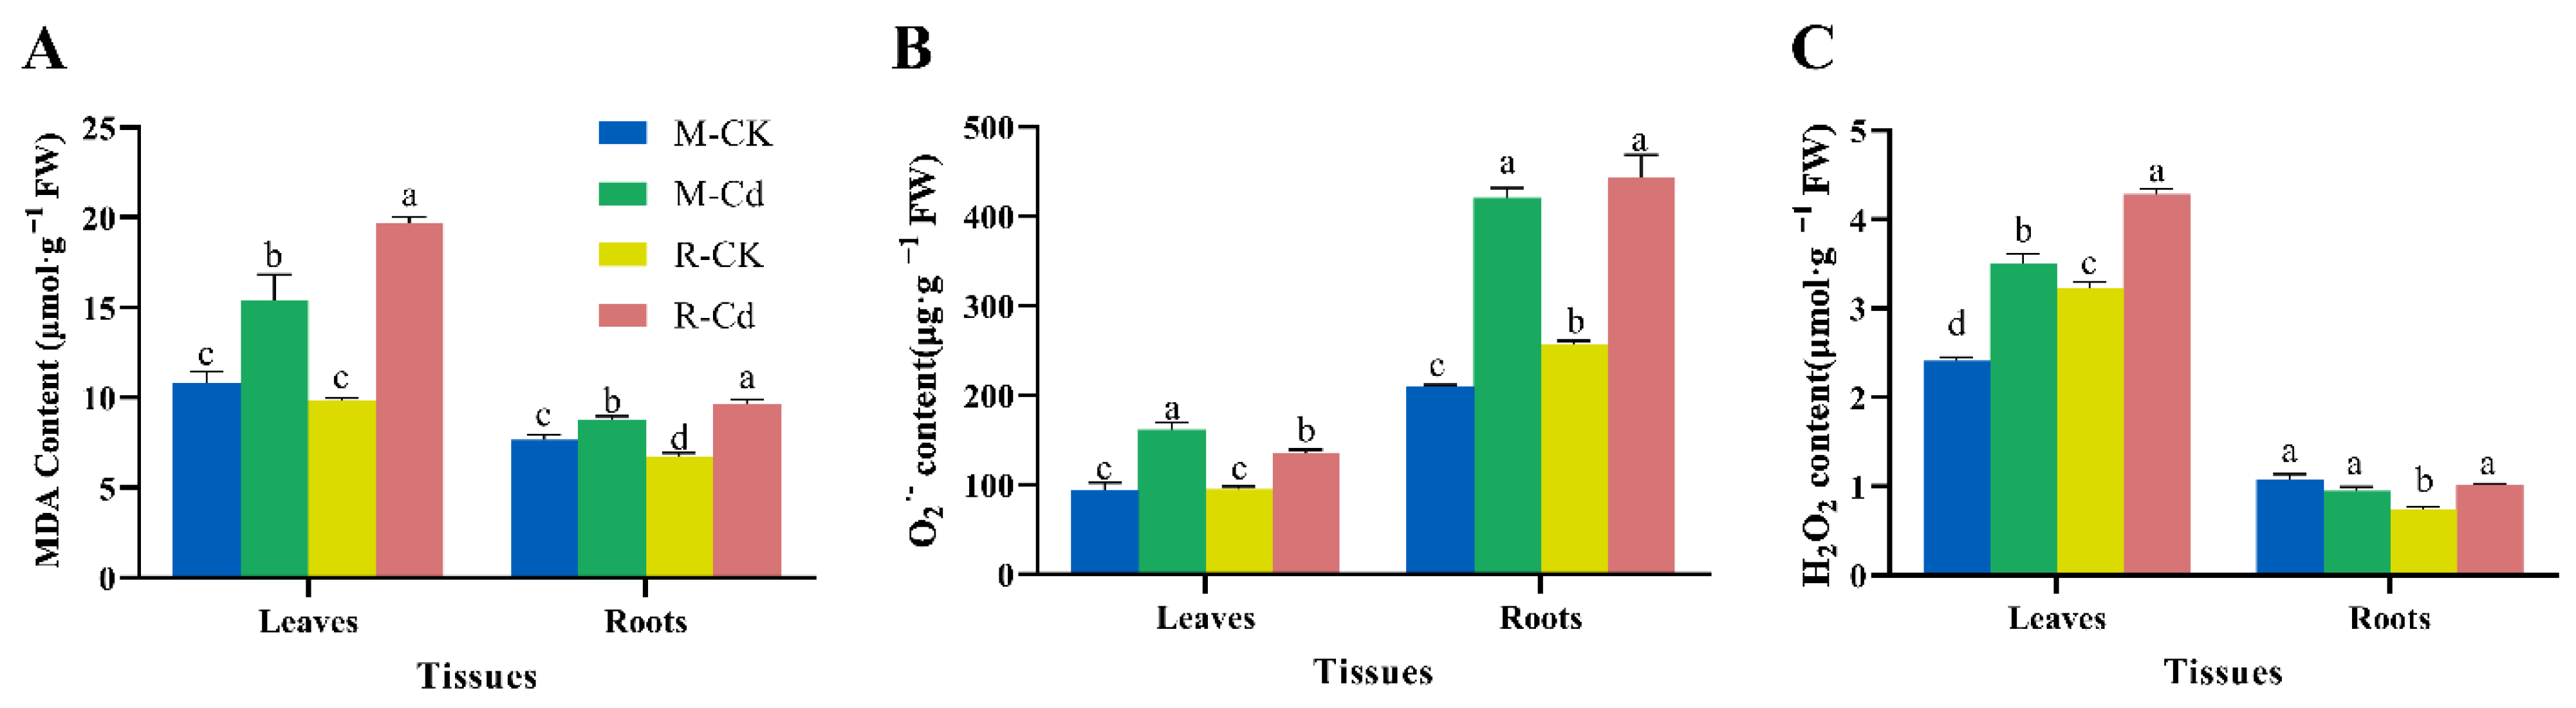
Given the positive role of antioxidant enzymes in ROS scavenging, the activities of POD, SOD, CAT, and APX were determined (Figure 2). Following Cd stress, the POD and SOD activity of the leaves and roots of the M and R genotypes was significantly upregulated (p < 0.05, Figure 2A–D). However, the SOD activity in the roots of the R genotype was inhibited at 21 d and 28 d after Cd stress (p < 0.05, Figure 2D). In addition, the CAT and APX activities in the leaves and roots of the R genotype and the roots of the M genotype were significantly inhibited by Cd stress (p < 0.05, Figure 2E–H). In the leaves of the M genotype, the CAT activity was significantly inhibited (p < 0.05), while the APX activity was upregulated after Cd stress (p < 0.05, Figure 2E,G). We also observed that the soluble protein content was significantly decreased in the leaves but increased in the roots by Cd (p < 0.05), and the M genotype possessed a higher soluble protein than R genotypes in leaves and roots after Cd stress (Figure 2I,J).

3.3. Effects of Cd on MDA, H2O2, and O2 Content

To further investigate Cd-induced oxidative stress in the M and R genotypes, the MDA, H2O2, and O2 contents were detected after 28 d of Cd stress (Figure 3). The MDA, H2O2, and O2 contents in the leaves and roots of the M and R genotypes were significantly increased (p < 0.05, Figure 3A–C). The MDA and H2O2 content in the leaves of the R genotype was higher than in the M genotype (p < 0.05, Figure 3A,C). In addition, the H2O2 content in the roots of the R genotype was significantly increased by Cd, while the M genotype appeared to have no significant difference from it.

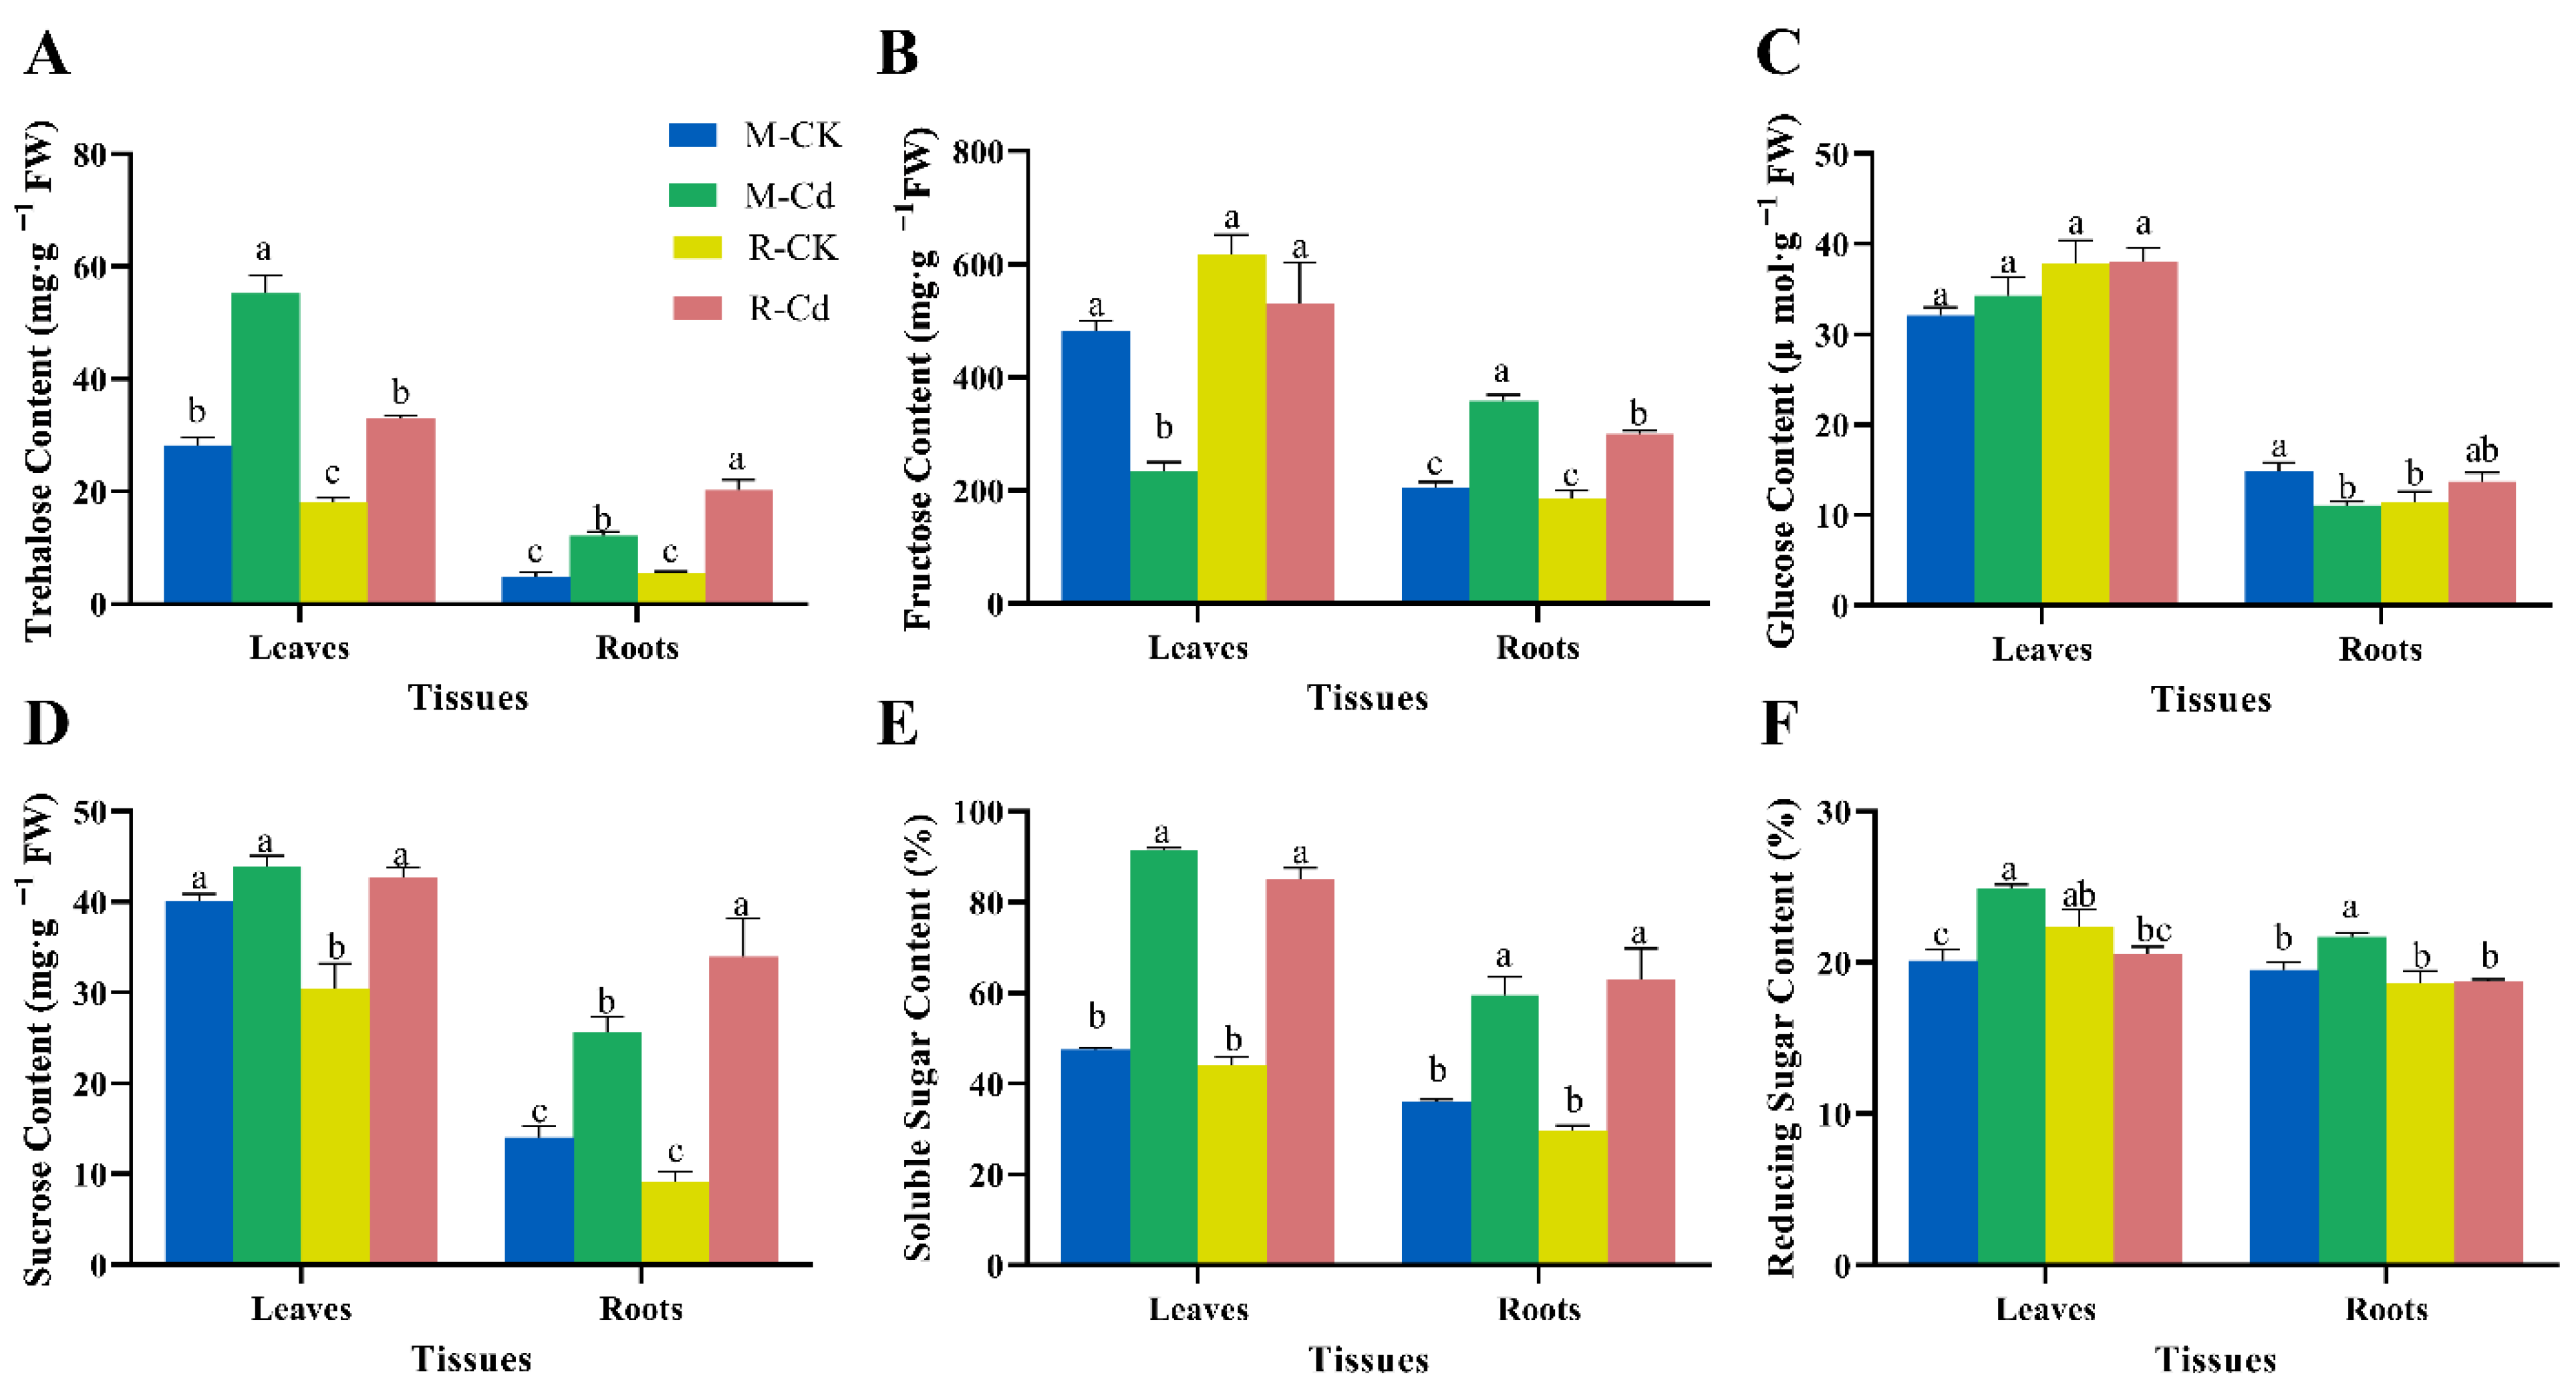
3.4. Effects of Cd on Non-Structural Carbohydrate Contents

After 28 d of Cd stress, the trehalose, sucrose, and soluble sugars were significantly increased in both the leaves and roots of the M and R genotypes (p < 0.05, Figure 4A,D,E). Moreover, the fructose content was decreased in the leaves but increased in the roots of the M and R genotypes (Figure 4B). The fructose content in the leaves of the M genotype decreased by 51.80%, whereas it decreased by 13.78% in the leaves of the R genotype after Cd stress (Figure 4B). There was no significant difference in glucose content in the leaves following Cd stress in both the M and R genotypes (Figure 4C). However, the glucose content in the roots of the M genotype decreased by Cd (p < 0.05, Figure 4C). In addition, Cd stress significantly increased the reducing sugar content in the leaves and roots of the M genotype (p < 0.05), but it appeared to have no significant difference to the leaves and roots of the R genotype (Figure 4F).

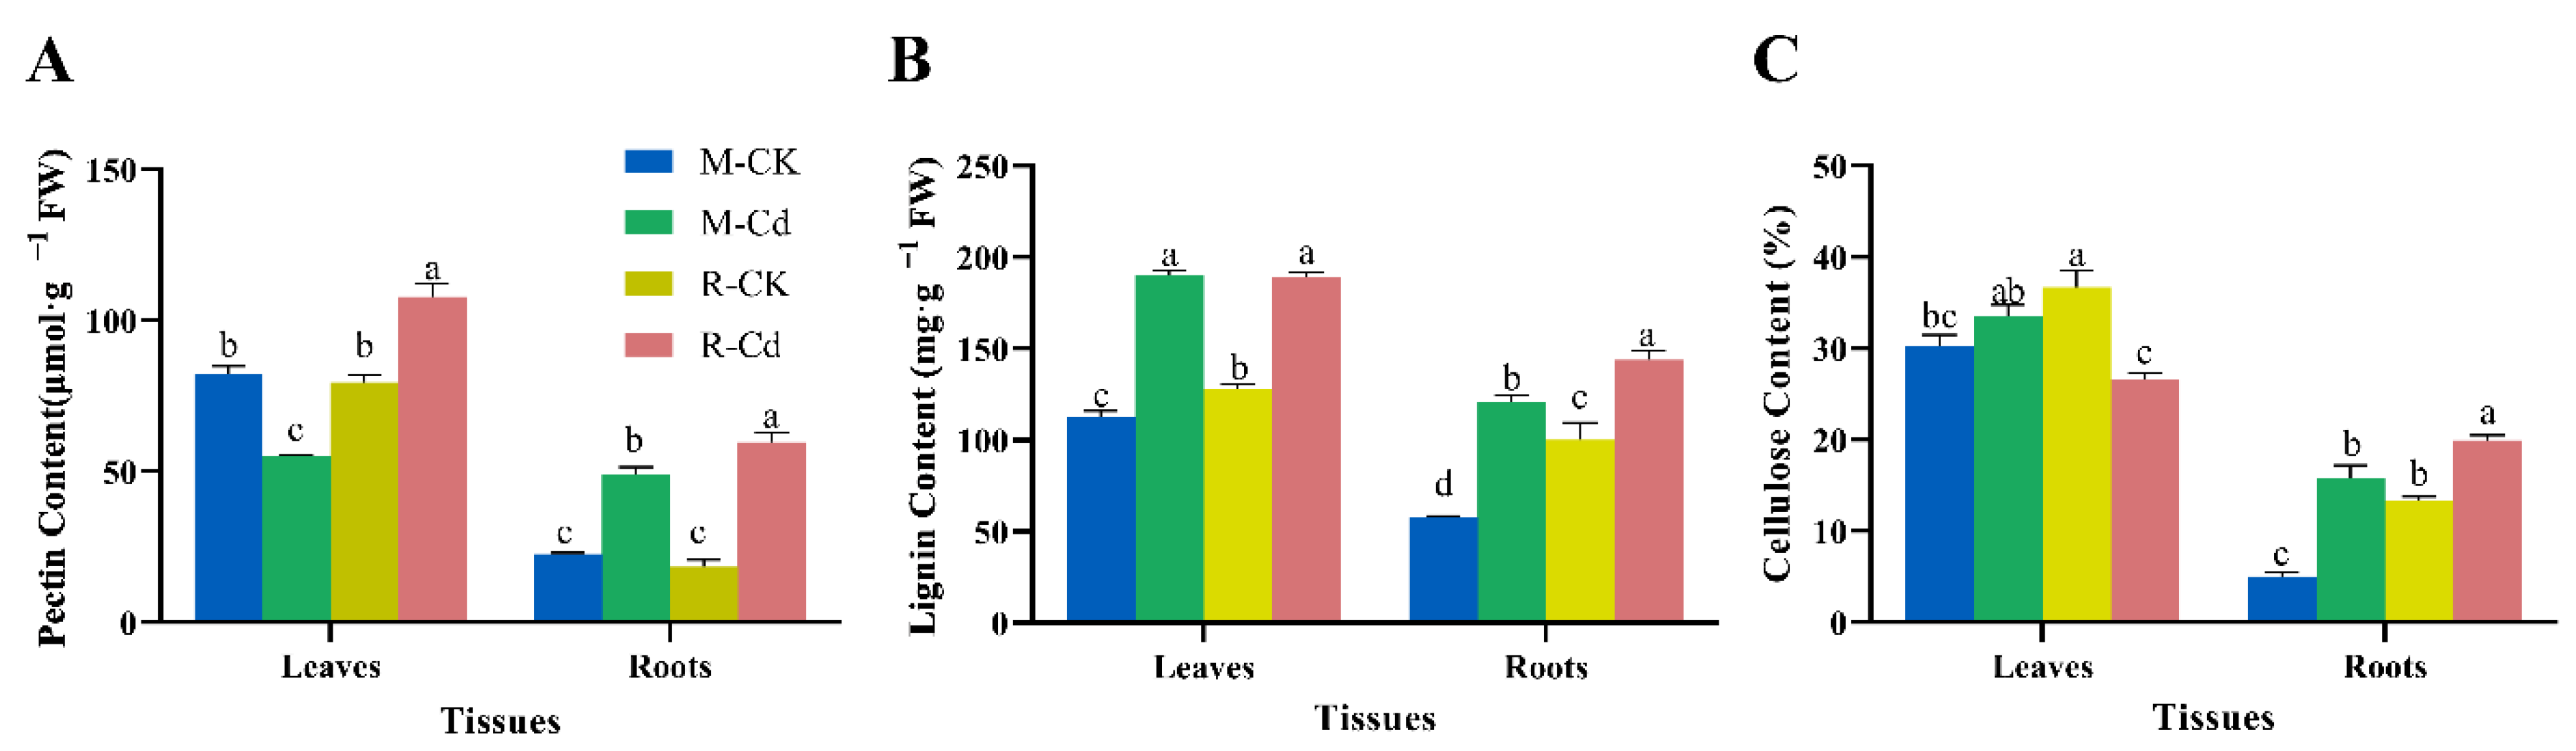
3.5. Effects of Cd on Structural Carbohydrate Contents

The pectin, lignin, and cellulose contents in the roots of the M and R genotypes were significantly increased after 28 d of Cd stress (p < 0.05, Figure 5A–C). However, the pectin content in the leaves of the M genotype was significantly decreased after Cd stress but increased in the leaves of the R genotype (p < 0.05, Figure 5A). In addition, the lignin content was significantly increased after Cd stress in the leaves of the M and R genotypes (p < 0.05, Figure 5B). There was a significant decrease of cellulose content in the leaves of the R genotype (p < 0.05, Figure 5C).

4. Discussion

Cd stress signal transduction occurs within a short time after Cd is absorbed by plants [9,40], following which defense reactions are triggered for adaptation to Cd stress [27]. These reactions are beneficial for plants to recover from stressful conditions. However, a high concentration of Cd leads to metabolic disturbance and growth inhibition in plants [41]. To date, there have been numerous studies on the mechanisms of Cd-induced plant toxicity and defense reactions [42]. Previous studies showed that Kentucky bluegrass is hypertolerant to Cd [18,27]. However, the Cd-induced defense reaction and detoxification mechanism in Kentucky bluegrass is still unclear.

4.1. Cd-Induced Growth Inhibition of the Leaves and Roots and the Defensive Reaction of the Cell Wall

There are three pathways by which Cd is absorbed through the root surface and arrives at the endodermis: the apoplastic pathway, symplastic pathway, and non-metabolic binding pathway (Figure 6) [43,44]. Cellulose, pectin, and lignin in the root cell wall provide Cd-binding sites and prevent Cd from entering into the cytoplasm, but a small amount of Cd can still pass through the cell wall and enter the symplastic pathway, following which the Cd is compartmentalized into the vacuole or loaded into the xylem for long-distance transportation [17,45]. As in the majority of plants, the roots of Kentucky bluegrass accumulated a large amount of Cd, whereas less Cd was allocated to the aboveground tissues in our experiment (Figure 1A). Compared with the M genotype, the R genotype allocated more Cd to the leaves, but the total Cd content was less than in the M genotype (Figure 1A,B). In addition, the accumulation of Cd inhibited the length and fresh weight of the leaves and roots (Figure 1C,D). However, the root length of the M genotype appeared to slightly decrease, but not significantly so. Therefore, the M genotype demonstrated better Cd absorption and resistance, whereas the R genotype exhibited an advantage in terms of the distribution of Cd.
The cell wall plays a key role in binding and detoxifying Cd [17]. Pectin can bind Cd2+ mainly through the homogalacturonan domains [46]. Wang [47] et al. showed that up to 42–79% of Cd is bound by pectin in the root cell wall. In addition, lignification always differs greatly between Cd-tolerant and -sensitive genotypes, which might explain the main mechanisms of tolerance [48]. Moreover, the cellulose of the root cell wall also influences the resistance of Cd. Song [49] et al. reported a missense mutation of cellulose synthase subunit 9 (CESA9) that decreased the cellulose content but increased the resistance to Cd stress. Similarly, Cd stress decreased the cellulose content in Miscanthus and rice [25]. In Zea mays L., low concentrations of Cd increased the cellulose content of the sensitive genotype but decreased the cellulose content of the tolerant genotype [50]. The prominent enrichment of cellulose biosynthetic process-related genres and cellulose synthase activity-related genes indicates that the Cd-induced biosynthesis/modification of cellulose plays a pivotal role in Cd accumulation in Sedum plumbizincicola X. H. Guo & S. B. Zhou ex L. H. Wu [51]. Cd also induced the cell wall defensive reaction in Kentucky bluegrass. The significant increase in root cell wall components, such as pectin, lignin, and cellulose, after Cd stress might contribute to decreasing the toxicity of Cd and prevent Cd from entering the cell (Figure 6). However, the pectin content was significantly decreased in the leaves of the M genotype but increased in the leaves of the R genotype (Figure 5A). Xu and Wang [18] showed that Cd that is bound by pectate and protein always has a low toxicity and is involved in the symplastic pathway for long-distance transportation in Kentucky bluegrass. Therefore, the lower Cd accumulation in the leaves of the M genotype and higher Cd accumulation in the leaves of the R genotype might be related to the pectin content. Although lignification helps reduce the entry of Cd, it also inhibits plant growth under Cd stress [20]. The root length of the M genotype exhibited no significant decrease, which might be due to lower lignification compared with the R genotype (Figure 1C and Figure 5B). The cellulose content was slightly increased in the leaves of the M genotype but significantly decreased in the leaves of the R genotype, which indicated that Cd stress might be a disadvantage to the biosynthesis of cellulose in the leaves (Figure 5C) [45,50].

4.2. Cd-Induced Antioxidative Stress Reaction of Kentucky Bluegrass

On absorption of Cd, the homeostasis of ROS metabolism is disrupted in plants (Figure 6). There are several pathways of heavy metal-induced ROS generation, such as transition metals involved in the Haber–Weiss cycle and the generation of OH [52]; Cd-induced excessive excitation energy of thylakoid-located photosynthetic electron transport, which promotes ROS generation [53]; Cd-induced plasma membrane-located NADPH oxidases, which produce H2O2 [54]; and Cd-induced subcellular metabolism or redox-active change could increase the ROS generation in mitochondria [55]. As mentioned in the introduction, excess ROS would be balanced by the relevant antioxidant enzymes. Moreover, POD can be simulated by Cd for the biosynthesis of lignin through H2O2 and monolignols [56,57]. In the present study, the increased O2, H2O2, and MDA contents showed that Cd stress induced oxidative stress in Kentucky bluegrass (Figure 3A–C). In addition, the R genotype exhibited a more significant increase in MDA in the leaves and roots, which confirmed that the R genotype was more sensitive to Cd toxicity (Figure 3A). The POD activity was significantly increased by Cd, which might contribute to lignification (Figure 2A,B, Figure 3C and Figure 5B) [17]. The SOD activity was inhibited by Cd in the roots of the R genotype but increased in the leaves, which might have a negative effect on O2 scavenging in the roots (Figure 2C,D and Figure 3B) [28]. In addition, the decrease in CAT and APX activity might disadvantage excess H2O2 scavenging under Cd stress (Figure 2E–H). Furthermore, the soluble protein content of M and R genotypes were decreased in leaves but increased in roots after Cd stress, which indicates that the synthesis of enzymes in roots of Kentucky bluegrass might play a key role in Cd detoxification (Figure 2I,J) [58]. The soluble protein content of the M genotype is much higher than the R genotype in the Cd and non-Cd condition, which might be closely related to increasing the tolerance of Cd (Figure 2I,J and Figure 6).

4.3. Non-Structural Carbohydrates Involved in the Defense against Cd Stress in Kentucky Bluegrass
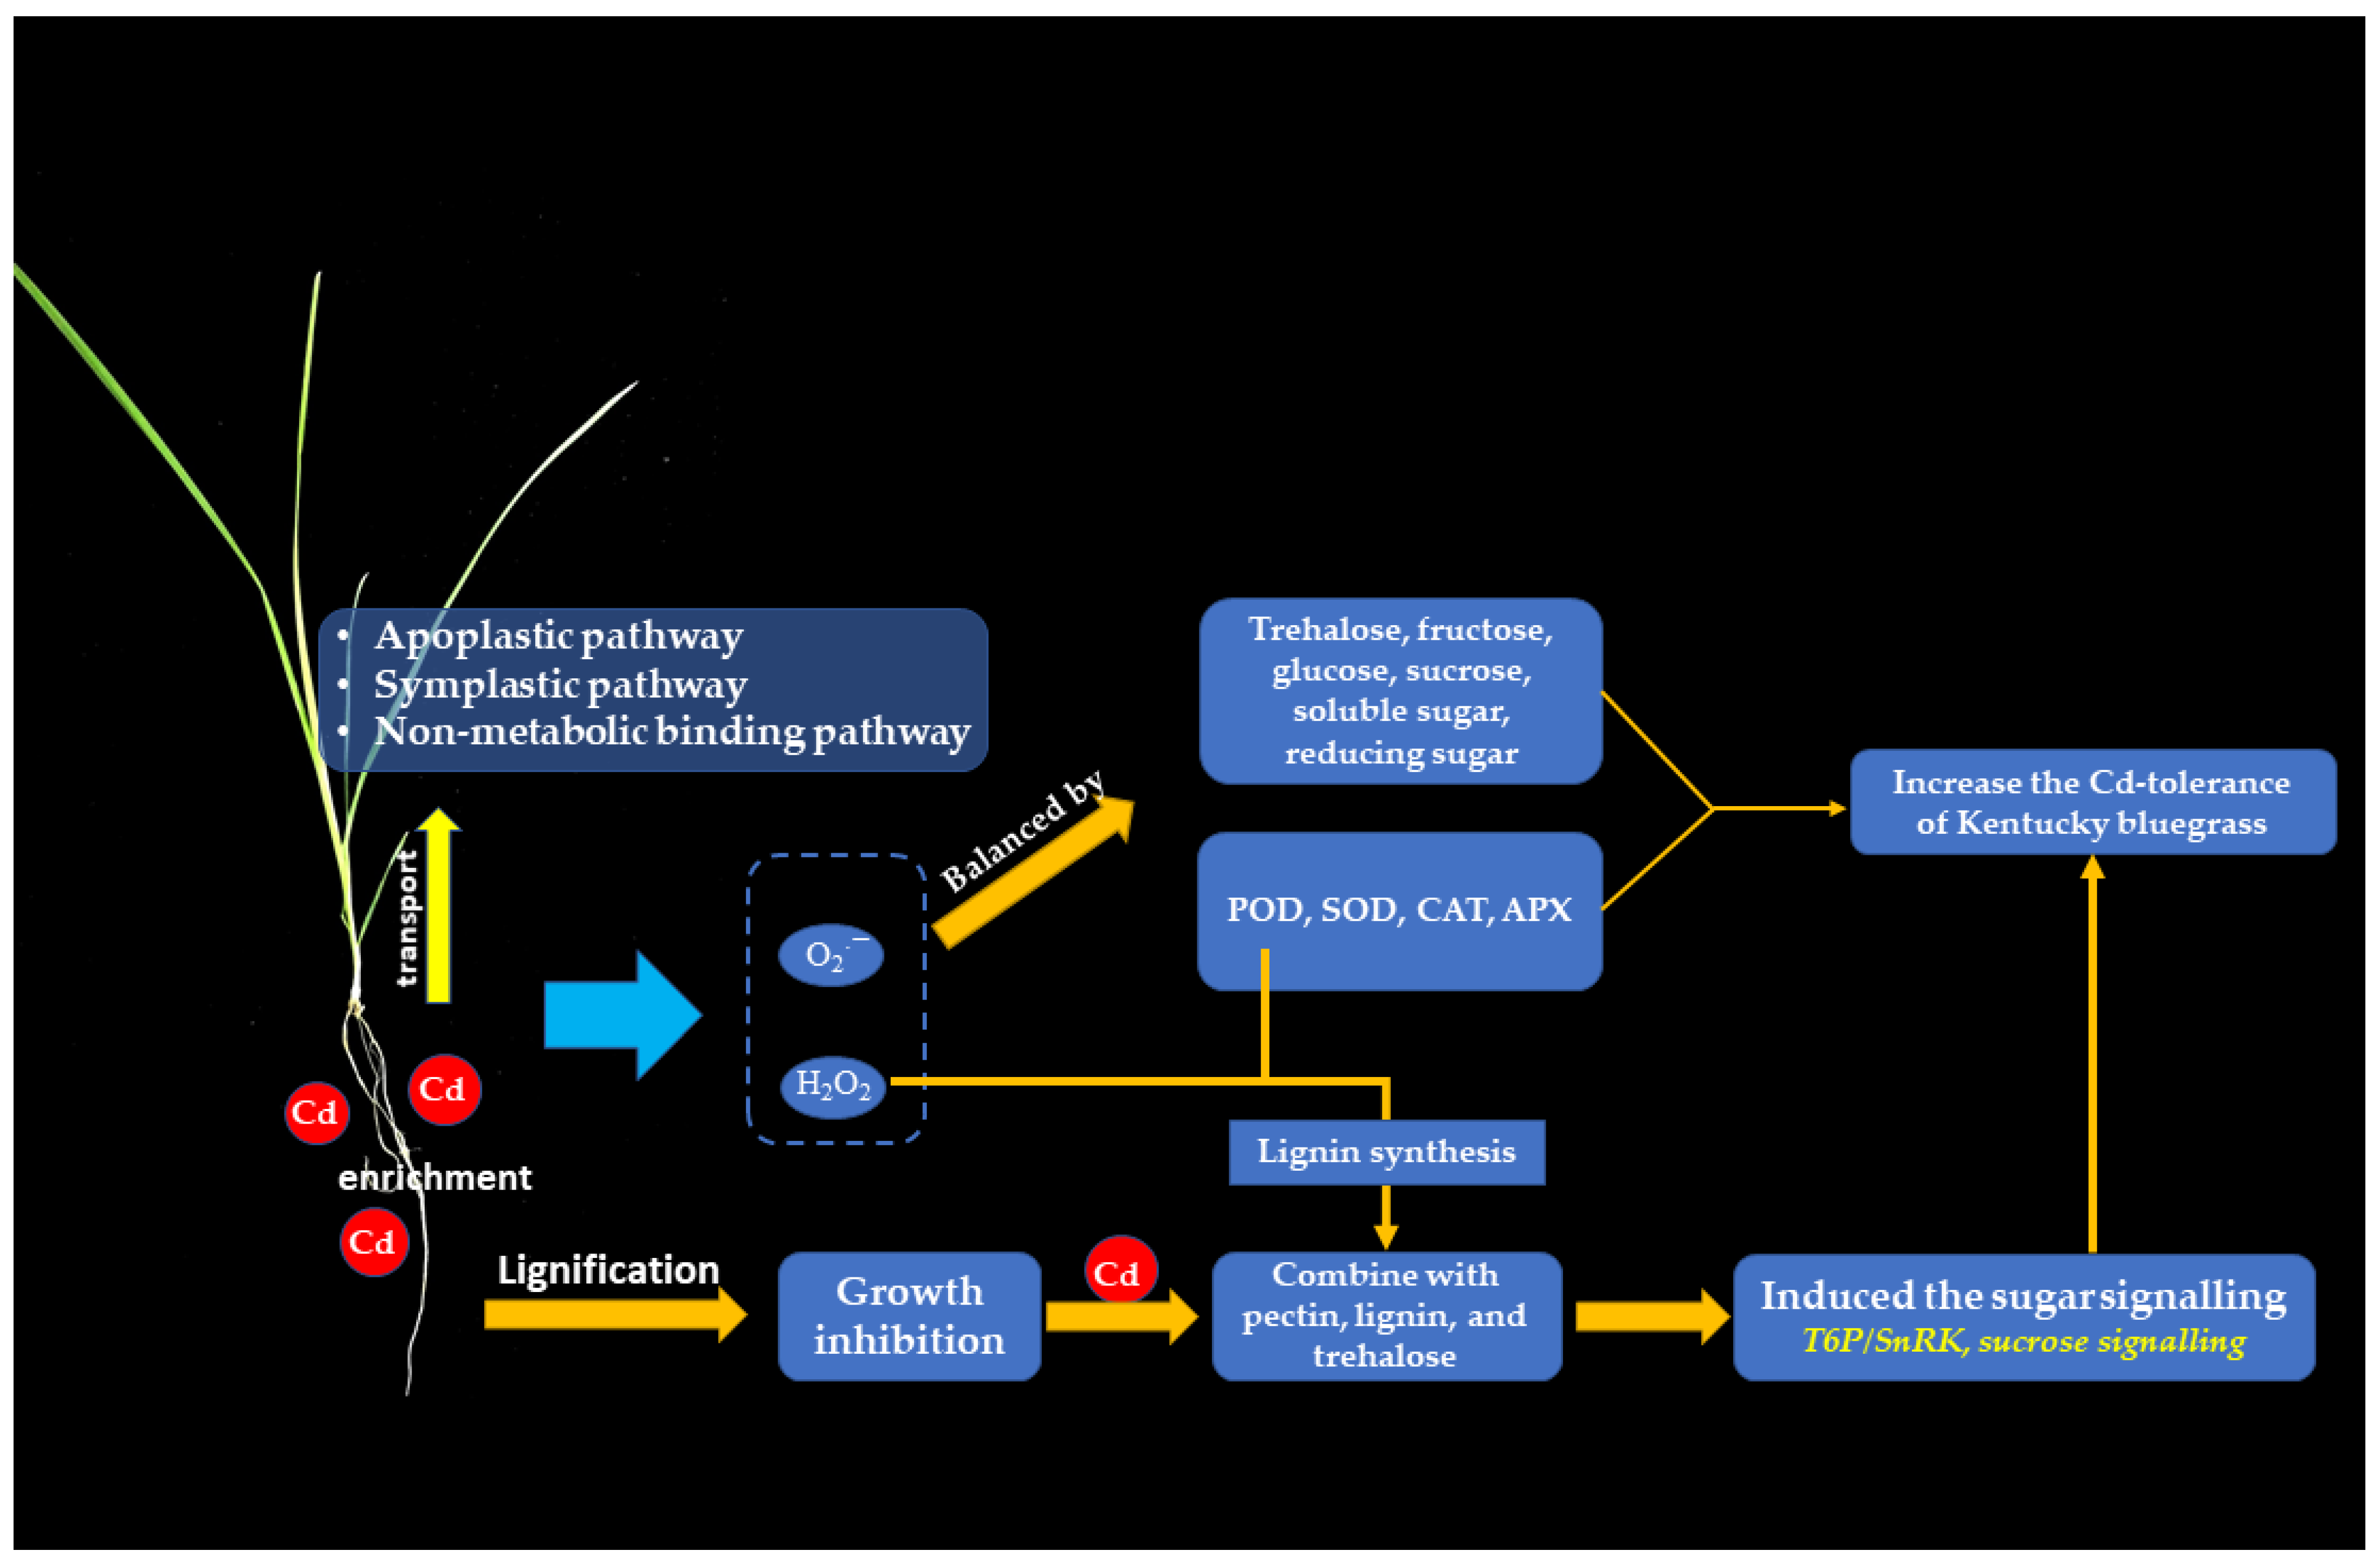
The trehalose content was increased in the leaves and roots of the M and R genotypes under Cd stress (Figure 4A). In plants, trehalose phosphate synthetase (TPS) catalyzes uridine diphosphoglucose and glucose 6-phosphate to synthesize trehalose [59]. Duman [60] et al. showed that 0.5 mM exogenous trehalose promoted Cd accumulation in Lemna gibba L.. Moreover, trehalose is involved in the trehalose-6-phosphate/sucrose non-fermenting related kinase (T6P/SnRK) pathway for signal transduction under stress conditions [61]. A recent study reported that trehalose alleviates Cd stress by forming Cd-trehalose chelate [62]. Therefore, the increase in trehalose in Kentucky bluegrass following Cd stress might be attributed to Cd detoxification. Cd reduced the fructose content in the leaves and increased the fructose contents in the roots of Kentucky bluegrass (Figure 4B). Similar results were also reported in Brassica napus L. [63], Nicotiana tabacum L. [64], and Pisum sativum L. [65]. In addition, sucrose and its cleavage products act as signaling molecules involved in plant development and defense reactions [66]. Verma [67] et al. showed that Cd stress significantly increased the sucrose content in rice. Similarly, the sucrose content in the leaves and roots of Kentucky bluegrass was significantly increased by Cd, which suggests that Kentucky bluegrass increased carbon assimilation to defend against Cd stress (Figure 4B). Furthermore, the soluble sugar content in the leaves and roots of the M and R genotypes was significantly increased after Cd stress, but the reducing sugar content was increased in the leaves and roots of the M genotype (Figure 4E,F). This phenomenon is a comprehensive reaction that exists in the plant response to environment stress. In most plant species, sugars play a key role in ROS scavenging under stress situations, except for the antioxidant enzyme system because of the highly hydroxylated structure of this system (Figure 6). A high sugar concentration helps maintain the osmotic pressure in plants and stabilizes membranous structures after stress. Moreover, NADPH produced by the pentose phosphate pathway is involved in the ascorbate–glutathione cycle, and oxidized glutathione is a pivotal phytochelatin of Cd. These characteristics make sugars particularly relevant in the response to environmental stress [10,17].

5. Conclusions

Both genotypes of Kentucky bluegrass accumulated more Cd in the roots, whereas the Cd-sensitive (R) genotype accumulated more Cd in the leaves compared with the Cd-tolerant (M) genotype. The M genotype exhibited lower root length inhibition and a lower H2O2 and MDA content, but it exhibited higher resistance to Cd. Moreover, the SOD, CAT, APX activity, and soluble protein content in the roots of the M genotype is much higher than in the R genotype after Cd stress. A relatively higher increasing of lignin and cellulose content in the roots of the M genotype might play an important role in inhibiting the long-distance transport of Cd. In addition, carbohydrates involved in defense against Cd stress in Kentucky bluegrass and trehalose might play an important role in the Cd detoxification of Kentucky bluegrass. The significant increase of reducing sugar content in the M genotype might provide an advantage in increasing the tolerance of Cd.

Supplementary Materials

The following are available online at https://0-www-mdpi-com.brum.beds.ac.uk/article/10.3390/agronomy11112358/s1, Table S1: The control settings in microwave digestion system.

Author Contributions

Y.W.: Investigation, Writing—Review and editing. T.C.: Investigation, Data curation, Writing—Original draft preparation. K.N.: Data curation, Investigation. H.M.: Supervision, Validation, Funding acquisition, Writing—Review and editing. All authors have read and agreed to the published version of the manuscript.

Funding

This research was funded by the National Natural Science Foundation of China, grant number 3207140682, and the Star of Innovation project for Outstanding Graduate student, grant number 2021CXZX-385.

Institutional Review Board Statement

Not applicable.

Informed Consent Statement

Not applicable.

Acknowledgments

We thank Kuiju Niu and Huiling Ma for their unselfish assistance during the preparation of this manuscript.

Conflicts of Interest

The authors declare that they have no known competing financial interest or personal relationships that could have appeared to influence the work reported in this paper.

References

  1. Gallego, S.M.; Pena, L.B.; Barcia, R.A.; Azpilicueta, C.E.; Iannone, M.F.; Rosales, E.P.; Zawoznik, M.S.; Groppa, M.D.; Benavides, M.P. Unravelling Cadmium Toxicity and Tolerance in Plants: Insight into Regulatory Mechanisms. Environ. Exp. Bot. 2012, 83, 33–46. [Google Scholar] [CrossRef]
  2. Li, Z.; Ma, Z.; van der Kuijp, T.J.; Yuan, Z.; Huang, L. A Review of Soil Heavy Metal Pollution from Mines in China: Pollution and Health Risk Assessment. Sci. Total Environ. 2014, 468–469, 843–853. [Google Scholar] [CrossRef]
  3. Mielke, H.W.; Adams, J.L.; Chaney, R.L.; Mielke, P.W.; Ravikumar, V.C. The Pattern of Cadmium in the Environment of Five Minnesota Cities. Environ Geochem Health 1991, 13, 29–34. [Google Scholar] [CrossRef] [PubMed]
  4. Kumar, A.; Subrahmanyam, G.; Mondal, R.; Cabral-Pinto, M.M.S.; Shabnam, A.A.; Jigyasu, D.K.; Malyan, S.K.; Fagodiya, R.K.; Khan, S.A.; Kumar, A.; et al. Bio-Remediation Approaches for Alleviation of Cadmium Contamination in Natural Resources. Chemosphere 2021, 268, 128855. [Google Scholar] [CrossRef]
  5. Prozialeck, W.C.; Vaidya, V.S.; Liu, J.; Waalkes, M.P.; Edwards, J.R.; Lamar, P.C.; Bernard, A.M.; Dumont, X.; Bonventre, J.V. Kidney Injury Molecule-1 Is an Early Biomarker of Cadmium Nephrotoxicity. Kidney Int. 2007, 72, 985–993. [Google Scholar] [CrossRef] [Green Version]
  6. Pulscher, L.A.; Gray, R.; McQuilty, R.; Rose, K.; Welbergen, J.A.; Phalen, D.N. Evidence of Chronic Cadmium Exposure Identified in the Critically Endangered Christmas Island Flying-Fox (Pteropus natalis). Sci. Total Environ. 2021, 766, 144374. [Google Scholar] [CrossRef] [PubMed]
  7. Haider, F.U.; Liqun, C.; Coulter, J.A.; Cheema, S.A.; Wu, J.; Zhang, R.; Wenjun, M.; Farooq, M. Cadmium Toxicity in Plants: Impacts and Remediation Strategies. Ecotoxicol. Environ. Saf. 2021, 211, 111887. [Google Scholar] [CrossRef]
  8. Chakrabarti, M.; Mukherjee, A. Investigating the Underlying Mechanism of Cadmium-Induced Plant Adaptive Response to Genotoxic Stress. Ecotoxicol. Environ. Saf. 2021, 209, 111817. [Google Scholar] [CrossRef] [PubMed]
  9. Apel, K.; Hirt, H. REACTIVE OXYGEN SPECIES: Metabolism, Oxidative Stress, and Signal Transduction. Annu. Rev. Plant Biol. 2004, 55, 373–399. [Google Scholar] [CrossRef] [Green Version]
  10. Pommerrenig, B.; Ludewig, F.; Cvetkovic, J.; Trentmann, O.; Klemens, P.A.W.; Neuhaus, H.E. In Concert: Orchestrated Changes in Carbohydrate Homeostasis Are Critical for Plant Abiotic Stress Tolerance. Plant Cell Physiol. 2018, 59, 1290–1299. [Google Scholar] [CrossRef]
  11. Smirnoff, N.; Cumbes, Q.J. Hydroxyl Radical Scavenging Activity of Compatible Solutes. Phytochemistry 1989, 28, 1057–1060. [Google Scholar] [CrossRef]
  12. Gururani, M.A.; Venkatesh, J.; Tran, L.S.P. Regulation of Photosynthesis during Abiotic Stress-Induced Photoinhibition. Mol. Plant 2015, 8, 1304–1320. [Google Scholar] [CrossRef] [PubMed] [Green Version]
  13. Ljung, K.; Nemhauser, J.L.; Perata, P. New Mechanistic Links between Sugar and Hormone Signalling Networks. Curr. Opin. Plant Biol. 2015, 25, 130–137. [Google Scholar] [CrossRef] [PubMed]
  14. Bolouri-Moghaddam, M.R.; Le Roy, K.; Xiang, L.; Rolland, F.; Van den Ende, W. Sugar Signalling and Antioxidant Network Connections in Plant Cells. FEBS J. 2010, 277, 2022–2037. [Google Scholar] [CrossRef]
  15. Griffiths, C.A.; Sagar, R.; Geng, Y.; Primavesi, L.F.; Patel, M.K.; Passarelli, M.K.; Gilmore, I.S.; Steven, R.T.; Bunch, J.; Paul, M.J.; et al. Chemical Intervention in Plant Sugar Signalling Increases Yield and Resilience. Nature 2016, 540, 574–578. [Google Scholar] [CrossRef]
  16. Dong, S.; Beckles, D.M. Dynamic Changes in the Starch-Sugar Interconversion within Plant Source and Sink Tissues Promote a Better Abiotic Stress Response. J. Plant Physiol. 2019, 234, 80–93. [Google Scholar] [CrossRef]
  17. Loix, C.; Huybrechts, M.; Vangronsveld, J.; Gielen, M.; Keunen, E.; Cuypers, A. Reciprocal Interactions between Cadmium-Induced Cell Wall Responses and Oxidative Stress in Plants. Front. Plant Sci. 2017, 8, 1867. [Google Scholar] [CrossRef] [PubMed] [Green Version]
  18. Xu, P.; Wang, Z. Physiological Mechanism of Hypertolerance of Cadmium in Kentucky Bluegrass and Tall Fescue: Chemical Forms and Tissue Distribution. Environ. Exp. Bot. 2013, 96, 35–42. [Google Scholar] [CrossRef]
  19. Podazza, G.; Arias, M.; Prado, F.E. Cadmium Accumulation and Strategies to Avoid Its Toxicity in Roots of the Citrus Rootstock Citrumelo. J. Hazard. Mater. 2012, 215–216, 83–89. [Google Scholar] [CrossRef]
  20. Finger-Teixeira, A.; de Lourdes Lucio Ferrarese, M.; Ricardo Soares, A.; da Silva, D.; Ferrarese-Filho, O. Cadmium-Induced Lignification Restricts Soybean Root Growth. Ecotoxicol. Environ. Saf. 2010, 73, 1959–1964. [Google Scholar] [CrossRef]
  21. Moura, J.C.M.S.; Bonine, C.A.V.; Viana, J.D.O.F.; Dornelas, M.C.; Mazzafera, P. Abiotic and Biotic Stresses and Changes in the Lignin Content and Composition in Plants. J. Integr. Plant Biol. 2010, 52, 360–376. [Google Scholar] [CrossRef]
  22. Guo, X.; Luo, J.; Du, Y.; Li, J.; Liu, Y.; Liang, Y.; Li, T. Coordination between Root Cell Wall Thickening and Pectin Modification Is Involved in Cadmium Accumulation in Sedum Alfredii. Environ. Pollut. 2021, 268, 115665. [Google Scholar] [CrossRef]
  23. Li, H.; Zheng, X.; Tao, L.; Yang, Y.; Gao, L.; Xiong, J. Aeration Increases Cadmium (Cd) Retention by Enhancing Iron Plaque Formation and Regulating Pectin Synthesis in the Roots of Rice (Oryza sativa) Seedlings. Rice 2019, 12, 28. [Google Scholar] [CrossRef] [Green Version]
  24. Muschitz, A.; Riou, C.; Mollet, J.-C.; Gloaguen, V.; Faugeron, C. Modifications of Cell Wall Pectin in Tomato Cell Suspension in Response to Cadmium and Zinc. Acta Physiol. Plant. 2015, 37, 245. [Google Scholar] [CrossRef]
  25. Cheng, S.; Yu, H.; Hu, M.; Wu, Y.; Cheng, L.; Cai, Q.; Tu, Y.; Xia, T.; Peng, L. Miscanthus Accessions Distinctively Accumulate Cadmium for Largely Enhanced Biomass Enzymatic Saccharification by Increasing Hemicellulose and Pectin and Reducing Cellulose CrI and DP. Bioresour. Technol. 2018, 263, 67–74. [Google Scholar] [CrossRef] [PubMed]
  26. Xu, P.; Wang, Z. A Comparison Study in Cadmium Tolerance and Accumulation in Two Cool-Season Turfgrasses and Solanum nigrum L. Water Air Soil Pollut. 2014, 225, 1938. [Google Scholar] [CrossRef]
  27. Xian, J.; Wang, Y.; Niu, K.; Ma, H.; Ma, X. Transcriptional Regulation and Expression Network Responding to Cadmium Stress in a Cd-Tolerant Perennial Grass Poa Pratensis. Chemosphere 2020, 250, 126158. [Google Scholar] [CrossRef] [PubMed]
  28. Niu, K.; Ma, X.; Liang, G.; Ma, H.; Jia, Z.; Liu, W.; Yu, Q. 5-Aminolevulinic Acid Modulates Antioxidant Defense Systems and Mitigates Drought-Induced Damage in Kentucky Bluegrass Seedlings. Protoplasma 2017, 254, 2083–2094. [Google Scholar] [CrossRef] [PubMed]
  29. Kelestemur, S.; Özcan, M. Determination of Pb in Glasses by Direct Solid Sampling and High-Resolution Continuum Source Graphite Furnace Atomic Absorption Spectrometry: Method Development and Analyses of Glass Samples. Microchem. J. 2015, 118, 55–61. [Google Scholar] [CrossRef]
  30. Kumar, G.; Knowles, N.R. Changes in Lipid Peroxidation and Lipolytic and Free-Radical Scavenging Enzyme Activities during Aging and Sprouting of Potato (Solanum tuberosum) Seed-Tubers. Plant Physiol. 1993, 102, 115–124. [Google Scholar] [CrossRef] [Green Version]
  31. Quintanilla-Guerrero, F.; Duarte-Vázquez, M.A.; García-Almendarez, B.E.; Tinoco, R.; Vazquez-Duhalt, R.; Regalado, C. Polyethylene Glycol Improves Phenol Removal by Immobilized Turnip Peroxidase. Bioresour. Technol. 2008, 99, 8605–8611. [Google Scholar] [CrossRef]
  32. Zhou, W.; Zhao, D.; Lin, X. Effects of Waterlogging on Nitrogen Accumulation and Alleviation of Waterlogging Damage by Application of Nitrogen Fertilizer and Mixtalol in Winter Rape (Brassica napus L.). J. Plant Growth Regul. 1997, 16, 47–53. [Google Scholar] [CrossRef]
  33. Nakano, Y.; Asada, K. Hydrogen Peroxide is Scavenged by Ascorbate-specific Peroxidase in Spinach Chloroplasts. Plant Cell Physiol. 1981, 22, 867–880. [Google Scholar] [CrossRef]
  34. Havir, E.A.; McHale, N.A. Biochemical and Developmental Characterization of Multiple Forms of Catalase in Tobacco Leaves. Plant Physiol. 1987, 84, 450–455. [Google Scholar] [CrossRef] [Green Version]
  35. Pena, L.B.; Pasquini, L.A.; Tomaro, M.L.; Gallego, S.M. Proteolytic System in Sunflower (Helianthus annuus L.) Leaves under Cadmium Stress. Plant Sci. 2006, 171, 531–537. [Google Scholar] [CrossRef]
  36. Miller, G.L. Lorenz. Use of Dinitrosalicylic Acid Reagent for Determination of Reducing Sugar. Anal. Chem. 1959, 31, 426–428. [Google Scholar] [CrossRef]
  37. Sinay, H.; Karuwal, R.L. Proline and Total Soluble Sugar Content at the Vegetative Phase of Six Corn Cultivars from Kisar Island Maluku, Grown under Drought Stress Conditions. Int. J. Adv. Agric. Res. 2014, 2, 77–82. [Google Scholar]
  38. Cadet, F.; Offmann, B. Direct Spectroscopic Sucrose Determination of Raw Sugar Cane Juices. J. Agric. Food Chem. 1997, 45, 166–171. [Google Scholar] [CrossRef]
  39. Viles, F.J.; Silverman, L. Determination of Starch and Cellulose with Anthrone. Anal. Chem. 1949, 21, 950–953. [Google Scholar] [CrossRef]
  40. Romero-Puertas, M.C.; Terrón-Camero, L.C.; Peláez-Vico, M.Á.; Olmedilla, A.; Sandalio, L.M. Reactive Oxygen and Nitrogen Species as Key Indicators of Plant Responses to Cd Stress. Environ. Exp. Bot. 2019, 161, 107–119. [Google Scholar] [CrossRef]
  41. Hédiji, H.; Djebali, W.; Cabasson, C.; Maucourt, M.; Baldet, P.; Bertrand, A.; Boulila Zoghlami, L.; Deborde, C.; Moing, A.; Brouquisse, R.; et al. Effects of Long-Term Cadmium Exposure on Growth and Metabolomic Profile of Tomato Plants. Ecotoxicol. Environ. Saf. 2010, 73, 1965–1974. [Google Scholar] [CrossRef] [PubMed]
  42. Arruda, M.a.Z.; Azevedo, R.A. Metallomics and Chemical Speciation: Towards a Better Understanding of Metal-Induced Stress in Plants. Ann. Appl. Biol. 2009, 155, 301–307. [Google Scholar] [CrossRef]
  43. Cutler, J.M.; Rains, D.W. Characterization of Cadmium Uptake by Plant Tissue. Plant Physiol. 1974, 54, 67. [Google Scholar] [CrossRef] [Green Version]
  44. Dong, Q.; Xu, P.; Wang, Z. Differential Cadmium Distribution and Translocation in Roots and Shoots Related to Hyper-Tolerance between Tall Fescue and Kentucky Bluegrass. Front. Plant Sci. 2017, 8, 113. [Google Scholar] [CrossRef] [Green Version]
  45. Gutsch, A.; Sergeant, K.; Keunen, E.; Prinsen, E.; Guerriero, G.; Renaut, J.; Hausman, J.-F.; Cuypers, A. Does Long-Term Cadmium Exposure Influence the Composition of Pectic Polysaccharides in the Cell Wall of Medicago Sativa Stems? BMC Plant Biol. 2019, 19, 271. [Google Scholar] [CrossRef] [Green Version]
  46. Krzeslowska, M. The Cell Wall in Plant Cell Response to Trace Metals: Polysaccharide Remodeling and Its Role in Defense Strategy. Acta Physiol. Plant. 2011, 33, 35–51. [Google Scholar] [CrossRef] [Green Version]
  47. Wang, L.; Li, R.; Yan, X.; Liang, X.; Sun, Y.; Xu, Y. Pivotal Role for Root Cell Wall Polysaccharides in Cultivar-Dependent Cadmium Accumulation in Brassica chinensis L. Ecotoxicol. Environ. Saf. 2020, 194, 110369. [Google Scholar] [CrossRef] [PubMed]
  48. van de Mortel, J.E.; Almar Villanueva, L.; Schat, H.; Kwekkeboom, J.; Coughlan, S.; Moerland, P.D.; Ver Loren van Themaat, E.; Koornneef, M.; Aarts, M.G.M. Large Expression Differences in Genes for Iron and Zinc Homeostasis, Stress Response, and Lignin Biosynthesis Distinguish Roots of Arabidopsis thaliana and the Related Metal Hyperaccumulator Thlaspi caerulescens. Plant Physiol. 2006, 142, 1127–1147. [Google Scholar] [CrossRef] [Green Version]
  49. Song, X.-Q.; Liu, L.-F.; Jiang, Y.-J.; Zhang, B.-C.; Gao, Y.-P.; Liu, X.-L.; Lin, Q.-S.; Ling, H.-Q.; Zhou, Y.-H. Disruption of Secondary Wall Cellulose Biosynthesis Alters Cadmium Translocation and Tolerance in Rice Plants. Mol. Plant 2013, 6, 768–780. [Google Scholar] [CrossRef] [PubMed] [Green Version]
  50. Vatehová, Z.; Malovíková, A.; Kollárová, K.; Kučerová, D.; Lišková, D. Impact of Cadmium Stress on Two Maize Hybrids. Plant Physiol. Biochem. 2016, 108, 90–98. [Google Scholar] [CrossRef] [PubMed]
  51. Peng, J.-S.; Wang, Y.-J.; Ding, G.; Ma, H.-L.; Zhang, Y.-J.; Gong, J.-M. A Pivotal Role of Cell Wall in Cadmium Accumulation in the Crassulaceae Hyperaccumulator Sedum Plumbizincicola. Mol. Plant 2017, 10, 771–774. [Google Scholar] [CrossRef] [Green Version]
  52. Pinto, E.; Sigaud-kutner, T.C.S.; Leitão, M.A.S.; Okamoto, O.K.; Morse, D.; Colepicolo, P. Heavy Metal–Induced Oxidative Stress in Algae1. J. Phycol. 2003, 39, 1008–1018. [Google Scholar] [CrossRef]
  53. Huihui, Z.; Xin, L.; Zisong, X.; Yue, W.; Zhiyuan, T.; Meijun, A.; Yuehui, Z.; Wenxu, Z.; Nan, X.; Guangyu, S. Toxic Effects of Heavy Metals Pb and Cd on Mulberry (Morus alba L.) Seedling Leaves: Photosynthetic Function and Reactive Oxygen Species (ROS) Metabolism Responses. Ecotoxicol. Environ. Saf. 2020, 195, 110469. [Google Scholar] [CrossRef] [PubMed]
  54. Sandalio, L.M.; Rodríguez-Serrano, M.; Gupta, D.K.; Archilla, A.; Romero-Puertas, M.C.; del Río, L.A. Reactive Oxygen Species and Nitric Oxide in Plants Under Cadmium Stress: From Toxicity to Signaling. In Environmental Adaptations and Stress Tolerance of Plants in the Era of Climate Change; Ahmad, P., Prasad, M.N.V., Eds.; Springer: New York, NY, USA, 2012; pp. 199–215. ISBN 978-1-4614-0815-4. [Google Scholar]
  55. Keunen, E.; Remans, T.; Bohler, S.; Vangronsveld, J.; Cuypers, A. Metal-Induced Oxidative Stress and Plant Mitochondria. Int. J. Mol. Sci. 2011, 12, 6894–6918. [Google Scholar] [CrossRef] [Green Version]
  56. Cosio, C.; Dunand, C. Specific Functions of Individual Class III Peroxidase Genes. J. Exp. Bot. 2009, 60, 391–408. [Google Scholar] [CrossRef]
  57. Vanholme, R.; Demedts, B.; Morreel, K.; Ralph, J.; Boerjan, W. Lignin Biosynthesis and Structure. Plant Physiol. 2010, 153, 895–905. [Google Scholar] [CrossRef] [Green Version]
  58. Luo, H.; Li, H.; Zhang, X.; Fu, J. Antioxidant Responses and Gene Expression in Perennial Ryegrass (Lolium perenne L.) under Cadmium Stress. Ecotoxicology 2011, 20, 770–778. [Google Scholar] [CrossRef]
  59. Kosar, F.; Akram, N.A.; Sadiq, M.; Al-Qurainy, F.; Ashraf, M. Trehalose: A Key Organic Osmolyte Effectively Involved in Plant Abiotic Stress Tolerance. J. Plant Growth Regul. 2019, 38, 606–618. [Google Scholar] [CrossRef]
  60. Duman, F.; Aksoy, A.; Aydin, Z.; Temizgul, R. Effects of Exogenous Glycinebetaine and Trehalose on Cadmium Accumulation and Biological Responses of an Aquatic Plant (Lemna gibba L.). Water Air Soil Pollut. 2011, 217, 545–556. [Google Scholar] [CrossRef]
  61. Wingler, A. Transitioning to the Next Phase: The Role of Sugar Signaling throughout the Plant Life Cycle. Plant Physiol. 2018, 176, 1075–1084. [Google Scholar] [CrossRef] [PubMed] [Green Version]
  62. Wang, K.; Li, F.; Gao, M.; Huang, Y.; Song, Z. Mechanisms of Trehalose-Mediated Mitigation of Cd Toxicity in Rice Seedlings. J. Clean. Prod. 2020, 267, 121982. [Google Scholar] [CrossRef]
  63. Meng, H.; Hua, S.; Shamsi, I.H.; Jilani, G.; Li, Y.; Jiang, L. Cadmium-Induced Stress on the Seed Germination and Seedling Growth of Brassica napus L., and Its Alleviation through Exogenous Plant Growth Regulators. Plant Growth Regul. 2009, 58, 47–59. [Google Scholar] [CrossRef]
  64. Kınay, A. Effects of Cadmium on Nicotine, Reducing Sugars and Phenolic Contents of Basma Tobacco Variety. Fresenius Environ. Bull. 2018, 27, 9195–9202. [Google Scholar]
  65. Rahoui, S.; Chaoui, A.; El Ferjani, E. Membrane Damage and Solute Leakage from Germinating Pea Seed under Cadmium Stress. J. Hazard. Mater. 2010, 178, 1128–1131. [Google Scholar] [CrossRef] [PubMed]
  66. Tauzin, A.S.; Giardina, T. Sucrose and Invertases, a Part of the Plant Defense Response to the Biotic Stresses. Front. Plant Sci. 2014, 5, 293. [Google Scholar] [CrossRef] [PubMed]
  67. Verma, S.; Dubey, R.S. Effect of Cadmium on Soluble Sugars and Enzymes of Their Metabolism in Rice. Biol. Plant. 2001, 44, 117–123. [Google Scholar] [CrossRef]
Figure 1. The Cd accumulation, distribution in Kentucky bluegrass, and the effect of it on growth in leaves and roots of M and R genotypes. (A) The Cd concentration in the leaves and roots in M and R genotypes after 28 d of Cd treatment. (B) Partitioning factor of Cd in M and R genotypes. (C) The effect of Cd on the length of leaves and roots. (D) The effect of Cd on the fresh weight of leaves and roots. The significant differences of Cd concentration were based on Student’s t-test. * p < 0.05, ** p < 0.01. The significant differences between M and R genotype were based on one-way ANOVA. The different letters indicate that the difference is significant at a 0.05 level. Data were showed by “means ± SE”. CK and Cd represent treatments of 0 and 1000 μM Cd, respectively.
Agronomy 11 02358 g001
Figure 2. Effects of Cd stress on POD (A,B), SOD (C,D), CAT (E,F), APX (G,H) activity, and soluble protein content (I,J) in leaves and roots of M and R genotypes. The significant differences between the M and R genotypes were based on one-way ANOVA. The different letters indicate that the difference is significant at a 0.05 level. Data were shown by “means ± SE”. CK and Cd represent treatments of 0 and 1000 μM Cd, respectively.
Agronomy 11 02358 g002aAgronomy 11 02358 g002b
Figure 3. Effects of Cd stress on MDA (A), H2O2 (B), and O2 (C) content in the leaves and roots of M and R genotypes. The significant differences between M and R genotype were based on one-way ANOVA. The different letters indicate that the difference is significant at a 0.05 level. Data were shown by “means ± SE”. CK and Cd represent treatments of 0 and 1000 μM Cd, respectively.
Agronomy 11 02358 g003
Figure 4. Effects of Cd stress on trehalose (A), fructose (B), glucose (C), sucrose (D), soluble sugar (E), and reducing sugar (F) content in the leaves and roots of the M and R genotypes. The significant differences between M and R genotype were based on one-way ANOVA. The different letters indicate that the difference is significant at a 0.05 level. Data were shown by “means ± SE”. CK and Cd represent treatments of 0 and 1000 μM Cd, respectively.
Agronomy 11 02358 g004
Figure 5. Effects of Cd stress on pectin (A), lignin (B), and cellulose (C) in the leaves and roots of the M and R genotypes. The significant differences between the M and R genotypes were based on one-way ANOVA. The different letters indicate that the difference is significant at a 0.05 level. Data were shown by “means ± SE”. CK and Cd represent treatments of 0 and 1000 μM Cd, respectively.
Agronomy 11 02358 g005
Figure 6. Hypothetical model of the events occurring in the Kentucky bluegrass under cadmium stress.
Agronomy 11 02358 g006
Publisher’s Note: MDPI stays neutral with regard to jurisdictional claims in published maps and institutional affiliations.

