Article

Epiphytic Microbial Community and Post-Harvest Characteristics of Strawberry Fruits as Affected by Plant Nutritional Regime with Silicon

1
Faculty of Science and Technology, Free University of Bozen-Bolzano, I-39100 Bolzano, Italy
2
Competence Centre for Plant Health, Free University of Bozen-Bolzano, I-39100 Bolzano, Italy
3
Department for Sustainable Food Process, Università Cattolica del Sacro Cuore, I-29122 Piacenza, Italy
*
Author to whom correspondence should be addressed.
Submission received: 7 September 2021 / Revised: 4 November 2021 / Accepted: 9 November 2021 / Published: 26 November 2021

Abstract

:
Despite being not essential to plants, Silicon (Si) has proven to have promoting effects on plants growth, yield, and resistance against biotic and abiotic stressors. The increase of concentration in specific minerals in plant tissues can also improve shelf-life, which, in fruits like strawberries, is also affected by the epiphytic microbial community. The present research was carried out to assess whether Si biofortification of strawberry plants, grown in soilless system, could affect plants yield and post-harvest feature of fruits during the storage period, carried out at three different temperatures (i.e., 1, 4 and 10 °C) for 7 and 14 days. Furthermore, we investigated whether the plant nutritional regime, specifically the Si fertilization, can impact the composition of microbial community. Our results showed that biofortification did not significantly affect fruits firmness, whereas, at the highest Si levels, an increase in titratable acidity was observed. The microbial community analysis highlighted for the first time the presence of probiotic bacteria, as Bacillus breve, which could present interesting technological features as strains adapted to the strawberry fruit-sphere. In addition, with the increasing levels of Si biofortification, the depletion of potentially pathogenic microorganisms, like Escherichia coli and Terrisporobacter glycolicus, was also observed. In conclusion, data here reported highlight for the first time the possible role played by the nutritional regimes of strawberry plants in shaping composition of the fruit epiphytic microbial community.

1. Introduction

Mineral malnutrition, also known as ‘hidden hunger’, is a phenomenon affecting two-thirds of the world’s population, both in industrialized and developing countries and having strong impact on people’s health [1,2,3,4]. Considering that food, mainly the plant-derived one, represents the predominant source of minerals, the enrichment of agricultural products with health-promoting compounds (e.g., vitamins, antioxidants) has been envisaged as a suitable strategy to counteract undernourishment or to deal with specific nutritional requirements [5]. In the case of fruits and vegetables that are consumed fresh, the increase in the content of useful compounds can be achieved either by improving genotypes, through breeding programs or by implementing specific agronomic techniques, i.e., biofortification [6,7] In particular, agronomic biofortification is obtained by supplying plants, generally grown in soilless cultivation systems (e.g., hydroponics), with specific mineral fertilizers, aimed at increasing the concentration of the target nutrient in the edible organs [8].
Increasing evidence gathered in the last decades demonstrates that, among other micronutrients, silicon (Si) can play a fundamental role in promoting human health, being involved in bone formation and in facilitating bone mineralization [9]. Despite being the second most abundant element in soil [10], ranging between 0.09 and 23.4 mg kg–1 [11], Si is not essential to plants [12]. Silicon is taken up by plants’ roots in the form of monosilicic acid through channels belonging to the family of aquaporins, suggesting that leaf transpiration might play a predominant role in the acquisition of the metalloid [13]. Once acquired, Si is translocated through xylem vessels towards the shoots, where it is concentrated, polymerized to silica (SiO2) and stored as deposits along cell walls, in lumen and intercellular spaces [14,15]. Although plants do not require Si to complete their life cycle [12], the inclusion of Si in fertilization programs has shown positive effects on crops, thereby improving the tolerance to biotic and abiotic stressors, enhancing crops yield, and having synergistic effects on the absorption of other mineral elements [12,14,16,17]. In this context, several studies have been carried out with the aim of increasing the concentration of Si in the edible organs of plants [18], demonstrating that leafy vegetables [19,20], green bean [21] and strawberry [22] can be good targets for Si fortification. Interestingly, in this latter case, the authors observed that, beside reaching a Si concentration of 85 g kg−1 DW in the fruit, the biofortification approach led to a differential modulation of the bioactive compounds respect to control strawberries, namely a decrease in the content of phenolics and an increase in flavonoids [22]. In addition, different experiences have demonstrated that biofortification approaches with mineral nutrients can also contribute improving the shelf-life of agricultural products. For instance, the increased concentration of calcium (Ca) was shown to delay ripening and softening of fruit through different mechanisms, like reducing fruit respiration rate and ethylene production [23], increasing cell wall integrity through the formation of cross-links with pectins [24] and reducing transpiration [25], which is directly connected to the loss of turgor and hence fruit softening. In addition, extra virgin olive oil obtained from selenium (Se) fortified olives was shown to feature a longer shelf life ascribable to the improved oxidative stability against redox processes [26]. These aspects might be particularly relevant (i) when the objective is represented by modulation of foods nutraceutical properties and (ii) when an extension of the shelf-life is desired.
Strawberries are popular berry fruits consumed worldwide either fresh or in processed form [27]. They are considered very valuable fruits not only for their sensory characteristics, but also for their potential benefit to human health, being particularly rich in antioxidant compounds, like vitamin C, anthocyanin, phenolic compounds and flavonoids [28]. However, strawberry fruits are characterized by a very limited postharvest life due to the high metabolic rates, which induce quick dehydration, loss of firmness, tissue and colour degradation, and susceptibility to mechanical injuries [29,30,31]. These issues can cause economic losses in fruits production, and, for this reason, the industry is continuously looking for treatments that might prolong the shelf-life of strawberries. Up to present, the post-harvest practices aimed at extending strawberries’ shelf-life include either physical (e.g., high and low temperatures, irradiation and use of modified or controlled atmosphere) or chemical (e.g., fumigation, calcium dips, coating, ozone, agrochemicals) treatments [32]. Nevertheless, to the best of our knowledge, the influence of a biofortification approach on the post-harvest life in strawberry fruits has never been investigated yet.
While vast information is available about the rhizosphere microbial ecology of strawberries, the microbiota of fruits has been investigated in a few studies. Jensen et al. [33] compared organic and traditional cultivations, and found a complex community comprising filamentous fungi, several bacteria, including human and plant pathogens, and biocontrol strains, with some marked differences due to the cropping system. A number of studies identified modulation of the strawberry microbiota in response to the application of biocontrol agents [34] and chemical sanitizers [35]. However, to the best of our knowledge, no studies were conducted to assess the impact of biofortifiers such as Si on strawberries grown under hydroponic conditions. However, recent pieces of evidence highlighted that in leaves different mineral contents, determined by differential fertilization strategies, induce alteration in the structure of microbial community of the phyllosphere, as in the case of spinach and rocket [36].
Considering the experience by Valentinuzzi et al. [22] that demonstrated an increase in the Si content and a modulation in the antioxidant compounds at fruit level, the aim of the present research work was to assess whether a Si biofortification program implemented in Fragaria x ananassa plants grown hydroponically might affect the post-harvest life span of these fruits. To this objective, strawberry plants were grown until production stage in controlled conditions and supplemented with increasing concentration of Si in the standard nutrient solution. The strawberries were then assessed for their quality parameters (i.e., titratable acidity, firmness, Brix and sweetness index) and, afterwards, post-harvest storage was simulated using different storage temperatures and time intervals. In addition, strawberry fruits were also assessed for the composition of the epiphytic microbial community to investigate whether the nutritional regime imposed to the plant, and in the specific case the Si biofortification program, might have affected it.

2. Materials and Methods

2.1. Plant Material and Growing Conditions

The experiment was carried out using Strawberry frigo-plants (Fragaria x ananassa cv. Elsanta), grown in a hydroponic system containing the following nutrient solutions: KH2PO4 (0.25 mM), Ca(NO3)2 (5 mM), MgSO4 (1.25 mM), K2SO4 (1.75 mM), KCl (0.25 mM), FeIII- EDTA (20 μM), H3BO4 (25 μM), MnSO4 (1,5 μM), ZnSO4 (1.5 μM), CuSO4 (0.5 μM) and (NH4)6Mo7O24 (0.025 μM). The solutions were prepared with distilled water at 5.5 μS m–1 [all nutrients lower than the limit of quantification (LOQ)]. Frigo-plants were purchased from Sant’Orsola, a Farmers Cooperative Society in Pergine Valsugana, Trento, Italy. Plants were carefully washed with distilled water before being used for the experiment. Each strawberry plant was transferred to a 1.5 L pot filled with the above-described nutrient solution; the solutions were replaced twice a week and continuously aerated. Plants were grown in a climatic chamber under controlled conditions (14 h, 24 °C, 70% RH during the light phase; 10 h, 19 °C, 70% RH during the dark phase) for 16 weeks. Plants were grown either in a full nutrient solution (control), a nutrient solution supplied with 50 mg L−1 silicon (Si), a nutrient solution supplied with 100 mg L−1, a nutrient solution supplied with 200 mg L−1 Si as Na2SiO3 as described by Valentinuzzi et al. [22]. Starting from the day 48, at least five mature fruits (commercial maturation once the fruit surface showed a red coloration of at least 80%) per plant were collected using sterile gloves and stored in autoclaved falcon tubes. At harvest, roots and shoots were separated and the fresh weight (FW) and the dry weight (DW) of both shoots and roots were measured. The yield per plant (g FW/plant), the average number of fruits per plant (n°/plant) and the average yield (g FW) were also assessed.

2.2. Shelf-Life Assessment

Qualitative analyses were carried out to assess the effect of the different treatments on fruit shelf-life at harvest (time 0) and after 7 and 14 days of storage at 1 °C, 4 °C and 10 °C. Shelf life was assessed by measuring firmness, total soluble solids, titratable acidity and sweetness index. The firmness of strawberry fruits was measured with a penetrometer (model PCE-FM200; PCE Instruments, Southampton, UK) equipped with a cylindrical probe having a diameter of 3 mm and expressed as kilograms. The total soluble solid (TSS) content was assessed using a digital refractometer (Atago, Tokyo, Japan) on freshly extracted fruit juice. The results were expressed in degrees Brix (Brix). The titratable acidity (TA) was measured by adding 25 mL of distilled water to 5 mL fresh extracted fruit juice. The mixture was then automatically titrated (Schott instrument, Titration Unit Titro- Line easy) to a pH value of 8.1 with a solution of 0.1 M NaOH. The results are expressed as g L−1 citric acid. Sweetness index was calculated as the ratio between TSS and titratable acidity.

2.3. Microbiological Analyses

Strawberries fruits from the last samplings were aseptically sampled, stored in sterile Falcon tubes until analyses. From each replicate, 10 g of strawberries were taken, mixed with 100 mL of saline/peptone-water (8 g/L NaCl, 1 g/L bacteriological peptone; Oxoid Italia, Milan, Italy) using a Stomacher apparatus (400 Circulator, International PBI, Milan, Italy) at 260 rpm for 1.5 min. DNA was then extracted with the Fast DNA Spin Kit for Soil (MpBio, Santa Ana, CA, USA) according to the manufacturer protocol, and quantified using the Quant-iTTM HS ds-DNA assay kit (Invitrogen, Paisley, UK) using a Qubit fluorometer. DNA quality was also checked by loading 2 μL of each extract on a 0.8% electrophoresis gel.
Bacterial diversity was then investigated by PCR amplification and Illumina HTS of the V3-V4 region of the 16S rRNA as previously detailed [37,38]. In brief, 0.1 ng of DNA template were amplified with the primer pairs 343F (5′-TACGGRRAGGCAGCAG-3′) and 802E (5′-TACNVGGGGTWTCTAATCC-3′) in 25 μL reactions containing 12.5 μL of Phusion Master Mix, 0.5 μM of each primer and PCR grade water. Samples were tagged with a 9 nucleic acid base extension at the 5′ end of the forward primer, and a double step PCR was employed, with a first step of 20 cycles used untagged primer, and a second step of 10 cycled with tagged forward primers and 1 μL of product of the first cycle as template. In both steps the following cycling conditions were applied 5 min at 94 °C of initial template denaturation and polymerase activation, 30″ of denaturation (94 °C), 30″ of primers annealing (50 °C) and 30″ of primers elongation (72 °C), followed by a final elongation step (72 °C) of 10 min.
PCR products of each sample were pooled in equimolar amounts and purified by means of the solid phase reverse immobilization (SPRI) method of the Agencourt AMPure XP kit (Beckman Coulter, Milano, Italy). Sequencing of the purified PCR products pool was performed by Fasteris SA (Geneva, Switzerland) with the TruSeq DNA sample preparation kit and the MiSeq Illumina instrument (Illumina Inc., San Diego, CA, USA) generating 300 bp paired-end reads.
High-throughput sequencing data filtering, multiplexing, and preparation for subsequent statistical analyses were carried out as previously detailed [38]. Paired reads were assembled to reconstruct the full V3-V4 amplicons using the FLASH assembler [39], and samples were demultiplexed according to their tag using SeqKit [40]. Further screenings were carried out with Mothur [41] in order to remove sequences with large homopolymers (≥10), sequences that did not align within the targeted V3-V4 region, chimeric sequences, and sequences not classified as bacterial. Sequence data were submitted to the National Centre for Biotechnology Information Sequence Read Archive (BioProject number being assigned).
Filtered high-quality sequences were analysed with Mothur and R following two main approaches: The operational taxonomic unit (OTU) and the taxonomy-based approach. For the OTU approach, sequences were first aligned against the SILVA reference aligned database for bacteria using the NAST algorithm and a kmer approach, and then clustered at the 3% distance using the average linkage algorithm [42,43]. OTUs having a sum of their abundances across all samples less than 0.1% of the total were grouped into a single “rare OTUs” group. For the taxonomy based analyses, sequences were classified into taxa using an amended version of the Greengenes database [44].

2.4. Statistical Analyses

The results of shelf-life analyses are reported as mean ± standard error (SE) of six independent biological replicates, while for microbiological analyses, three independent biological replicates were employed. The significance of differences among means was calculated by one-way ANOVA with post hoc Tukey honestly significant difference (HSD) with a = 0.05 using R software (version 3.6.0). The following R packages were used for data visualization and statistical analyses: Ggplot2 v.3.2.0 [45], Agricolae v.1.3-1 [46], and ggfortify [47].
Statistical analyses on OTU and taxonomy matrixes were performed in Mothur and R and included hierarchical clustering with the average linkage algorithm at different taxonomic levels, Principal component analysis (PCA) to assess the unconstrained samples grouping, Canonical correspondence analyses (CCA) to assess the significance of different treatments on the analysed diversity. Metastats was applied to identify features that were significantly different between treatments [48].

3. Results

3.1. Plants Growth and Yield Parameters
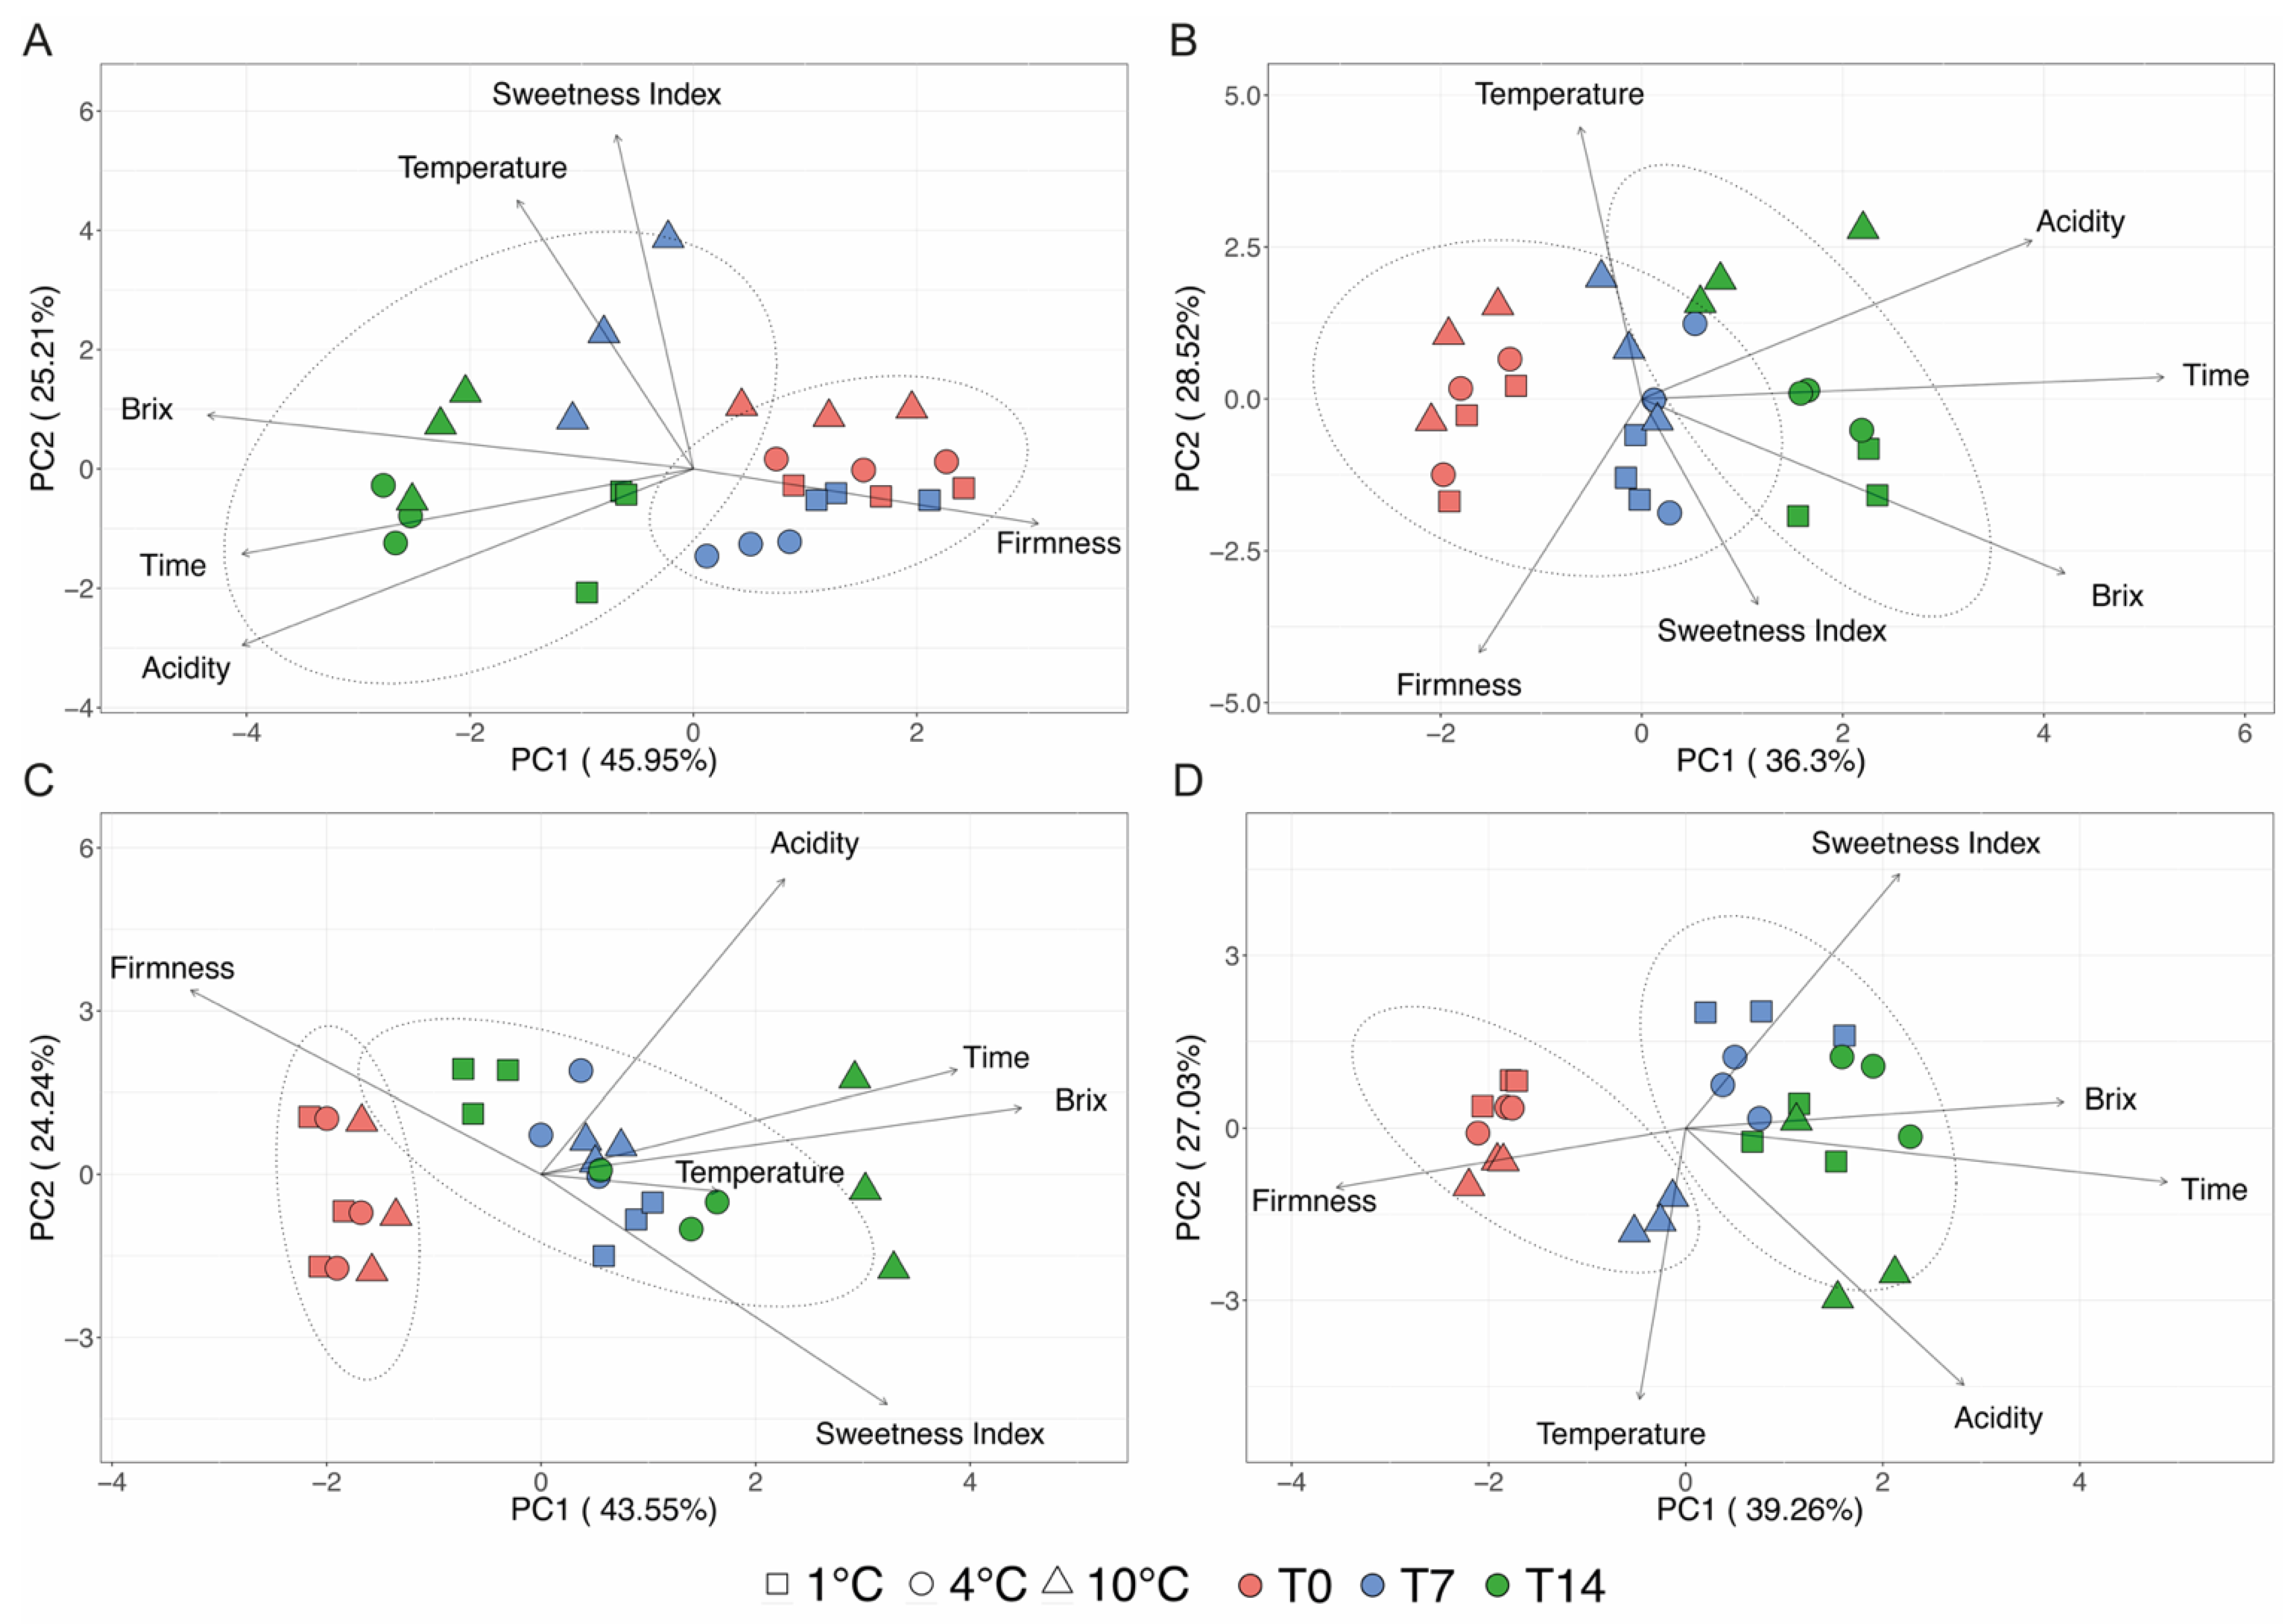
At harvest, the growth and yield parameters of strawberry plants subjected to different Si biofortification levels have been assessed. As shown in Table 1, both shoot and root fresh biomass decreased significantly as compared to control plants, possibly suggesting a toxic effect of Si biofortification; on the other hand, the leaf area and the number of flowers developed by each single plant did not show any significant alteration with respect to control (Table 1). Despite being the number of flowers not affected by Si supplementation, the average number of berries produced by each plant show a gradual decrease with the increasing Si concentration. In particular, plants treated with both 50 and 100 mg L−1 Si did not display a significant berries number reduction as compared to control plants. On the contrary, the number of berries produced by 200 mg L−1 Si supplemented plants was reduced by about 24 and 17% as compared to control and 50 mg L−1 Si treated plants, respectively (Table 1). As far as the average yield per plant is concerned, data showed that 50 mg L−1 Si treated plants did not show a significant difference with respect to control plants, whereas the yield decreased significantly in plants treated with the higher concentration of Si (i.e., 100 and 200 mg L−1). Interestingly, when considering the average weight of a single strawberry fruit, plants treated with 100 mg L−1 Si gave the highest values were obtained in plants, albeit they were totally comparable to those obtained in control plants. On the other hand, the smallest fruits were produced by 200 mg L−1 Si treated plants, whereas those supplemented with 50 mg L−1 Si showed intermediate weight values, which were not significantly different from control samples (Table 1).

3.2. Post-Harvest

With the aim of assessing whether the fertilization treatments (i.e., Si supplementation) might affect the characteristic of strawberry fruits during the post-harvest storage, different parameters, namely firmness, titratable acidity, total soluble solids (Brix) and the sweetness index, were evaluated over a period of 14 days in berries maintained at 1, 4 and 10 °C, in the dark. The determination of the above-mentioned parameters has been carried out at harvest (T0), at 7 (T7) and at 14 (T14) days of post-harvest storage; the complete dataset is reported in Supplementary Figures S1–S4.
To better understand the influence of Si concentrations, storage time and temperature, on the strawberry fruit quality parameters, multivariate statistical analyses (i.e., Principal Components Analysis—PCA) have been carried out. The PCA of the control dataset generated a three components model accounting for 84.62% of the total variance and the scatterplot obtained by combining Principal Component 1 (PC1) and PC2 explained 71.16% of the dataset variance (Figure 1A). As shown by Figure 1A, the samples were mainly separated along PC1, forming two independent clusters (PERMANOVA test p < 0.001), one encompassing T14 samples, independently from the storage temperature, and T7 samples stored at 10 °C, whilst the second cluster included T0 and the remaining T7 samples (Figure 1A). According to the loadings, the separation along PC1 was mainly driven by the firmness in the positive direction and Brix and titratable acidity in the negative one. When the dataset of strawberry fruits was treated with 50 mg L−1 Si, a five components model was obtained, accounting for 98.56% of the total variance. The scatterplot generated by combining PC1 and PC2 (about 65% of the total variance) showed the separation of samples in two independent clusters (PERMANOVA test p < 0.001) along the PC1, mainly driven by the samples’ acidity, Brix and the storage period (Figure 1B). Indeed, samples stored for 14 days, independently from the storage temperature, showed a higher acidity and total soluble solids content as compared to T0 and T7 samples (Supplementary Figure S1). Similarly, the PCA applied to the 100 and 200 mg L−1 Si treated plants generated scatterplots explaining 67.8 and 66.3% of the total variance, respectively, and showing a separation of the samples along the PC1. In both models, samples were separated into two independent clusters (PERMANOVA test p < 0.001and p < 0.001, respectively), one encompassing the T0 samples, irrespective from the storage temperature, whist the other including T7 and T14 samples (Figure 1C,D). Also, in these two models, the separation is mainly driven by the Brix, beside time, ad to a lower extent by acidity and sweetness index (Figure 1C,D). These results further demonstrated that the post-harvest storage induced an increase in the total soluble solids concentration in strawberries as compared to T0 fruits (Supplementary Figure S2).

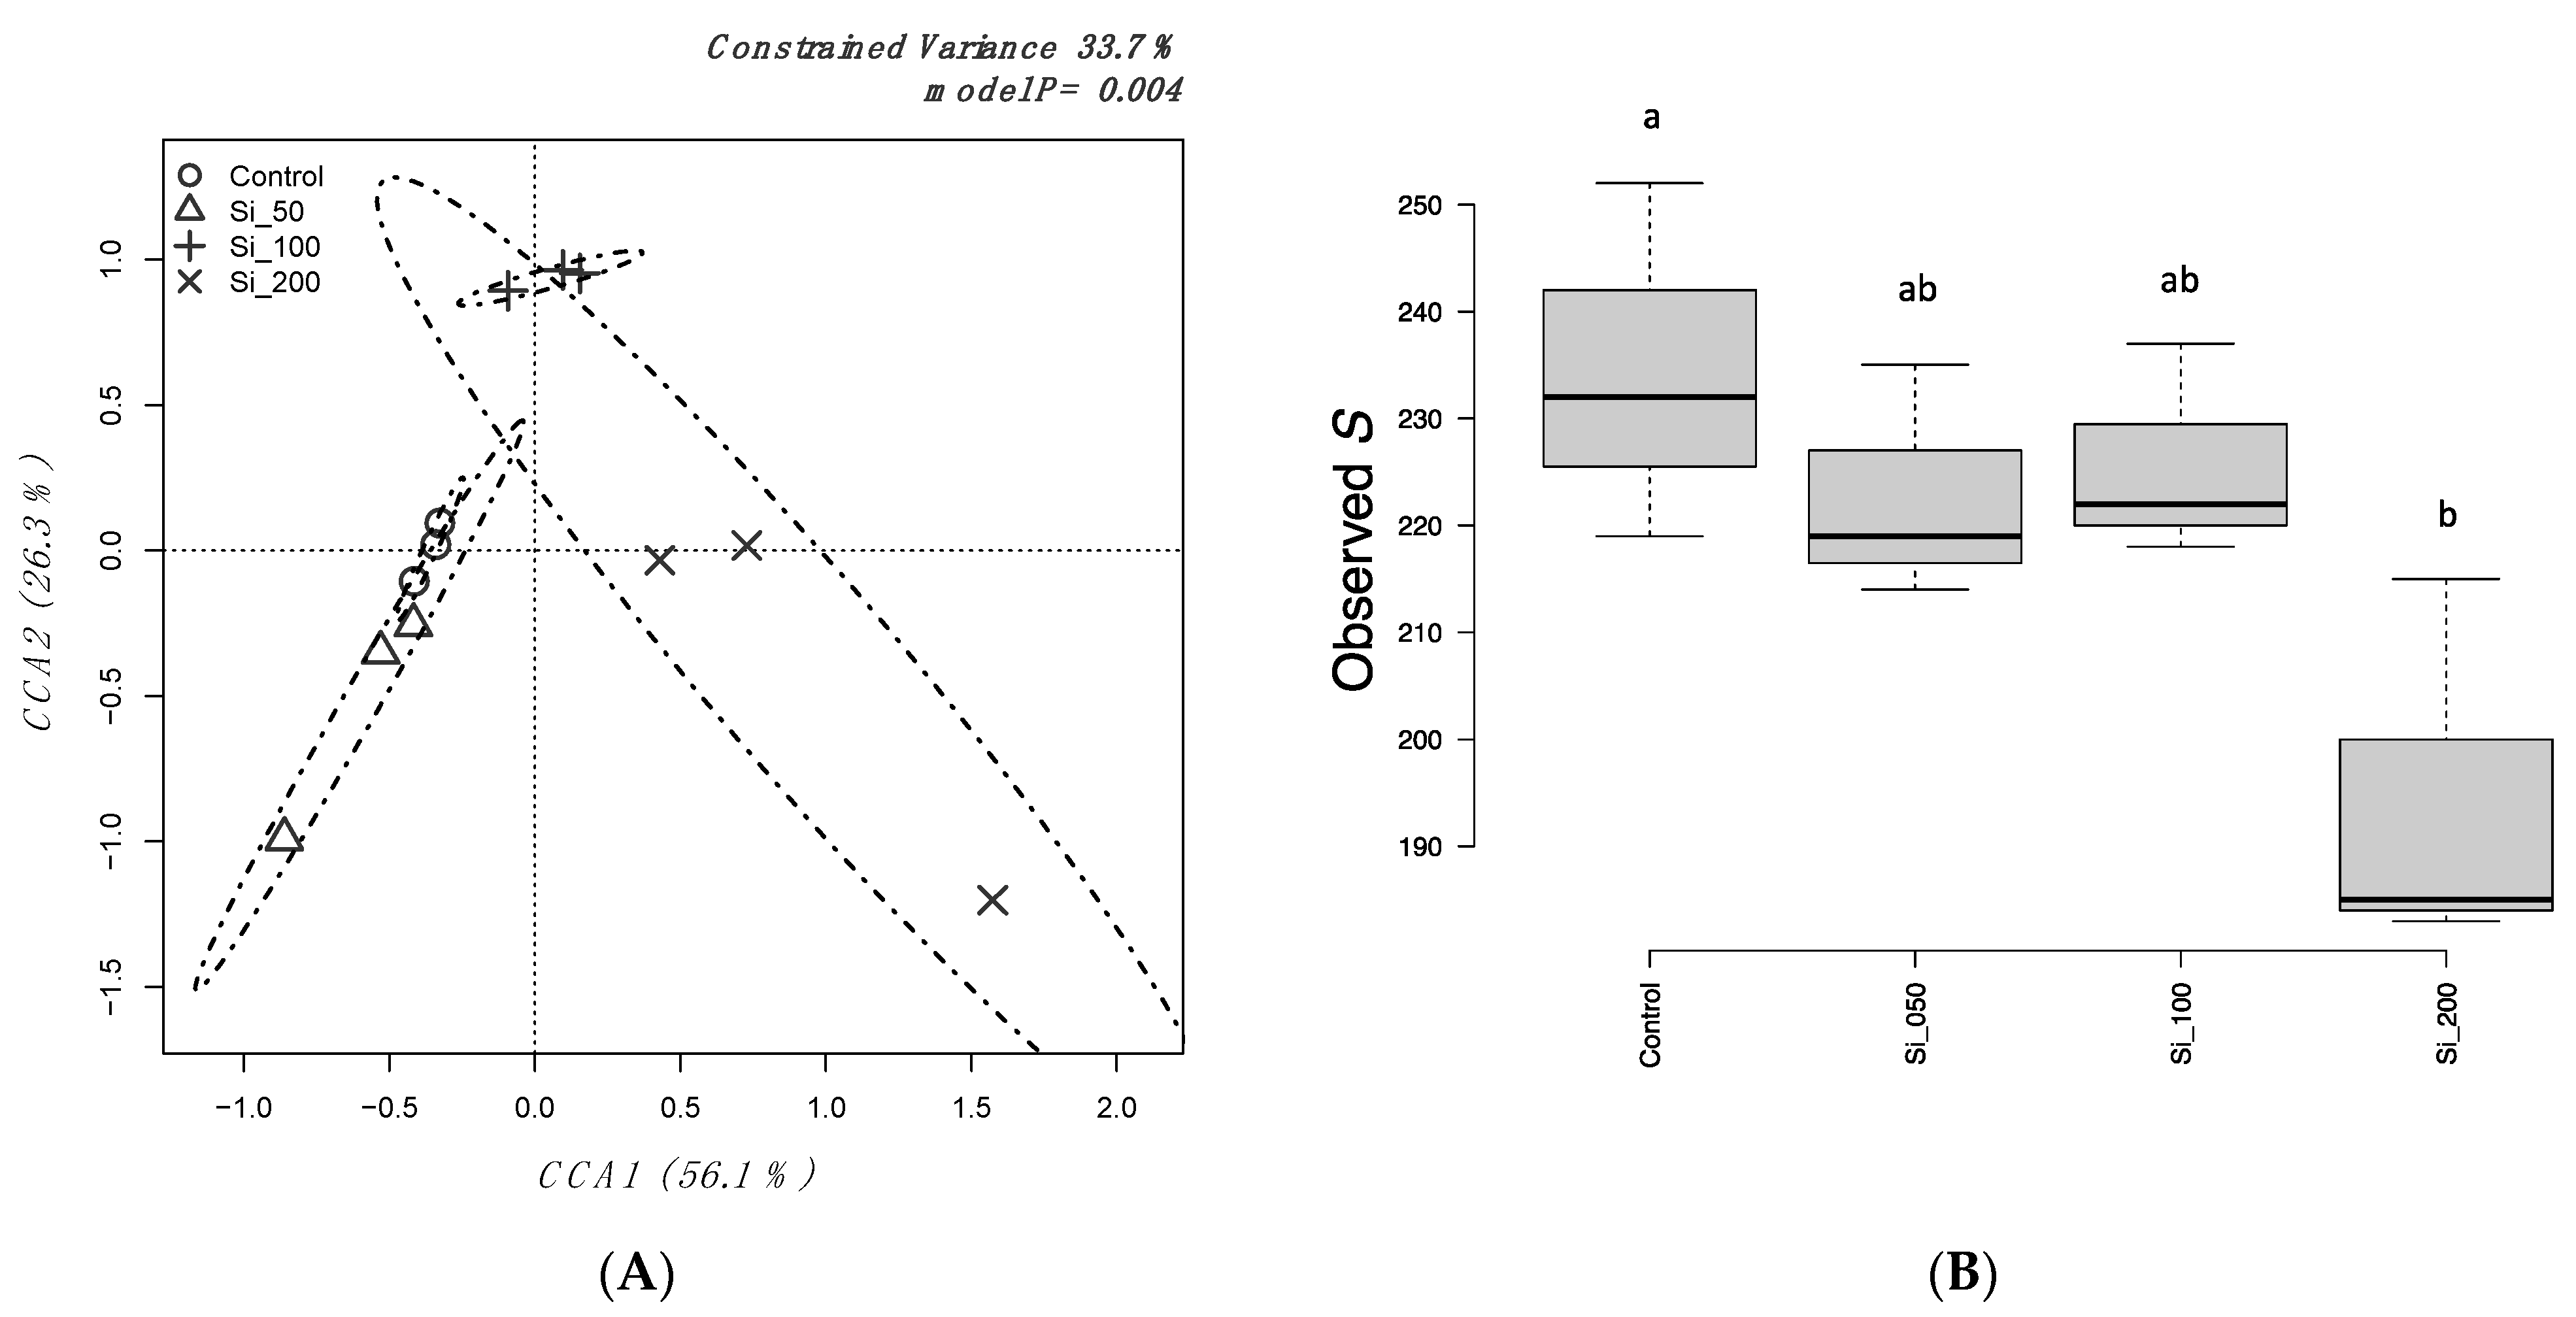
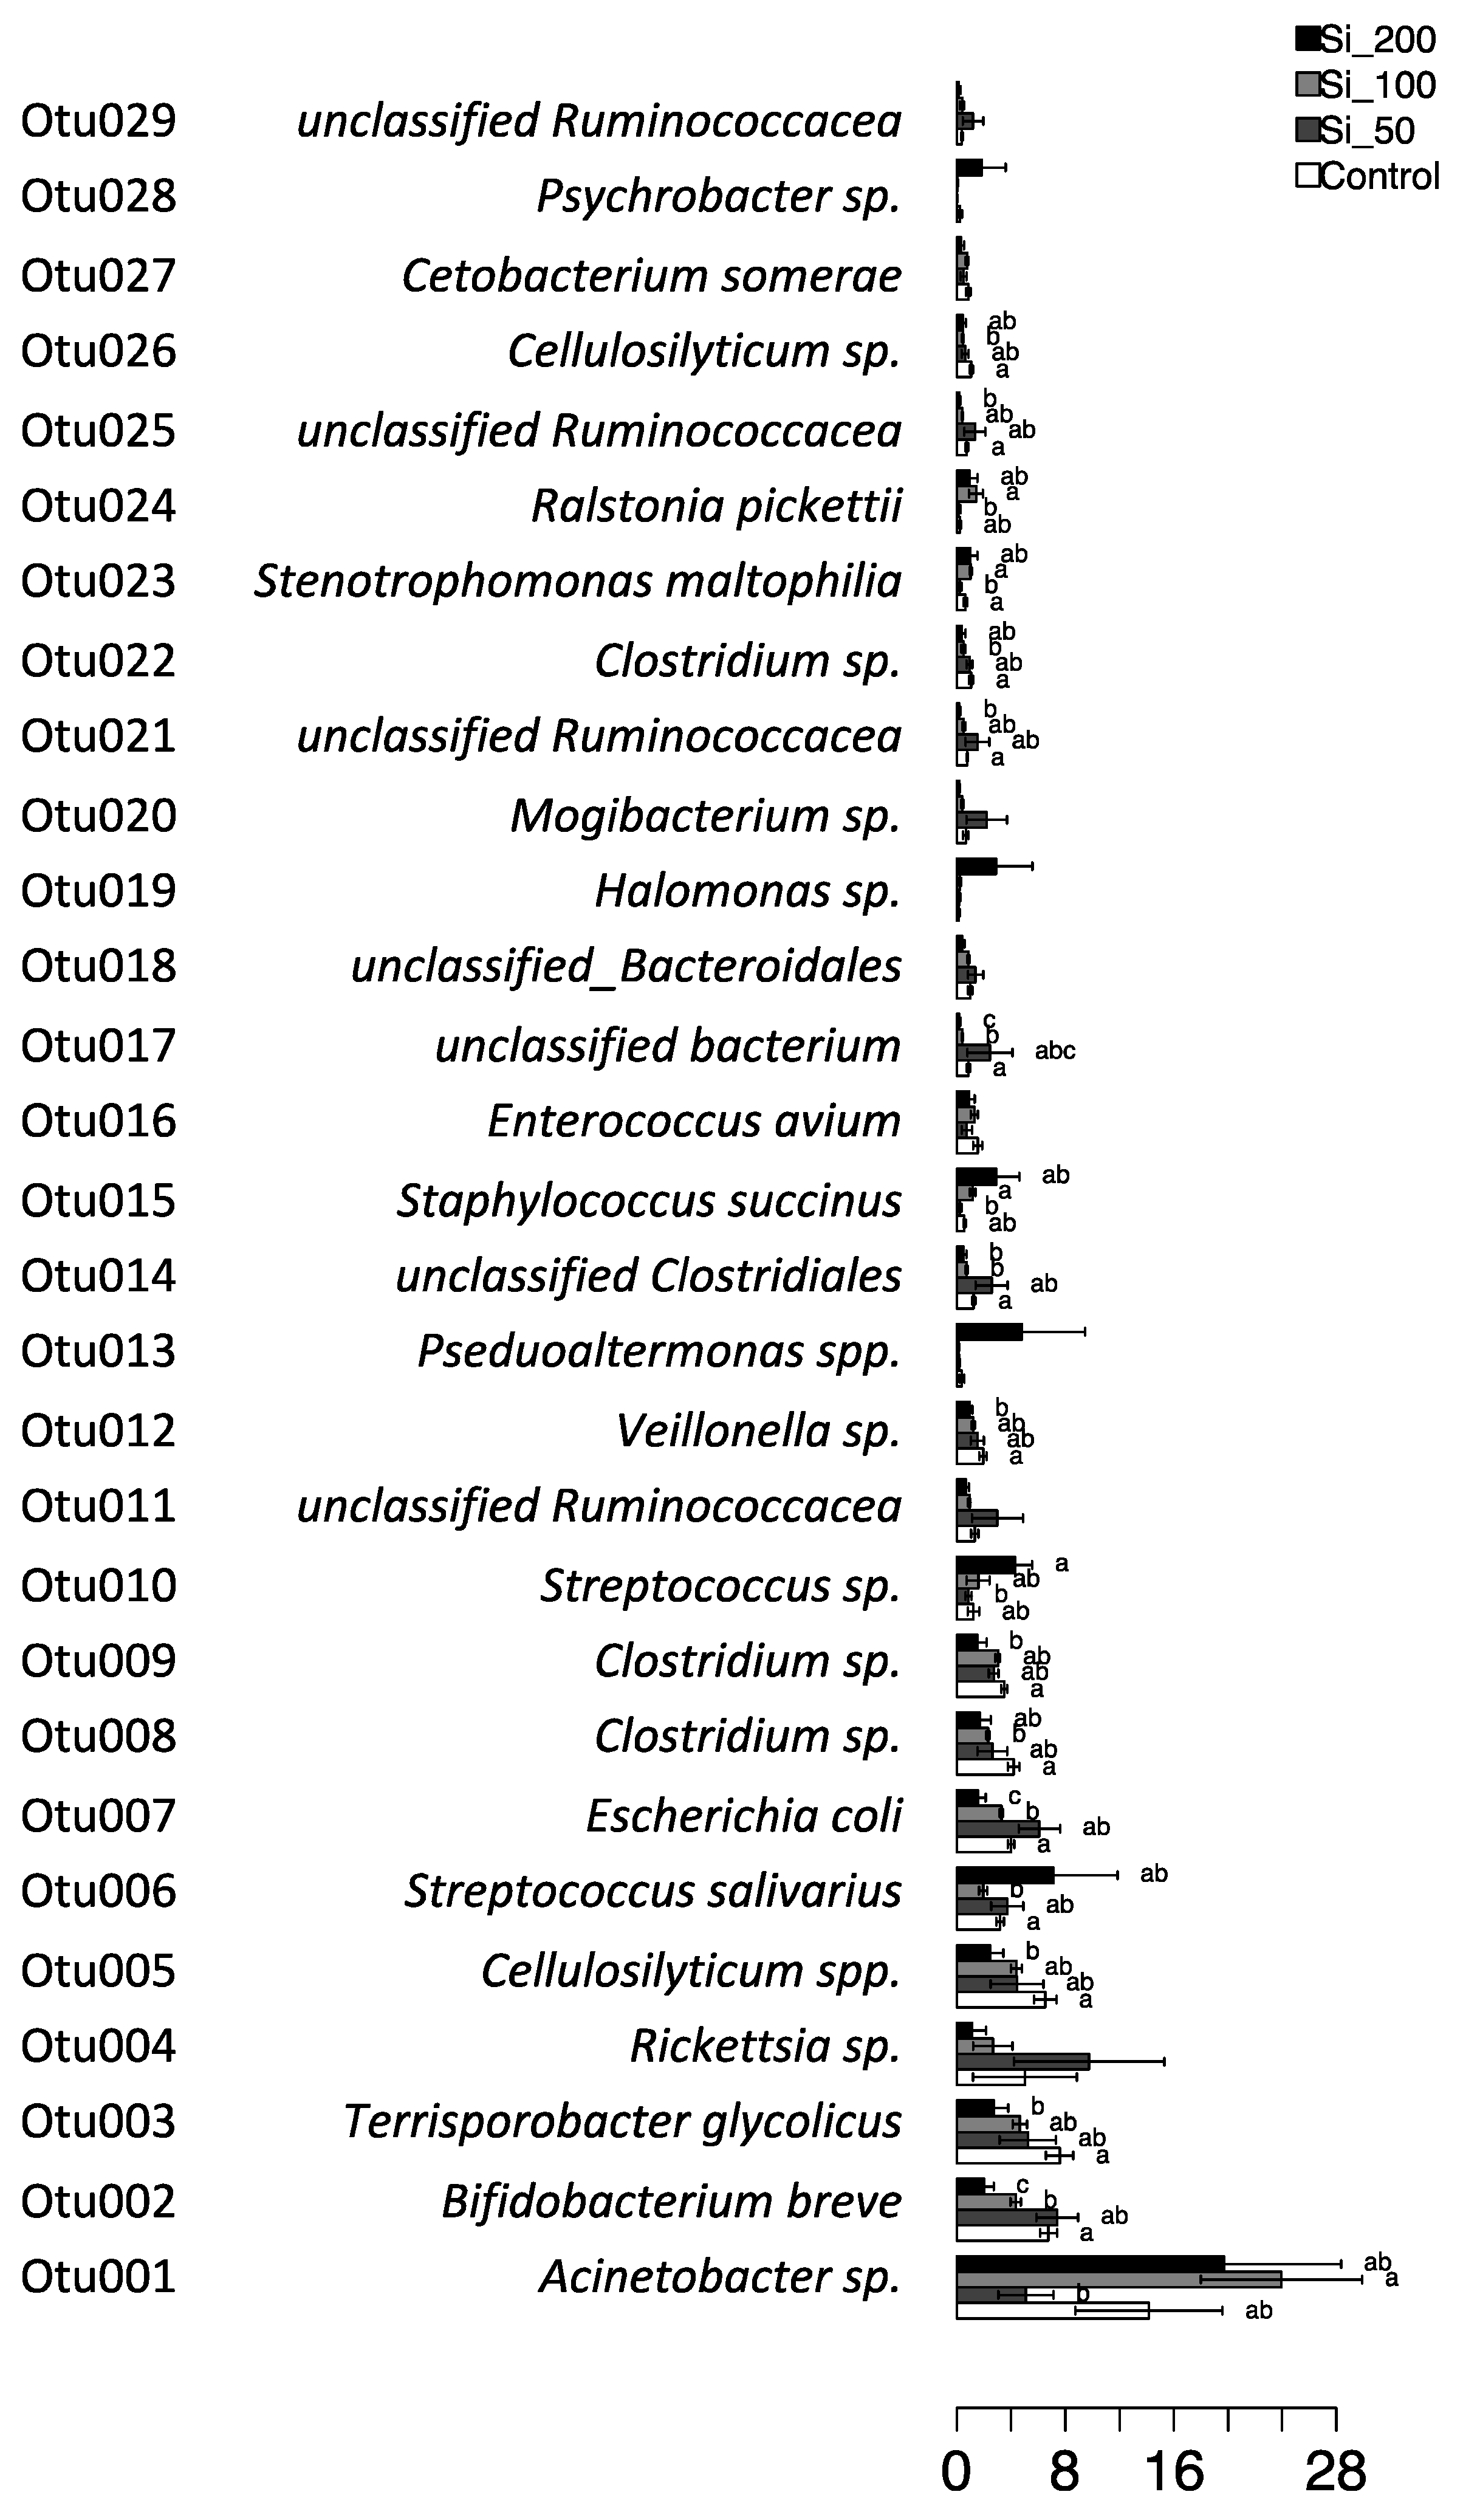
3.3. Bacterial Diversity of Harvested Strawberries

The bacterial diversity of harvested strawberries was investigated by Illumina HTS of 16S amplicons of the V3-V4 regions. After demultiplexing and quality filtering a total of 166,027 sequences were obtained, downscaled to 1920 sequences per each of the 12 analysed samples to avoid biased related to the analyses of uneven samples size. The average Good’s coverage obtained was 95.0%, thus indicating that even with the downscaling most of the existing bacterial diversity was analysed.
A canonical correspondence analysis model (CCA) was applied to test if there were significant differences due to Si supplementation at OTUs level (Figure 2A. The model was significant (p = 0.004), with a high proportion of variance explained (33.7%). Samples were indeed grouped separately according to the dose of Si applied. Interestingly, samples at the lower dose Si50 were partly overlapping with the control, while the two higher doses Si 100 mg L−1 and Si 200 mg L−1 were separated in a dose-dependent manner. This diversity in the total structure of bacterial communities was also reflected by α-diversity analyses on the total number of observed OTUs: a dose-dependent decrease in diversity was observed, with a significant difference from the control merging for the highest dose Si 200 mg L−1 (Figure 2B).
The outcomes were also explored at the taxonomical level, with a cluster analysis of sequences classified at the genus level (Figure S5). In agreement with the CCA and observed S analyses, it was found that control samples are partly overlapped with the samples that received the lower dose of Silicon (Si50), while two other doses are more differentiated. Among the observed genera, Acinetobacter was the most represented, followed by Rickettsia, Clostridium, Streptococcus and Bifidobacterium.
The most abundant OTUs were then classified by Blast against the RDP database, to reach the highest possible taxonomical assignment (i.e., when possible, at the species level). A Metastats model was then applied to identify which of them were significantly different among treatments. Results are reported in Figure 3, where taxa having different significant trends were identified: Bifidobacterium breve, Terrisporobacter glycolicus, Cellulosolyticum spp. and Escherichia coli were inhibited by the Si treatment, once again with a dose-dependent trend. On the other side, the supplementation with Si resulted in an increase for Streptococcus salivarius, Streptococcus spp., and Staphylococcus succinus.

4. Discussion

The agronomic biofortification generally achieved by supplying plants with specific mineral fertilizers is one of the approaches aimed at increasing the concentration of beneficial compounds in edible organs of crop plants [8]. In this context, strawberry plants have already proven as good target for biofortification programs based on Selenium [6] and Silicon [22]. As expected, the supplementation of these not essential nutrients to plants has been translated into an increased accumulation of both Se and Si in strawberry fruit. However, the biofortification also induced a differential accumulation of potentially beneficial compounds (e.g., flavonoids and phenolic compounds), which display antioxidant activity, besides contributing to the organoleptic features [6,22].
From an agronomical standpoint, Si supplementation has beneficial effects on plants, improving their resistance to biotic and abiotic stressors, enhancing crop yield, and showing synergistic effects on the absorption of other mineral elements [12,14,16,17]. However, in the present research context, both root and shoot biomass were negatively influenced by the increasing Si concentration in the growth medium, even though the total leaf area was not affected by the biofortification (Table 1). Concerning the yield components, despite being the number of flowers per plant not different between the different treatments, strawberries grown in 200 mg L−1 Si showed a significant reduction in the average number of berries, in the average yield and in the average berry weight compared to control (Table 1), possibly suggesting an inhibitory effect of the metalloid.
Several pieces of evidence have already suggested that biofortification programs with mineral nutrients can positively affect the post-harvest life span of both not processed and processed agricultural products [23,24,25,26]. The evaluation of strawberry qualities during the shelf-life assessment experiment has been carried out considering parameters like titratable acidity, Brix, firmness and sweetness index. Firmness, in particular, is one of the most considered parameters in assessing shelf life, since it is a good indicator of fruit integrity [49]. In our experimental model, firmness was significantly affected by neither the Si biofortification nor the storage temperature (Figure 1 and Supplementary Figure S3), suggesting that the Si accumulation at fruit level did not alter the structure of the fruits. On the other hand, control fruits showed an increasing trend in the titratable acidity over time, irrespectively from the storage temperature; this enhancement was also observed in Si supplemented fruits, even though to a lower extent (Figure 1 and Supplementary Figure S1). This feature is indeed considered important, since the acidity can contribute to maintain the qualitative and organoleptic feature of fruits during storage [50]. Nonetheless, similar post-harvest assessment, carried out on strawberry fruits cv. ‘Marmolada’ stored at 6 °C for 10 days, showed an opposite trend with a significant decrease in the total acidity, most likely ascribable to the ripening process [50]. In this context, the total soluble solids (Brix) showed a growing trend over time in all the treatments, albeit not showing a stronger increase in the samples stored at the higher temperatures (Figure 1 and Supplementary Figure S2), as also observed by other authors in both strawberries and other fruits [33,50,51]. On the other hand, the combination of titratable acidity and total soluble solids, i.e., the sweetness index, did not show any remarkable variation among the different treatments (Figure 1 and Supplementary Figure S4), suggesting that, overall, the biofortification with Si did not compromise the organoleptic qualities of strawberry fruits and their storability, at least in the present experimental conditions.
The analyses carried out on the fruits’ microbiota were partly in agreement with the agronomical data. In particular, we found that the lowest tested dose (Si 50 mg L−1) was partly overlapping with the control, while stronger effects in terms of total bacterial structure shift and diversity reduction were found with the two higher Si doses (Figure 2A,B). The microbial composition was generally in line with the literature, with Staphylococcus, Enterobacter and Streptococcus being among the most abundant genera [33]. B. breve, a well-known probiotic, was reported here for the first time as present on the surface of strawberry, being the second most abundant OTU, but its levels decreased along Si treatments. Species also comprises a number of important probiotics and it was found to be the 6th most abundant OTU, reaching 8% of total biodiversity in the control samples. As per B. breve, also this beneficial species was decreased by the Si biofortification (Figure 3). Among potential probiotics, two species were detected and found instead to increase with Si treatment: S. salivarius [52] and S. succinus [53].
T. glycolicus, an opportunistic pathogen of the Clostridiaceae family [54] was also found to decrease with the Si treatments, as it was for E. coli, which comprises, of course a number of pathogenic strains (Figure 3).

5. Conclusions

Overall, the data hereby presented demonstrate that Si biofortification program does not significantly affect the post-harvest feature of strawberry fruits. In addition, the microbiological analyses indicate a modulation of the epiphytic bacterial community on strawberries grown with a Si biofortification. Both the decrease of some potential pathogenic species and the increase of some beneficial ones are certainly of interest. However, well-known limitations of the applied molecular method should be taken carefully into account. First, DNA-based analyses do not discriminate between dead and living cells, hence the presence of both beneficial and pathogenic species must be confirmed.
Furthermore, 16S identification often cannot discriminate between pathogenic and non-pathogenic strains, as in the case of E. coli, and the possible presence of pathogenic species should be confirmed by isolation method. The present study points anyway to an interesting composition of the fruit-sphere of strawberries grown under hydroponic conditions with and without Si biofortification and should be further explored by analyses coupling molecular and culture-based methods. This can be particularly interesting if probiotics already adapted to the fruit environment can be isolated, characterized and exploited. In conclusion, the results of this work clearly highlight that the composition of the fruit epiphytic microbial community can be significantly affected by nutritional regimes of the strawberry plants.

Supplementary Materials

The following are available online at https://0-www-mdpi-com.brum.beds.ac.uk/article/10.3390/agronomy11122407/s1, Figure S1: The titratable acidity of strawberry samples subjected to different fertilization treatments (i.e., control, 50 mg L−1 Si, 100 mg L−1 Si, 200 mg L−1 Si), stored at different temperature (i.e., 1, 4 and 10°C) for diverse periods of time (i.e., 0, 7 and 14 days) has been expressed as g L−1 equivalent of Citric Acid. The data are expressed as means ± SE and the number of independent biological replicates for each treatment was at least six, Figure S2: The total soluble solids of strawberry samples subjected to different fertilization treatments (i.e., control, 50 mg L−1 Si, 100 mg L−1 Si, 200 mg L−1 Si), stored at different temperature (i.e., 1, 4 and 10 °C) for diverse periods of time (i.e., 0, 7 and 14 days) has been expressed as °Brix. The data are expressed as means ± SE and the number of independent biological replicates for each treatment was at least six, Figure S3: The firmness of strawberry samples subjected to different fertilization treatments (i.e., control, 50 mg L−1 Si, 100 mg L−1 Si, 200 mg L−1 Si), stored at different temperature (i.e., 1, 4 and 10 °C) for diverse periods of time (i.e., 0, 7 and 14 days) has been determined with a penetrometer. The data are expressed as means ± SE and the number of independent biological replicates for each treatment was at least six, Figure S4: The sweetness index of strawberry samples subjected to different fertilization treatments (i.e., control, 50 mg L−1 Si, 100 mg L−1 Si, 200 mg L−1 Si), stored at different temperature (i.e., 1, 4 and 10 °C) for diverse periods of time (i.e., 0, 7 and 14 days) was calculated as the ratio between total soluble solids and titratable acidity. The data are expressed as means ± SE and the number of independent biological replicates for each treatment was at least six, Figure S5: Hierarchical clustering of sequences classified at the genus level using the average linkage algorithm according. Taxa participating with ≥5% in at least one sample are depicted, taxa with lower participations were added to the “other” sequence group.

Author Contributions

Conceptualization, Y.P., T.M., S.C., E.P.; methodology, F.V., E.P., L.B.; formal analysis, F.V., Y.P., E.P.; data curation, Y.P., E.P.; writing—original draft preparation, Y.P. and E.P.; writing—review and editing, Y.P., S.C., T.M., L.B., F.V., M.T. and E.P.; supervision, M.T., S.C., T.M. All authors have read and agreed to the published version of the manuscript.

Funding

This research received no external funding.

Data Availability Statement

The database is available upon request to the corresponding authors.

Conflicts of Interest

The authors declare no conflict of interest.

References

  1. Bailey, R.L.; West, K.P.; Black, R.E. The epidemiology of global micronutrient deficiencies. Ann. Nutr. Metab. 2015, 66, 22–33. [Google Scholar] [CrossRef]
  2. Hefferon, K.L. Nutritionally enhanced food crops; progress and perspectives. Int. J. Mol. Sci. 2015, 16, 3895–3914. [Google Scholar] [CrossRef]
  3. O’Hare, T.J. Biofortification of vegetables for the developed world. Acta Hortic. 2015, 1106, 1–8. [Google Scholar] [CrossRef]
  4. Tardy, A.-L.; Ballesta, A.A.; Yilmaz, G.C.; DAN, M.; Ramirez, D.M.; Lam, H.Y.; Azais-Braesco, V.; Pouteau, E. Adult’s dietary intakes of selected vitamins & minerals essential for energy metabolism and cognition: A comparison across countries & genders (FS10-04-19). Curr. Dev. Nutr. 2019, 3. [Google Scholar] [CrossRef] [Green Version]
  5. Alina, V.R.; Carmen, M.C.; Sevastita, M.; Andruţa, M.; Vlad, M.; Ramona, S.; Georgiana, P.; Mihaela, M. Food Fortification through Innovative Technologies. In Food Engineering; IntechOpen: London, UK, 2019; pp. 1–25. ISBN 978-1-83881-976-7. [Google Scholar]
  6. Mimmo, T.; Tiziani, R.; Valentinuzzi, F.; Lucini, L.; Nicoletto, C.; Sambo, P.; Scampicchio, M.; Pii, Y.; Cesco, S. Selenium biofortification in Fragaria x ananassa: Implications on strawberry fruits quality, content of bioactive health beneficial compounds and metabolomic profile. Front. Plant Sci. 2017, 8, 1887. [Google Scholar] [CrossRef]
  7. Kyriacou, M.C.; Rouphael, Y. Towards a new definition of quality for fresh fruits and vegetables. Sci. Hortic. 2018, 234, 463–469. [Google Scholar] [CrossRef]
  8. Sambo, P.; Nicoletto, C.; Giro, A.; Pii, Y.; Valentinuzzi, F.; Mimmo, T.; Lugli, P.; Orzes, G.; Mazzetto, F.; Astolfi, S.; et al. Hydroponic solutions for soilless production systems: Issues and opportunities in a smart agriculture perspective. Front. Plant Sci. 2019, 10, 923. [Google Scholar] [CrossRef]
  9. Price, C.T.; Koval, K.J.; Langford, J.R. Silicon: A review of its potential role in the prevention and treatment of postmenopausal osteoporosis. Int. J. Endocrinol. 2013, 2013, 316783. [Google Scholar] [CrossRef] [Green Version]
  10. D’Imperio, M.; Renna, M.; Cardinali, A.; Buttaro, D.; Santamaria, P.; Serio, F. Silicon biofortification of leafy vegetables and its bioaccessibility in the edible parts. J. Sci. Food Agric. 2016, 96, 751–756. [Google Scholar] [CrossRef]
  11. Tubaῆa, B.S.; Heckman, J.R. Silicon in soils and plants. In Silicon and Plant Diseases; Springer: Cham, Switzerland, 2015; pp. 7–51. ISBN 9783319229300. [Google Scholar]
  12. Epstein, E. Silicon. Annu. Rev. Plant Physiol. Plant Mol. Biol. 1999, 50, 641–664. [Google Scholar] [CrossRef]
  13. López-Pérez, M.C.; Pérez-Labrada, F.; Ramírez-Pérez, L.J.; Juárez-Maldonado, A.; Morales-Díaz, A.B.; González-Morales, S.; García-Dávila, L.R.; García-Mata, J.; Benavides-Mendoza, A. Dynamic modeling of silicon bioavailability, uptake, transport, and accumulation: Applicability in improving the nutritional quality of tomato. Front. Plant Sci. 2018, 9, 647. [Google Scholar] [CrossRef] [Green Version]
  14. Gattullo, C.E.; Allegretta, I.; Medici, L.; Fijan, R.; Pii, Y.; Cesco, S.; Mimmo, T.; Terzano, R. Silicon dynamics in the rhizosphere: Connections with iron mobilization. J. Plant Nutr. Soil Sci. 2016, 179, 409–417. [Google Scholar] [CrossRef]
  15. Raven, J.A. Cycling silicon—The role of accumulation in plants. New Phytol. 2003, 158, 419–421. [Google Scholar] [CrossRef]
  16. Kaushik, P.; Saini, D.K. Silicon as a vegetable crops modulator—A review. Plants 2019, 8, 148. [Google Scholar] [CrossRef] [PubMed] [Green Version]
  17. Laane, H.M. The effects of foliar sprays with different silicon compounds. Plants 2018, 7, 45. [Google Scholar] [CrossRef] [PubMed] [Green Version]
  18. Buturi, C.V.; Mauro, R.P.; Fogliano, V.; Leonardi, C.; Giuffrida, F. Mineral biofortification of vegetables as a tool to improve human diet. Foods 2021, 10, 223. [Google Scholar] [CrossRef]
  19. D’Imperio, M.; Brunetti, G.; Gigante, I.; Serio, F.; Santamaria, P.; Cardinali, A.; Colucci, S.; Minervini, F. Integrated in vitro approaches to assess the bioaccessibility and bioavailability of silicon-biofortified leafy vegetables and preliminary effects on bone. In Vitro Cell. Dev. Biol.-Anim. 2017, 53, 217–224. [Google Scholar] [CrossRef]
  20. Gottardi, S.; Iacuzzo, F.; Tomasi, N.; Cortella, G.; Manzocco, L.; Pinton, R.; Römheld, V.; Mimmo, T.; Scampicchio, M.; Dalla Costa, L.; et al. Beneficial effects of silicon on hydroponically grown corn salad (Valerianella locusta (L.) Laterr) plants. Plant Physiol. Biochem. 2012, 56, 14–23. [Google Scholar] [CrossRef]
  21. Montesano, F.F.; D’Imperio, M.; Parente, A.; Cardinali, A.; Renna, M.; Serio, F. Green bean biofortification for Si through soilless cultivation: Plant response and Si bioaccessibility in pods. Sci. Rep. 2016, 6, 31662. [Google Scholar] [CrossRef] [Green Version]
  22. Valentinuzzi, F.; Cologna, K.; Pii, Y.; Mimmo, T.; Cesco, S. Assessment of silicon biofortification and its effect on the content of bioactive compounds in strawberry (Fragaria x ananassa ‘Elsanta’) fruits. Acta Hortic. 2018, 1217, 307–312. [Google Scholar] [CrossRef]
  23. Gerasopoulos, D.; Chouliaras, V.; Lionakis, S. Effects of preharvest calcium chloride sprays on maturity and storability of Hayward kiwifruit. Postharvest Biol. Technol. 1996, 7, 65–72. [Google Scholar] [CrossRef]
  24. Cosgrove, D.J. Growth of the plant cell wall. Nat. Rev. Mol. Cell Biol. 2005, 6, 850–861. [Google Scholar] [CrossRef] [PubMed]
  25. Saladié, M.; Matas, A.J.; Isaacson, T.; Jenks, M.A.; Goodwin, S.M.; Niklas, K.J.; Xiaolin, R.; Labavitch, J.M.; Shackel, K.A.; Fernie, A.R.; et al. A reevaluation of the key factors that influence tomato fruit softening and integrity. Plant Physiol. 2007, 144, 1012–1028. [Google Scholar] [CrossRef] [Green Version]
  26. D’Amato, R.; De Feudis, M.; Hasuoka, P.E.; Regni, L.; Pacheco, P.H.; Onofri, A.; Businelli, D.; Proietti, P. The selenium supplementation influences olive tree production and oil stability against oxidation and can alleviate the water deficiency effects. Front. Plant Sci. 2018, 9, 1191. [Google Scholar] [CrossRef] [PubMed]
  27. Fan, L.; Dubé, C.; Fang, C.; Roussel, D.; Charles, M.T.; Desjardins, Y.; Khanizadeh, S. Effect of production systems on phenolic composition and oxygen radical absorbance capacity of “Orléans” strawberry. LWT-Food Sci. Technol. 2012, 45, 241–245. [Google Scholar] [CrossRef]
  28. Alexandre, E.M.C.; Brandão, T.R.S.; Silva, C.L.M. Efficacy of non-thermal technologies and sanitizer solutions on microbial load reduction and quality retention of strawberries. J. Food Eng. 2012, 108, 417–426. [Google Scholar] [CrossRef]
  29. Baka, M.; Mercier, J.; Corcuff, R.; Castaigne, F.; Arul, J. Photochemical treatment to improve storability of fresh strawberries. J. Food Sci. 1999, 64, 1068–1072. [Google Scholar] [CrossRef]
  30. Bialka, K.L.; Demirci, A. Efficacy of aqueous ozone for the decontamination of Escherichia coli O157:H7 and Salmonella on raspberries and strawberries. J. Food Prot. 2007, 70, 1088–1092. [Google Scholar] [CrossRef] [PubMed]
  31. Duarte-Molina, F.; Gómez, P.L.; Castro, M.A.; Alzamora, S.M. Storage quality of strawberry fruit treated by pulsed light: Fungal decay, water loss and mechanical properties. Innov. Food Sci. Emerg. Technol. 2016, 34, 267–274. [Google Scholar] [CrossRef]
  32. Contigiani, E.V.; Jaramillo-Sánchez, G.; Castro, M.A.; Gómez, P.L.; Alzamora, S.M. Postharvest quality of strawberry fruit (Fragaria x ananassa Duch cv. Albion) as affected by ozone washing: Fungal spoilage, mechanical properties, and structure. Food Bioprocess Technol. 2018, 11, 1639–1650. [Google Scholar] [CrossRef]
  33. Jensen, B.; Knudsen, I.M.B.; Andersen, B.; Nielsen, K.F.; Thrane, U.; Jensen, D.F.; Larsen, J. Characterization of microbial communities and fungal metabolites on field grown strawberries from organic and conventional production. Int. J. Food Microbiol. 2013, 160, 313–322. [Google Scholar] [CrossRef] [PubMed]
  34. Zhimo, V.Y.; Kumar, A.; Biasi, A.; Salim, S.; Feygenberg, O.; Toamy, M.A.; Abdelfattaah, A.; Medina, S.; Freilich, S.; Wisniewski, M.; et al. Compositional shifts in the strawberry fruit microbiome in response to near-harvest application of Metschnikowia fructicola, a yeast biocontrol agent. Postharvest Biol. Technol. 2021, 175, 111469. [Google Scholar] [CrossRef]
  35. Pelissari, E.M.R.; Covre, K.V.; do Rosario, D.K.A.; de São José, J.F.B. Application of chemometrics to assess the influence of ultrasound and chemical sanitizers on vegetables: Impact on natural microbiota, Salmonella enteritidis and physicochemical nutritional quality. LWT 2021, 148, 111711. [Google Scholar] [CrossRef]
  36. Darlison, J.; Mogren, L.; Rosberg, A.K.; Grudén, M.; Minet, A.; Liné, C.; Mieli, M.; Bengtsson, T.; Håkansson, Å.; Uhlig, E.; et al. Leaf mineral content govern microbial community structure in the phyllosphere of spinach (Spinacia oleracea) and rocket (Diplotaxis tenuifolia). Sci. Total Environ. 2019, 675, 501–512. [Google Scholar] [CrossRef]
  37. Połka, J.; Rebecchi, A.; Pisacane, V.; Morelli, L.; Puglisi, E. Bacterial diversity in typical Italian salami at different ripening stages as revealed by high-throughput sequencing of 16S rRNA amplicons. Food Microbiol. 2015, 46, 342–356. [Google Scholar] [CrossRef] [PubMed]
  38. Vasileiadis, S.; Puglisi, E.; Trevisan, M.; Scheckel, K.G.; Langdon, K.A.; McLaughlin, M.J.; Lombi, E.; Donner, E. Changes in soil bacterial communities and diversity in response to long-term silver exposure. FEMS Microbiol. Ecol. 2015, 91, fiv114. [Google Scholar] [CrossRef] [PubMed] [Green Version]
  39. Magoč, T.; Salzberg, S.L. FLASH: Fast length adjustment of short reads to improve genome assemblies. Bioinformatics 2011, 27, 2957–2963. [Google Scholar] [CrossRef] [PubMed]
  40. Schloss, P.D.; Westcott, S.L.; Ryabin, T.; Hall, J.R.; Hartmann, M.; Hollister, E.B.; Lesniewski, R.A.; Oakley, B.B.; Parks, D.H.; Robinson, C.J.; et al. Introducing mothur: Open-source, platform-independent, community-supported software for describing and comparing microbial communities. Appl. Environ. Microbiol. 2009, 75, 7537–7541. [Google Scholar] [CrossRef] [PubMed] [Green Version]
  41. DeSantis, T.Z.; Hugenholtz, P.; Keller, K.; Brodie, E.L.; Larsen, N.; Piceno, Y.M.; Phan, R.; Andersen, G.L. NAST: A multiple sequence alignment server for comparative analysis of 16S rRNA genes. Nucleic Acids Res. 2006, 34, W394–W399. [Google Scholar] [CrossRef]
  42. Schloss, P.D. The effects of alignment quality, distance calculation method, sequence filtering, and region on the analysis of 16S rRNA gene-based studies. PLoS Comput. Biol. 2010, 6, e1000844. [Google Scholar] [CrossRef] [Green Version]
  43. McDonald, D.; Price, M.N.; Goodrich, J.; Nawrocki, E.P.; Desantis, T.Z.; Probst, A.; Andersen, G.L.; Knight, R.; Hugenholtz, P. An improved Greengenes taxonomy with explicit ranks for ecological and evolutionary analyses of bacteria and archaea. ISME J. 2012, 6, 610–618. [Google Scholar] [CrossRef]
  44. Wickham, H. Ggplot2: Elegant Graphics for Data Analysis; Springer: Berlin/Heidelberg, Germany, 2016; ISBN 3319242776. [Google Scholar]
  45. De Mendiburu, F. Package ‘agricolae’. In R Package Version; 2019; pp. 1–2. Available online: https://cran.r-project.org/web/packages/agricolae/index.html (accessed on 7 September 2021).
  46. Tang, Y.; Horikoshi, M.; Li, W. Ggfortify: Unified interface to visualize statistical results of popular r packages. R J. 2016, 8, 478–489. [Google Scholar] [CrossRef] [Green Version]
  47. Paulson, J.N.; Pop, M.; Bravo, H.C. Metastats: An improved statistical method for analysis of metagenomic data. Genome Biol. 2011, 12, P17. [Google Scholar] [CrossRef] [Green Version]
  48. Pistón, F.; Pérez, A.G.; Sanz, C.; Refoyo, A. Strawberry postharvest shelf life is related to total acid content and fruit firmness. In IX International Strawberry Symposium; International Society for Horticultural Science (ISHS): Leuven, Belgium, 2021; pp. 869–872. [Google Scholar]
  49. Chiabrando, V.; Garavaglia, L.; Giacalone, G. The postharvest quality of fresh sweet cherries and strawberries with an active packaging system. Foods 2019, 8, 335. [Google Scholar] [CrossRef] [PubMed] [Green Version]
  50. Emongor, V.E.; Ramagonono, G. Storage temperature influences postharvest quality of wild plum (Ximmenia Americana L.) Fruit. Ghana J. Sci. 2019, 60, 1–10. [Google Scholar] [CrossRef]
  51. Da Silva, E.P.; Cardoso, A.F.L.; Fante, C.; Rosell, C.M.; de Boas, E.V.B.V. Effect of postharvest temperature on the shelf life of gabiroba fruit (Campomanesia pubescens). Food Sci. Technol. 2013, 33, 632–637. [Google Scholar] [CrossRef] [Green Version]
  52. Wescombe, P.A.; Hale, J.D.; Heng, N.C.; Tagg, J.R. Developing oral probiotics from Streptococcus salivarius. Future Microbiol. 2012, 7, 1355–1371. [Google Scholar] [CrossRef]
  53. Song, J.; Lim, H.X.; Lee, A.; Kim, S.; Lee, J.H.; Kim, T.S. Staphylococcus succinus 14BME20 prevents allergic airway inflammation by induction of regulatory T Cells via interleukin-10. Front. Immunol. 2019, 10, 1269. [Google Scholar] [CrossRef] [PubMed] [Green Version]
  54. Syuhadah, A.S.N.; Ali, U.K.; Norazizah, M. A rare and fatal case of Terrisporobacter glycolicus bacteremia: Case report and review of literature. Int. J. Infect. Dis. 2020, 101, 151. [Google Scholar] [CrossRef]
Figure 1. Principal component analyses of post-harvest quality data. (A) Scatterplot representing the distribution of control strawberry samples as affected by the storage temperature (1, 4 and 10 °C) and the storage period (0, 7 and 14 days). (B) Scatterplot representing the distribution of 50 mg L−1 Si-treated strawberry samples as affected by the storage temperature (1, 4 and 10 °C) and the storage period (0, 7 and 14 days). (C) Scatterplot representing the distribution of 100 mg L−1 Si-treated strawberry samples as affected by the storage temperature (1, 4 and 10 °C) and the storage period (0, 7 and 14 days). (D) Scatterplot representing the distribution of 200 mg L−1 Si-treated strawberry samples as affected by the storage temperature (1, 4 and 10 °C) and the storage period (0, 7 and 14 days).
Agronomy 11 02407 g001
Figure 2. Principal component analyses of post-harvest quality data. (A) Canonical Correspondence Analysis (CCA) on the impact of Si biofortification on the relative abundances of all bacterial OTUs. (B) α-diversity index calculated as total number of observed OTUs (S). Treatments with the same letter are not significantly different according to Tukey’s test.
Agronomy 11 02407 g002
Figure 3. Metastats analysis testing significant between treatments. OTUs representing the 95% of total diversity are reported, and classified at the lowest taxonomical level, in most cases the species level. Treatments with the same letter are not significantly different according to Tukey’s test.
Agronomy 11 02407 g003
Table 1. Plant biomass data and yield parameters of strawberry fruits grown in a full nutrient (control) and a nutrient solution either supplied with Si at 50 (Si 50), 100 (Si 100) or 200 (Si 200) mg L−1.
ControlSi 50Si 100Si 200
FW shoot (g plant−1) **20.59 ± 2.35 a13.42 ± 0.88 b14.88 ± 1.43 b10.08 ± 1.22 b
FW root (g plant−1) **19.08 ± 1.20 a14.70 ± 1.28 b13.29 ± 0.49 b13.61 ± 0.93 b
Leaf area (cm2) ns38.28 ± 2.72 a34.85 ± 2.42 a36.41 ± 2.16 a30.23 ± 1.95 a
Average n. of flowers ns21.89 ± 2.45 ns23.78 ± 1.36 ns21.78 ± 1.86 ns22.38 ± 2.27 ns
Average yield plant−1 (g) *60.22 ± 5.69 a49.70 ± 5.46 ab41.85 ± 2.46 b37.10 ± 4.52 b
Average n. of berries plant−1 *16.00 ± 0.93 a14.67 ± 1.64 a13.44 ± 0.84 ab12.25 ± 1.35 b
Average berry weight (g) ***3.71 ± 0.18 ab3.42 ± 0.17 b4.13 ± 0.22 a2.79 ± 0.19 c
FW = fresh weight; mean ± SE; letters following the means indicate significant differences; ns = not significant; * p < 0.05, ** p < 0.01, *** p < 0.001.
Publisher’s Note: MDPI stays neutral with regard to jurisdictional claims in published maps and institutional affiliations.

