Article

Screening of Wheat (Triticum aestivum L.) Genotypes for Drought Tolerance through Agronomic and Physiological Response

1
Department of Agronomy, University of Agriculture Faisalabad, Faisalabad 38040, Pakistan
2
College of Agriculture, Fujian Agriculture and Forestry University, Fuzhou 350002, China
3
Department of Agronomy, Northwest A&F University, Yangling 712100, China
4
Key Laboratory of Ministry of Education for Genetics, Breeding and Multiple Utilization of Crops, Oil Crops Research Institute, Center of Legume Crop Genetics and Systems Biology/College of Agriculture, Fujian Agriculture and Forestry University (FAFU), Fuzhou 350002, China
5
Seed Science and Technology, University of Agriculture Faisalabad, Faisalabad 38040, Pakistan
6
Institute of Biological Sciences, Campus Talca, Universidad de Talca, Talca 3465548, Chile
7
Department of Horticultural Sciences, Faculty of Agriculture and Environment, The Islamia University of Bahawalpur, Bahawalpur 93100, Pakistan
8
College of Horticulture, Fujian Agriculture and Forestry University, Fuzhou 350002, China
9
Vegetable and Oilseeds Section, Agronomic Research Institute, Ayub Agricultural Research Institute, Faisalabad 38000, Pakistan
10
Agronomic Research Institute, Ayub Agricultural Research Institute, Faisalabad 38000, Pakistan
11
Department of Agricultural Botany, Faculty of Agriculture, Ain Shams University, Hadayek Shubra, Cairo 11241, Egypt
12
Department of Biology, Faculty of Applied Science, Umm Al-Qura University, Makkah 21955, Saudi Arabia
13
Plant Production Department (Horticulture-Medicinal and Aromatic Plants), Faculty of Agriculture (Saba Basha), Alexandria University, Alexandria 21531, Egypt
*
Authors to whom correspondence should be addressed.
These authors contributed equally to this work.
Submission received: 10 November 2021 / Revised: 11 December 2021 / Accepted: 20 January 2022 / Published: 23 January 2022
(This article belongs to the Special Issue Molecular Genetic Improvement of Crop Drought Tolerance)

Abstract

:
Water scarcity is a major challenge to wheat productivity under changing climate conditions, especially in arid and semi-arid regions. During recent years, different agronomic, physiological and molecular approaches have been used to overcome the problems related to drought stress. Breeding approaches, including conventional and modern breeding, are among the most efficient options to overcome drought stress through the development of new varieties adapted to drought. Growing drought-tolerant wheat genotypes may be a sustainable option to boost wheat productivity under drought stress conditions. Therefore, the present study was conducted with the aim to screen different wheat genotypes based on stress tolerance levels. For this purpose, eleven commonly cultivated wheat genotypes (V1 = Akbar-2019, V2 = Ghazi-2019, V3 = Ujala-2016, V4 = Zincol-2016, V5 = Anaj-2017, V6 = Galaxy-2013, V7 = Pakistan-2013, V8 = Seher-2006, V9 = Lasani-2008, V10 = Faisalabad-2008 and V11 = Millat-2011) were grown in pots filled with soil under well-watered (WW, 70% of field capacity) and water stress (WS, 35% of field capacity) conditions. Treatments were arranged under a completely randomized design (CRD) with three replicates. Data on yield and yield-related traits (tillers/plant, spikelets/spike, grains/spike, 100 grain weight, seed and biological yield) and physio-biochemical (chlorophyll contents, relative water content, membrane stability index, leaf nitrogen, phosphorus, and potassium content) attributes were recorded in this experiment. Our results showed that drought stress significantly affected the morpho-physiological, and biochemical attributes in all tested wheat varieties. Among the genotypes, all traits were found to be significantly (p < 0.05) higher in wheat genotype Faisalabad-2008, including biological yield (9.50 g plant−1) and seed yield (3.39 g plant−1), which was also proven to be more drought tolerant than the other tested genotypes. The higher biological and grain yield of genotype Faisalabad-2008 was mainly attributed to greater numbers of tillers/plant and spikelets/spike compared to the other tested genotypes. The wheat genotype Galaxy-2013 had significantly lower biological (7.43 g plant−1) and seed yield (2.11 g plant−1) than all other tested genotypes, and was classified as a drought-sensitive genotype. For the genotypes, under drought stress, biological and grain yield decreased in the order V10 > V2 > V1 > V4 > V7 > V11 > V9 > V8 > V3 > V6. These results suggest that screening for drought-tolerant genotypes may be a more viable option to minimize drought-induced effects on wheat in drought-prone regions.

1. Introduction

Wheat (Triticum aestivum L.), originating from South Western Asia, is cultivated throughout the world [1]. It is known as the king of cereals and consumed as a staple crop by one-third of the global population [2]. According to an estimate, wheat is the second most commonly grown crop in the world [3,4]. Its seed provides 1.8% fiber, 9.4% protein, 69% carbohydrates and 2.5% fat [5]. In Pakistan, wheat is grown on an area of 9.2 million hectares with net production of about 25.52 million tonnes annually. It contributes about 10% of value added and 2.2% of the GDP of Pakistan (Economic Survey of Pakistan, 2019). Under field conditions, wheat crops often face various biotic and abiotic stresses that negatively affect its growth and development [6]. Among abiotic stresses, drought is known to have injurious effects on the growth, development and qualitative traits in wheat [7,8,9,10,11]. Abiotic stresses, including drought, cause many physiological and molecular disorders in plants through excessive production of reactive oxygen species (ROS). According to Raza et al. [12], drought negatively influences the morpho-physiological traits, including plant height, leaf area, relative water content, stomatal oscillation, chlorophyll contents, osmotic potential and leaf water potential, in wheat crops [12]. Under moisture deficit conditions, surplus electrons are released to oxygen, which results in production of ROS during respiration and photosynthetic processes in plants. These circumstances cause oxidative damage in plants [11,13,14]. Reactive oxygen species production is hazardous to plant cells because it can damage the cellular organelles, i.e., the chloroplast, nucleic acids, membrane lipid, mitochondria and metabolic enzymes [15]. Under drought-induced oxidative stress, plants show abnormalities in physiological and biochemical processes leading to cell death [16]. Photosynthesis is one of the most sensitive processes to drought stress [17,18] because drought damages the photosynthetic process and causes the stomatal closure. The reduced photosynthesis due to stomatal closure is reported to limit the supply of CO2 [18].
Crop plants have evolved various defense mechanisms to counter the negative effects of ROS generated under drought conditions [19,20]. Different enzymes in plants, such as superoxide dismutase (SOD), ascorbate (APX), peroxidase (POD) and catalase (CAT), are involved in ameliorating the detrimental effects of drought-induced oxidative stress. These enzymes increase plant tolerance against the damaging consequences of drought [15,19,20].
Water resources are steadily depleting because of the increase in water demand by a growing human population and water consumption by domestic, environmental, and industrial sectors. As a result, the optimum provision of water to agricultural crops will decrease in the near future. Indeed, agricultural crops are currently facing severe water shortages [21]. Thus, there is a need to develop and implement technologies that are based on the economical and efficient consumption of water to provide a satisfactory agricultural yield [21].
In recent years, different strategies have been adopted to minimize the challenges associated with of drought. These include partial root drying, mulching, artificial precipitation, ground water recharge, and using compatible and drought-tolerant genotypes [22,23,24]. The testing of crop genotypes for drought tolerance in terms of their physiological and biochemical responses to drought stress may serve as a potent approach to screen and develop new cultivars. In addition, evaluating the physiological and biochemical changes occurring under drought may lead to the genetic improvement of drought-tolerant genotypes [25]. Varietal screening can be performed either by modern breeding tools or by conventional breeding practice of growing the varieties under different environmental conditions, although conventional breeding is a long-term process and not recommended until the sufficient availability of basic resources. Therefore, varietal screening under controlled conditions is recognized as one of the best methods to select the most appropriate abiotic stress-tolerant genotypes [11]. Moreover, when screening drought-sensitive and -resistant wheat genotypes, physiological parameters such as relative water content, intercellular CO2 concentration, turgor pressure, water use efficiency, photosynthesis, chlorophyll content and stomatal conductance of wheat leaves are considered. Drought-tolerant varieties are reported to be superior in all of the above-mentioned parameters compared to drought-sensitive varieties. Similarly, drought-tolerant varieties have higher antioxidant activities than drought-sensitive varieties [12,26]. Moreover, traits of particular interest have been identified in different wheat genotypes and then introduced into other species [27]. Wheat has different genotypes and varieties that differ in terms of transformation, regeneration, tissue culture and callus induction efficiency [28]. The success of genetic engineering depends on the efficiencies of these parameters. Wheat genotype screening is essential because it aids in the selection of desired parents and is helpful in carrying out breeding processes [29,30]. In the context of these facts, this study aimed to screen wheat genotypes for resistance against moisture deficit conditions in semi-arid regions of Pakistan. We hypothesized that there is no genotype-dependent variation of morpho-physiological and biochemical parameters among the tested genotypes. We also hypothesized that there is no difference in the yield and yield-related traits of tested varieties.

2. Materials and Methods

This experiment was performed in a wire house (a pot trial) at the University of Agriculture Faisalabad (altitude 184 m, latitude 31.30° N, longitude 73.05° E) during the winter season, 2019–2020. The pots (measuring 20 cm × 20 cm) were filled with 5 kg of well-sieved soil. The experiment comprised two factors regarding drought treatments: well-watered (WW, 70% of field capacity) and water stress (WS, 35% of field capacity) and 11 wheat genotypes, namely, Akbar-2019, Ghazi-2019, Ujala-2016, Zincol-2016, Anaj-2017, Galaxy-2013, Pakistan-2013, Seher-2006, Lasani-2008, Faisalabad-2008 and Millat-2011. The seeds of these genotypes were procured from the Directorate of Farms, Students Research Farm, Department of Agronomy, Faculty of Agriculture, University of Agriculture, Faisalabad, Pakistan. Sowing of wheat was undertaken in soil having a uniform soil moisture, and stress was imposed at 25 days after sowing. After stress imposition, soil moisture was determined on a daily basis with the help of a soil moisture meter (TZS-W), and water losses were remunerated by adding water to achieve the described level of field capacity in respective treatments. The study was laid out in a completely randomized design with factorial arrangements, where each treatment had three replications. The dose of NPK (80:58:35 mg kg−1), against the recommended rates of NPK 160:100:60 kg ha−1 for wheat, was applied at the time of sowing. Seeds (15 per pots) of all wheat genotypes were sown on 15th November, at equal distance, and a uniform stand was maintained by keeping ten seedlings per pot after completion of emergence. All other practices were kept uniform for each treatment of the experiment.

2.1. Soil Analysis

Soil sampling, using an auger, was performed before sowing the crop to record the physical and chemical properties of the soil. Soil samples were placed in polyethylene bags that were tagged and transferred to the Soil and Water Testing Laboratory, Ayub Agricultural Research Institute (AARI), Faisalabad, for analysis. Details of different physio-chemical features are given in Table 1.

2.2. Irrigation Water Analysis

In the current experiment, canal water was used for irrigation. Water analysis was performed before sowing the crop. Samples were collected in rubber bottles for examination and immediately moved to the Soil and Water Testing Laboratory, Ayub Agricultural Research Institute, Faisalabad after labeling. The physico-chemical properties of irrigation water are given in Table 2.

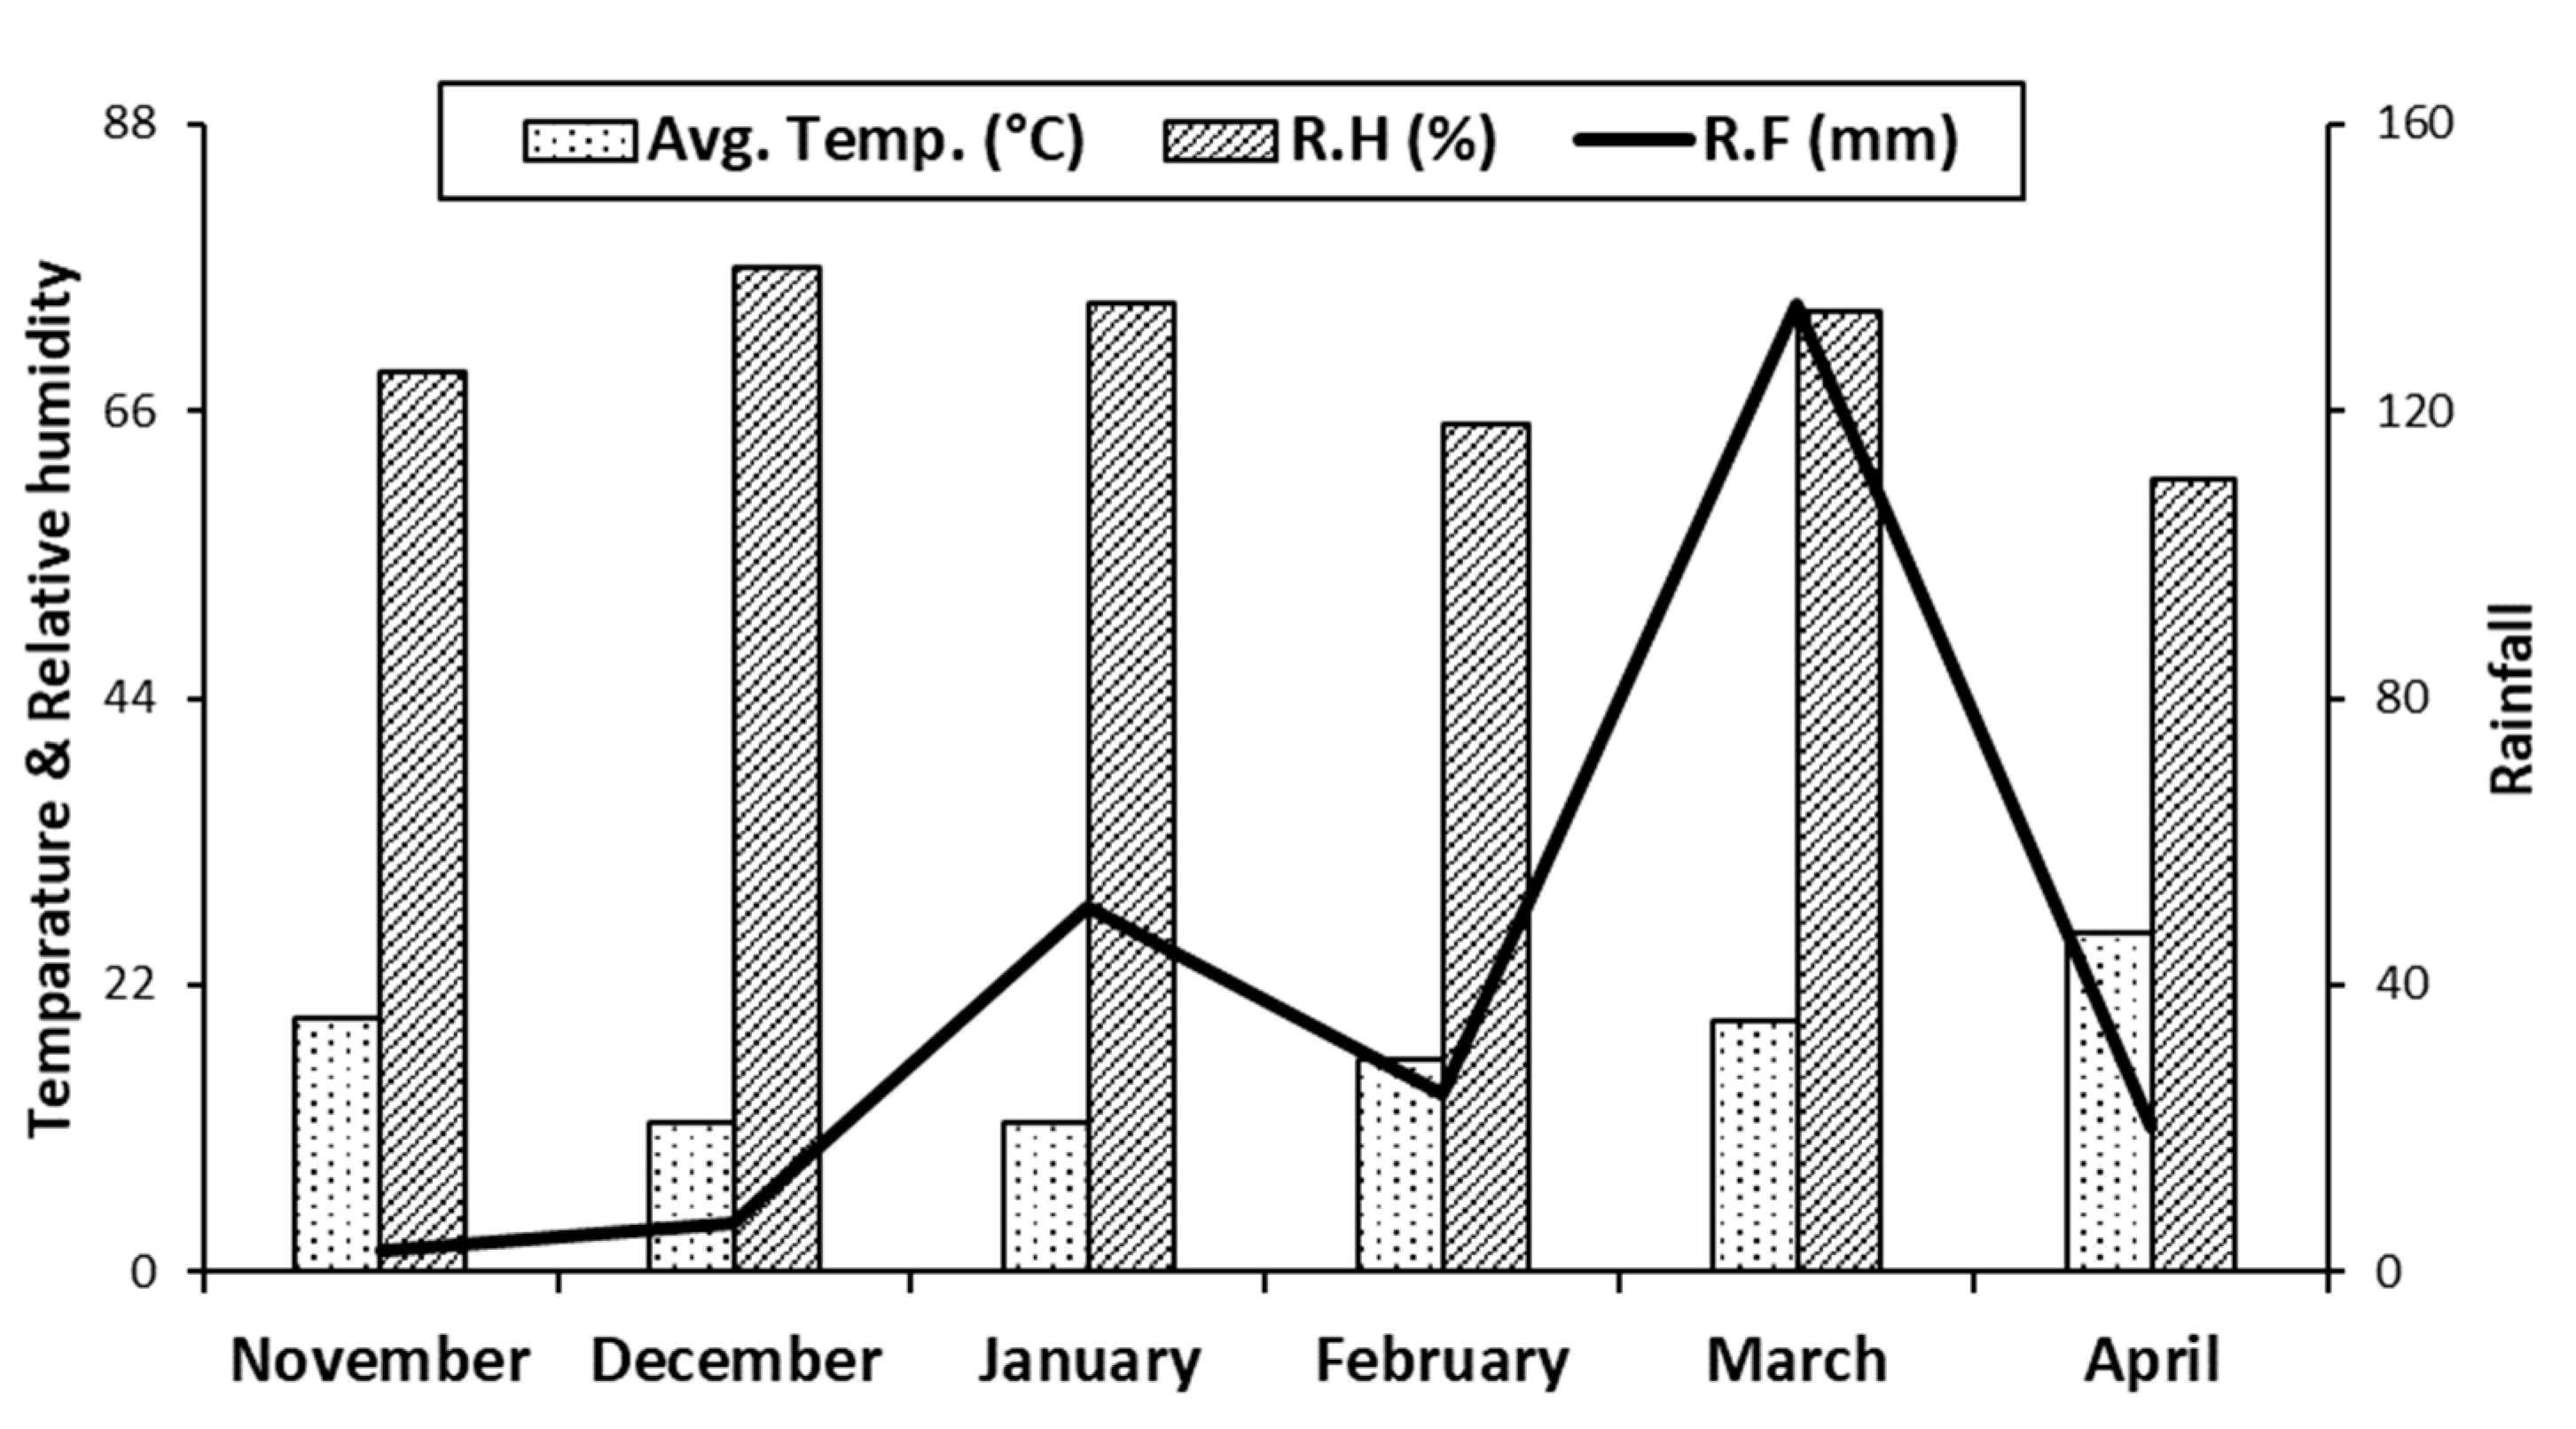
2.3. Meteorological Data

Weather data during the crop growing season were obtained from the Meteorological Observatory at the Department of Agronomy, University of Agriculture, Faisalabad, and are shown in Figure 1.

2.4. Yield and Yield-Related Parameters

In order to determine the yield and yield-related traits, five plants were harvested at harvesting stage from each pot. The average of the fertile tillers and number of spikelets from each spike were calculated. The spikes were then manually separated and threshed. The number of grains from each spike was calculated and then averaged. One hundred grains were counted and weighed using an electrical weighing balance. Grain yield was determined by adding the grain weight of all spikes in each pot.

2.5. Leaf Nitrogen Content

At maturity stage, flag leaves were harvested to determine the nitrogen content. For this, 0.1 g dried ground leaf was placed in digestion tubes. Each test tube was filled with 5 mL of concentrated sulfuric acid (H2SO4). Then, at room temperature, the samples were incubated overnight. One mL of H2O2 (35%) was poured into the digestion tube and heated at 350 °C for 30 min in a digestion block. Then, digestion tubes were allowed to cool before adding 1 mL of H2O2 and re-inserting them into the digestion block. These measures were repeated until the digested material had cooled to the point of becoming colorless. Volumetric flasks were used to sample the extract. Kjeldahl’s method was used to determine the nitrogen content.

2.6. Leaf Phosphorus Content

For phosphorus content, 5 mL of aliquot was placed in a 50 mL volumetric flask, and an additional 1 mL of distilled water and 10 mL of Barton reagent were added to bring the volume to the desired level. The volume was calculated using KH2PO4 and 10 mL of Barton reagent, and distilled water was used as the standard. Later, the colorless material was used to measure the phosphorus content through spectrophotometer at a wavelength of 420 nm.

2.7. Leaf Potassium Content

In digestion tubes, 0.1 g of dried ground leaves were placed, and each tube was filled with 5 mL of concentrated H2SO4. At room temperature, the samples were then incubated overnight. To the sides of the digestion channel, 1 mL of H2O2 (35%) was applied. Firstly, tubes were placed in a digestion block and heated at 350 °C until continuous fumes were emitted. Then, digestion tubes were removed and allowed to cool at room temperature. The tubes were then reinserted into the digestion block, where 1 mL of H2O2 was added to each tube. These measures were repeated until the digested content looked colorless. A filtered extract was used to determine the potassium content via a flame photometer.

2.8. Chlorophyll Contents

Arnon’s [31] method was used to assess the chlorophyll a and b contents at 60 days after sowing. According to this method, 0.2 g fresh leaves were digested in 80% acetone overnight at 0–4 °C. The samples were centrifuged at 10,000× g for 5 min and the absorbance of the supernatant was determined at wavelengths of 645 and 663 nm using a spectrophotometer (Hitachi-U2001, Tokyo, Japan).
The chlorophyll a and b contents were determined using the following formulae:
Chl a = [12.7 (OD 663) − 2.69 (OD 645)] × V/1000 × W
Chl b = [22.9 (OD 645) − 4.68 (OD 663)] × V/1000 × W
where V is the volume of the extract (mL) and W is the weight of the fresh leaf tissue (g).

2.9. Leaf Chlorophyll Contents (SPAD Value)

SPAD was used to measure the chlorophyll content of the leaves (model SPAD-502; Minolta Corp., Ramsey, NJ, USA).

2.10. Relative Water Contents (RWC)

The relative water contents were calculated via the method of Schonfled [32]. At the booting stage, leaves were harvested and placed in plastic bags to find the turgid weight. The imbibition process was allowed for 12 h in the presence of light (around 20 mmol m−2 s−1) and a naturally changing temperature. After imbibition, leaf samples were weighed again and turgor weights (TW) were recorded. Then, leaves were dried in an oven at 70 °C for 72 h and dry weights were determined. Relative water content was calculated using the following equation:
RWC (%) = [(fresh weight − dry weight)/(turgid weight − dry weight)] × 100

2.11. Membrane Stability Index

The leaf membrane stability index (MSI) was calculated using the method of Premachandra [33] and then modified by Sairam [34]. Leaf samples (0.1 g) were placed in ten mL of double-distilled water in test tubes. Firstly, test tubes were kept at 40 °C for 30 min and the conductivity (C1) was measured using a conductivity meter. After 15 min, the conductivity of the same set, which was kept in a boiling water bath at 100 °C, was noted (C2). The MSI was calculated as:
MSI = [1 − (C1/C2) × 100]

2.12. Statistical Analysis

Fisher’s analysis of variance (ANOVA) technique was used to statistically evaluate the collected data. Statistics version 8.1 (Analytical Software ©, 1985–2005) was used to compare the significant differences among treatment means using the least significant difference (LSD) test (p < 0.05), according to Steel et al. [35]. Principal component analysis was performed using XLSTAT ver. 2019.

3. Results

3.1. Number of Tillers per Plant and Number of Spikelets per Spike

In the case of the well-watered condition, the maximum numbers of tillers per plant were recorded in Akbar-2019 (6.11) and Faisalabad-2008 (6.06); in contrast, the minimum number of tillers was recorded in Seher-2008 (5.36). While under drought stress, Faisalabad-2008 (4.35) showed the maximum number of tillers per plant, in contrast to Galaxy-2013 (3.68), in which the minimum number of tillers was recorded (Table 3). Our data showed that under control conditions, Akbar-2019 (26.00) and Faisalabad-2008 (25.50) showed the maximum number of spikelets per spike, in contrast to Seher-2008 (21.00), in which the minimum number of spikelets was recorded. Under drought stress conditions, Faisalabd-2008 (15.33) and Galaxy-2013 (11.16) recorded the highest number of spikelets per spike, whereas Galaxy-2013 (11.16) recorded the least (Table 3).

3.2. Number of Grains per Spike

Our results showed that, under the well-watered condition, the maximum number of grains was found in Akbar-2019 (50.66), in contrast to Seher-2008 (38.66), in which the minimum was recorded. Under the water stress condition, the maximum number of grains per spike was counted in Faisalabad-2008 (35.66), followed by Ghazi-2019 (34.66), in contrast to Galaxy-2013, for which the smallest number of grains per spike (26.00) was recorded (Table 3).

3.3. 100-Grain Weight

In this study, under the well-watered condition, the maximum 100-grain weight was recorded in Akbar-2019 (5.83 g), in contrast to Seher-2008 (4.01 g), which exhibited the minimum 100-grain weight. Under the drought condition, Faisalabad-2008 (3.06 g) recorded the maximum 100-grain weight, followed by Ghazi-2019 (2.96 g), in contrast to Galaxy-2013 (1.93 g), in which the minimum 100-grain weight was recorded (Table 3).

3.4. Seed and Biological Yield

Under the well-watered condition, seed yield and biological yield (g plant−1) were maximized in Akbar-2019 (6.21 and 14.66 g, respectively), in contrast to Seher-2008 (2.61 and 14.66 g, respectively), in which the minimum yield was recorded. Under the water deficit condition, Faisalabad-2008 recorded the maximum seed and biological yield (3.39 and 9.50 g, respectively), in contrast to Galaxy-2013 (2.11 and 7.43 g, respectively), in which the minimum was recorded (Table 3).

3.5. Leaf Nitrogen Content

Our data showed that Akbar-2019 (21.16 mg g−1 DW) depicted maximum leaf nitrogen content under the well-watered condition, whereas Seher-2008 (16.82 mg g−1 DW) showed minimum leaf nitrogen content. Under water deficit conditions, Faisalabad-2008 (13.50 mg g−1 DW) recorded maximum N content, whereas Galaxy-2013 (10.33 mg g−1 DW) showed minimum N content in leaves (Table 3).

3.6. Leaf Phosphorus Content

Under the well-watered condition, Akbar-2019 (6.26 mg g−1 DW) exhibited maximum leaf phosphorus, in contrast to Seher-2008 (5.06 mg g−1 DW), in which minimum leaf phosphorus content was recorded. Under drought stress, Faisalabad-2008 (4.01 mg g−1 DW) showed maximum leaf phosphorus content, in contrast to Galaxy-2013 (2.63 mg g−1 DW), in which minimum leaf phosphorus content was recorded (Table 4).

3.7. Leaf Potassium Content

As shown in Table 4, under the control condition, Lasani-2008 (7.14 mg g−1 DW) recorded the highest leaf potassium content, in contrast to Seher-2008 (5.39 mg g−1 DW), which recorded the lowest value. Leaf potassium content was highest in Faisalabad-2008 (3.78 mg g−1 DW) and lowest in Ujala-2016 (3.05 mg g−1 DW) under the drought condition (Table 4).

3.8. Chlorophyll a

In the current study, under the well-watered condition, Akbar-2019 (2.81 mg g−1 FW) recorded the maximum chlorophyl a content, in contrast to Seher-2008 (2.10 mg g−1 FW), which had the minimum chlorophyll a content. Under drought stress, Faisalabad-2008 (1.42 mg g−1 FW) had the highest chlorophyll a content, whereas Galaxy-2013 (1.02 mg g−1 FW) recorded the lowest chlorophyll a content among the genotypes (Table 4).

3.9. Chlorophyll b

Data showed that under the control treatment, Ghazi-2019 (0.97 mg g−1 FW) recorded the maximum chlorophyll b content, in contrast to Seher-2008 (0.67 mg g−1 FW), which recorded the minimum chlorophyll b content. Under water deficit conditions, Faisalabad-2008 (0.39 mg g−1 FW) had the highest chlorophyll b content, in contrast to Galaxy-2013 (0.24 mg g−1 FW), in which the minimum was recorded (Table 4).

3.10. SPAD Values

Under the well-watered condition, Akbar-2019 (56) had the highest SPAD values, in contrast to Seher-2008 (41.33), in which the lowest SPAD values were recorded. Under drought stress, Faisalabad-2008 (36.66) showed the highest SPAD values, in contrast to Galaxy-2013 (24.33), in which the minimum was recorded (Table 4).

3.11. Leaf Relative Water Content

Our data showed that under well-watered conditions, Akbar-2019 recorded the highest leaf relative water content (91.33%), in contrast to Seher-2008, which had the lowest (78.33%) leaf relative water content. Under drought conditions, the highest relative water content (74.00%) was found in Ghazi-2019, whereas the lowest (62.66%) was in Galaxy-2013 (Table 4).

3.12. Membrane Stability Index

Under the control condition, Akbar-2019 (85.66%) had the highest membrane stability index, in contrast to Seher-2008 (73.33%), which had the lowest index. Under drought stress, Zincol-2016 and Faisalabad-2008 (72.33% and 72%, respectively) had the highest membrane stability index, whereas Galaxy-2013 (59.33%) recorded the lowest index (Table 4).

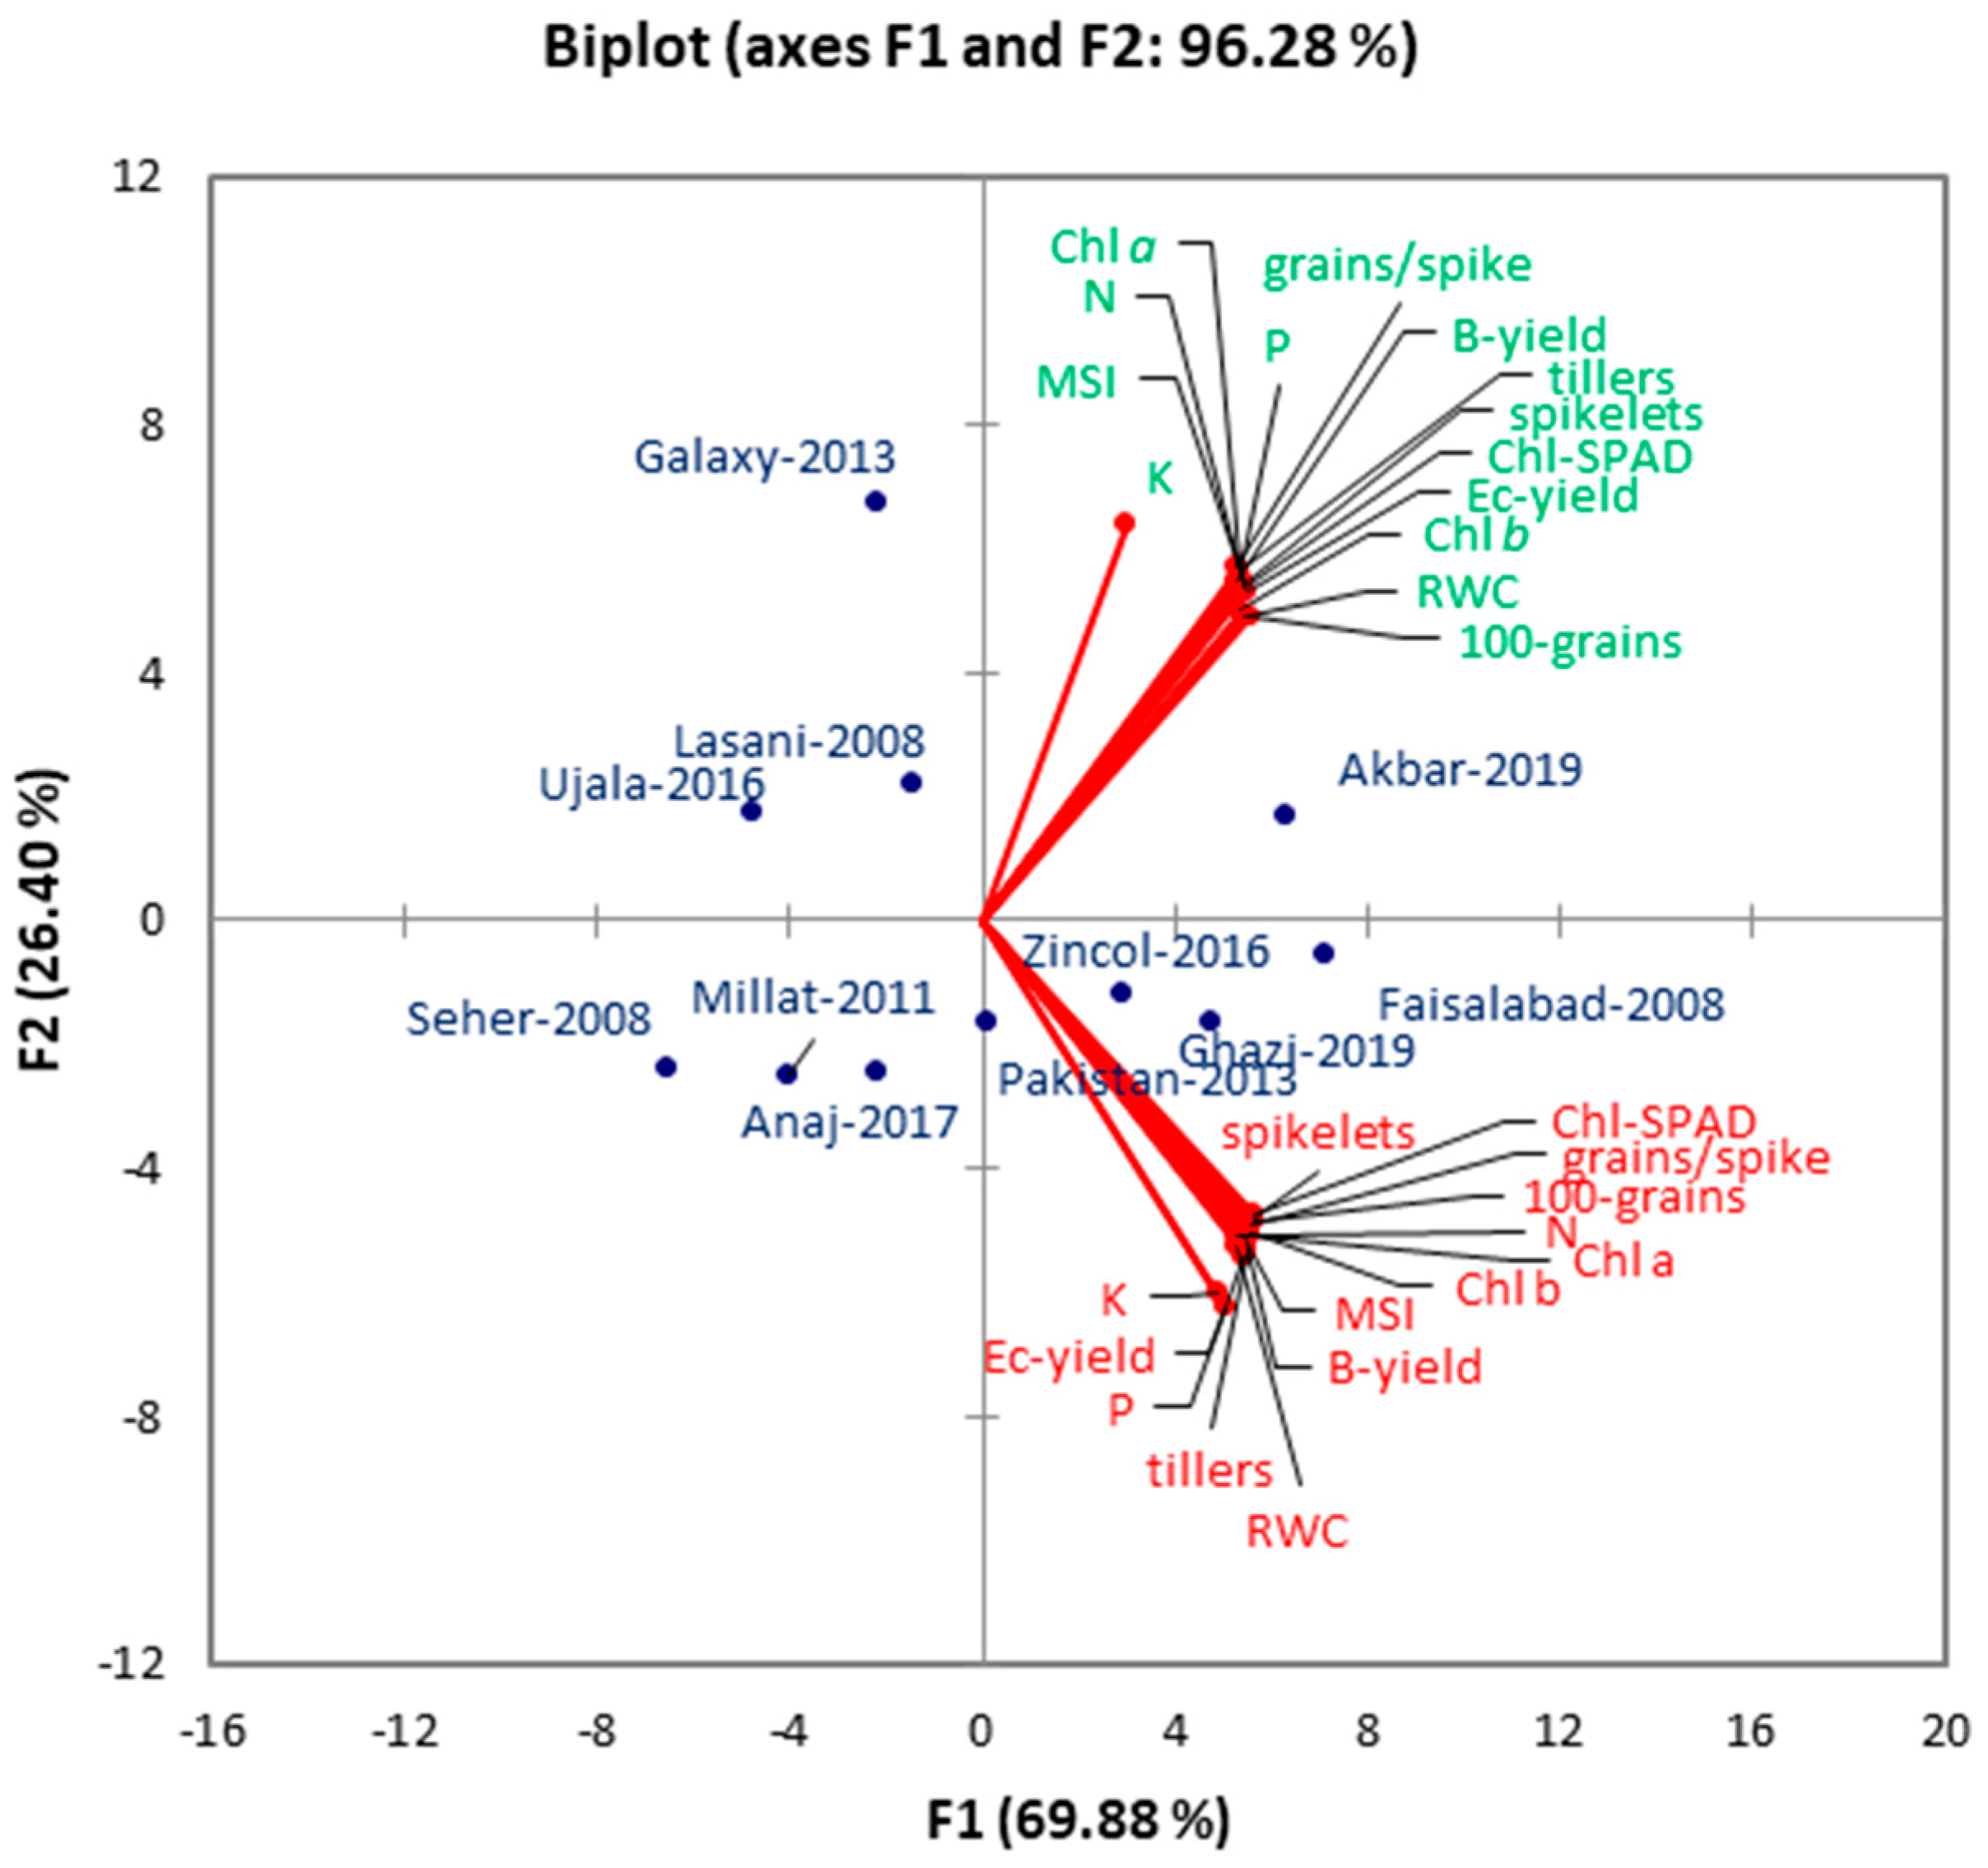
3.13. Principal Component Analysis

To better understand the drought tolerance potential of 11 wheat genotypes, principal component analysis was conducted (Figure 2). Based on the highest squared cosine value corresponding to principal component factors, plant growth and yield attributes were clustered around the examined genotypes. Factor F1, covering 69.88% of the variability in the data (eigenvalue 19.57), showed clustering of all plant growth variables with Akbar-2019, Ghazi-2019, Ujala-2016, Zincol-2016, Millat-2011, and Seher-2008, indicating remarkable performance of these genotypes in terms of plant growth and yield. Moreover, all plant growth and yield variables were found in the same but opposing quadrants of the axis, indicating their positive association with the corresponding genotypes.

4. Discussion

Drought is one of the major abiotic stresses that limits crops’ production and yield. Crops demonstrate various morpho-physiological, biochemical and molecular responses to tackle drought stress. Breeding is one of the most efficient options to overcome drought stress through the development of new genotypes adapted to drought. Therefore, selection of wheat genotypes adapted to drought stress should be undertaken. In addition, drought tolerance mechanisms should be identified during the development of new genotypes in order to increase crop productivity. The assortment of parents, along with superior drought tolerance, is critical in dry environments [36,37]. Therefore, it is a challenge to determine the degree of tolerance using a single parameter. In addition, this has limited value due to the diversity of the factors and their relations that contribute to drought tolerance under field conditions [38]. Usually, genotypes that are found to germinate under reduced water potential do not fail to germinate and establish into seedlings. Studies on water potential can enable the recognition of genotypes appropriate for growing under water deficit conditions [39]. Different stages of the life cycle of a crop actually determine the yield; among these, seed germination and subsequent seedling growth are most crucial [40], and are also more vulnerable to drought stress [41]. Water scarcity at these stages is often associated with delayed germination and reduced growth [42], which may be due to changes in physiological and biochemical characteristics [43]. Screening under drought stress is the primary goal, but controlling rainfall is a major concern because it interferes with stress intensity. In recent years, different drought-tolerant wheat genotypes have been developed by wheat breeders to enhance plant performance under drought conditions [42]. To facilitate these breeding programs, drought tolerance screening of the germplasm is an excellent means of finding materials for advanced breeding. Because of the high genotypic variation found across all traits, the study’s germplasm pool may be a valuable source of genetic diversity for breeding. Due to different genotypic responses, the germplasm pool can be used to identify a genotype that performs better under water stress [44]. All of the genotypes used in this study were selected from various pedigrees, and most of the traits found are quantitatively inherited, enabling the genotypes to react to the environment in different ways. As a result, significant effects of wheat genotypes, water regimes, and other environmental factors were observed. Crop plants with inherited mutations may be used to select genotypes with desirable traits. These distinctions are also critical when evaluating wheat varieties for drought resistance [45,46]. Under drought stress, low availability of soil moisture directly impacts plant morphology. The current study revealed high genetic variability in drought tolerance in all wheat genotypes. In our study, drought stress significantly affected the yield and yield-related traits (including the number of tillers, spikelets, and straw and grain production), physiological parameters (chlorophyll content, spade values, relative water content and membrane stability index), and biochemical parameters (including leaf nitrogen, phosphorus and potassium contents) in all tested genotypes. These findings are in line with previous studies [47,48,49], where authors have demonstrated that drought causes a significant reduction in morpho-physiological, biochemical and yield-related parameters of field crops. The negative effects of drought on wheat plants resulted in a substantial reduction in the morphological traits and productivity of all eleven wheat genotypes studied, and these findings are consistent with previous studies [49,50,51]. Dehydration under drought caused denaturing of proteins, the release of ROS, and a decrease in plant biomass, resulting in lower wheat production and all its traits [26]. Drought stress generally results in sugar accumulation and a decrease in leaf N content, leading to C/N imbalance, which is reflected in the increased C:N ratio in plant leaves. The availability of carbon (C), especially in its carbohydrate form, and nitrogen (N), are important factors in the regulation of plant metabolism and development. Phosphorus (P) is a major element present in plant tissues and its low mobility in soil causes its deficiency there; consequently, various changes in the physiology, morphology and biochemistry of plants can occur depending on P availability. It is commonly known that plants decrease P uptake under water deficit conditions. Drought can hinder P uptake by decreasing P distribution to roots, and other factors related to water in the affected plant. In this study, better performance of Faislabad-2008 under drought stress may be attributed to higher N and P contents than in the other tested genotypes (Table 3).
Wheat variety Faisalabad-2008 produced the maximum yield under water stress (WS = 35% of field capacity) conditions in soil-filled pots, thus showing its drought tolerance. Under drought conditions, a substantial difference in the number of tillers per plant was observed, with maximum tillers per plant reported in Faisalabad-2008, and minimum tillers per plant recorded in Galaxy-2013. Seed yield was greatest in Akbar-2019 followed by Seher-2008 in well-watered conditions. Under water deficit conditions, Faisalabad-2008 showed the greatest seed yield, in contrast to Galaxy-2013, for which the lowest yield was recorded. Other researchers have noted a reduction in the number of tillers per plant, yield, and yield-related traits when there is a lack of water in wheat [52], maize [14] and cotton [53,54]. Plant physiological traits, such as chlorophyll content (a and b), relative water content, and membrane stability index, are all viable for drought treatments [55]. Drought stress reduced the chlorophyll content, relative water content, and membrane stability index in all wheat genotypes tested. There were significant increases in chlorophyll content, relative water content and membrane stability index in drought-tolerant genotypes compared to the non-tolerant genotypes [11,16]. When compared to the drought-sensitive wheat variety (Galaxy-2013), the drought-tolerant wheat variety (Faisalabad-2008) had higher chlorophyll content, relative water content and membrane stability index under severe drought stress. Plants with high chlorophyll content are able to store more assimilates, allowing them to expand and produce more robust shoots and leaves. In water-stressed plants, the growth of drought-tolerant genotypes results in higher relative water content [56]. In addition, drought stress also weakens cell membrane stability, leading to further cell wall damage [14]. Further, the chlorophyll content in the flag leaves of barley decreases under water deficit conditions [57], and a more prominent reduction is noted in drought-susceptible wheat genotypes [58]. Our results are in contradiction with earlier findings on wheat crops [59], where the authors have reported an increased chlorophyll content in stressed leaves compared to non-stressed plants. Drought stress hampers photosynthesis by destroying the chlorophyll machinery, damaging the photosynthetic system, and decreasing the uptake of soil nutrients and their translocation within crop plants [60]. Furthermore, drought stress was also reported to damage the thylakoid membranes [61], negatively affecting chlorophyl synthesis, and accumulation and distribution of photo-assimilates [62]. Leaf chlorophyll content may be used as an index for source evaluation; therefore, reducing chlorophyll content under drought stress has been considered to be a pronounced non-stomatal limiting factor [63]. Additionally, chlorophyll content has been recognized as an index to determine plant tolerance to drought stress [64], and reduction in chlorophyll content in response to water deficit is regarded as a sign of oxidative stress damage caused by chlorophyllase enzymes [65]. Different studies have also shown that abiotic stress stimuli cause a severe reduction in grain yield compared to no stress conditions [66]. Drought can have unusual effects on the grain yield, depending on the crop developmental stage at which stress occurs. Thousand-grain weight and grain yield were remarkably reduced when drought was imposed at pre- and post-anthesis, anthesis, and booting stages [67]. A significant reduction in grain yields due to water stress at the post-anthesis stage may result in a severe reduction in the production of photo-assimilates (source limitation), power of the sink to absorb photo-assimilates, and reduced grain-filling duration. Drought at post-anthesis also severely reduces grain yield (up to 98%), depending on the severity of the stress and the crop growth stage during which drought was imposed [68,69]. The improvement in yield and yield-related aspects in wheat and barley under drought stress has been found to result from a prolonged grain-filling period, high chlorophyll content, a more sustained turgor, or a combination of these factors [70]. The incidence of drought at early and later growth stages severely affects wheat growth, which alters water-utilizing capacity and ultimately results in a substantial reduction in seed yield [71]. The anthesis stage is highly vulnerable to drought because it affects the pollen grain viability, which in turn reduces the number of grains per spike [72]. Taking together, modern biotechnological approaches and transcriptional regulatory networks may play a pivotal role in understanding the molecular mechanism of drought tolerant genotypes [73,74].

5. Conclusions

The findings of this study indicate that the wheat genotypes responded differentially in response to drought. Yield and yield-related traits (tillers/plant, spikelets/spike, grains/spike, 100-grain weight, biological yield and seed yield), biochemical parameters (leaf nitrogen, phosphorus, and potassium contents), leaf chlorophyll a, chlorophyll b, SPAD values, leaf relative water content, and membrane stability index were all found to be useful. Our results showed that Faisalabad-2008 was drought tolerant, whereas Galaxy-2013 was drought sensitive in a pot experiment, based on all of the above parameters. Plant breeders and physiologists working on drought-tolerant wheat genotypes could use these findings for breeding programs. These drought-tolerant genotypes could be used in a breeding program to make elite higher genetic genotypes tolerant to drought, and confer an ability to survive in drought-prone areas. As a result, more research is required to determine how the screened content fares in the field.

6. Suggestions and Recommendations

Farmers can save time and money by using screening systems to identify drought-resistant crop genotypes. It has been well established that wheat crop genotypes differ in their drought resistance. An effort should be made to raise awareness about drought-tolerant wheat genotypes among Pakistani farmers, local governments, national governments, and local, regional, and international wheat seed companies. Given the results of the current pot study, this experiment should be undertaken in the field, and farmers should be advised to cultivate Faisalabad-2008 on drought-prone soils under Faisalabad’s agro-ecological conditions.

Author Contributions

Conceptualization, Z.A. and A.A.; methodology, Z.A.; software, R.S.; validation, T.J., A.R. and F.M.-P.; formal analysis, A.A.; investigation, A.A.; resources, Z.A.; data curation, A.R., T.J. and F.M.-P.; writing—original draft preparation, A.A. and Z.A.; writing—review and editing, T.J., R.S., F.M.-P., A.R., S.H., T.S., M.T., F.Z., M.M.A., M.N., M.R., H.S.O., M.A. and M.A.A.A.; supervision, Z.A.; project administration, Z.A.; funding acquisition, A.R. All authors have read and agreed to the published version of the manuscript.

Funding

This research received no external funding.

Data Availability Statement

Not applicable.

Acknowledgments

The authors thank Ahmed Mukhtar for critically reviewing this manuscript, and helpful suggestions were provided by Muhammad Shoaib Asad for developing the illustration in Figure 2.

Conflicts of Interest

The authors declare no conflict of interest.

References

  1. Rahman, M.; Soomro, U.; Haq, M.Z.-U.; Gul, S. Effects of NaCl salinity on wheat (Triticum aestivum L.) cultivars. World J. Agric. Sci. 2008, 4, 398–403. [Google Scholar]
  2. Abdelsalam, N.R.; Kandil, E.E.; Al-Msari, M.A.; Al-Jaddadi, M.A.; Ali, H.M.; Salem, M.Z.; Elshikh, M.S. Effect of foliar application of NPK nanoparticle fertilization on yield and genotoxicity in wheat (Triticum aestivum L.). Sci. Total Environ. 2019, 653, 1128–1139. [Google Scholar] [CrossRef]
  3. Datta, J.; Nag, S.; Banerjee, A.; Mondai, N. Impact of salt stress on five varieties of wheat (Triticum aestivum L.) cultivars under laboratory condition. J. Appl. Sci. Environ. Manag. 2009, 13, 93–97. [Google Scholar] [CrossRef] [Green Version]
  4. Raza, A.; Mehmood, S.S.; Tabassum, J.; Batool, R. Targeting plant hormones to develop abiotic stress resistance in wheat. In Wheat Production in Changing Environments; Springer: Berlin/Heidelberg, Germany, 2019; pp. 557–577. [Google Scholar]
  5. Ken, P. Forms of micronutrient fertilizer. Sask agriculture and food, Rigas Karamanos (Westco). Agric. Agri-Food Can. 2004, 1, 1–10. [Google Scholar]
  6. Saddiq, M.S.; Afzal, I.; Iqbal, S.; Hafeez, M.B.; Raza, A. Low leaf sodium content improves the grain yield and physiological performance of wheat genotypes in saline-sodic soil. Pesqui. Agropecu. Trop. 2021, 51. [Google Scholar] [CrossRef]
  7. Wasaya, A.; Manzoor, S.; Yasir, T.A.; Sarwar, N.; Mubeen, K.; Ismail, I.A.; Raza, A.; Rehman, A.; Hossain, A.; EL Sabagh, A. Evaluation of Fourteen Bread Wheat (Triticum aestivum L.) Genotypes by Observing Gas Exchange Parameters, Relative Water and Chlorophyll Content, and Yield Attributes under Drought Stress. Sustainability 2021, 13, 4799. [Google Scholar] [CrossRef]
  8. Ahmad, A.; Aslam, Z.; Naz, M.; Hussain, S.; Javed, T.; Aslam, S.; Raza, A.; Ali, H.M.; Siddiqui, M.H.; Salem, M.Z. Exogenous salicylic acid-induced drought stress tolerance in wheat (Triticum aestivum L.) grown under hydroponic culture. PLoS ONE 2021, 16, e0260556. [Google Scholar] [CrossRef] [PubMed]
  9. Sammar Raza, M.A.; Saleem, M.F.; Jamil, M.; Khan, I.H. Impact of Foliar Applied Glycinebetaine on Growth and Physiology of Wheat (Triticum aestivum L.) Under Drought Conditions. Pak. J. Agric. Sci. 2014, 51, 327–334. [Google Scholar]
  10. Abdelsalam, N.R. Marker assisted-selection of major traits in egyptian bread wheat (Triticum aestivum L.) and wild wheat (Aegilops ventricosa tausch). Plant Cell Biotechnol. Mol. Biol. 2014, 15, 67–74. [Google Scholar]
  11. Salim, B.B.M.; Abou El-Yazied, A.; Salama, Y.A.M.; Raza, A.; Osman, H.S. Impact of silicon foliar application in enhancing antioxidants, growth, flowering and yield of squash plants under deficit irrigation condition. Ann. Agric. Sci. 2021, 66, 176–183. [Google Scholar] [CrossRef]
  12. Raza, S.; Saleem, M.; Khan, I.; Jamil, M.; Ijaz, M.; Khan, M. Evaluating the drought stress tolerance efficiency of wheat (Triticum aestivum L.) cultivars. Russ. J. Agric. Socio-Econ. Sci. 2012, 12. [Google Scholar]
  13. Hussain, S.; Hussain, S.; Qadir, T.; Khaliq, A.; Ashraf, U.; Parveen, A.; Saqib, M.; Rafiq, M. Drought stress in plants: An overview on implications, tolerance mechanisms and agronomic mitigation strategies. Plant Sci. Today 2019, 6, 389–402. [Google Scholar] [CrossRef]
  14. Mubarik, M.S.; Khan, S.H.; Sajjad, M.; Raza, A.; Hafeez, M.B.; Yasmeen, T.; Rizwan, M.; Ali, S.; Arif, M.S. A manipulative interplay between positive and negative regulators of phytohormones: A way forward for improving drought tolerance in plants. Physiol. Plant. 2021, 172, 1269–1290. [Google Scholar] [CrossRef]
  15. Hasanuzzaman, M.; Bhuyan, M.; Zulfiqar, F.; Raza, A.; Mohsin, S.M.; Mahmud, J.A.; Fujita, M.; Fotopoulos, V. Reactive oxygen species and antioxidant defense in plants under abiotic stress: Revisiting the crucial role of a universal defense regulator. Antioxidants 2020, 9, 681. [Google Scholar] [CrossRef] [PubMed]
  16. Mittler, R. Oxidative stress, antioxidants and stress tolerance. Trends Plant Sci. 2002, 7, 405–410. [Google Scholar] [CrossRef]
  17. Naseer, M.A.; Hussain, S.; Nengyan, Z.; Ejaz, I.; Ahmad, S.; Farooq, M.; Xiaolong, R. Shading under drought stress during grain filling attenuates photosynthesis, grain yield and quality of winter wheat in the Loess Plateau of China. J. Agron. Crop. Sci. 2021. [Google Scholar] [CrossRef]
  18. Li, M.; Yang, Y.; Raza, A.; Yin, S.; Wang, H.; Zhang, Y.; Dong, J.; Wang, G.; Zhong, C.; Zhang, H. Heterologous expression of Arabidopsis thaliana rty gene in strawberry (Fragaria x ananassa Duch.) improves drought tolerance. BMC Plant Biol. 2021, 21, 1–20. [Google Scholar] [CrossRef] [PubMed]
  19. Saleem, M.F.; Sammar Raza, M.A.; Ahmad, S.; Khan, I.H.; Shahid, A.M. Understanding and mitigating the impacts of drought stress in cotton—A review. Pak. J. Agric. Sci. 2016, 53. [Google Scholar]
  20. Abdelsalam, N.R.; Abdel-Megeed, A.; Ghareeb, R.Y.; Ali, H.M.; Salem, M.Z.; Akrami, M.; Al-Hayalif, M.F.; Desoky, E.S.M. Genotoxicity assessment of amino zinc nanoparticles in wheat (Triticum aestivum L.) as cytogenetical perspective. Saudi J. Biol. Sci. 2022, in press. [Google Scholar] [CrossRef]
  21. Chowdhury, M.K.; Hasan, M.A.; Bahadur, M.M.; Islam, M.; Hakim, M.; Iqbal, M.A.; Javed, T.; Raza, A.; Shabbir, R.; Sorour, S. Evaluation of drought tolerance of some wheat (Triticum aestivum L.) genotypes through phenology, growth, and physiological indices. Agronomy 2021, 11, 1792. [Google Scholar] [CrossRef]
  22. Bahar, A.A.; Faried, H.N.; Razzaq, K.; Ullah, S.; Akhtar, G.; Amin, M.; Bashir, M.; Ahmed, N.; Masoud, F.; Ahmar, S.; et al. Potassium-Induced Drought Tolerance of Potato by Improving Morpho-Physiological and Biochemical Attributes. Agronomy 2021, 11, 2573. [Google Scholar] [CrossRef]
  23. Islam, M.R.; Sarker, B.C.; Alam, M.A.; Javed, T.; Alam, M.J.; Zaman, M.S.U.; Azam, M.G.; Shabbir, R.; Raza, A.; Habib-ur-Rahman, M.; et al. Yield Stability and Genotype Environment Interaction of Water Deficit Stress Tolerant Mung Bean (Vigna radiata L. Wilczak) Genotypes of Bangladesh. Agronomy 2021, 11, 2136. [Google Scholar]
  24. Mahmood, T.; Wang, X.; Ahmar, S.; Abdullah, M.; Iqbal, M.S.; Rana, R.M.; Yasir, M.; Khalid, S.; Javed, T.; Mora-Poblete, F.; et al. Genetic Potential and Inheritance Pattern of Phenological Growth and Drought Tolerance in Cotton (Gossypium Hirsutum L.). Front. Plant Sci. 2021, 12, 705392. [Google Scholar] [PubMed]
  25. Zafar-ul-Hye, M.; Zahir, Z.; Shahzad, S.; Irshad, U.; Arshad, M. Isolation and screening of rhizobia for improving growth and nodulation of lentil (Lens culinaris Medic) seedlings under axenic conditions. Soil Environ. 2007, 26, 81–91. [Google Scholar]
  26. Keyvan, S. The effects of drought stress on yield, relative water content, proline, soluble carbohydrates and chlorophyll of bread wheat cultivars. J. Anim. Plant Sci. 2010, 8, 1051–1060. [Google Scholar]
  27. Xiuling, J.; Jiali, J.; Ruikun, M.; Jianli, L. A study on water use efficiency and its components in high-yielding winter wheat. Zuo Wu Xue Bao 1999, 25, 309–314. [Google Scholar]
  28. Abid, N.; Maqbool, A.; Malik, K.A. Screening commercial wheat (Triticum aestivum L.) varieties for Agrobacterium mediated transformation ability. Pak. J. Agric. Sci. 2014, 51, 83–89. [Google Scholar]
  29. Jones, H.D. Wheat transformation: Current technology and applications to grain development and composition. J. Cereal Sci. 2005, 41, 137–147. [Google Scholar] [CrossRef]
  30. Vendruscolo, E.C.G.; Schuster, I.; Negra, E.S.; Scapim, C.A. Callus induction and plant regeneration by Brazilian new elite wheat genotypes. Crop. Breed. Appl. Biotechnol. 2008, 8, 195–201. [Google Scholar] [CrossRef] [Green Version]
  31. Arnon, D.I. Copper enzymes in isolated chloroplasts. Polyphenoloxidase in Beta vulgaris. Plant Physiol. 1949, 24, 1–15. [Google Scholar] [CrossRef] [PubMed] [Green Version]
  32. Schonfeld, M.A.; Johnson, R.C.; Carver, B.F.; Mornhinweg, D.W. Water relations in winter wheat as drought resistance indicators. Crop. Sci. 1988, 28, 526–531. [Google Scholar] [CrossRef]
  33. Premachandra, G.S.; Saneoka, H.; Ogata, S. Cell membrane stability, an indicator of drought tolerance, as affected by applied nitrogen in soyabean. J. Agric. Sci. 1990, 115, 63–66. [Google Scholar] [CrossRef]
  34. Sairam, R. Effect of moisture-stress on physiological activities of two contrasting wheat genotypes. Indian J. Exp. Biol. 1994, 32, 594. [Google Scholar]
  35. Steel, R.; Torrie, J. Principle and Procedure of Statistics: A Biometrical Approach; McGraw Hill Publication Co.: New York, NY, USA, 1997; p. 633. [Google Scholar]
  36. Ashraf, M.; Bokhari, H.; Cristiti, S.N. Variation in osmotic adjustment of lentil (Lens culinaris Medik) in response to drought. Acta Bot. Neerl. 1992, 41, 51–62. [Google Scholar] [CrossRef]
  37. Tuberosa, R.; Salvi, S. Genomics-based approaches to improve drought tolerance of crops. Trends Plant Sci. 2006, 11, 405–412. [Google Scholar] [CrossRef]
  38. Dutta, P.; Bera, A.K. Screening of mung bean genotypes for drought tolerance. Legume Res. 2008, 31, 145–148. [Google Scholar]
  39. Kaur, R.; Kaur, J.; Bain, T.S. Screening of Mung bean genotypes for drought tolerance using different water potential levels. J. Adv. Agril. Technol. 2017, 4, 159–164. [Google Scholar]
  40. Tian, Y.; Guan, B.; Zhou, D.; Yu, J.; Li, G.; Lou, Y. Responses of seed germination, seedling growth, and seed yield traits to seed pretreatment in maize (Zea mays L.). Sci. World J. 2014, 2014, 1–8. [Google Scholar]
  41. Patade, V.Y.; Maya, K.; Zakwan, A. Seed priming mediated germination improvement and tolerance to subsequent exposure to cold and salt stressin capsicum. Res. J. Seed Sci. 2011, 4, 125–136. [Google Scholar]
  42. Mickky, B.M.; Aldesuquy, H.S. Impact of osmotic stress on seedling growth observations, membrane characteristics and antioxidant defense system of different wheat genotypes. Egypt. J. Basic Appl. Sci. 2017, 4, 47–54. [Google Scholar] [CrossRef] [Green Version]
  43. Bateman, A.; Lewandrowski, W.; Stevens, J.; Muñoz-Rojas, M. The limitations of seedling growth and drought tolerance to novel soil substrates in arid systems: Implications for restoration success. Geophys. Res. Abst. 2016, 18, 1–2. [Google Scholar]
  44. Din, A.; Ahmad, M.; Watto, F.M.; Ahmed, S.; Ali, I.; Shah, M.K.N. Drought tolerance screening in thirty common wheat (Triticum aestivum L.) genotypes. Sarhad J. Agric. 2020, 36, 168–177. [Google Scholar] [CrossRef]
  45. Chorfi, A.; Taıbi, K. Biochemical screening for osmotic adjustment of wheat genotypes under drought stress. Tropicult 2011, 29, 82–87. [Google Scholar]
  46. Razzaq, A.; Ali, Q.; Qayyum, A.; Mahmood, I.; Ahmad, M.; Rasheed, M. Physiological responses and drought resistance index of nine wheat (Triticum aestivum L.) cultivars under different moisture conditions. Pak. J. Bot. 2013, 45, 151–155. [Google Scholar]
  47. Maqbool, M.M.; Ali, A.; Haq, T.; Majeed, M.; Lee, D. Response of spring wheat (Triticum aestivum L.) to induced water stress at critical growth stages. Sarhad J. Agric. 2015, 31, 53–58. [Google Scholar]
  48. Naeem, M.; Ahmad, M.; Shah, M.; Kamran, M.; Iqbal, M. Character association and path analysis of osmotic adjustment, growth and physiological traits in wheat. J. Anim. Plant Sci. 2016, 26, 680–685. [Google Scholar]
  49. Sayar, R.; Khemira, H.; Kameli, A.; Mosbahi, M. Physiological tests as predictive appreciation for drought tolerance in durum wheat (Triticum durum Desf.). Agron. Res. 2008, 6, 79–90. [Google Scholar]
  50. Sultan, M.A.R.F.; Hui, L.; Yang, L.J.; Xian, Z.H. Assessment of drought tolerance of some Triticum L. species through physiological indices. Czech J. Genet. Plant Breed. 2012, 48, 178–184. [Google Scholar] [CrossRef]
  51. Nezhadahmadi, A.; Prodhan, Z.H.; Faruq, G. Drought tolerance in wheat. Sci. World J. 2013, 2013, 610721. [Google Scholar] [CrossRef] [Green Version]
  52. Ali, M.; Abbas, A.; Awan, S.; Jabran, K.; Gardezi, S. Correlated response of various morpho-physiological characters with grain yield in sorghum landraces at different growth phases. J. Anim. Plant Sci. 2011, 21, 671–679. [Google Scholar]
  53. Ahmad, A.; Ilyas, M.Z.; Aslam, Z.; Roman, M.; Ali, A.; Naeem, S.; Nazar, M.; ur Rehman, S. Physiological screening of cotton (Gossypium hirsutum L.) genotypes against drought tolerance. Pure Appl. Biol. (PAB) 2020, 9, 140–147. [Google Scholar] [CrossRef]
  54. Ahmad, A.; Aslam, Z.; Bellitürk, K.; Ibrahim, M.U.; Nadeem, M.; Yilmaz, K.; Ali, U.; Akbar, G. Morphological study of cotton (Gossypium hirsutum L.) varieties against drought tolerance under greenhouse conditions. Pure Appl. Biol. (PAB) 2020, 9, 696–703. [Google Scholar] [CrossRef]
  55. Lawlor, D.W.; Cornic, G. Photosynthetic carbon assimilation and associated metabolism in relation to water deficits in higher plants. Plant Cell Environ. 2002, 25, 275–294. [Google Scholar] [CrossRef] [Green Version]
  56. Ahmadizadeh, M. Physiological and agro-morphological response to drought stress. Middle-East J. Sci. Res. 2013, 13, 998–1009. [Google Scholar]
  57. Brown, S.B.; Houghton, J.D.; Hendry, G.A.F. Chlorophyll breakdown. In Chlorophyllus; Scheer, H., Ed.; CRC Press: Boca Raton, FL, USA, 1991; p. 465. [Google Scholar]
  58. Lv, S.; Feng, K.; Peng, S.; Wang, J.; Zhang, Y.; Bian, J.; Nie, X. Comparative analysis of the transcriptional response of tolerant and sensitive wheat genotypes to drought stress in field conditions. Agronomy 2018, 8, 247. [Google Scholar] [CrossRef] [Green Version]
  59. Farshadfar, E.; Ghasemi, M.; Rafii, F. Evaluation of physiological parameters as a screening technique for drought tolerance in bread wheat. J. Biodiv. Environ. Sci. 2014, 4, 175–186. [Google Scholar]
  60. Sikuku, P.A.; Netondo, G.W.; Onyango, J.C.; Musyimi, D.M. Chlorophyll fluorescence, protein and chlorophyll content of three nerica rainfed rice varieties under varying irrigation regimes. J. Agric. Biol. Sci. 2010, 5, 19–25. [Google Scholar]
  61. Rana, M.S.; Hasan, M.A.; Bahadur, M.M.; Islam, M.R. Physiological evaluation of wheat genotypes for tolerance to water deficit stress. Bangladesh Agron. J. 2017, 20, 37–52. [Google Scholar] [CrossRef]
  62. Medrano, H.; Escalona, J.M.; Bota, J.; Gulias, J.; Flexas, J. Regulation of photosynthesis of C3 plants in response to progres-sive drought: Stomatal conductance as a reference parameter. Ann. Bot. 2002, 89, 895–905. [Google Scholar] [CrossRef] [PubMed]
  63. Wright, H.; De Longa, J.; Ladab, R.; Prangea, R. The relationship between water status and chlorophyll a fluorescence in grapes (Vitis spp.). Postharvest Biol. Technol. 2009, 51, 193–199. [Google Scholar] [CrossRef]
  64. Flexas, J.; Medrano, H. Energy dissipation in C3 plants under drought. Funct. Plant Biol. 2002, 29, 1209–1215. [Google Scholar] [CrossRef] [PubMed]
  65. Herzog, H. Source and Sink during Reproductive Period of Wheat; Scientific Publishers: Berlin/Hamburg, Germany, 1986; pp. 147–148. [Google Scholar]
  66. Hosseinzadeh, S.R.; Amiri, H.; Ismaili, A. Evaluation of photosynthesis, physiological, and biochemical responses of chick-pea (Cicer arietinum L. cv. Pirouz) under water deficit stress and use of vermicompost fertilizer. J. Integr. Agric. 2018, 17, 2426–2437. [Google Scholar] [CrossRef] [Green Version]
  67. Tang, A.C.; Kawamitsa, Y.; Kanechi, M.; Boyer, J.S. Photosynthesis at low water potentials in leaf discs lacking epidermis. Ann. Bot. 2002, 89, 861–870. [Google Scholar] [CrossRef] [PubMed] [Green Version]
  68. Serragoa, R.A.; Alzuetaa, I.; Savinb, R.; Slafer, G.A. Understanding grain yield responses to source-sink ratios during grain filling in wheat and barley under contrasting environments. Field Crop. Res. 2013, 150, 42–51. [Google Scholar] [CrossRef] [Green Version]
  69. Maralian, F.; Ebadi, A.; Didar, T.R.; Haji-Eghrari, B. Influence of water stress on wheat grain yield and proline accumulation rate. Afr. J. Agril. Res. 2010, 5, 286–289. [Google Scholar] [CrossRef]
  70. Li, Y.P.; Ye, W.; Wang, M.; Yan, X.D. Climate change and drought: A risk assessment of crop yield impacts. Clim. Res. 2009, 39, 31–46. [Google Scholar] [CrossRef]
  71. Sallam, A.; Alqudah, A.M.; Mona, F.A.; Dawood, M.F.A.; Baenziger, P.S.; Börner, A. Drought Stress Tolerance in Wheat and Barley: Advances in Physiology, Breeding and Genetics Research. Int. J. Mol. Sci. 2019, 20, 3137. [Google Scholar] [CrossRef] [PubMed] [Green Version]
  72. Youldash, K.M.; Barutcular, C.; EL Sabagh, A.; Toptas, I.; Kayaalp, G.T.; Hossain, A.; Alharby, H.; Bamagoos, A.; Saneoka, H.; Farooq, M. Evaluation of grain yield in fifty-eight spring bread wheat genotypes grown under heat stress. Pak. J. Bot. 2020, 52, 33–42. [Google Scholar] [CrossRef]
  73. Javed, T.; Shabbir, R.; Ali, A.; Afzal, I.; Zaheer, U.; Gao, S.J. Transcription factors in plant stress responses: Challenges and potential for sugarcane improvement. Plants 2020, 9, 491. [Google Scholar] [CrossRef] [PubMed]
  74. Shabbir, R.; Javed, T.; Afzal, I.; Sabagh, A.E.; Ali, A.; Vicente, O.; Chen, P. Modern Biotechnologies: Innovative and Sustainable Approaches for the Improvement of Sugarcane Tolerance to Environmental Stresses. Agronomy 2021, 11, 1042. [Google Scholar] [CrossRef]
Figure 1. Weather data (average temperature (Avg. Temp., °C), relative humidity (R.H, %) and rainfall (R.F, mm)) during the growing season of the wheat crop.
Agronomy 12 00287 g001
Figure 2. Principal component analysis (Pearson n) among observations (genotypes) and variables (attributes) of wheat under drought stress conditions. The observations are labeled with blue colored text, whereas the attributes of drought stressed (WS) and well-watered (WW) plants are shown in red and green color, respectively. Abbreviations: tillers—number of tillers; spikelets—number of spikelets per spike; grains/spike—number of grains per spike; 100-grains—hundred grain weight; Ec-yield—seed yield; B-yield—biological yield; N—leaf nitrogen; P—leaf phosphorus; K—leaf potassium; Chl a—Chlorophyll a; Chl b—chlorophyll b; Chl-SPAD—SPAD values; RWC—relative water content; MSI—membrane stability index.
Agronomy 12 00287 g002
Table 1. Physio-chemical parameters of soil before sowing of the wheat crop.
ParametersValues
pH8.2
EC1.40 (dSm−1)
Organic Matter1.08 (%)
Nitrogen0.042 (%)
Phosphorus4 (ppm)
Potassium320 (ppm)
Textural classLoam
Table 2. Analysis of water used for irrigation.
ParametersValues (Units)
Extra Sodium Bicarbonate (RSC)Not found
Sodium Adsorption Ratio (SAR)0.64 (mmolc L−1)
Sulphate (SO4)−2Not found
Chloride (Cl)−10.81 (mmolc L−1)
Bicarbonate (HCo)−27.01 (mmolc L−1)
Carbonate (Co)−2Not found
Sodium (Na)+11.24 (mmolc L−1)
Calcium+Magnesium (Ca+Mg)+27.13 (mmolc L−1)
Electrical conductivity (ECx10)843 (mmolc L−1)
Table 3. Number of tillers, number of spikelets per spike, number of grains per spike, 100-grain weight, seed yield, biological yield and leaf nitrogen contents of different wheat varieties under well-watered (WW) and water deficit stress (WS) conditions.
Wheat VarietiesNumber of Tillers per PlantNumber of Spikelets per SpikeNumber of Grains per Spike100-Grain Weight (g)Seed Yield (g plant−1)Biological Yield (g plant−1)Leaf Nitrogen Contents (mg g−1 DW)
WWWSWWWSWWWSWWWSWWWSWWWSWWWS
Akbar-20196.11 a4.25 fgh26.00 a14.33 ghi50.66 a33.66 kl5.83 a2.88 gh6.21 a3.18 ijk17.83 a9.01 ijk21.16 a12.20 hij
Ghazi-20195.91 abc4.31 fg24.58 abc14.83 gh46.33 d34.33 k5.200 c2.96 g5.84 bc3.26 ij16.70 cd9.23 ij19.33 bcd12.91 hi
Anaj-20175.66 cde4.05 fghij22.05 ef13.16 hij41.00 h31.00 no4.38 de2.53 ijk5.16 fg2.92 klm15.83 fg8.53 klm17.63 efg11.70 ijk
Ujala-20165.69 bcde3.79 jk22.50 def11.88 jk43.00 g27.16 qr4.500 de2.03 lm5.28 ef2.28 o16.08 ef7.8 no18.05 defg11.00 jk
Zincol-20165.87 abc4.20 fghi24.16 abcd14.00 ghi45.16 de32.500 lm5.03 c2.78 ghi5.76 cd3.09 jkl16.56 de8.95 jk18.97 bcde12.98 hi
Galaxy-20136.00 ab3.68 k25.08 ab11.16 k48.00 c26.00 r5.33 bc1.93 m5.98 abc2.11 o17.13 bc7.43 o19.93 abc10.33 k
Pakistan-20135.71 bcd4.13 fghi22.91 cdef13.55 ghij43.83 fg31.83 mn4.60 d2.61 hij5.50 de3.02 jkl16.21 def8.67 kl18.41 cdefg11.86 jk
Millat-20115.52 de3.98 ghijk21.66 ef12.91 hijk40.00 h30.16 o4.200 ef2.40 jk5.00 gh2.84l mn15.45 g8.30l mn17.18 fg11.46 ijk
Lasani-20085.82 abcd3.95 hijk23.50 bcde12.66 jk44.50 ef28.66 p4.68 d2.33 jkl5.55 d2.70 mn16.36 def8.01 mn18.73 cdef11.26 jk
Faisalabad-20086.06 a4.35 f25.50 a15.33 g49.33 b35.66 j5.61 ab3.06 g4.88 h3.39 i17.46 ab9.50 i20.60 ab13.50 h
Seher-20085.36 e3.90 ijk21.00 f12.00 jk38.66 i27.83 pq4.01 f2.2000 klm2.61 n2.61 n14.66 h7.91 no16.82 gs11.150 jk
Drought (WS)49.93 **1744.82 **3063.96 **89.71 **121.50 **1029.92 **797.47 **
Variety (V)0.21 **9.90 **51.07 **1.10 **0.73 **2.68 **5.96 **
WS × V0.086 *3.40 *19.55 **0.37 **0.35 **1.06 **2.53 *
LSD ≤ 0.054.126.582.105.613.802.626.43
Means not sharing the common letter differ significantly, * Significant at 0.05 level of significance, ** Significant at 0.01 level of significance, LSD = Least significant difference test.
Table 4. Leaf phosphorus content, leaf potassium content, chlorophyll a, chlorophyll b, chlorophyll (Spade value), leaf relative water content and membrane stability index in wheat varities under well-watered (WW) and water deficit stress (WS) conditions.
Wheat GenotypesLeaf Phosphorus Content (mg g−1 DW)Leaf Potassium Content (mg g−1 DW)Chlorophyll a (mg g−1 FW)Chlorophyll b (mg g−1 FW)Chlorophyll (Spade Value)Leaf Relative Water Content (%)Membrane Stability Index (%)
WWWSWWWSWWWSWWWSWWWSWWWSWWWS
Akbar-20196.26 a3.73 jk6.52 ab3.69 d2.81 a1.34 hi0.96 ab0.36 ijk56.00 a34.00 kl91.33 a73.00 hi85.66 a70.00 ij
Ghazi-20195.98 bc3.91 ij5.95 bc3.74 d2.65 bc1.38 hi0.97 a0.38 ij52.66 cd35.66 jk87.66 bc74.00 h81.33 bc71.00 hi
Anaj-20175.28 fg3.41l m5.57 bc3.41 d2.26 f1.26 ij0.77 f0.32 klm45.00 h30.33 no81.33 efg69.33 jkl76.33 ef66.00 kl
Ujala-20165.43 ef2.81 pq5.68 bc3.05 d2.35 ef1.06 kl0.80 ef0.27 no47.00 g25.66 rs82.66 def62.66 n77.33 def61.66 no
Zincol-20165.78 cd3.66 k5.87 bc3.61 d2.58 c1.32 hi0.88 cd0.35 jk51.33 de33.00 lm90.0 ab71.66 hij81.00 bc72.33 ghi
Galaxy-20136.10 ab2.63 q6.36 abc2.96 d2.71 ab1.02 l0.92 bc0.24 o53.33 bc24.33 s89.00 ab62.66 n83.33 ab59.33 o
Pakistan-20135.53 e3.56 kl5.75 bc3.50 d2.41 de1.28 ij0.83 de0.34 jkl49.00 f31.66 mn83.66 de70.33 ijk78.66 cde68.00 jk
Millat-20115.15 gh3.25 mn5.5 bc3.28 d2.22 fg1.18 jk0.72 g0.30 lmn43.33 h29.00 op79.66 fg67.66 klm74.66 fg65.00 lm
Lasani-20085.63 de3.10 no7.14 a3.20 d2.52 cd1.12 kl0.89 c0.29 mn50.00 ef27.66 pq85.33 cd66.0 lmn79.33 cd63.33 lmn
Faisalabad-20086.18 ab4.01 i6.45 ab3.78 d2.76 ab1.42 h0.94 ab0.39 i54.66 ab36.66 j90.33 ab71.66 hij84.66 a72.00 ghi
Seher-20085.06 h2.98 op5.39 c3.46 d2.10 g1.09 kl0.67 h0.28 no41.33 i26.66 qr78.33 g65.33 mn73.33 gh62.33 mn
Drought (WS)87.37 **110.91 **26.42 **4.64 **5956.50 **4667.05 **2853.88 **
Variety (V)0.82 **0.544 ns0.15 **0.02 **90.91 **80.75 **79.96 **
WS × V0.32 **0.553 ns0.06 **0.01 **28.97 **29.71 **29.65 **
LSD ≤ 0.052.7513.434.214.622.702.812.32
Means not sharing the common letter differ significantly, ** Significant at 0.05 level of significance, ns = Non-significant, LSD = Least significant difference test.
Publisher’s Note: MDPI stays neutral with regard to jurisdictional claims in published maps and institutional affiliations.

