
Ground-Based Thermal Imaging for Assessing Crop Water Status in Grapevines over a Growing Season

 ,
,  and
and 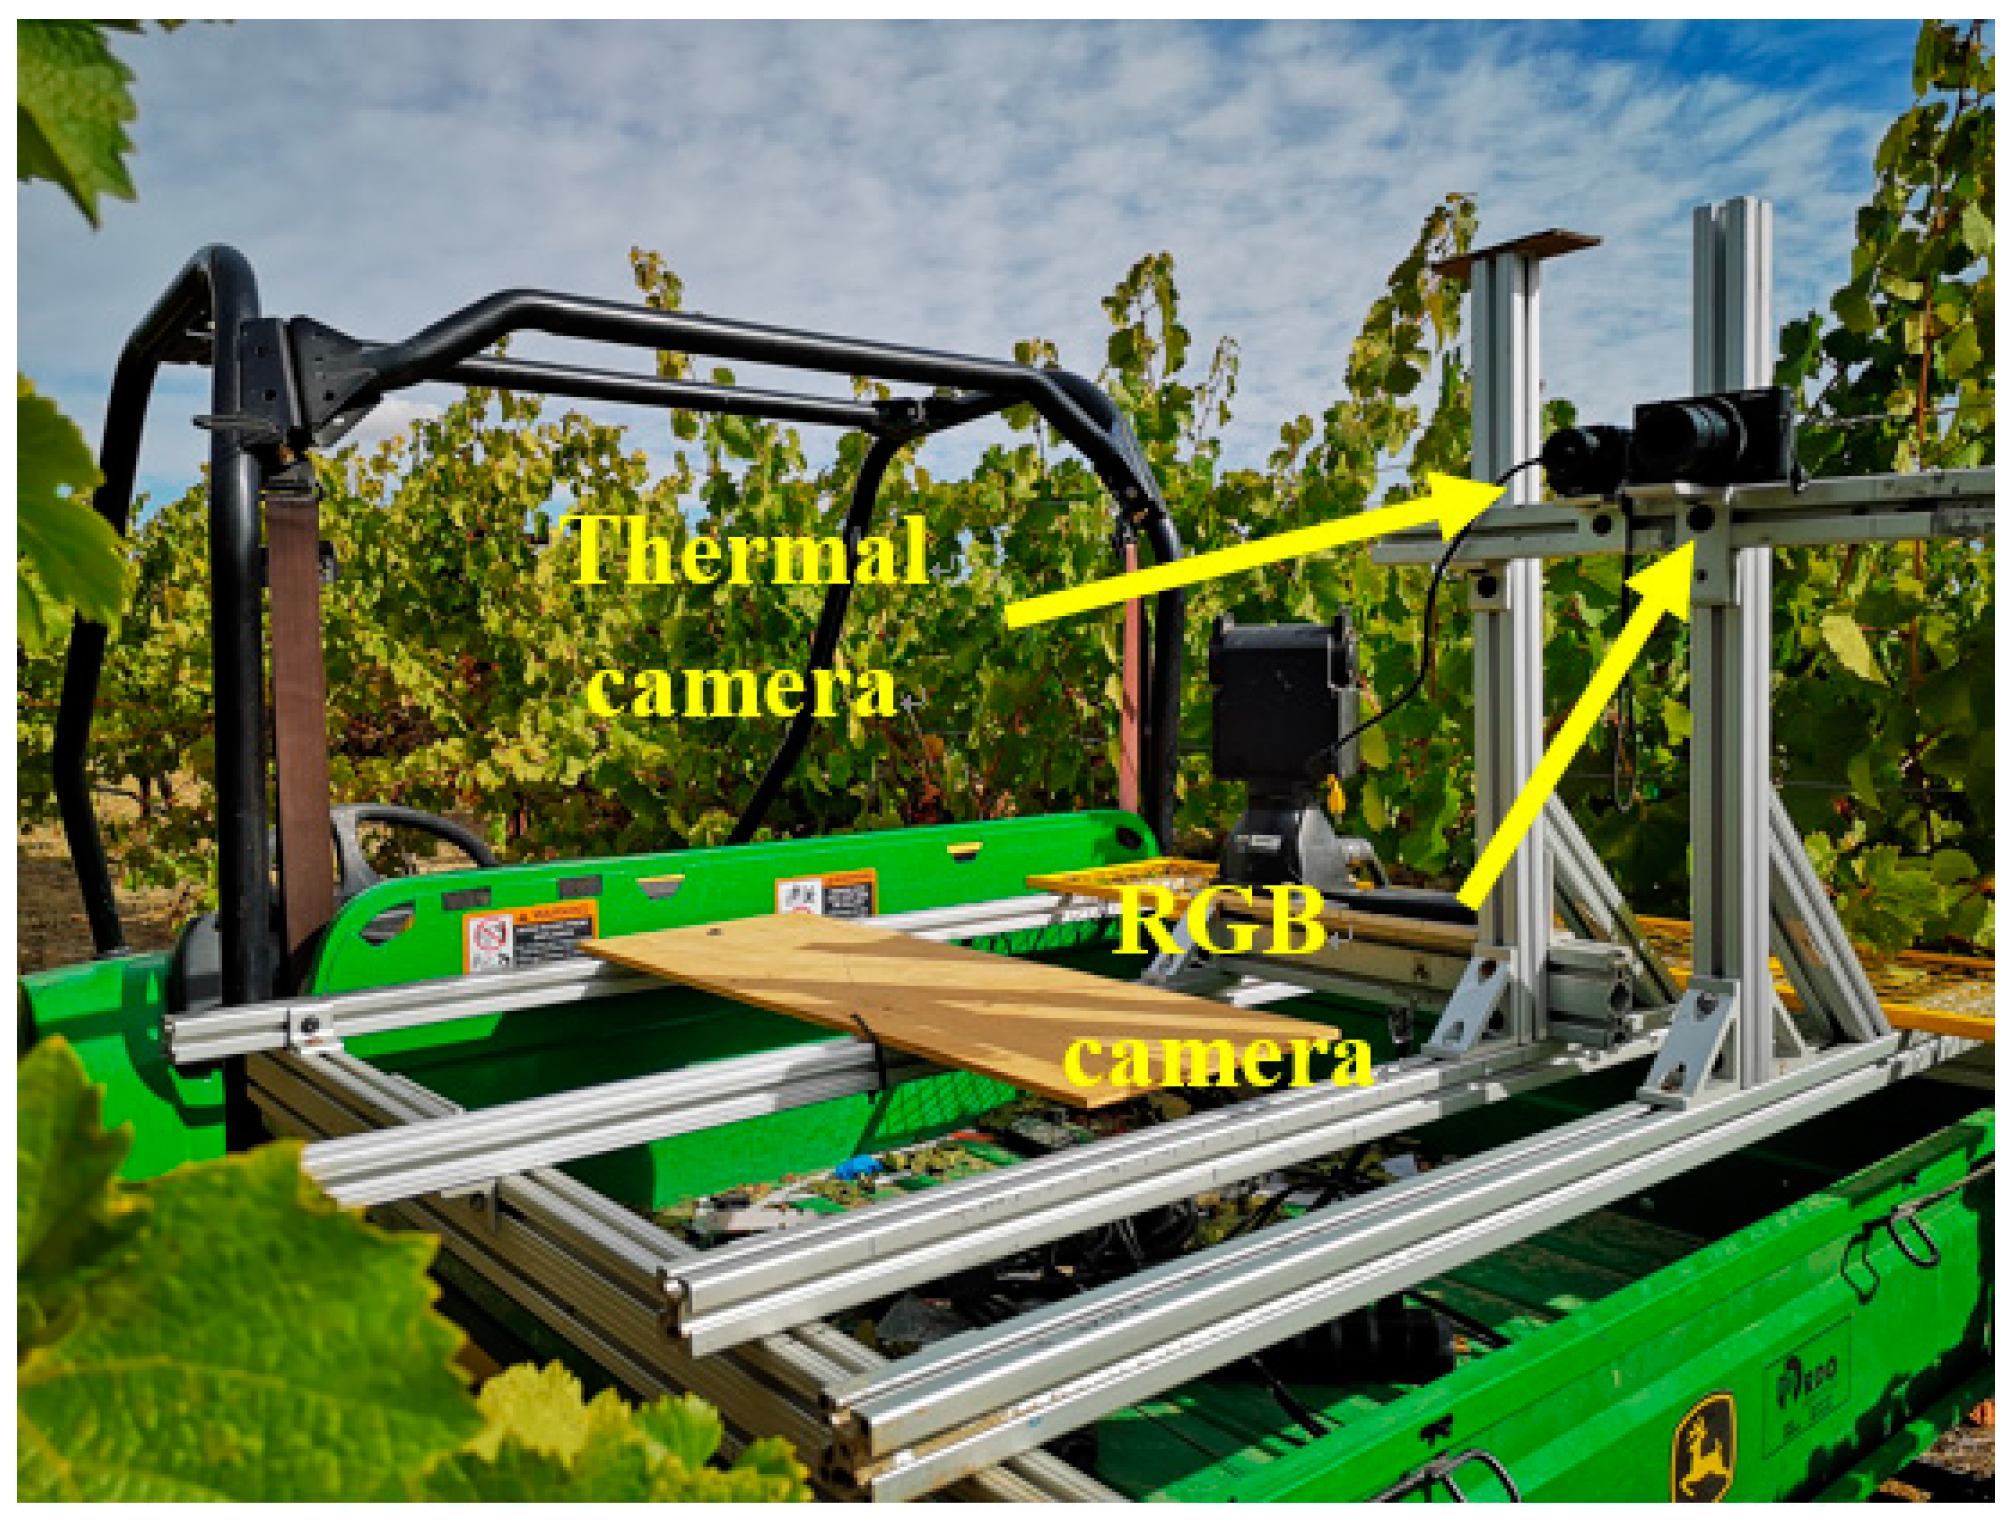
Abstract
:1. Introduction
2. Material and Methods
2.1. Study Site
2.2. Image Acquisition and Field Measurement
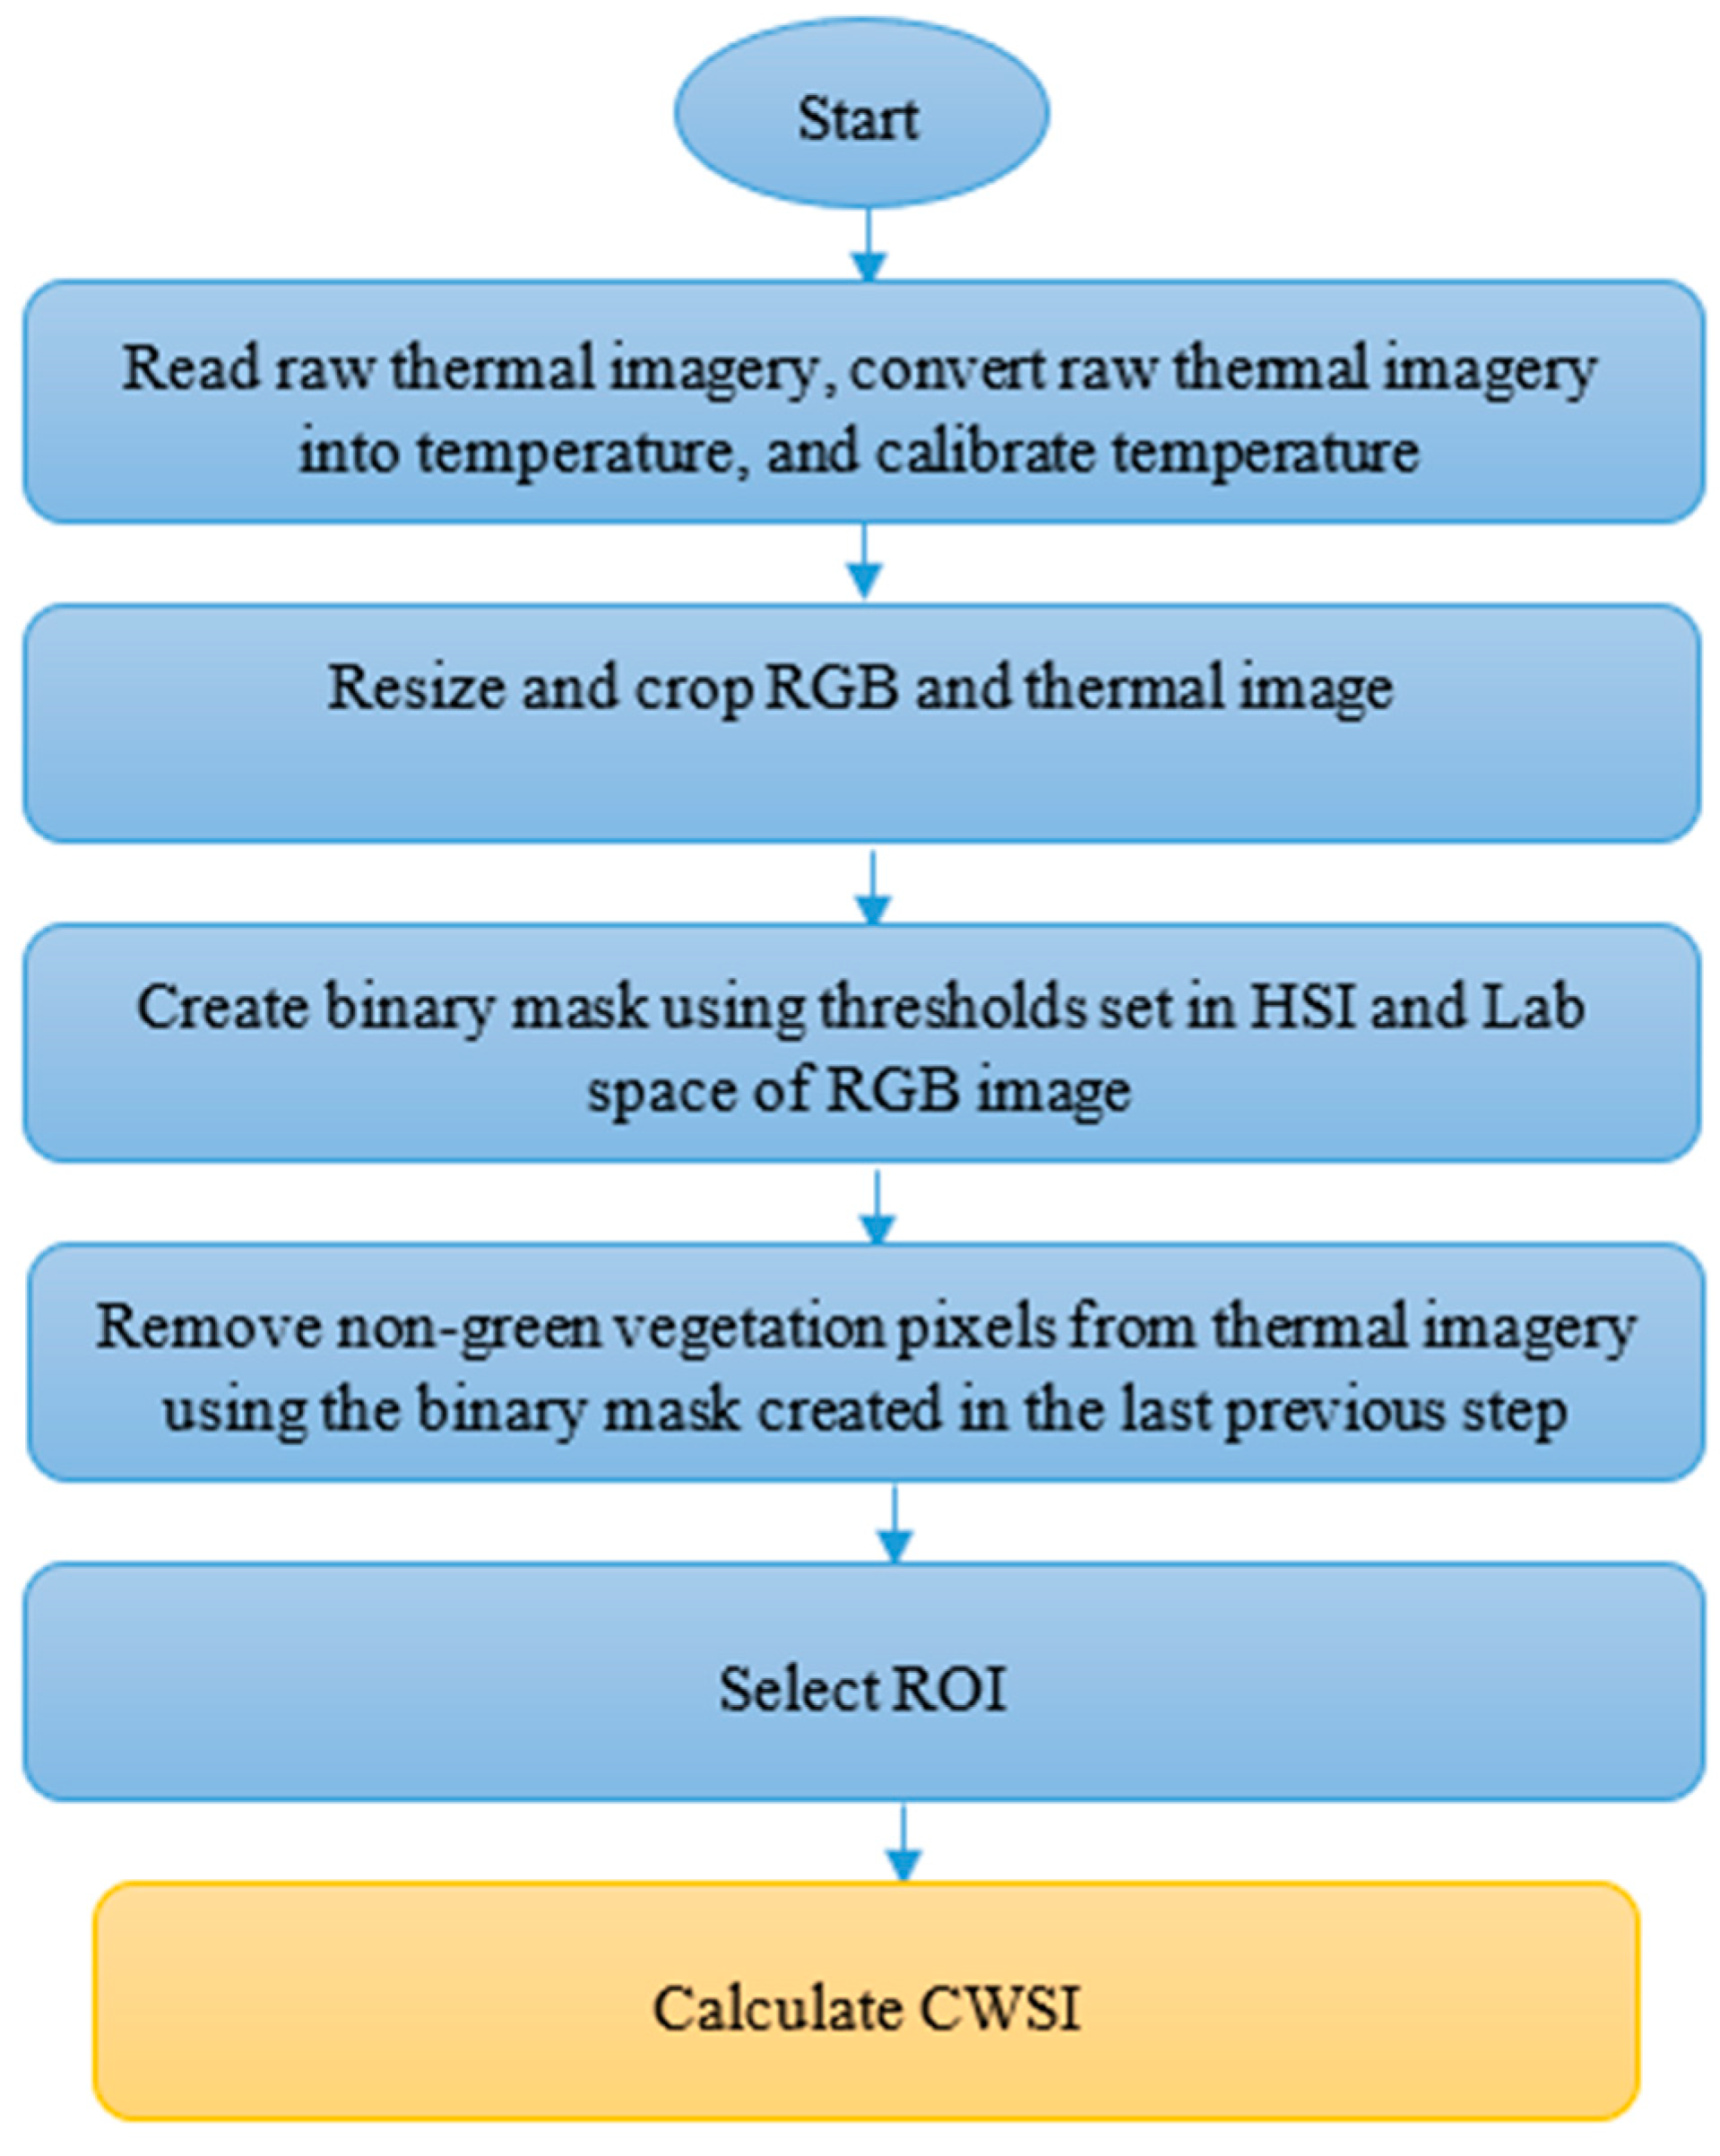
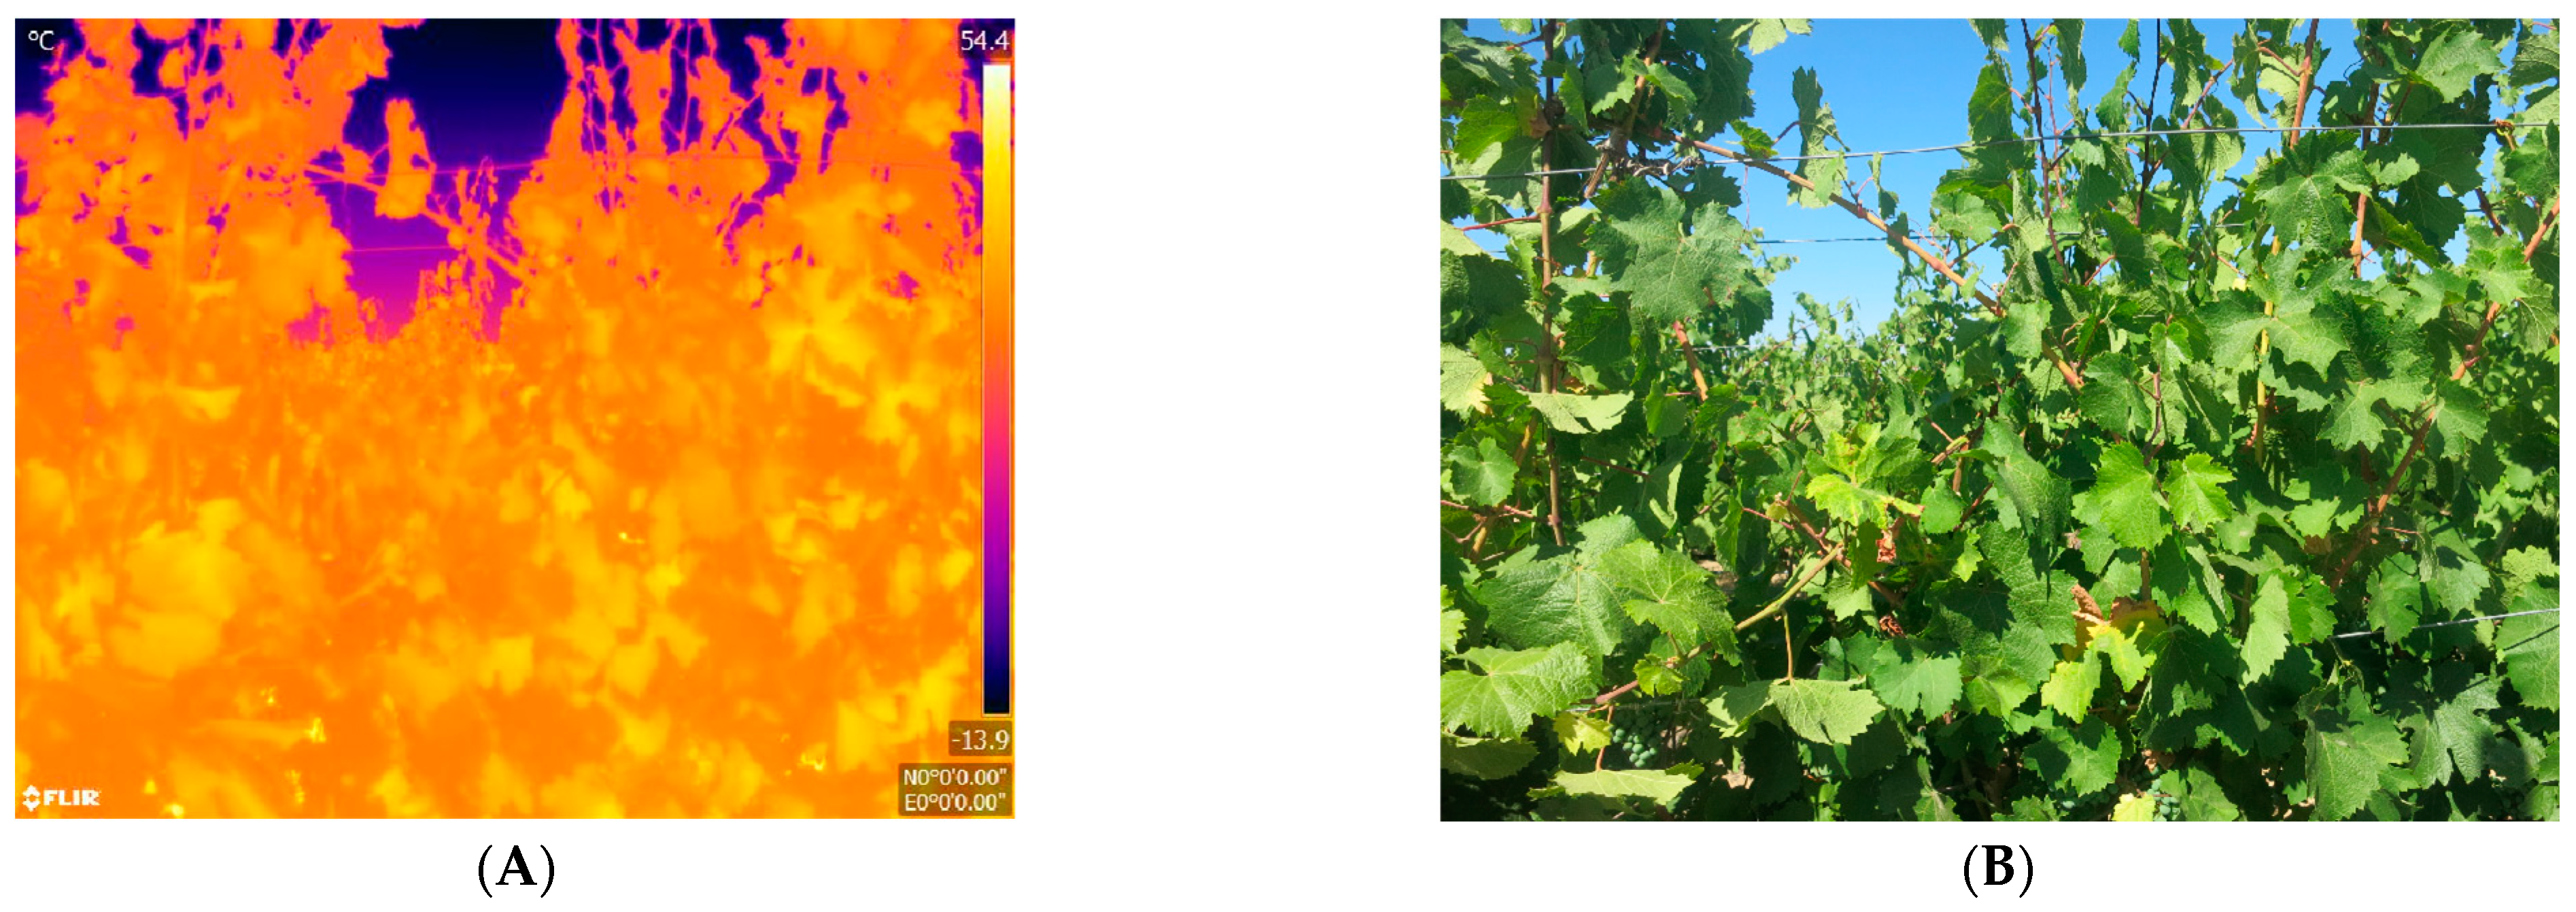
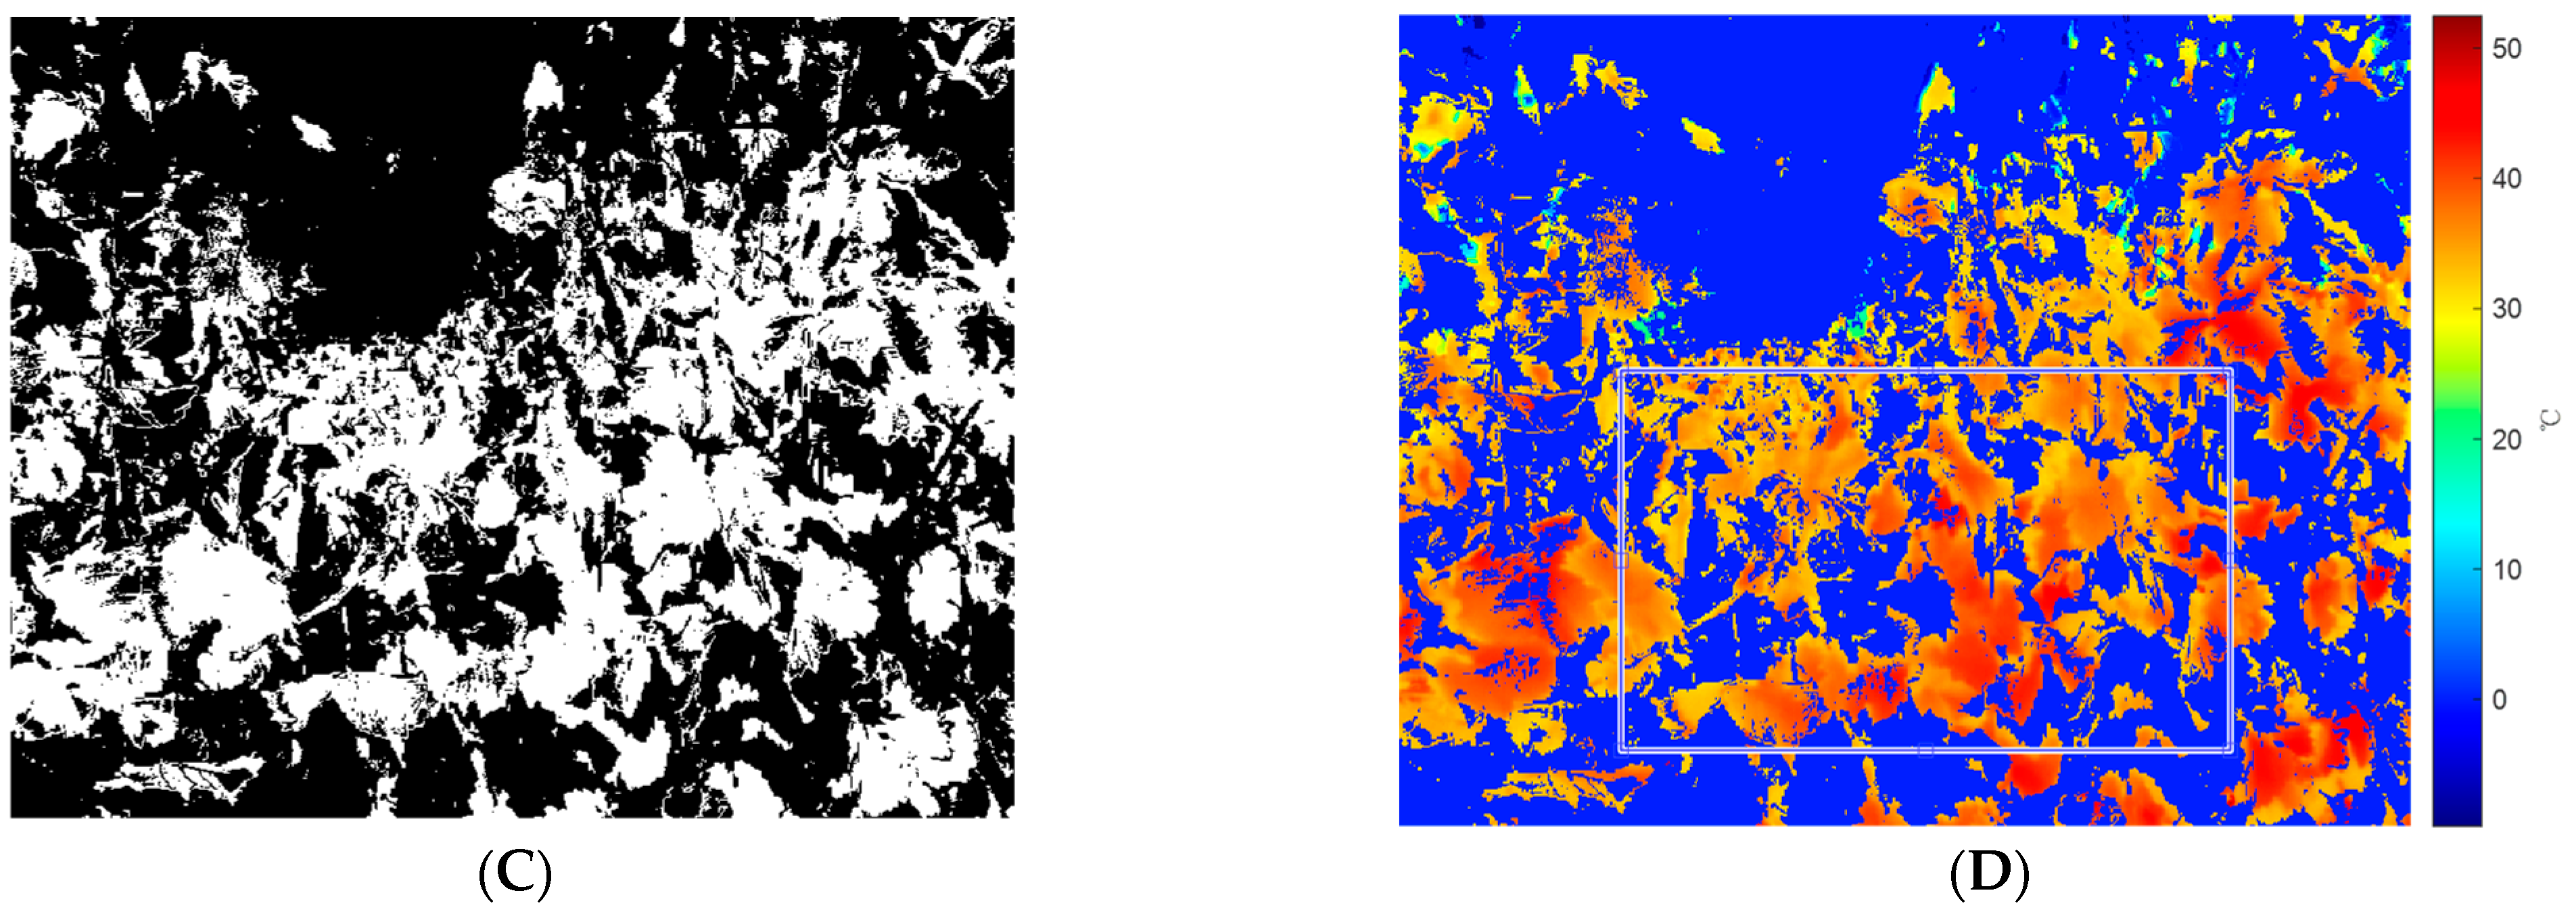
2.3. Image Processing
2.4. CWSI Calculation
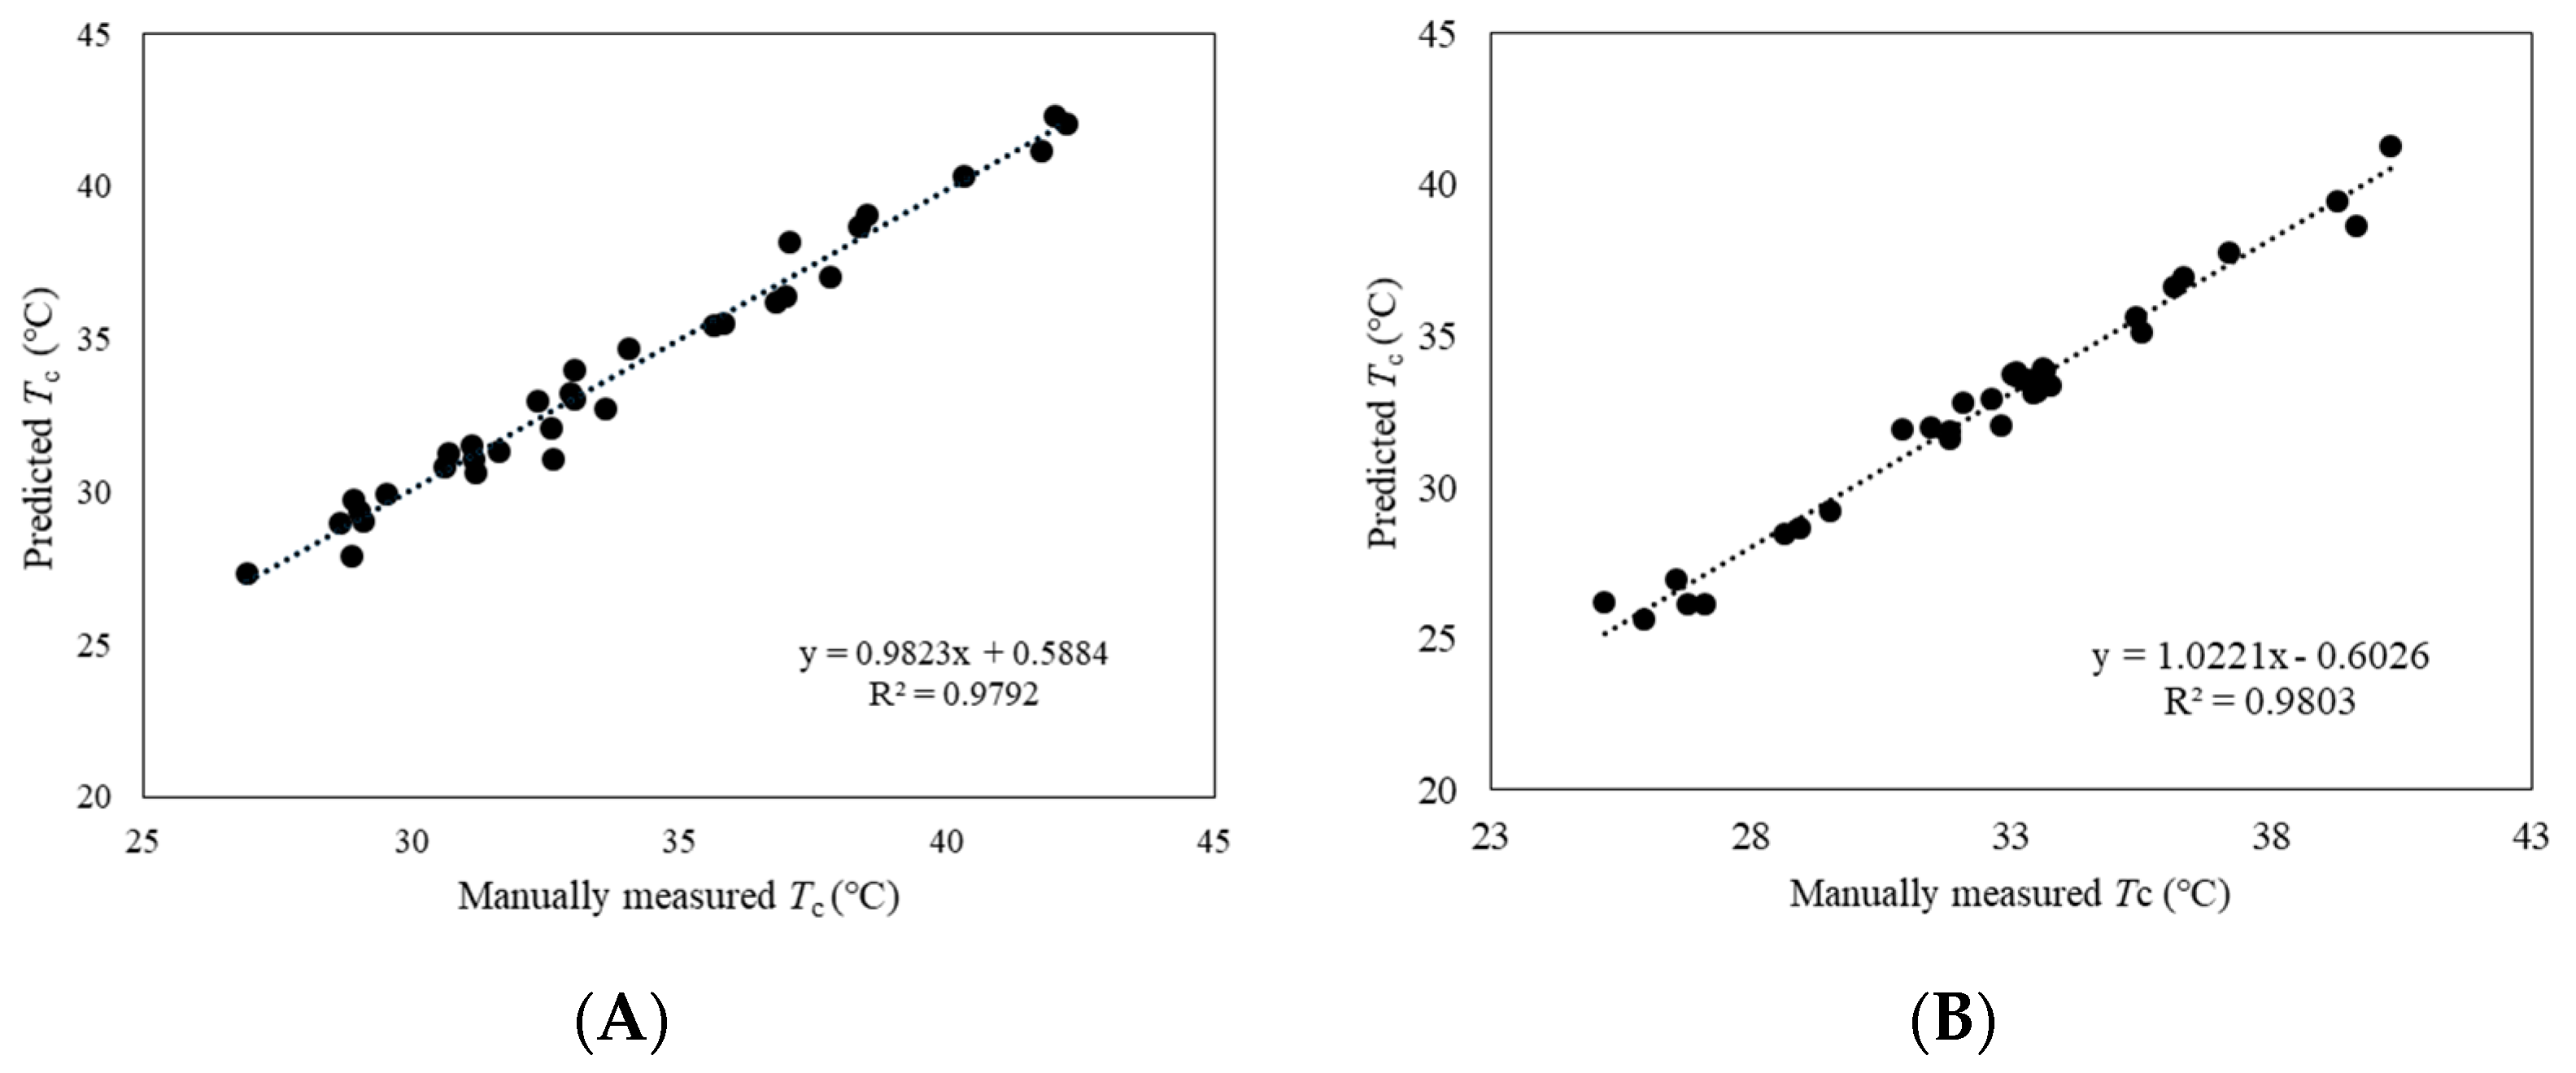
2.4.1. Determination of Canopy Temperature (Tc)
2.4.2. Determination of CWSIe and CWSIs
3. Results and Discussion
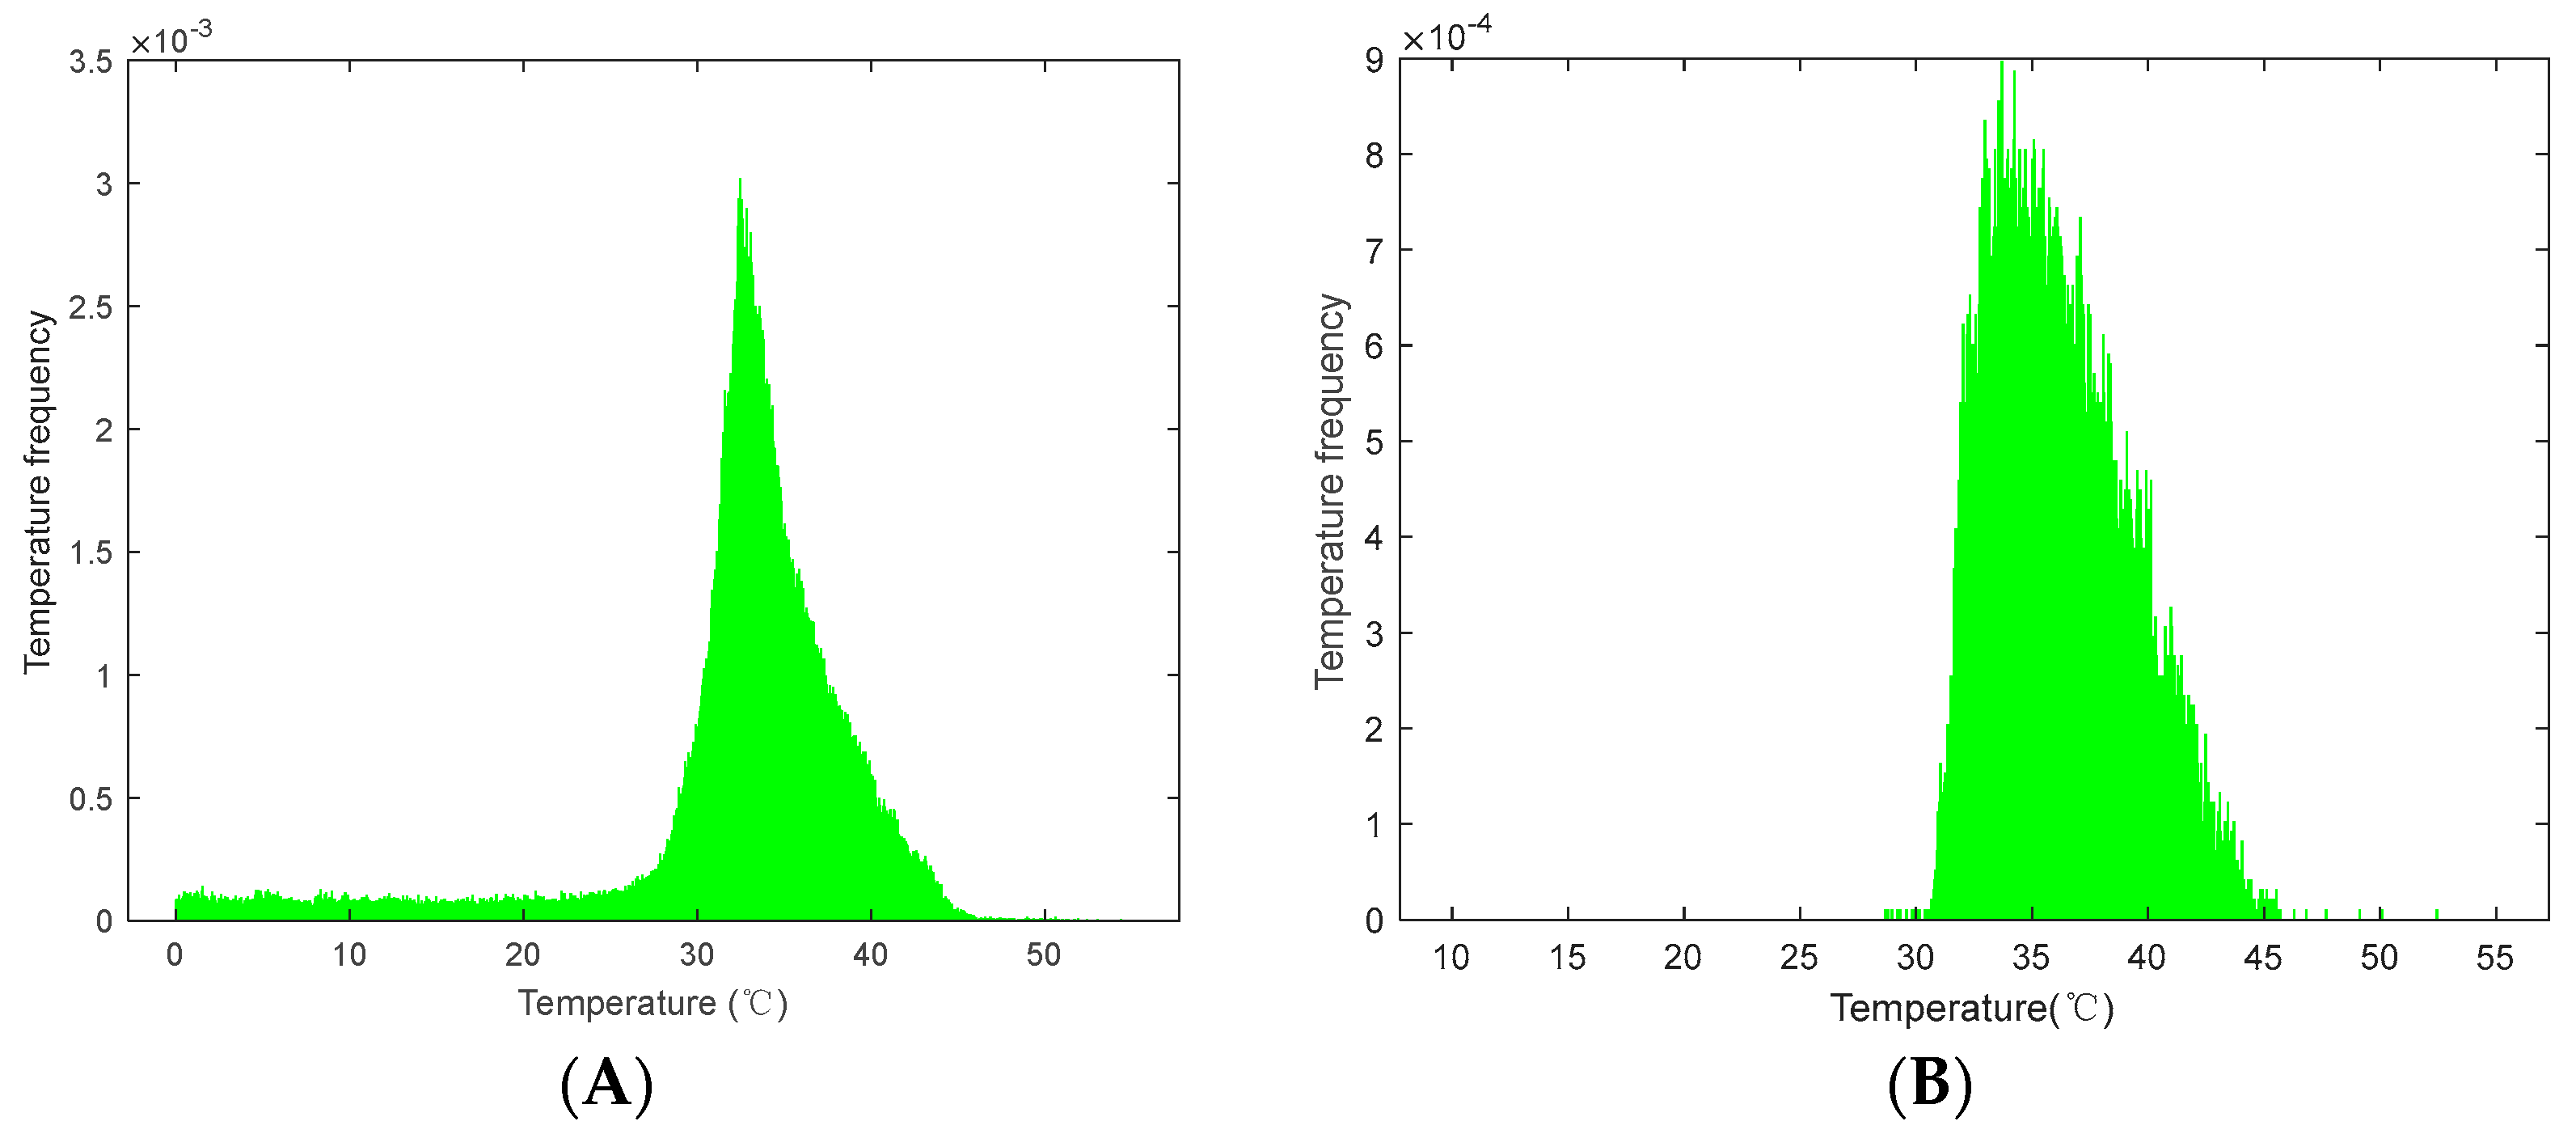
3.1. ROI Identification
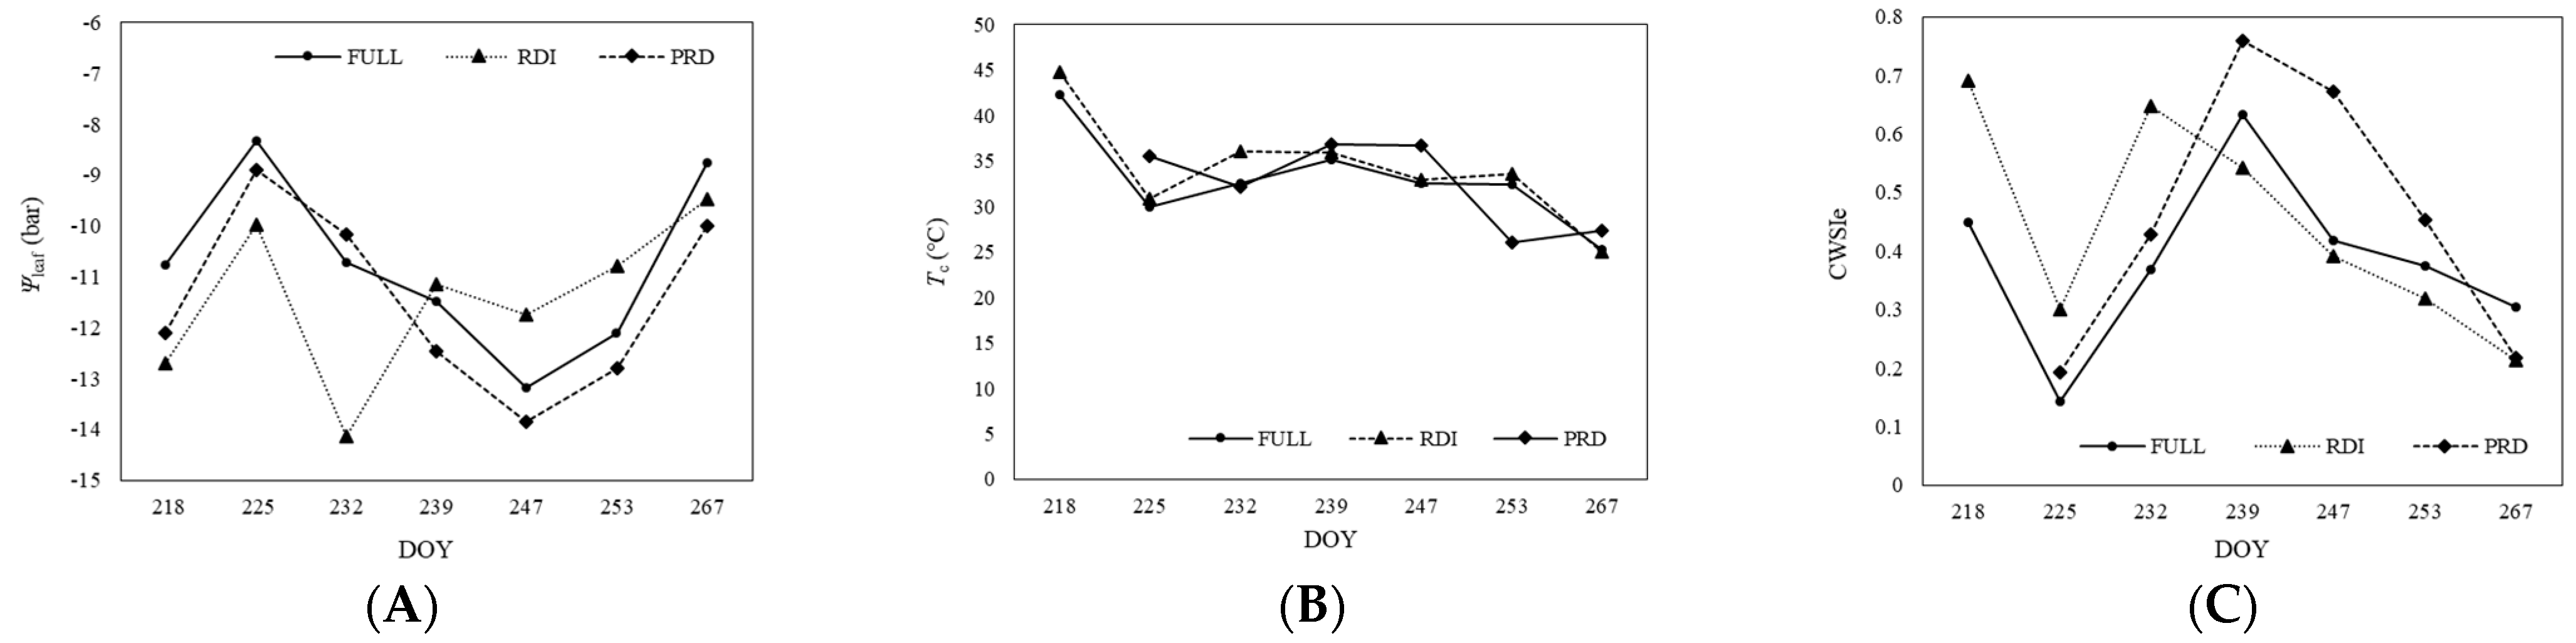
3.2. Variation of Ψleaf and CWSI
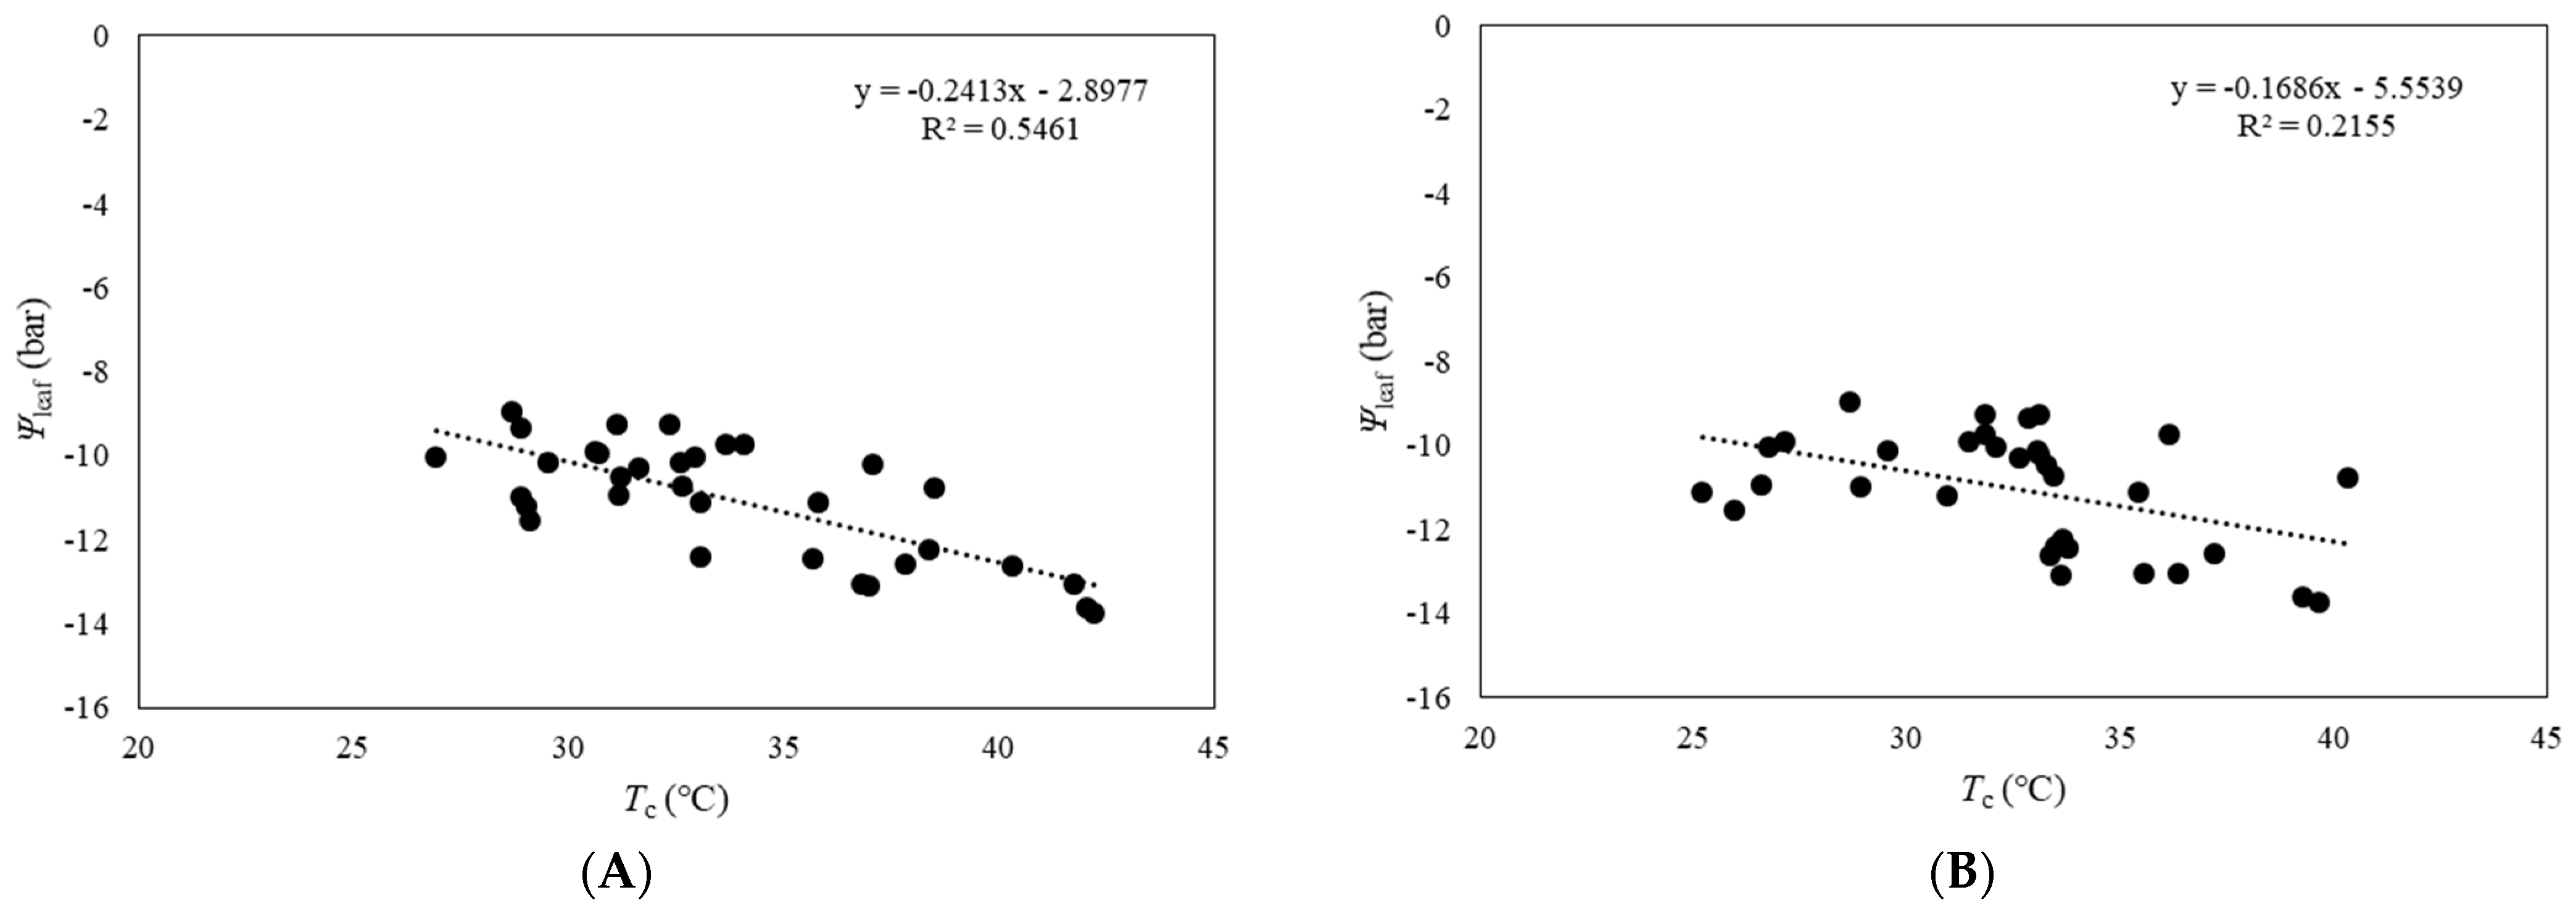
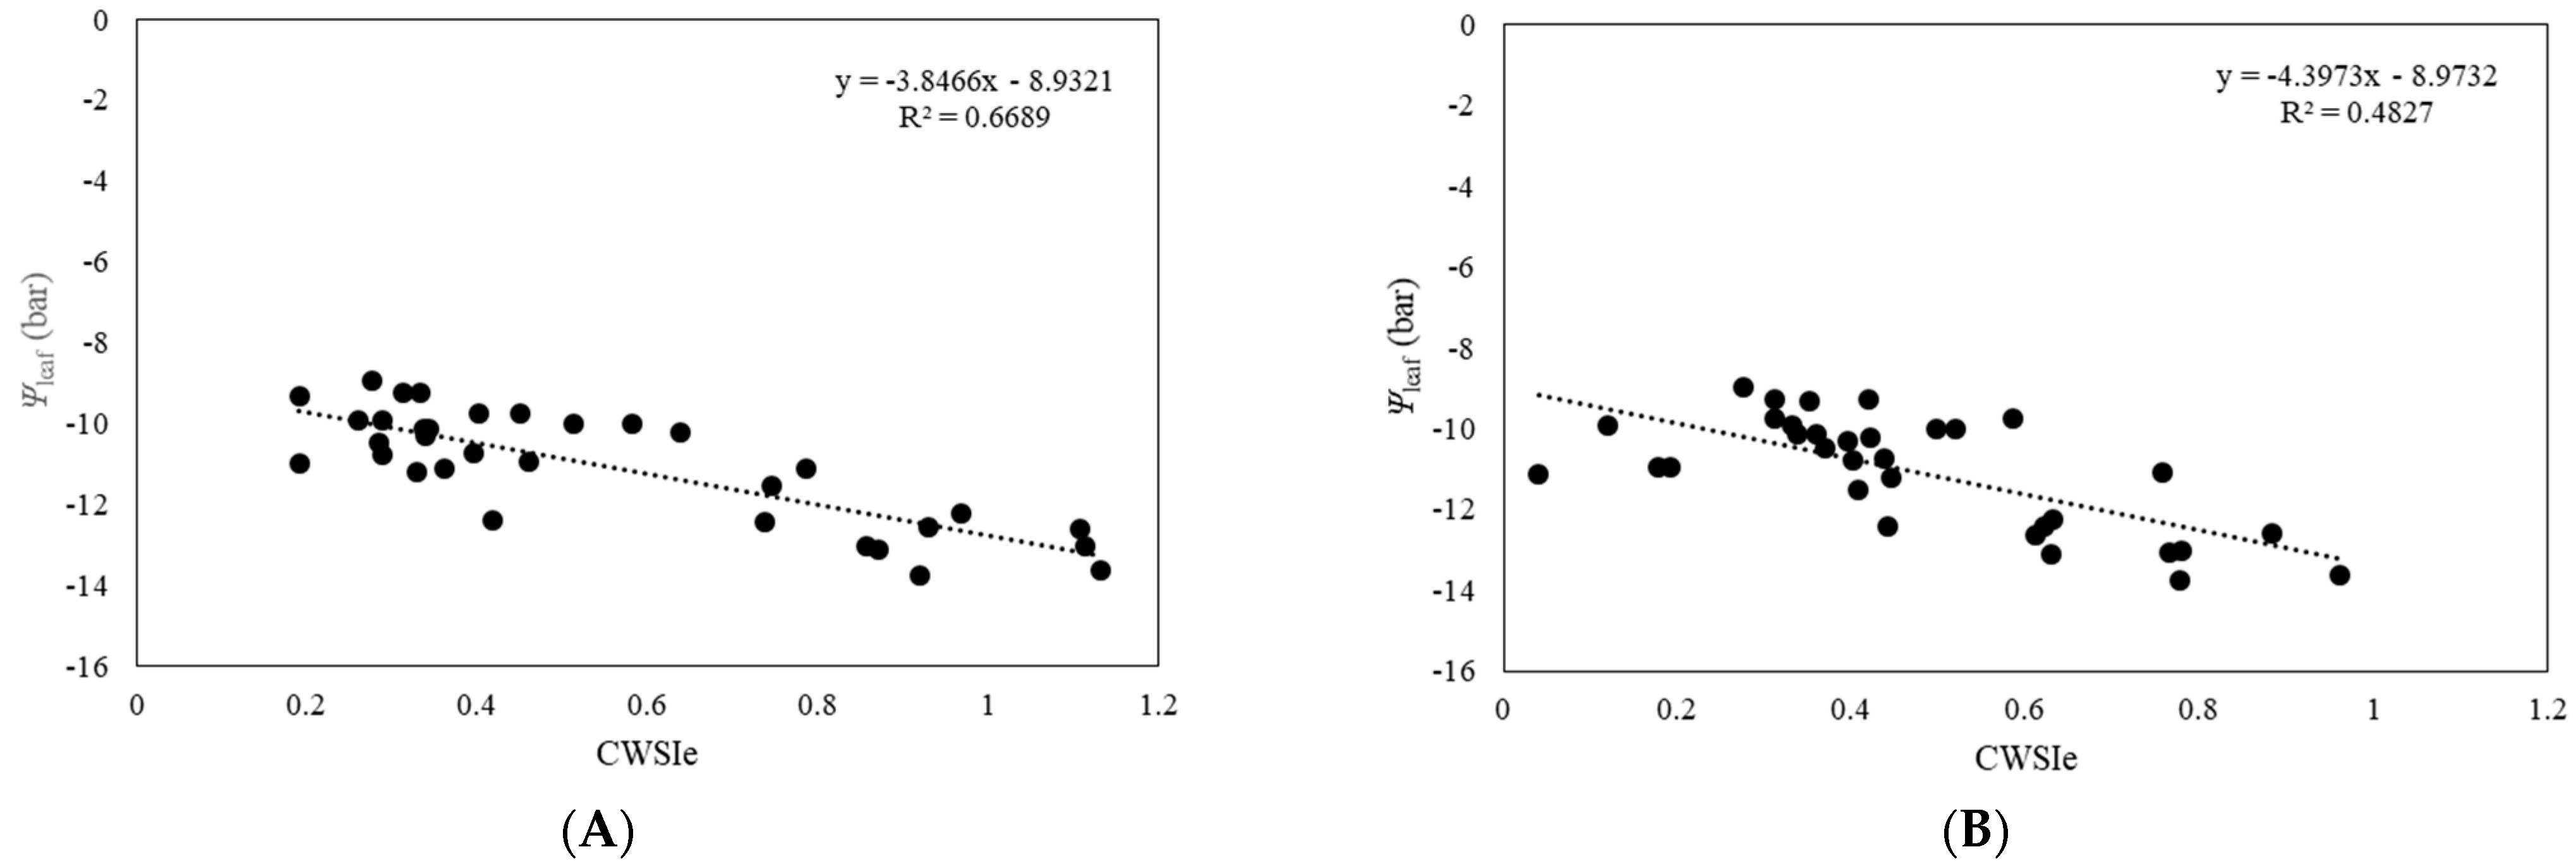
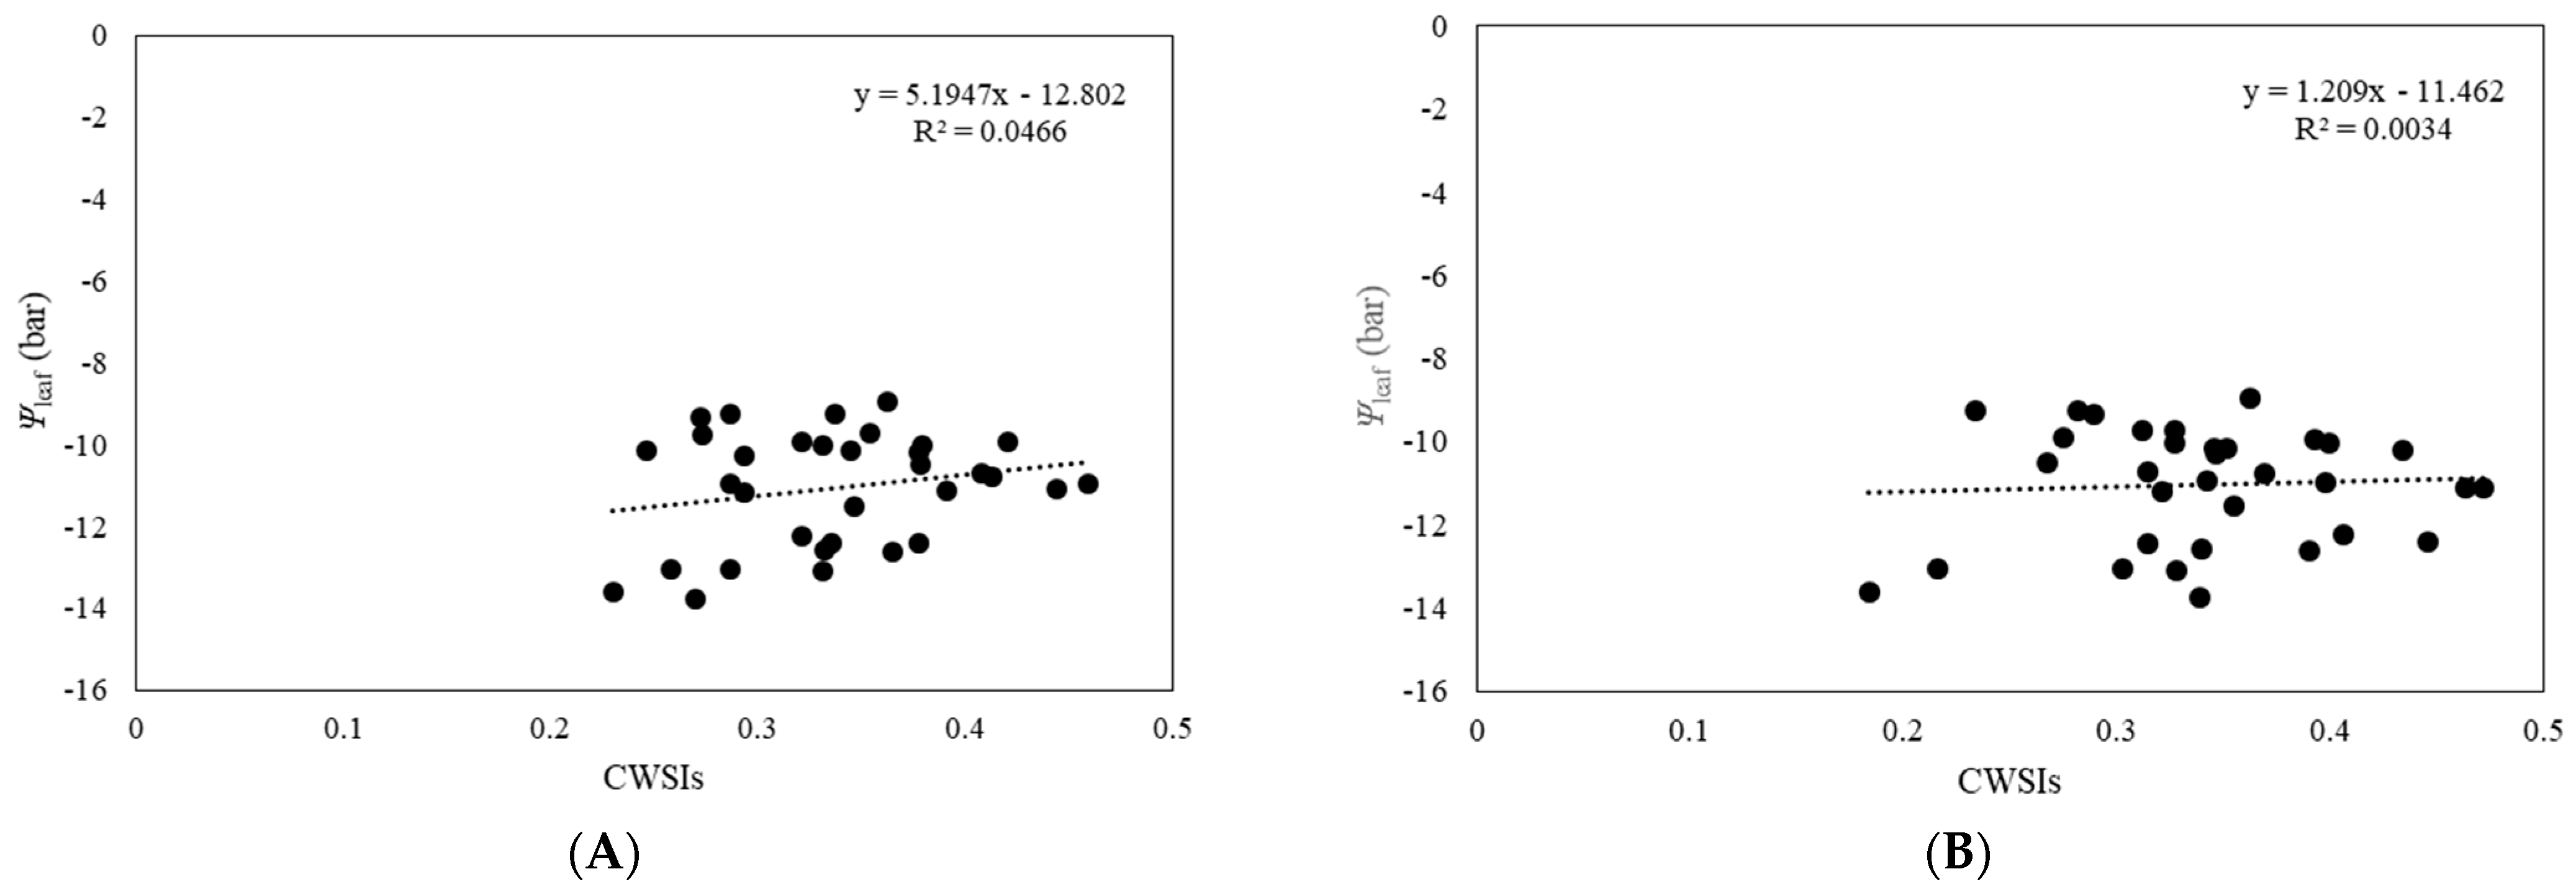
3.3. Relationship between Ψleaf and CWSI
4. Conclusions
Author Contributions
Funding
Institutional Review Board Statement
Informed Consent Statement
Conflicts of Interest
References
- Pou, A.; Diago, M.P.; Medrano, H.; Baluja, J.; Tardaguila, J. Validation of thermal indices for water status identification in grapevine. Agric. Water Manag. 2014, 134, 60–72. [Google Scholar] [CrossRef]
- Keller, M. The Science of Grapevines; Elsevier Academic Press: London, UK, 2020. [Google Scholar]
- Idso, S.B.; Jackson, R.D.; Pinter, P.J.; Reginato, R.J.; Hatfield, J.L. Normalizing the stress-degree-day parameter for environmental variability. Agric. Meteorol. 1981, 24, 45–55. [Google Scholar] [CrossRef]
- Sepúlveda-Reyes, D.; Ingram, B.; Bardeen, M.; Zúñiga, M.; Ortega-Farías, S.; Poblete-Echeverría, C. Selecting canopy zones and thresholding approaches to assess grapevine water status by using aerial and ground-based thermal imaging. Remote Sens. 2016, 8, 882. [Google Scholar] [CrossRef] [Green Version]
- Matese, A.; Di Gennaro, S. Practical applications of a multisensor uav platform based on multispectral, Thermal and RGB High Resolution Images in Precision Viticulture. Agriculture 2018, 8, 116. [Google Scholar] [CrossRef] [Green Version]
- Bian, J.; Zhang, Z.; Chen, J.; Chen, H.; Cui, C.; Li, X.; Chen, S.; Fu, Q. Simplified evaluation of cotton water stress using high resolution unmanned aerial vehicle thermal imagery. Remote Sens. 2019, 11, 267. [Google Scholar] [CrossRef] [Green Version]
- Luan, Y.; Xu, J.; Lv, Y.; Liu, X.; Wang, H.; Liu, S. Improving the performance in crop water deficit diagnosis with canopy temperature spatial distribution information measured by thermal imaging. Agric. Water Manag. 2021, 246, 106699. [Google Scholar] [CrossRef]
- Cohen, Y.; Alchanatis, V.; Sela, E.; Saranga, Y.; Cohen, S.; Meron, M.; Bosak, A.; Tsipris, J.; Ostrovsky, V.; Orolov, V.; et al. Crop water status estimation using thermography: Multi-year model development using ground-based thermal images. Precis. Agric. 2015, 16, 311–329. [Google Scholar] [CrossRef]
- García-Tejero, I.F.; Rubio, A.E.; Viñuela, I.; Hernández, A.; Gutiérrez-Gordillo, S.; Rodríguez-Pleguezuelo, C.R.; Durán-Zuazo, V.H. Thermal imaging at plant level to assess the crop-water status in almond trees (cv. Guara) under deficit irrigation strategies. Agric. Water Manag. 2018, 208, 176–186. [Google Scholar] [CrossRef]
- Rud, R.; Cohen, Y.; Alchanatis, V.; Levi, A.; Brikman, R.; Shenderey, C.; Heuer, B.; Markovitch, T.; Dar, Z.; Rosen, C.; et al. Crop water stress index derived from multi-year ground and aerial thermal images as an indicator of potato water status. Precis. Agric. 2014, 15, 273–289. [Google Scholar] [CrossRef]
- Gómez-Bellot, M.J.; Nortes, P.A.; Sánchez-Blanco, M.J.; Ortuño, M.F. Sensitivity of thermal imaging and infrared thermometry to detect water status changes in Euonymus japonica plants irrigated with saline reclaimed water. Biosyst. Eng. 2015, 133, 21–32. [Google Scholar] [CrossRef]
- Santesteban, L.G.; Di Gennaro, S.F.; Herrero-Langreo, A.; Miranda, C.; Royo, J.B.; Mtese, A. High-resolution UAV-based thermal imaging to estimate the instantaneous and seasonal variability of plant water status within a vineyard. Agric. Water Manag. 2017, 183, 49–59. [Google Scholar] [CrossRef]
- Zhou, Z.; Majeed, Y.; Naranjo, G.D.; Gambacorta, E.M.T. Assessment for crop water stress with infrared thermal imagery in precision agriculture: A review and future prospects for deep learning applications. Comput. Electron. Agric. 2021, 182, 106019. [Google Scholar] [CrossRef]
- Keller, M.; Romero, P.; Gohil, H.; Smithyman, R.P.; Riley, W.R.; Casassa, L.F.; Harbertson, J.F. Deficit irrigation alters grapevine growth, physiology, and fruit microclimate. Am. J. Enol. Vitic. 2016, 67, 426–435. [Google Scholar] [CrossRef]
- García-Tejero, I.F.; Costa, J.M.; Egipto, R.; Durán-Zuazo, V.H.; Lima, R.S.N.; Lopes, C.M.; Chaves, M.M. Thermal dtat to monitor crop-water status in irrigated Mediterranean viticulture. Agric. Water Manag. 2016, 176, 80–90. [Google Scholar] [CrossRef]
- Giménez-Gallego, J.; González-Teruel, J.D.; Soto-Valles, F.; Jiménez-Buendía, M.; Navarro-Hellín, H.; Torres-Sánchez, R. Intelligent thermal image-based sensor for affordable measurement of crop canopy temperature. Comput. Electron. Agric. 2021, 188, 106319. [Google Scholar] [CrossRef]
- Chandel, A.K.; Knot, L.R.; Yu, L.X. Alfalfa (Medicago sativa L.) crop vigor and yield characterization using high-resolution aerial multispectral and thermal infrared imaging technique. Comput. Electron. Agric. 2021, 182, 105999. [Google Scholar] [CrossRef]
- Gutiérrez, S.; Diago, M.P.; Fernández-Novales, J.; Tardaguila, J. On-the-go thermal imaging for water status assessment in commercial vineyards. Adv. Anim. Biosci. 2017, 8, 520–524. [Google Scholar] [CrossRef]
- Egea, G.; Padilla-Díaz, C.M.; Martinez-Guanter, J.; Fernández, J.E.; Pérez-Ruiz, M. Use of Aerial Thermal Imaging to Assess Water Status Variability in Hedgerow Olive Orchards. Agric. Water Manag. 2017, 187, 210–221. [Google Scholar] [CrossRef] [Green Version]
- Keller, M.; Deyermond, L.S.; Bondada, B.R. Plant hydraulic conductance adapts to shoot number but limits shoot vigour in grapevines. Funct. Plant. Biol. 2015, 42, 366–375. [Google Scholar] [CrossRef]
- Peña Quiñones, A.; Keller, M.; Salazar Gutierrez, M.R.; Khot, L.; Hoogenboom, G. Comparison between grapevine tissue temperature and air temperature. Sci. Hortic. 2019, 247, 407–420. [Google Scholar] [CrossRef]
- Möller, M.; Alchanatis, V.; Cohen, Y.; Meron, M.; Tsipris, J.; Naor, A.; Ostrovsky, V.; Sprintsin, M.; Cohen, S. Use of thermal and visible imagery for estimating crop water status of irrigated grapevine. J. Exp. Bot. 2007, 58, 827–838. [Google Scholar] [CrossRef] [PubMed] [Green Version]
- Cohen, Y.; Alchanatis, V.; Saranga, Y.; Rosenberg, O.; Sela, E.; Bosak, A. Mapping water status based on aerial thermal imagery: Comparision of methodologies for upscaling from a sing leaf to commercial fields. Precis. Agric. 2017, 18, 801–822. [Google Scholar] [CrossRef]
- Clawson, K.L.; Jackson, R.D.; Pinter, P.J. Evaluating plant water-stress with canopy temperature differences. Agron. J. 1989, 81, 858–863. [Google Scholar] [CrossRef]
- Davies, W.J.; Bacon, M.A.; Thompson, D.S.; Sobeih, W.; González, R. Regulation of leaf and fruit growth in plants growing in drying soil: Exploitation of the plants’ chemical signalling system and hydraulic architecture to increase the efficiency of water use in agriculture. J. Exp. Bot. 2000, 51, 1617–1626. [Google Scholar] [CrossRef]
- Idso, S.B. Non-water-stressed baselines: A key to measuring and interpreting plant water stress. Agric. Meteorol. 1982, 17, 59–70. [Google Scholar] [CrossRef]
- Gerhards, M.; Schlerf, M.; Rascher, U.; Udelhoven, T.; Juszczak, R.; Alberti, G.; Miglietta, F.; Inoue, Y. Analysis of Airborne Optical and Terhmal Imagery for Detection of Water Stress Aymptoms. Remote Sens. 2018, 10, 1139. [Google Scholar] [CrossRef] [Green Version]
- Pôças, I.; Gonçalve, J.; Costa, P.M.; Gonçalves, I.; Pereira, L.S.; Cunha, M. Hyperspectral-based predictive modelling of grapevine water status in the Portuguese Douro wine region. Int. J. Appl. Earth Obs. Geoinf. 2017, 58, 177–190. [Google Scholar] [CrossRef]


Publisher’s Note: MDPI stays neutral with regard to jurisdictional claims in published maps and institutional affiliations. |
© 2022 by the authors. Licensee MDPI, Basel, Switzerland. This article is an open access article distributed under the terms and conditions of the Creative Commons Attribution (CC BY) license (https://creativecommons.org/licenses/by/4.0/).
Share and Cite
Zhou, Z.; Diverres, G.; Kang, C.; Thapa, S.; Karkee, M.; Zhang, Q.; Keller, M. Ground-Based Thermal Imaging for Assessing Crop Water Status in Grapevines over a Growing Season. Agronomy 2022, 12, 322. https://0-doi-org.brum.beds.ac.uk/10.3390/agronomy12020322
Zhou Z, Diverres G, Kang C, Thapa S, Karkee M, Zhang Q, Keller M. Ground-Based Thermal Imaging for Assessing Crop Water Status in Grapevines over a Growing Season. Agronomy. 2022; 12(2):322. https://0-doi-org.brum.beds.ac.uk/10.3390/agronomy12020322
Chicago/Turabian StyleZhou, Zheng, Geraldine Diverres, Chenchen Kang, Sushma Thapa, Manoj Karkee, Qin Zhang, and Markus Keller. 2022. "Ground-Based Thermal Imaging for Assessing Crop Water Status in Grapevines over a Growing Season" Agronomy 12, no. 2: 322. https://0-doi-org.brum.beds.ac.uk/10.3390/agronomy12020322