Article

Competitiveness of Early Vigour Wheat (Triticum aestivum L.) Genotypes Is Established at Early Growth Stages

by
Pieter-Willem Hendriks
1,2,3,*,
Saliya Gurusinghe
2,
Peter R. Ryan
3,
Gregory J. Rebetzke
3 and
Leslie A. Weston
2
1
School of Agriculture, Environment and Veterinary Sciences, Charles Sturt University, Locked Bag 588, Wagga-Wagga, NSW 2650, Australia
2
Graham Centre for Agricultural Innovation, Charles Sturt University, Wagga Wagga, NSW 2650, Australia
3
CSIRO, Agriculture and Food, Canberra, ACT 2601, Australia
*
Author to whom correspondence should be addressed.
Submission received: 31 December 2021 / Revised: 27 January 2022 / Accepted: 29 January 2022 / Published: 2 February 2022
(This article belongs to the Special Issue Plant Interference through Competition and Allelopathy)

Abstract

:
Weed competitiveness in wheat (Triticum aestivum L.) has previously been shown to be positively associated with shoot biomass. This study evaluated the impact of increased early shoot vigour on the weed competitiveness of Australian wheats. Breeding lines generated for early shoot vigour were top-crossed with two commercial wheat cultivars (Yitpi and Wyalkatchem) and the resulting high vigour lines (HV lines) were assessed for early growth and weed pressure in the field. These lines were directly compared with their parental lines, other commercial cultivars, and the tall heritage cultivar, Federation. Moreover, rye (Secale cereale L.) or triticale (× Triticosecale) was included in each trial as a positive control for vigour. The association between shoot growth and vigour and weed suppression was evaluated over 3 years in the cereal belt of south-eastern Australia during contrasting seasons. The HV lines consistently displayed greater leaf area, ground cover, and canopy light interception in both dry and wet seasons and suppressed weed growth significantly in contrast to commercial cultivars. Light interception at the first tiller stage, and ground cover at the end of tillering were identified as the most important variables for predicting weed suppression. This study demonstrated the enhancement of competitiveness in commercial wheat through the selection for early vigour, and identified traits that best predicted weed suppression.

1. Introduction

Wheat (Triticum aestivum L.) is one of the world’s most important cereal crops and accounts for approximately 20% of the global human calorie intake [1]. Wheat production is required to increase by an estimated 70% over the next 30 years [2,3] to meet the demands of a growing population with an additional 2 billion people [4]. To achieve this goal, each wheat crop under cultivation needs to approach its yield potential [5], which is defined as “the measured yield of the best cultivar, grown with optimal agronomy and without manageable biotic and abiotic stresses”. In most regions, the most important biotic stress limiting wheat yield is weed infestation, which results in competition for essential resources that would otherwise be available to the crop [6,7]. The farming systems developed to control annual weeds in wheat generally rely upon cultivation practices, including tillage as well as agrochemical application [8]. However, both practices have adversely affected soil biodiversity and erosion [9] or resulted in the evolution of herbicide-resistant weeds [10,11], highlighting the need for integrated approaches to weed management [12,13] that combine the use of environmentally acceptable herbicides with agronomic practices to improve crop competition, including narrow row spacing and increased seeding rate [14].
Another integrated approach that remains relatively unexplored involves the development of crops that are inherently more competitive against weed infestation. Weed competitiveness is defined as the ability to suppress weed growth or tolerate the presence of weeds with minimal effects on yield [15]. Both traits could boost short-term gains for wheat productivity as well as contribute to long-term weed management [16,17,18,19]. Another advantage of using more competitive genotypes is that producers do not need to invest in new equipment or technology to adopt this management practice [9].
Weeds typically compete with crop plants for light and space above-ground [20] and for water and nutrients below-ground [21]. Canopy size, structure, and physiology affect the competitiveness of wheat plants by influencing their ability to intercept light [22,23], fix CO2 [23], and tolerate shade. Indeed, the percentage of photosynthetically active radiation (PAR) available under the crop canopy is generally positively correlated with weed growth and seed set [24]. Consequently, crop height, vigour [25,26,27], and above-ground biomass are important traits linked with competitiveness in wheat and other species [17,24,28,29,30,31,32,33,34,35,36,37,38,39]. Taller cultivars tend to produce more shoot biomass and are generally more vigorous than shorter dwarf varieties. However, they also have a lower harvest index and greater risk of lodging [17]. This was remedied, in part, by the introduction of the reduced height (Rht1 and Rht2) mutations during the 1960s with the advent of the Green Revolution. While the resulting semi-dwarf cultivars significantly improved yields, they were generally considerably less vigorous [17] and less competitive than their taller parents [40]. Nevertheless, semi-dwarf varieties do exhibit variation in early shoot vigour, and this is most commonly screened for by measuring the size of the first few leaves [26,27]. Zhang et al. [41] used this association to describe an intra-population breeding program at CSIRO in southern Australia based on the recurrent selection for increased early vigour from a set of initial crosses between globally-sourced vigorous wheat germplasm. Progeny resulting from crosses between the vigorous lines with the largest leaf widths were selected and then randomly crossed with one another to form the first cycle of the recurrent selection. After six cycles of recurrent selection for early vigour, genotypes with significantly greater leaf width, leaf area index, and shoot biomass were generated [41].
Germplasm resulting from the third cycle of recurrent selection was used to introduce additional vigour into commercial cultivars to improve their competitiveness [30,42]. However, the above-ground physiological characteristics that promote enhanced crop competitiveness, and the timing of expression have not been well described under field conditions. Therefore, the present study evaluated competitiveness in the progeny of top-crosses between germplasm from the third cycle of recurrent selection for vigour [41] and two Australian commercial cultivars, Yitpi and Wyalkatchem. The resulting breeding lines were assessed for establishment, canopy development, light interception, and weed competitiveness over three years of field trials in comparison to commercial wheat cultivars [43]. Rye (Secale cereale L.), triticale (× Triticosecale), and a heritage wheat cultivar known as weed suppressive were also included as positive controls for vigour [44]. The aim was to identify the key physiological above-ground traits that contribute to the enhanced competitiveness and the key phenological stages at which these traits are expressed.

2. Materials and Methods

2.1. Germplasm

A previous study described the recurrent selection for increased shoot vigour in wheat over six rounds of selection and crossing [41]. The high vigour (HV) germplasm used in this study was developed from top-crosses between lines from the third cycle (C3) of that recurrent selection and the commercial wheat cultivars Yitpi and Wyalkatchem. The goal of these crosses was to improve vigour and weed competitiveness in these commercial cultivars. The Yitpi-derived high vigour lines were HVYitpi-1 and HVYitpi-2 (referred to as W400201 and W470203, respectively, in previous studies [14,29]). The Wyalkatchem-derived high vigour lines were HVWyal-1, HVWyal-2, and HVWyal-3 (referred to as W010709, W320202, and W670704, respectively, in previous studies [15,33]). Over three years of field trials, these breeding lines were compared with several Australian commercial wheat cultivars (Condo, Mace, Wyalkatchem, and Yitpi), a heritage cultivar (Federation), and triticale (× Triticosecale, cv Chopper) or rye (Secale cereale L., cv Grazer). Federation is a tall heritage wheat released in Australia in 1901 that is known to be weed suppressive [44]. In addition, triticale and rye were included as benchmarks for high vigour and competitiveness. All of the seeds used in the 2019 and 2020 experiments were harvested from a field trial conducted in 2018 at the New South Wales (NSW) Department of Primary Industry field site in Yanco (34°62 S, 146°42 E; NSW, Australia).
The 2018 field trials assessed the following genotypes: Two high vigour wheat lines (HVYitpi-1 and HVWyal-3), four commercial wheat cultivars (Condo, Gregory, Trojan, and Wedgetail), the heritage wheat cultivar, Federation, and rye (cv Grazer).
The 2019 field trial assessed the following genotypes: Five high vigour wheat lines (HVYitpi-1, HVYitpi-2, HVWyal-1, HVWyal-2, and HVWyal-3), two commercial wheat cultivars (Condo and Mace), Federation, and triticale (cv Chopper).
The 2020 field trial assessed the following genotypes: Four high vigour wheat lines (HVYitpi-1, HVYitpi-2, HVWyal-1, and HVWyal-3), five commercial wheat cultivars (Condo, Yitpi, Wyalkatchem, Mace, and Janz), Federation, and triticale (cv Chopper).

2.2. Field Site and Climate

Field experiments were conducted over 3 years from 2018 to 2020 at the Graham Centre in Wagga Wagga (35°03 S, 147°36 E; 227 m altitude; NSW, Australia) where soil was classified as a fine red clay-loam kandosol. The pH was 6.4 in the top 10 cm, and pH 4.9 below that depth. The long-term average yearly rainfall at this location was 577 mm (Australian Bureau of Meteorology, www.bom.gov.au, accessed on 14 November 2021). El Niño conditions prevailed over the majority of 2018 and 2019 growing seasons with higher average daily temperatures and lower precipitation than typical for this location. In contrast, 2020 was a very wet year (Table 1). The rainfall during the growing season was 205 and 446 mm in 2019 and 2020, respectively, compared with the long-term average of 364 mm.

2.3. Experimental Design and Crop Management

In all of the trials, wheat genotypes were sown with five replications in a randomized complete block design. The plots were 10 m long and 1.8 m wide (8 rows at 20 cm row spacing). Sowing rates for treatments were calculated with the aim of establishing 150 plants/m2. The experiments were managed according to the standard agricultural practices for the region. The plots were sown mid-to-late May. The 2018 and 2019 trials followed a canola crop and the 2020 trial followed a summer fallow after field pea in the previous winter. The fertiliser was supplied as di-ammonium phosphate (DAP) 15 at the time of sowing, and supplemental urea (Incitec PivotTM Fertilisers, Southbank, Victoria, Australia) was applied as needed following soil testing. Before sowing, all of the existing established weeds were controlled using a non-selective herbicide (glyphosate, Weedmaster®DST® 470 g/L glyphosate, Nufarm Australia, Melbourne, Australia) at 960 g/ha. The crops were sown after a light harrowing. During the cropping season, weeds emerging from the natural weed seedbank were left untreated. Weeds in the inter-plot zones (no crop plants) were used as a reference for relative weed suppression evaluations.

2.4. Crop Assessments and Data Collection

Warm dry conditions prevailed in the 2018 growing season, resulting in all wheat genotypes and rye undergoing senescence at anthesis. Nevertheless, the weed suppressive potential of each treatment was assessed by visually comparing the weed density present within each plot to that present in untreated non-planted inter-plot borders. The 2019 growing season also experienced warm and dry conditions, particularly in late spring and early summer. However, an adequate early-season rainfall facilitated the uniform establishment of wheat treatments, enabling additional field assessments to be taken, including leaf area measurements and collection of above-ground biomass, which are accumulated by wheat treatments and weeds separately at early tillering (GS21) [45] and early stem elongation (GS31). Optimal growing conditions in the 2020 winter growing season enabled comprehensive field assessments to be completed for each treatment, including accumulated above-ground biomass for each experimental treatment and weeds, leaf area index, canopy closure (ground cover), and crop light interception over the course of the growing season. Assessments were performed from early tillering until early stem elongation when canopy closure occurred. Light interception (%) was calculated by measuring the difference in photosynthetically active radiation (PAR; mol m−2s−1) above and below the crop canopy relative to the above crop incidence using a ceptometer (AccuPAR LP-80 Ceptometer, Decagon Devices®, Pullman, Washington state, USA). Above-ground crop biomass was collected by cutting lengths of 30 cm in each plot twice over four consecutive rows at ground level (0.216 m2). Each sample was sub-sampled (by fresh weight) and then the fresh weight of the separated stems and leaves was determined. The leaf area of each sub-sample was assessed with a LI-3100C scanner (LI-COR Bioscience, 4647 Superior Street, P.O. Box 4425 Lincoln, NE 68504, USA). Fresh crop biomass samples were dehydrated for at least 3 days at 70 °C in a forced-air dehydrator. The leaf area index was calculated using the leaf area per total biomass achieved from leaves and stems in each sub-sample.
Canopy closure was estimated from periodic images taken directly above the canopy (120 cm height) using a digital single-lens reflex camera (D3000, Nikon Corporation, Tokyo, Japan). The leaf area in these canopy images (~1 m2) was calculated with the “Canopy Cover” program developed by MS Visual Studio 2005® [46] (Supplemental Figure S1).
Weed presence was estimated by visual scoring of the percentage of weed ground cover in all of the plots. Previous studies [47] demonstrated that the visual estimation of weed infestations was highly correlated to the harvested weed biomass. In 2020, weeds present at crop anthesis were collected, identified, and dried for dry weight determination. Each plot was sampled twice for each observation or assessment. Therefore, for each evaluated genotype, we obtained 10 (5 replicates × 2 samples) sub-samples.

2.5. Statistical Analyses and Modelling

All of the statistical analyses were performed and figures were constructed in R® [48]. Each mixed model contained random components related to the structure of the experimental design for each experiment, such as plot position. The data available were analysed using two methods. The first combined the HV lines (derived from both Yitpi and Wyalkatchem) and compared them with combined commercial cultivars, historical wheat cultivars, and with rye or triticale. For the second approach, the HV lines derived from Yitpi (HVYitpi-1 and HVYitpi-2) were compared with Yitpi and the HV lines derived from Wyalkatchem (HVWyal-1, HVWyal-2, and HVWyal-3) were compared with Wyalkatchem. An analysis of variance and estimation of least squares means were conducted, with genotypes as fixed effects using the function “lme” in “emmeans” in R® software package. Pairwise comparisons between the genotype means were obtained using the pairs function in the “emmeans” package [49].
Random Forest regression is a predictive modelling algorithm that combines a large set of regression trees [50]. In order to build a predictive model of weed biomass at anthesis based on various shoot traits, the “random forest” package in R® [51] was trained on a subset of available data and tested on the remainder of available data. Weed biomass at anthesis served as the dependent variable and all of the other measured variables served as explanatory variables. For the partial least square analysis, the “pls” package in R® was used [52].

3. Results

3.1. The 2018 Field Trial

This field trial included the two high vigour (HV) lines generated from Yitpi (HVYitpi-1) and Wyalkatchem (HVWyal-3), a group of four commercial cultivars, a heritage cultivar (Federation), and a rye cultivar. The winter growing season was dryer than the long-term average, receiving 110 mm less rain during the cropping season (Table 1). Destructive sampling during the growing season was limited due to the poor wheat growth and data was collected for in-crop weed suppression only at crop maturity. Significant (p < 0.01) differences in weed suppression were detected between the designated wheat treatment groups (Figure 1). The commercial cultivars suppressed 53% of the weeds present in the inter-plot zones, whereas the HV lines suppressed 82% of weeds. The HV lines appeared as weed suppressive as the heritage cultivar Federation, but significantly less than rye which suppressed virtually all of the weed growth despite the drought conditions.

3.2. The 2019 Field Trial

The 2019 trial included five high vigour (HV) lines, two commercial cultivars, Federation, and a competitive triticale (cv Chopper). The 2019 season was very dry with 180 mm less rainfall than average during the growing season and 240 mm less than the yearly average (Table 1). The drought conditions forced the experiment to be terminated after early flowering. Despite these extreme conditions, the canopy of the HV lines increased more rapidly than the commercial cultivars. At early tillering, the HV lines had similar leaf areas (Figure 2A) and biomass (Figure 2B) when compared to the commercial cultivars and Federation but, by early stem elongation, the leaf area and biomass of the HV lines were significantly (p = 0.05) greater than the other genotypes. Only triticale accumulated more shoot biomass than the HV lines.

3.3. The 2020 Field Trial

The 2020 season was among the wettest year on record in Wagga Wagga NSW. The yearly rainfall was almost 100 mm above the long-term average with 40 mm more than average falling during the growing season (Table 1). Samples were collected throughout the season for shoot biomass, leaf area, percent ground cover, and light interception. In addition, sampling was intensified to further investigate the genotypic differences that appeared in 2019. This trial directly compared the HV lines derived from Yitpi (HVYitpi-1 and HVYitpi-2) with the Yitpi parent and the HV lines derived from Wyalkatchem (HVWyal-1 and HVWyal-3) with the Wyalkatchem parent. The HV lines were also combined and compared with a larger group of commercial lines, as well as Federation and triticale as previously mentioned.

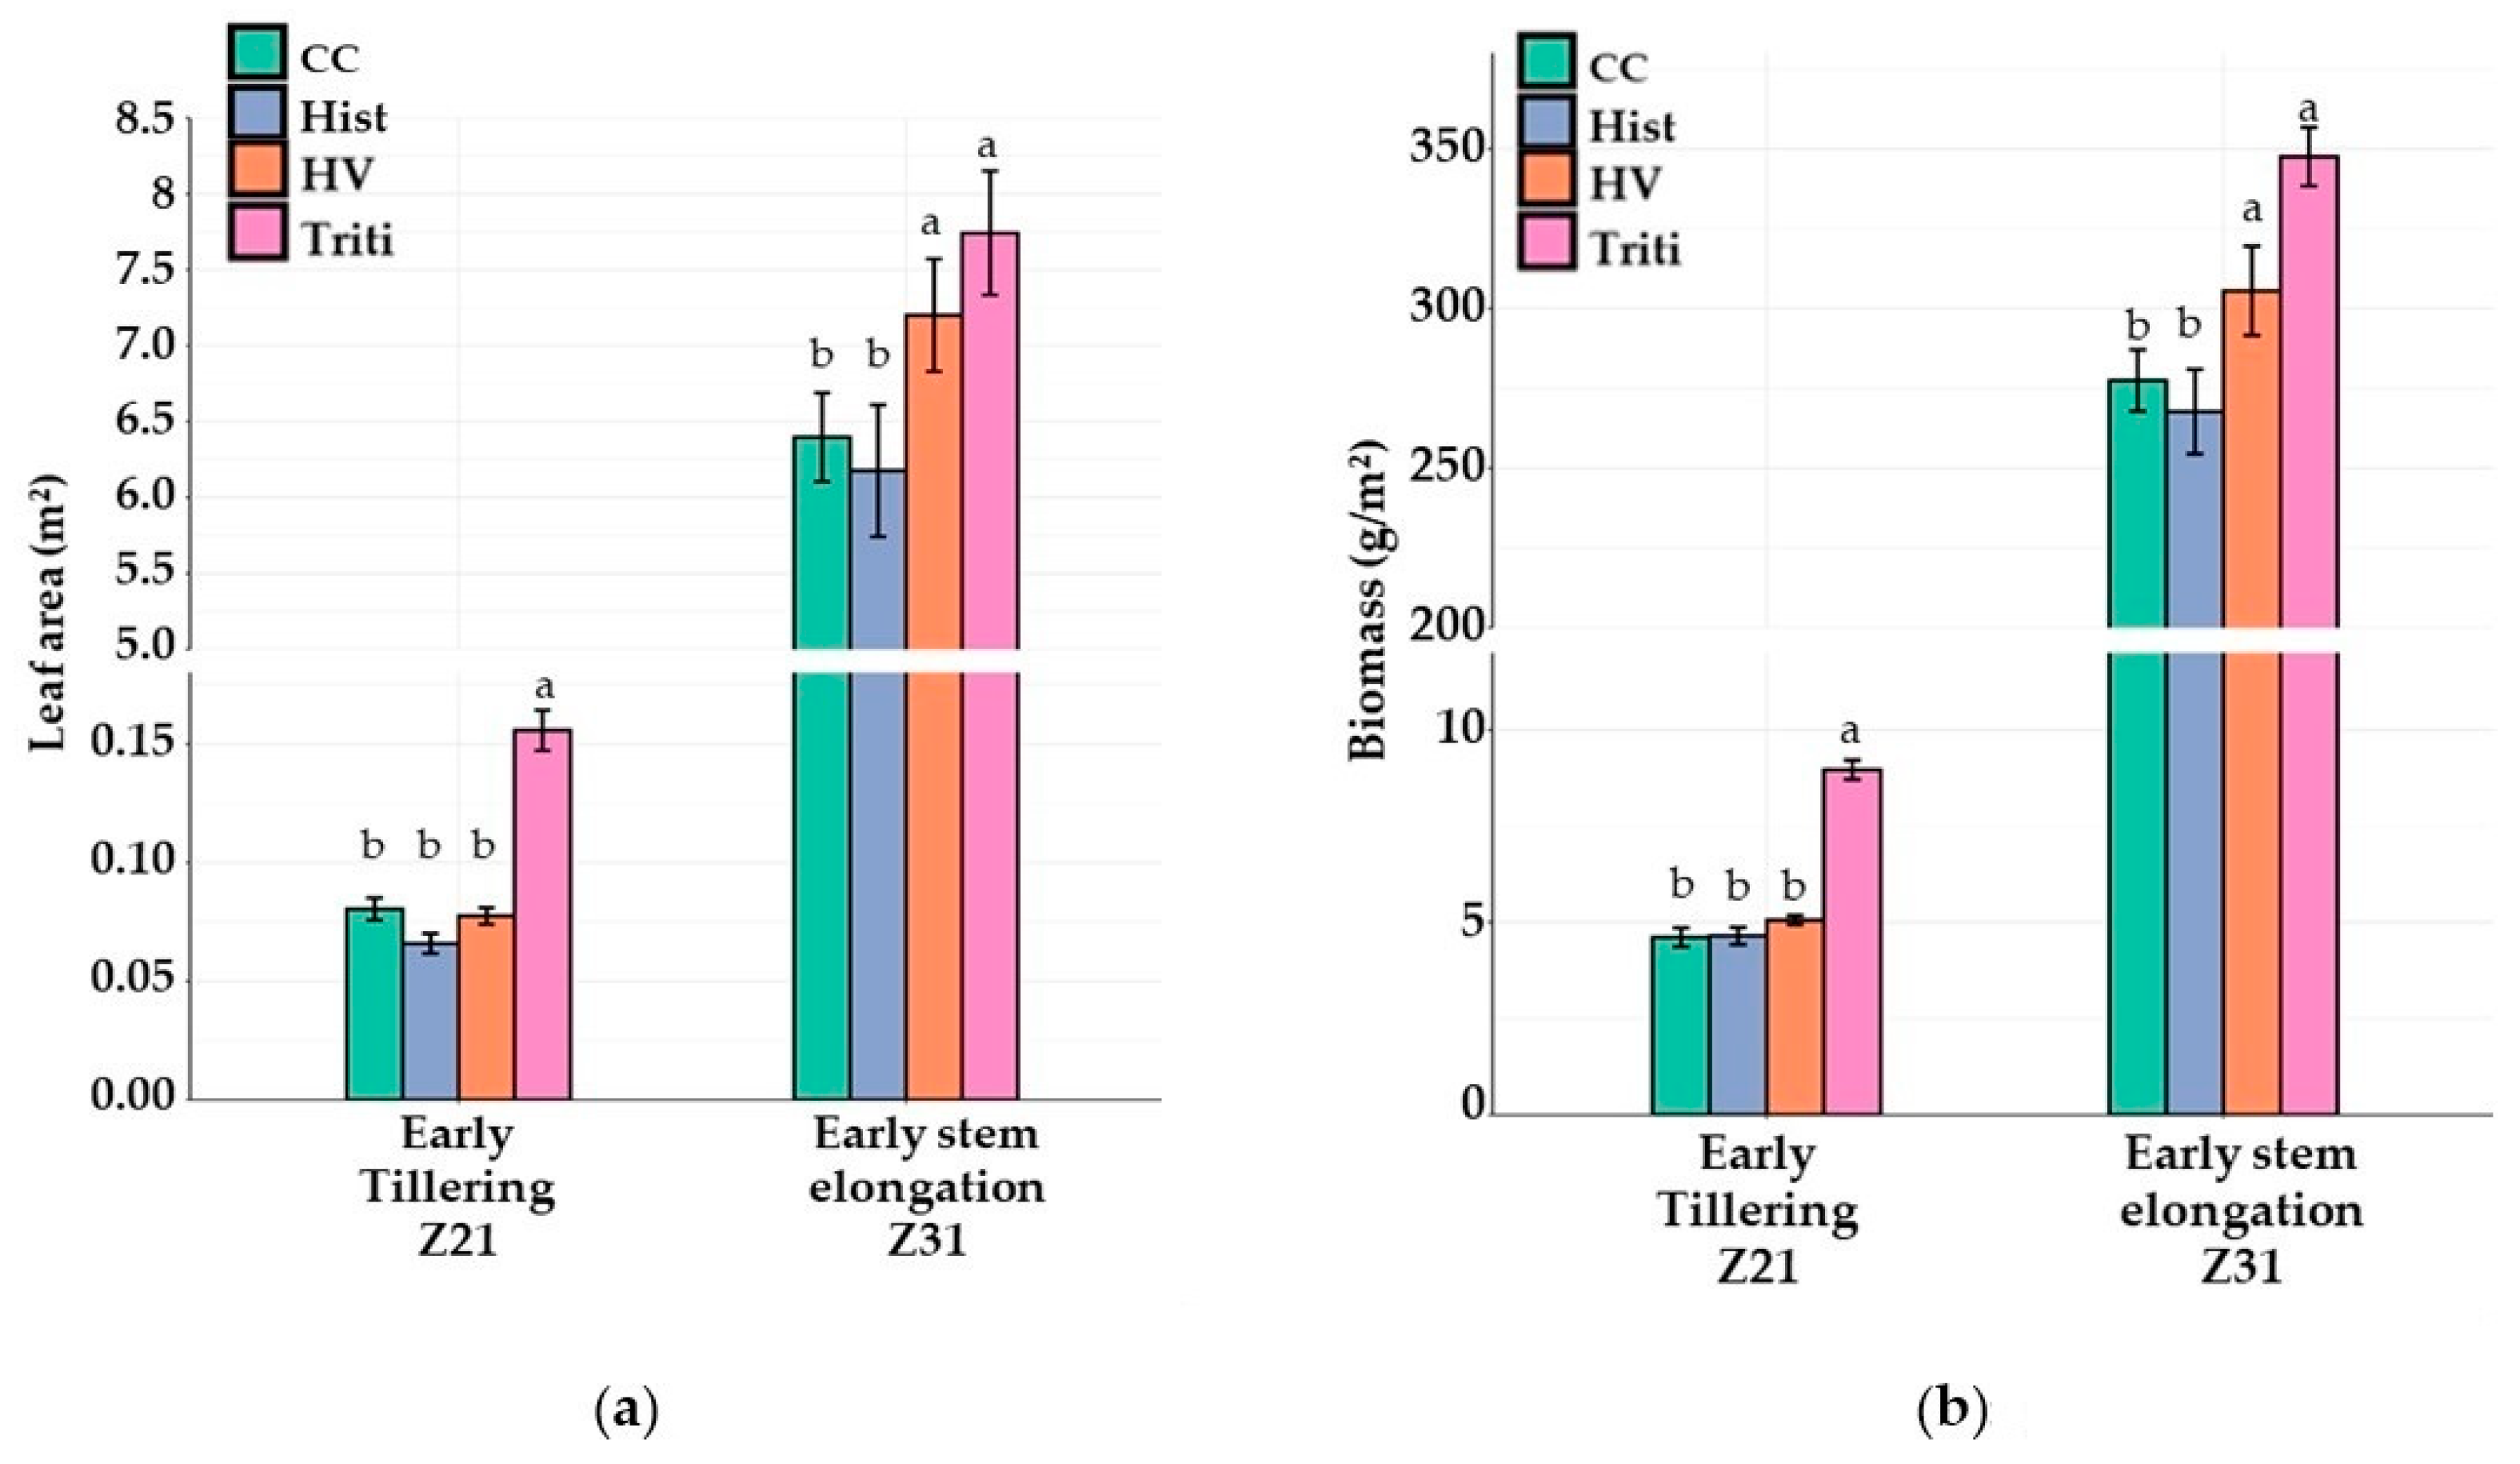
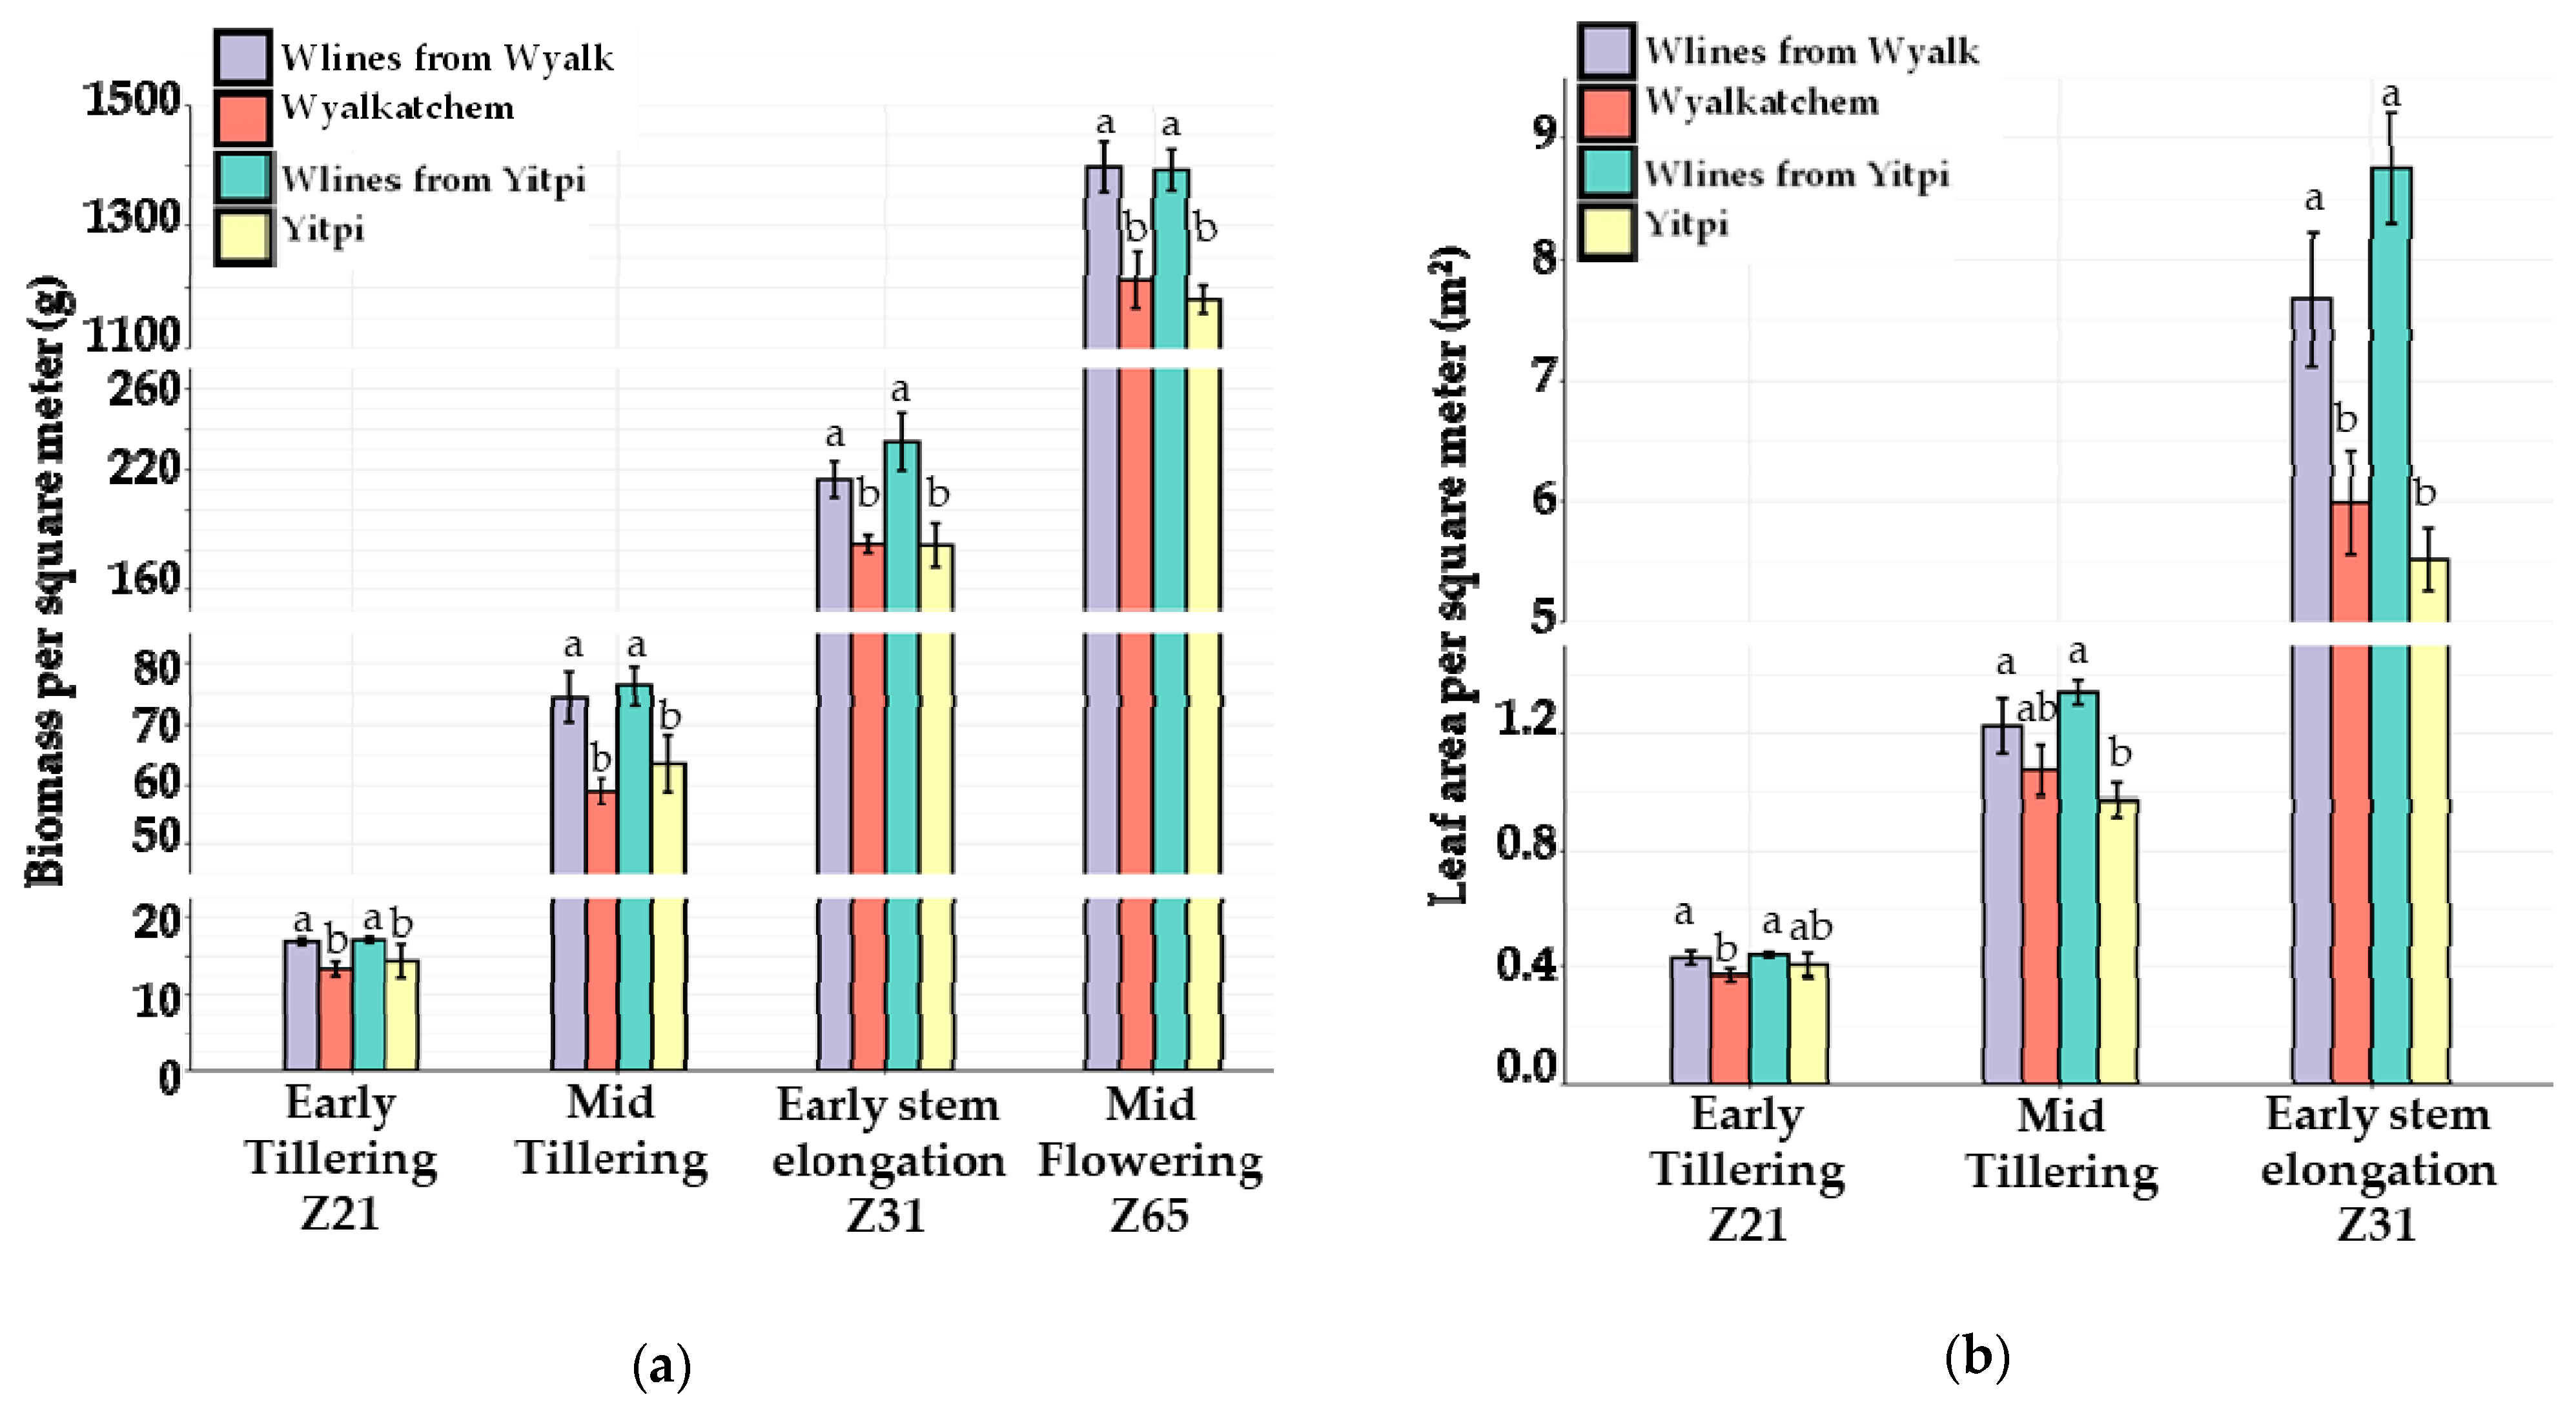
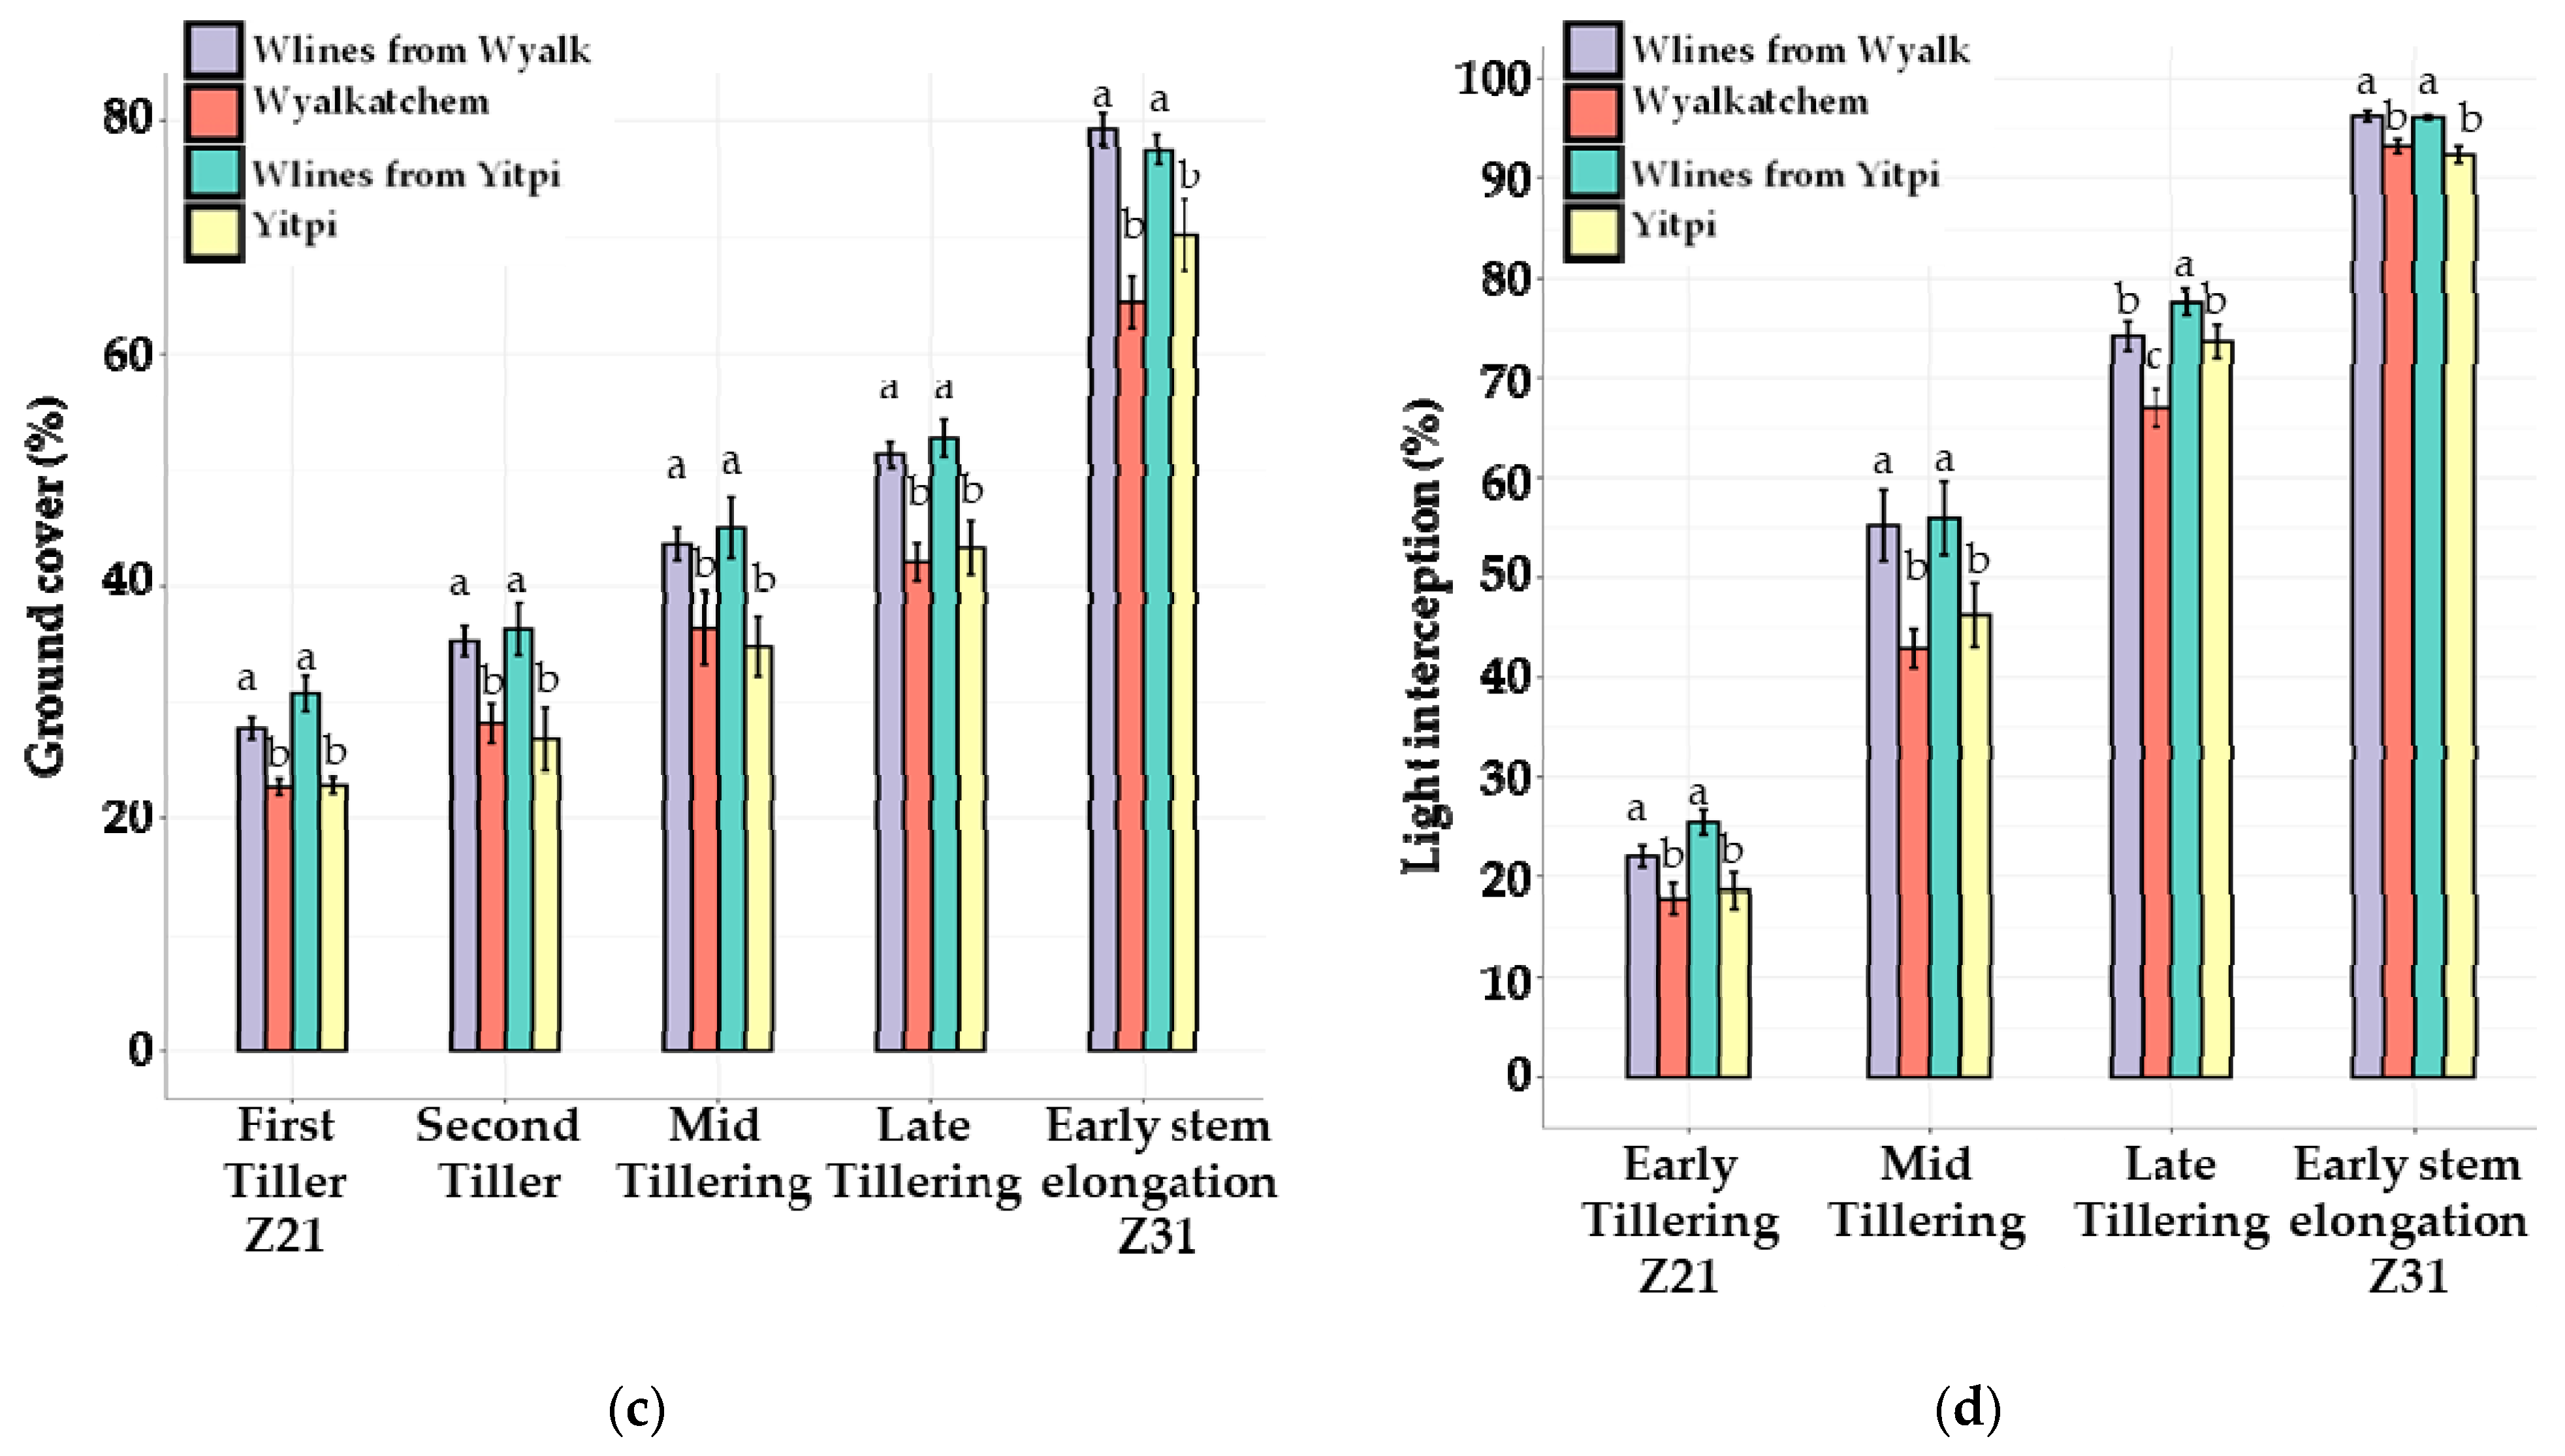
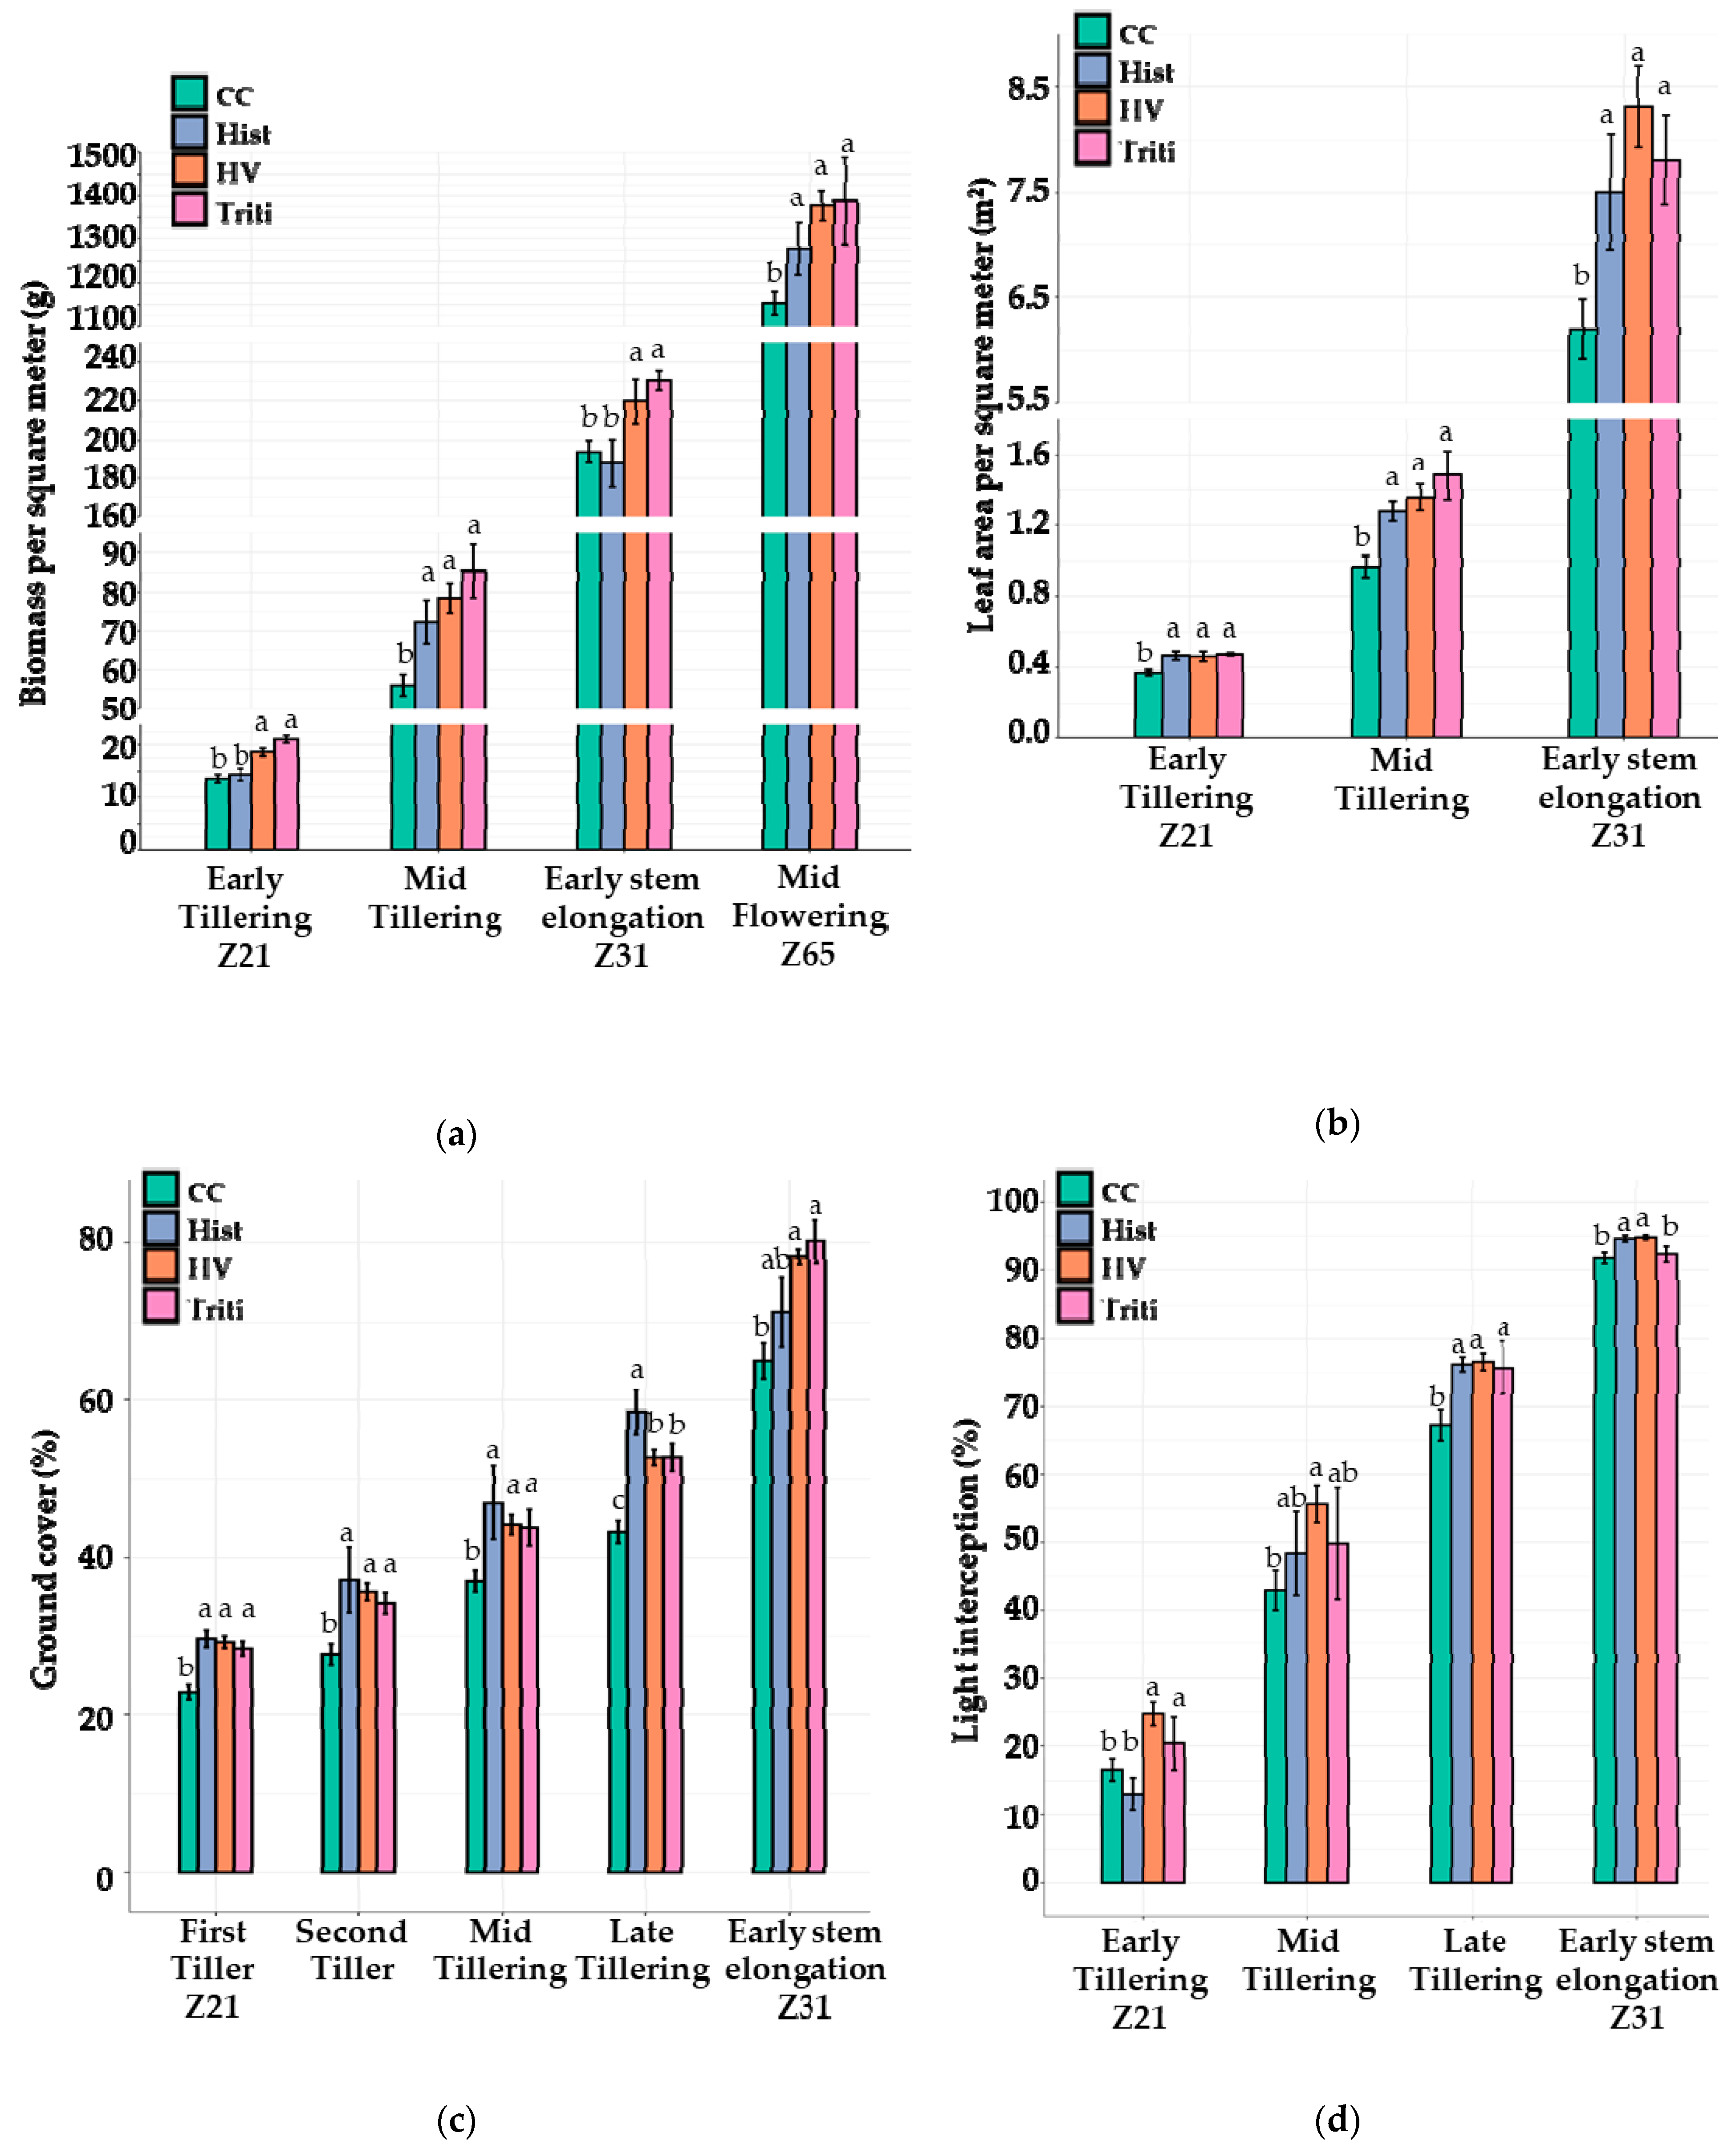
3.3.1. Canopy Growth and Light Interception

The HV lines generated from Yitpi and Wyalkatchem had significantly (p < 0.05) greater biomass (Figure 3A) and greater leaf area (Figure 3B) than their respective parents at nearly all of the stages of development, from early tillering through to stem elongation or anthesis. The one exception was the leaf area at early tillering, where the HV lines derived from Yitpi were not significantly different from the parent. The HV lines also showed greater ground cover (Figure 3C) and intercepted more light (Figure 3D) than their respective parental lines from early tillering through to stem elongation.
The four HV lines were then combined and compared with the average of four commercial cultivars, Federation, and triticale (cv Chopper). The HV lines had significantly (p < 0.05) greater biomass (Figure 4A), leaf area (Figure 4B), ground cover (Figure 4C), and light interception (Figure 4D) than the group of commercial cultivars at all of the sampling stages. Triticale was similar to the HV lines with respect to all of the growth assessments, whereas Federation varied, being similar to the HV lines at some growth stages and similar to the commercial cultivars at other stages.

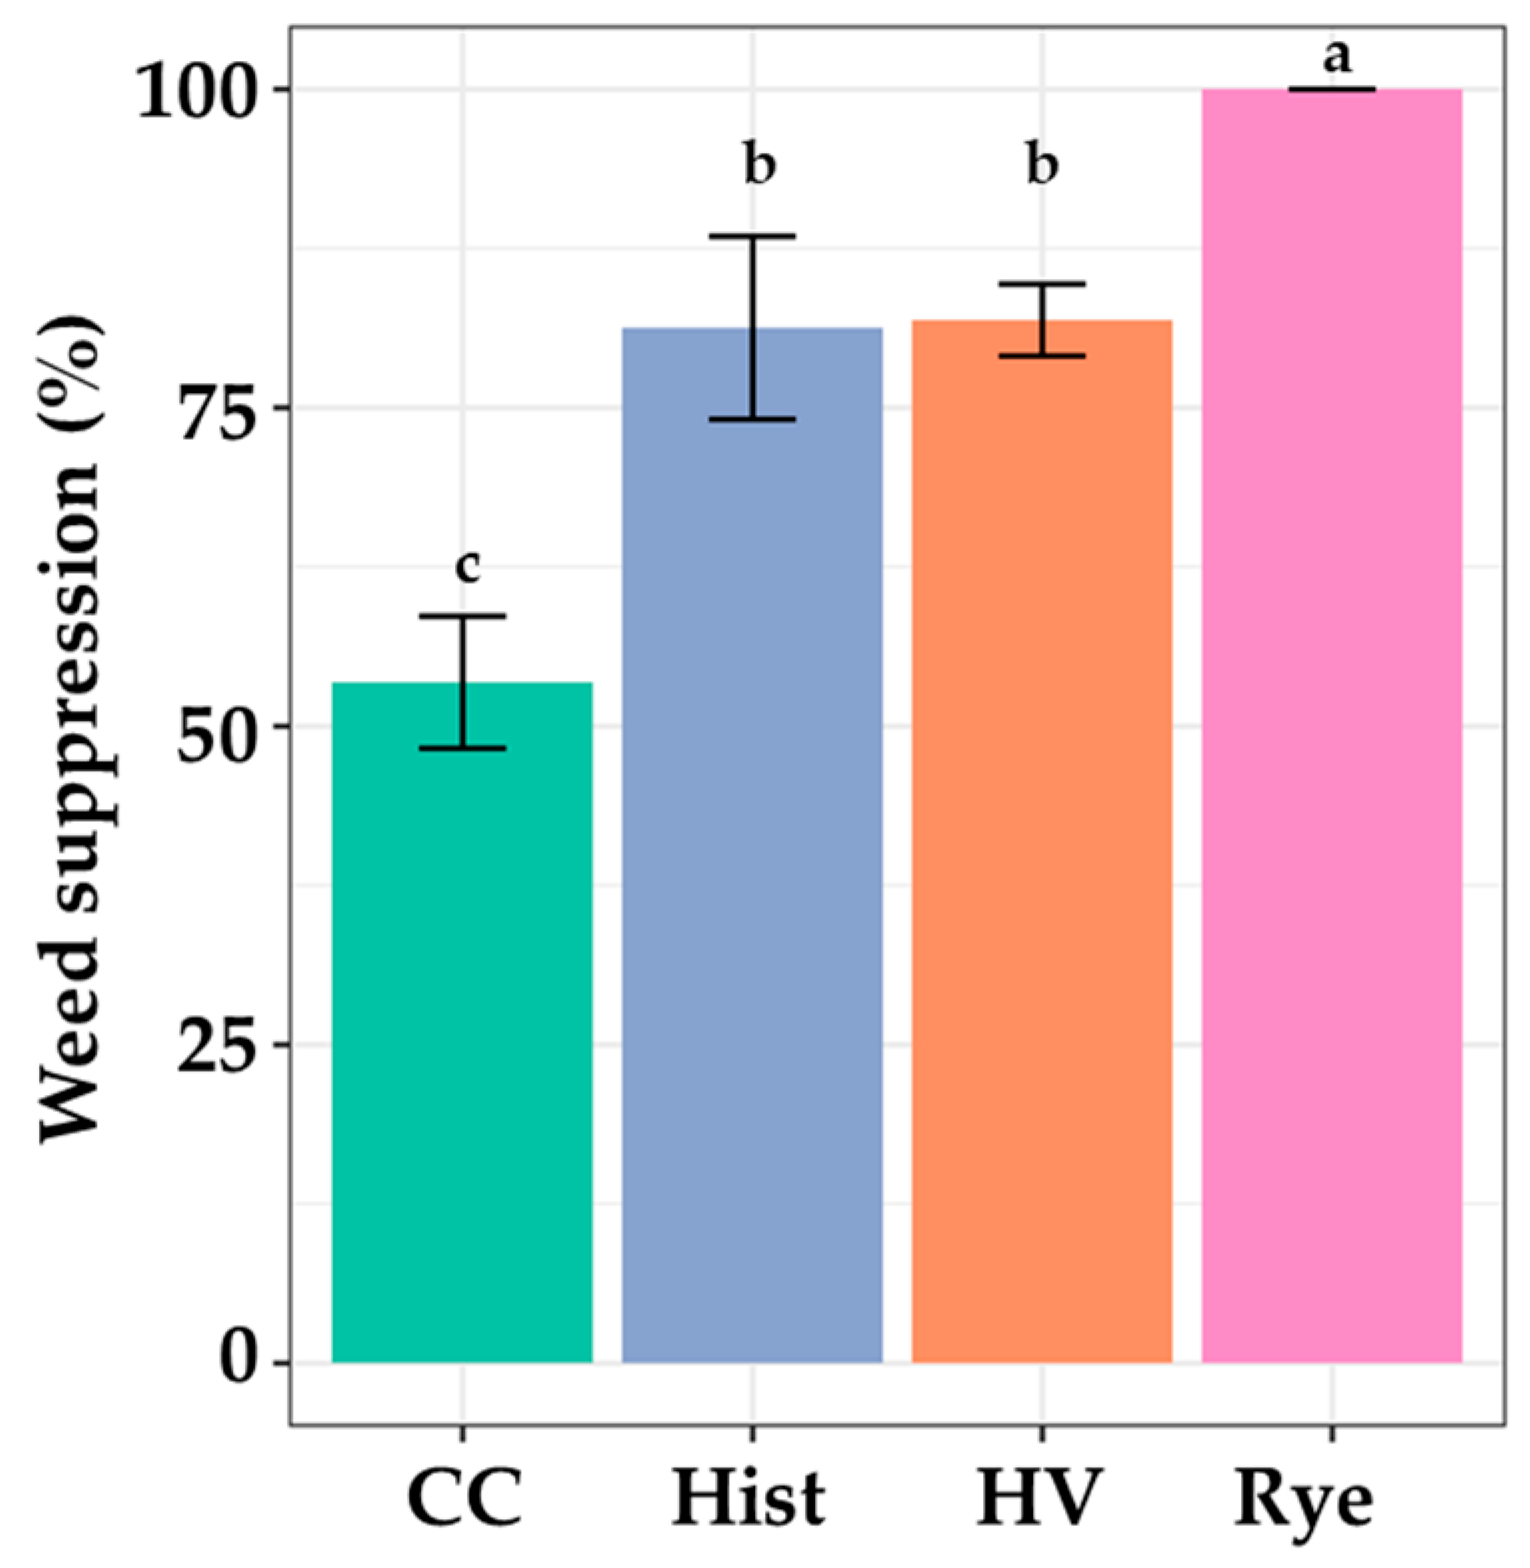
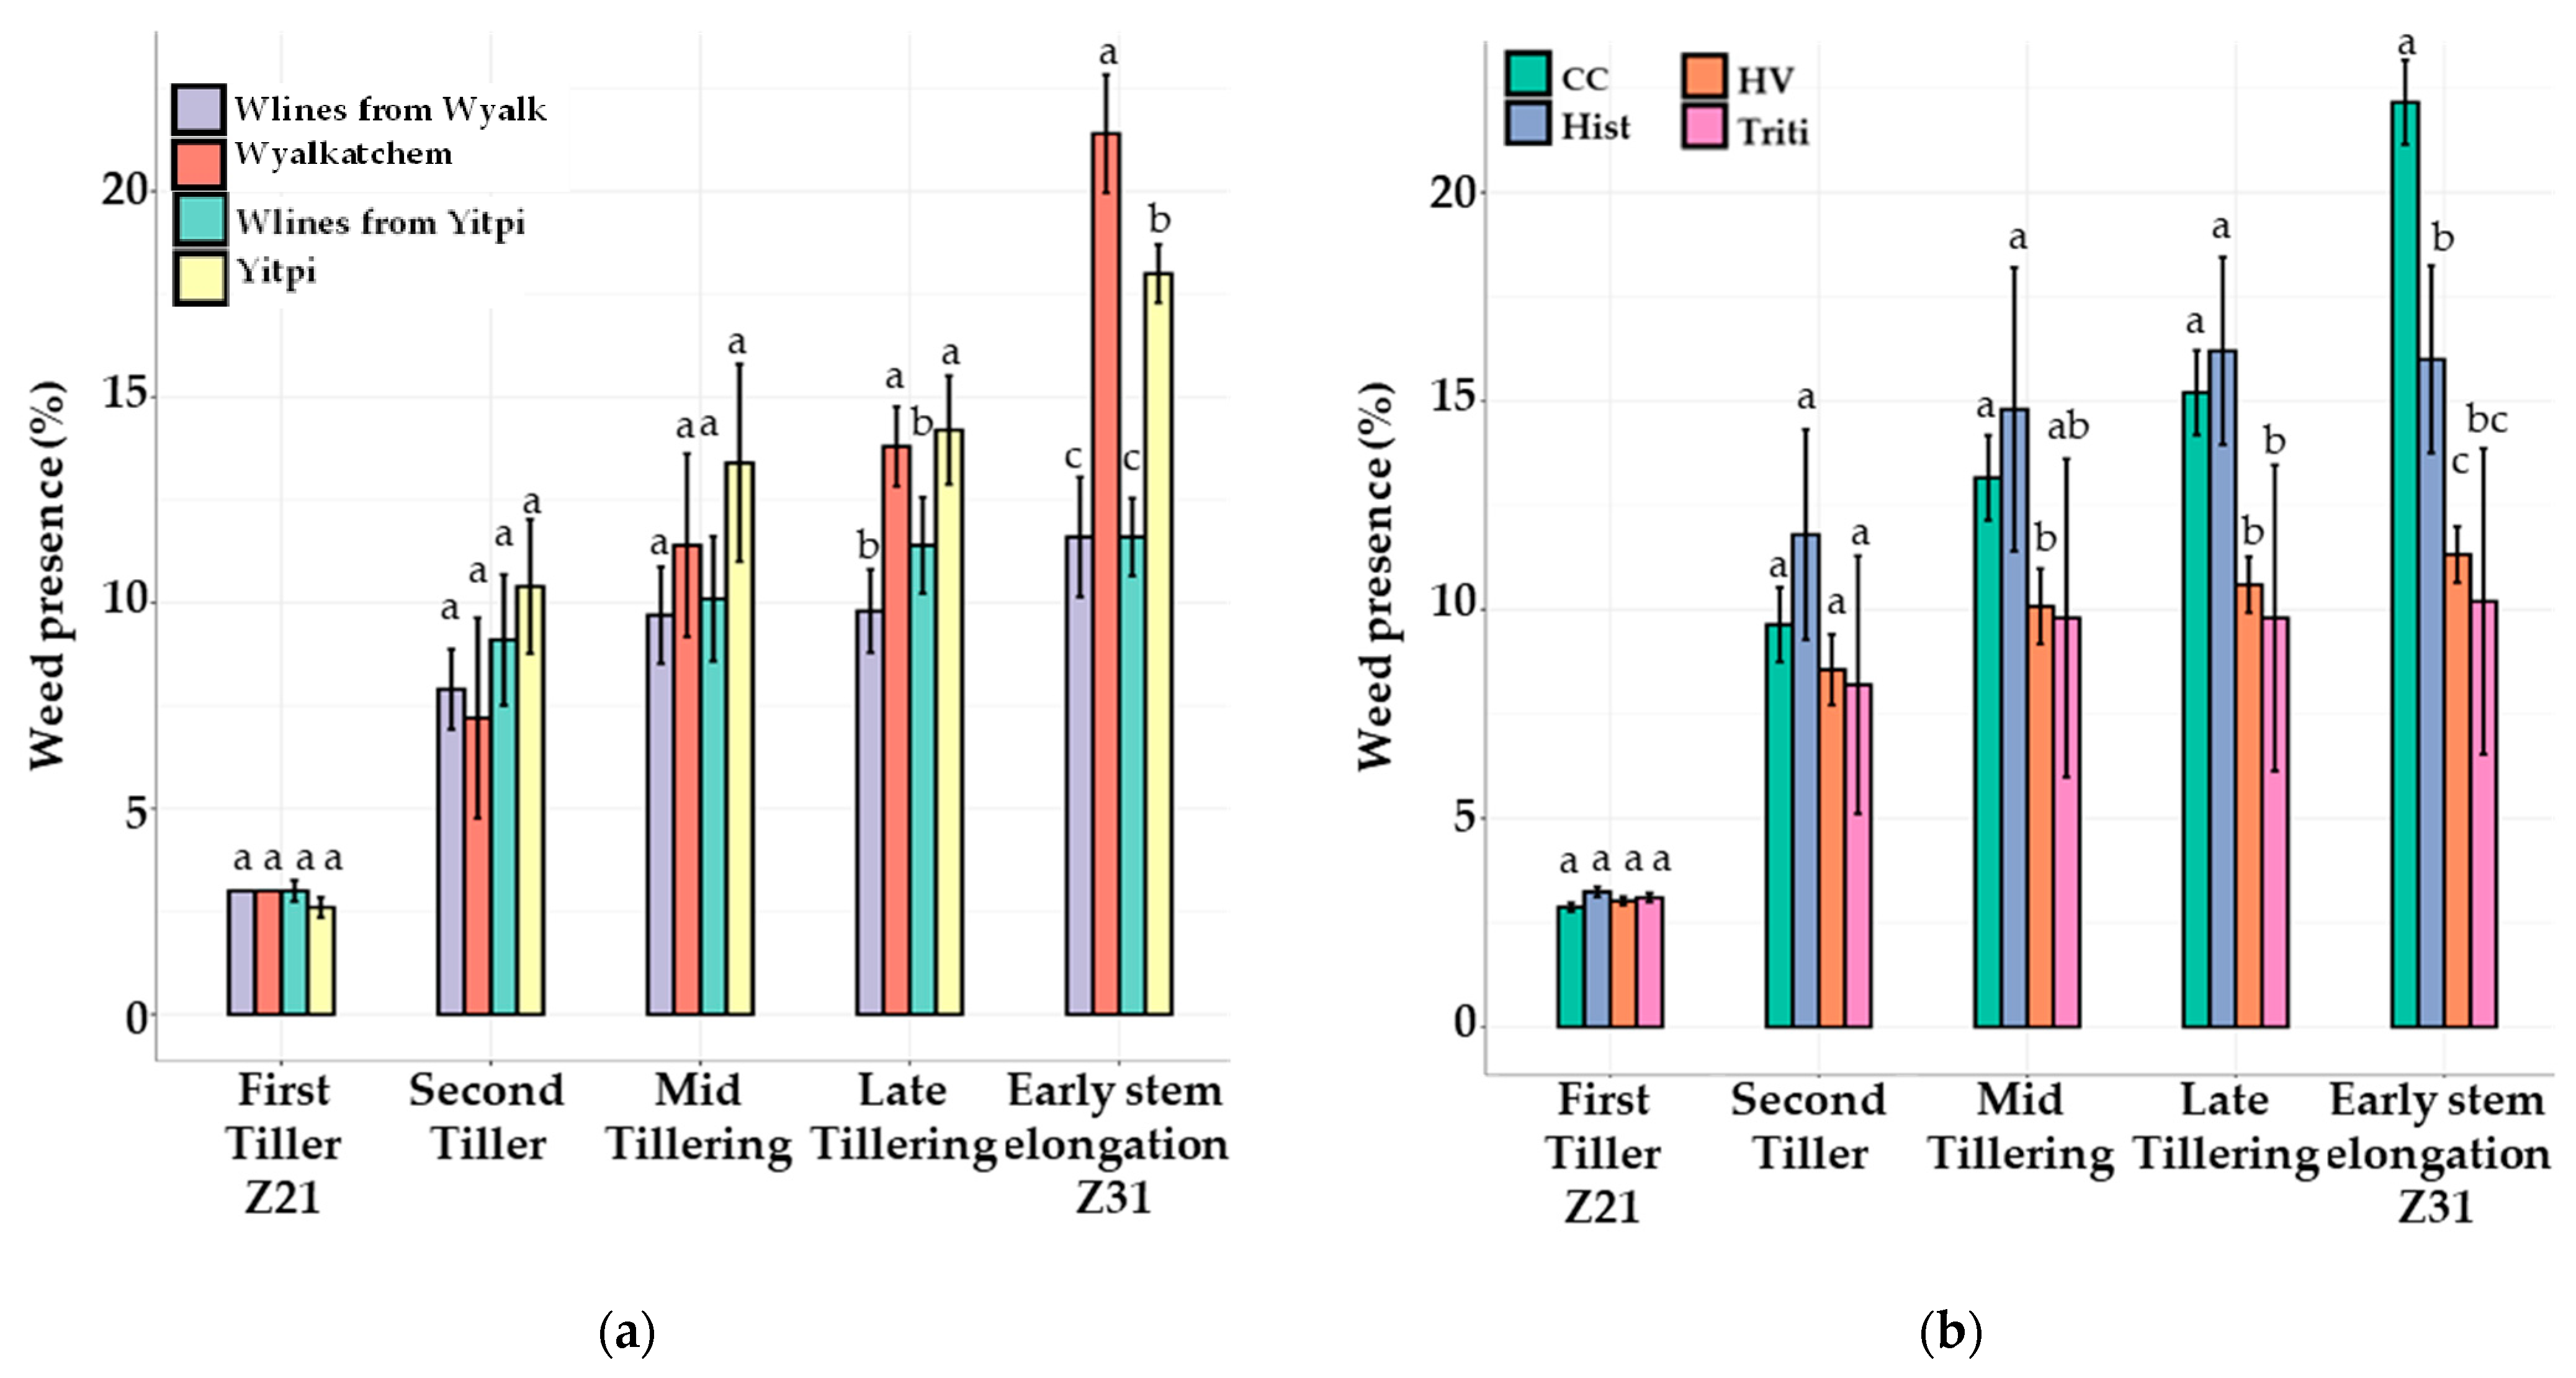
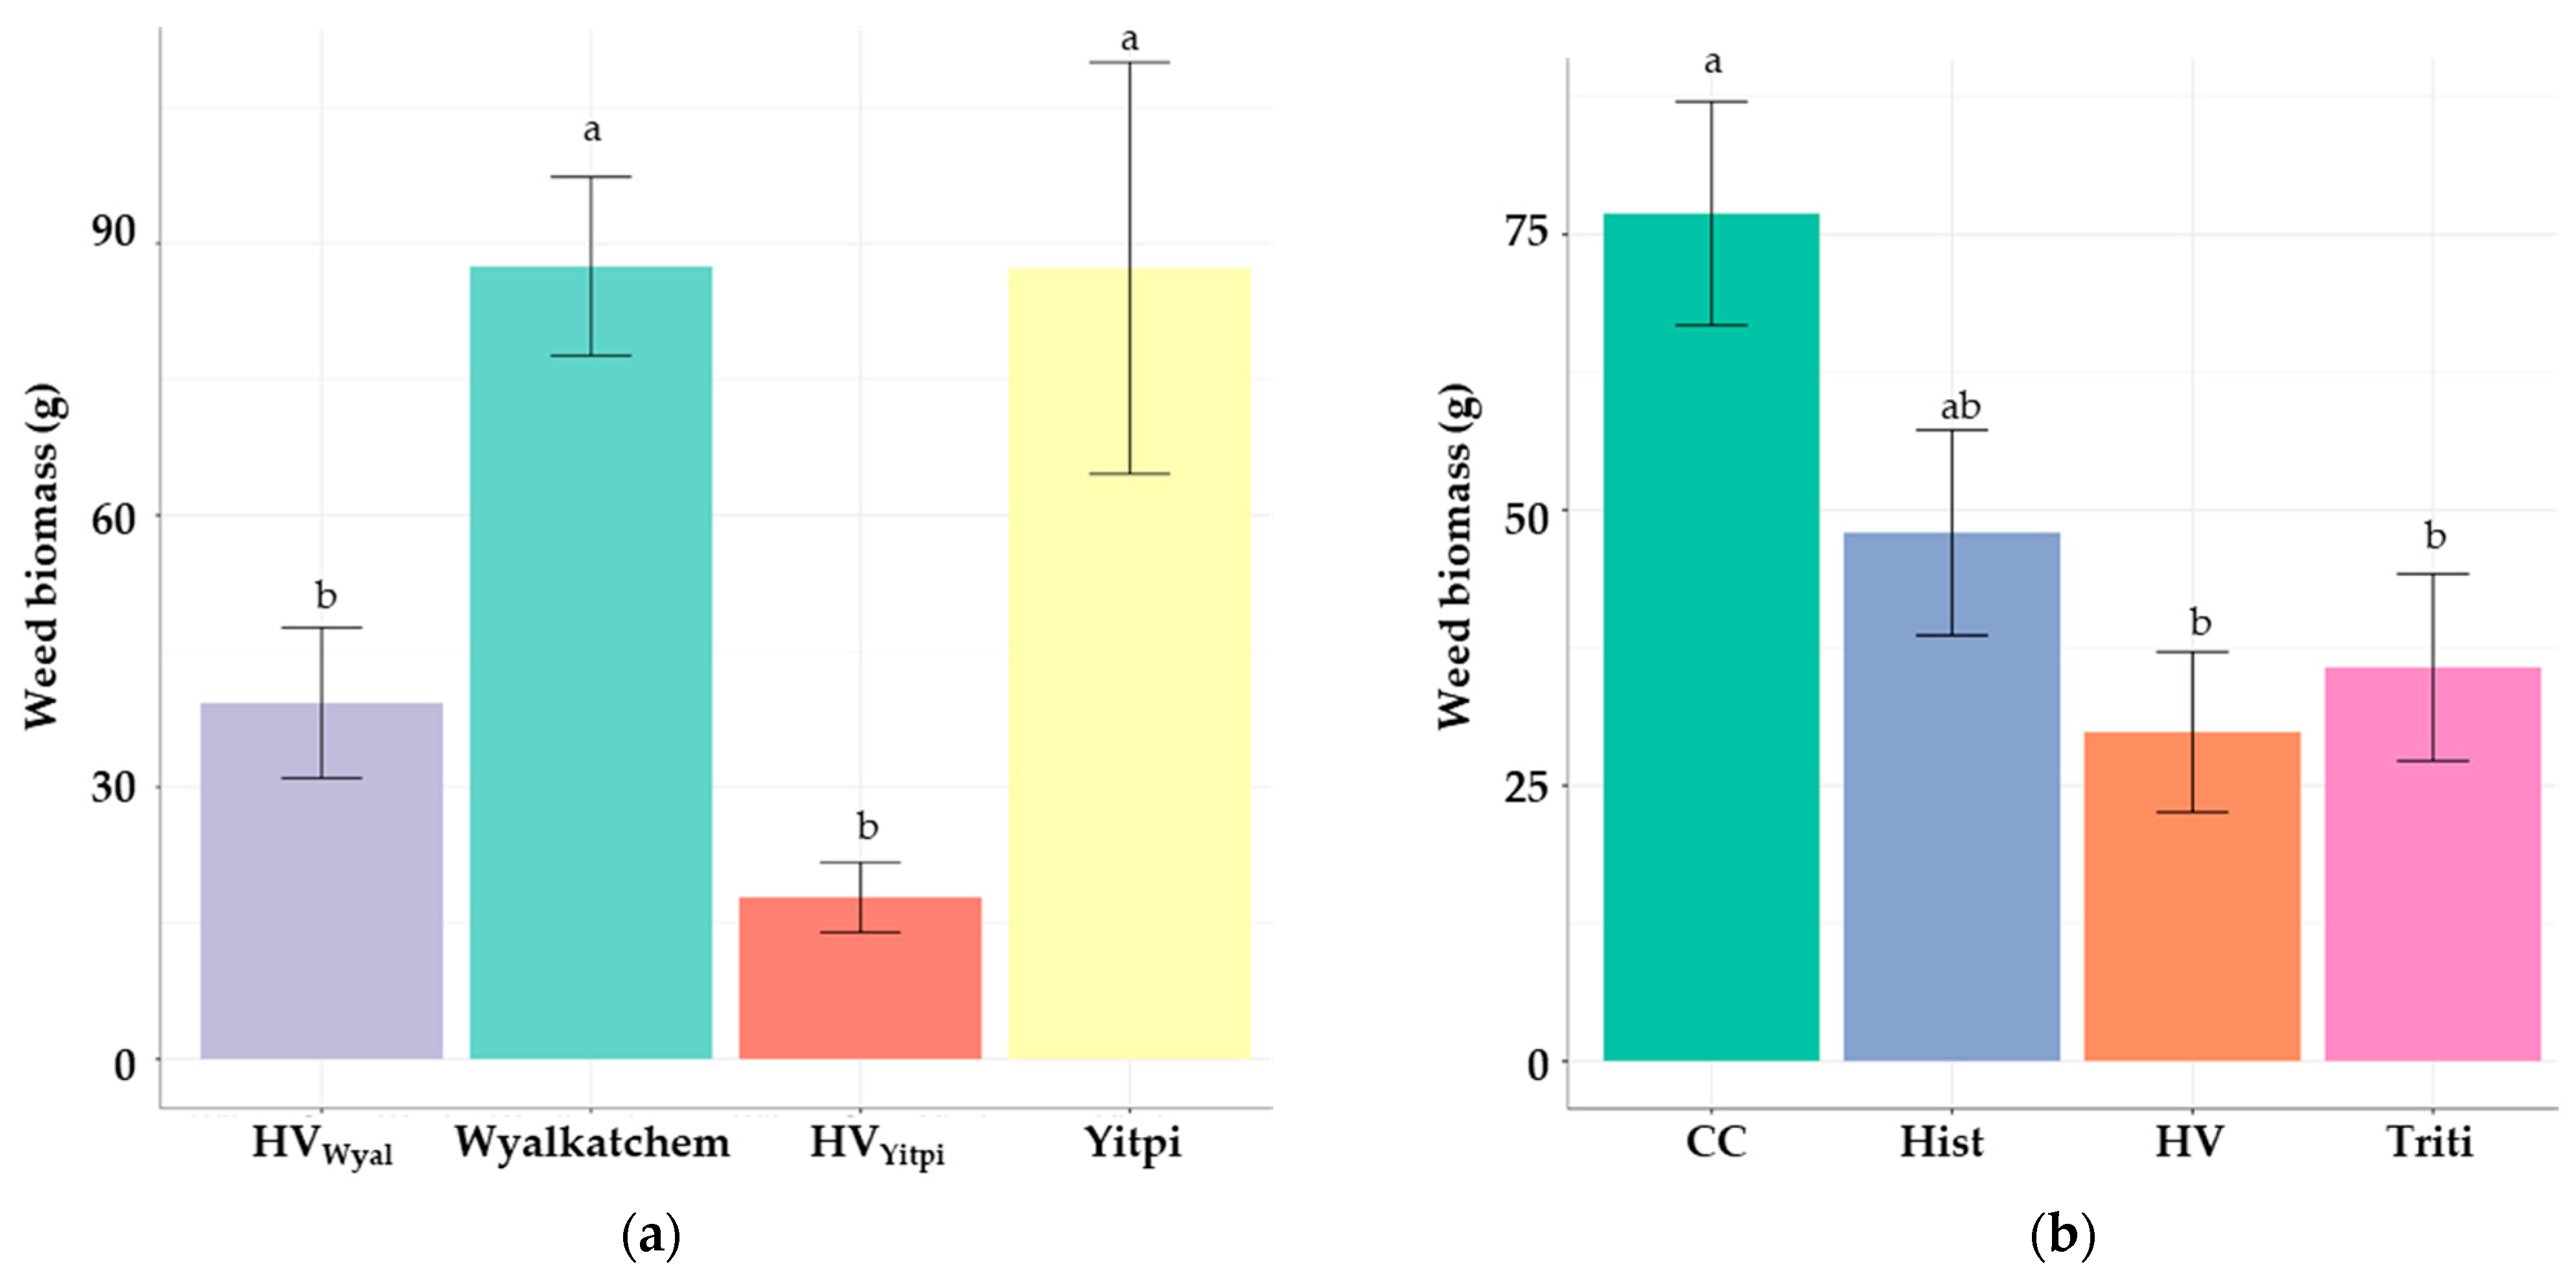
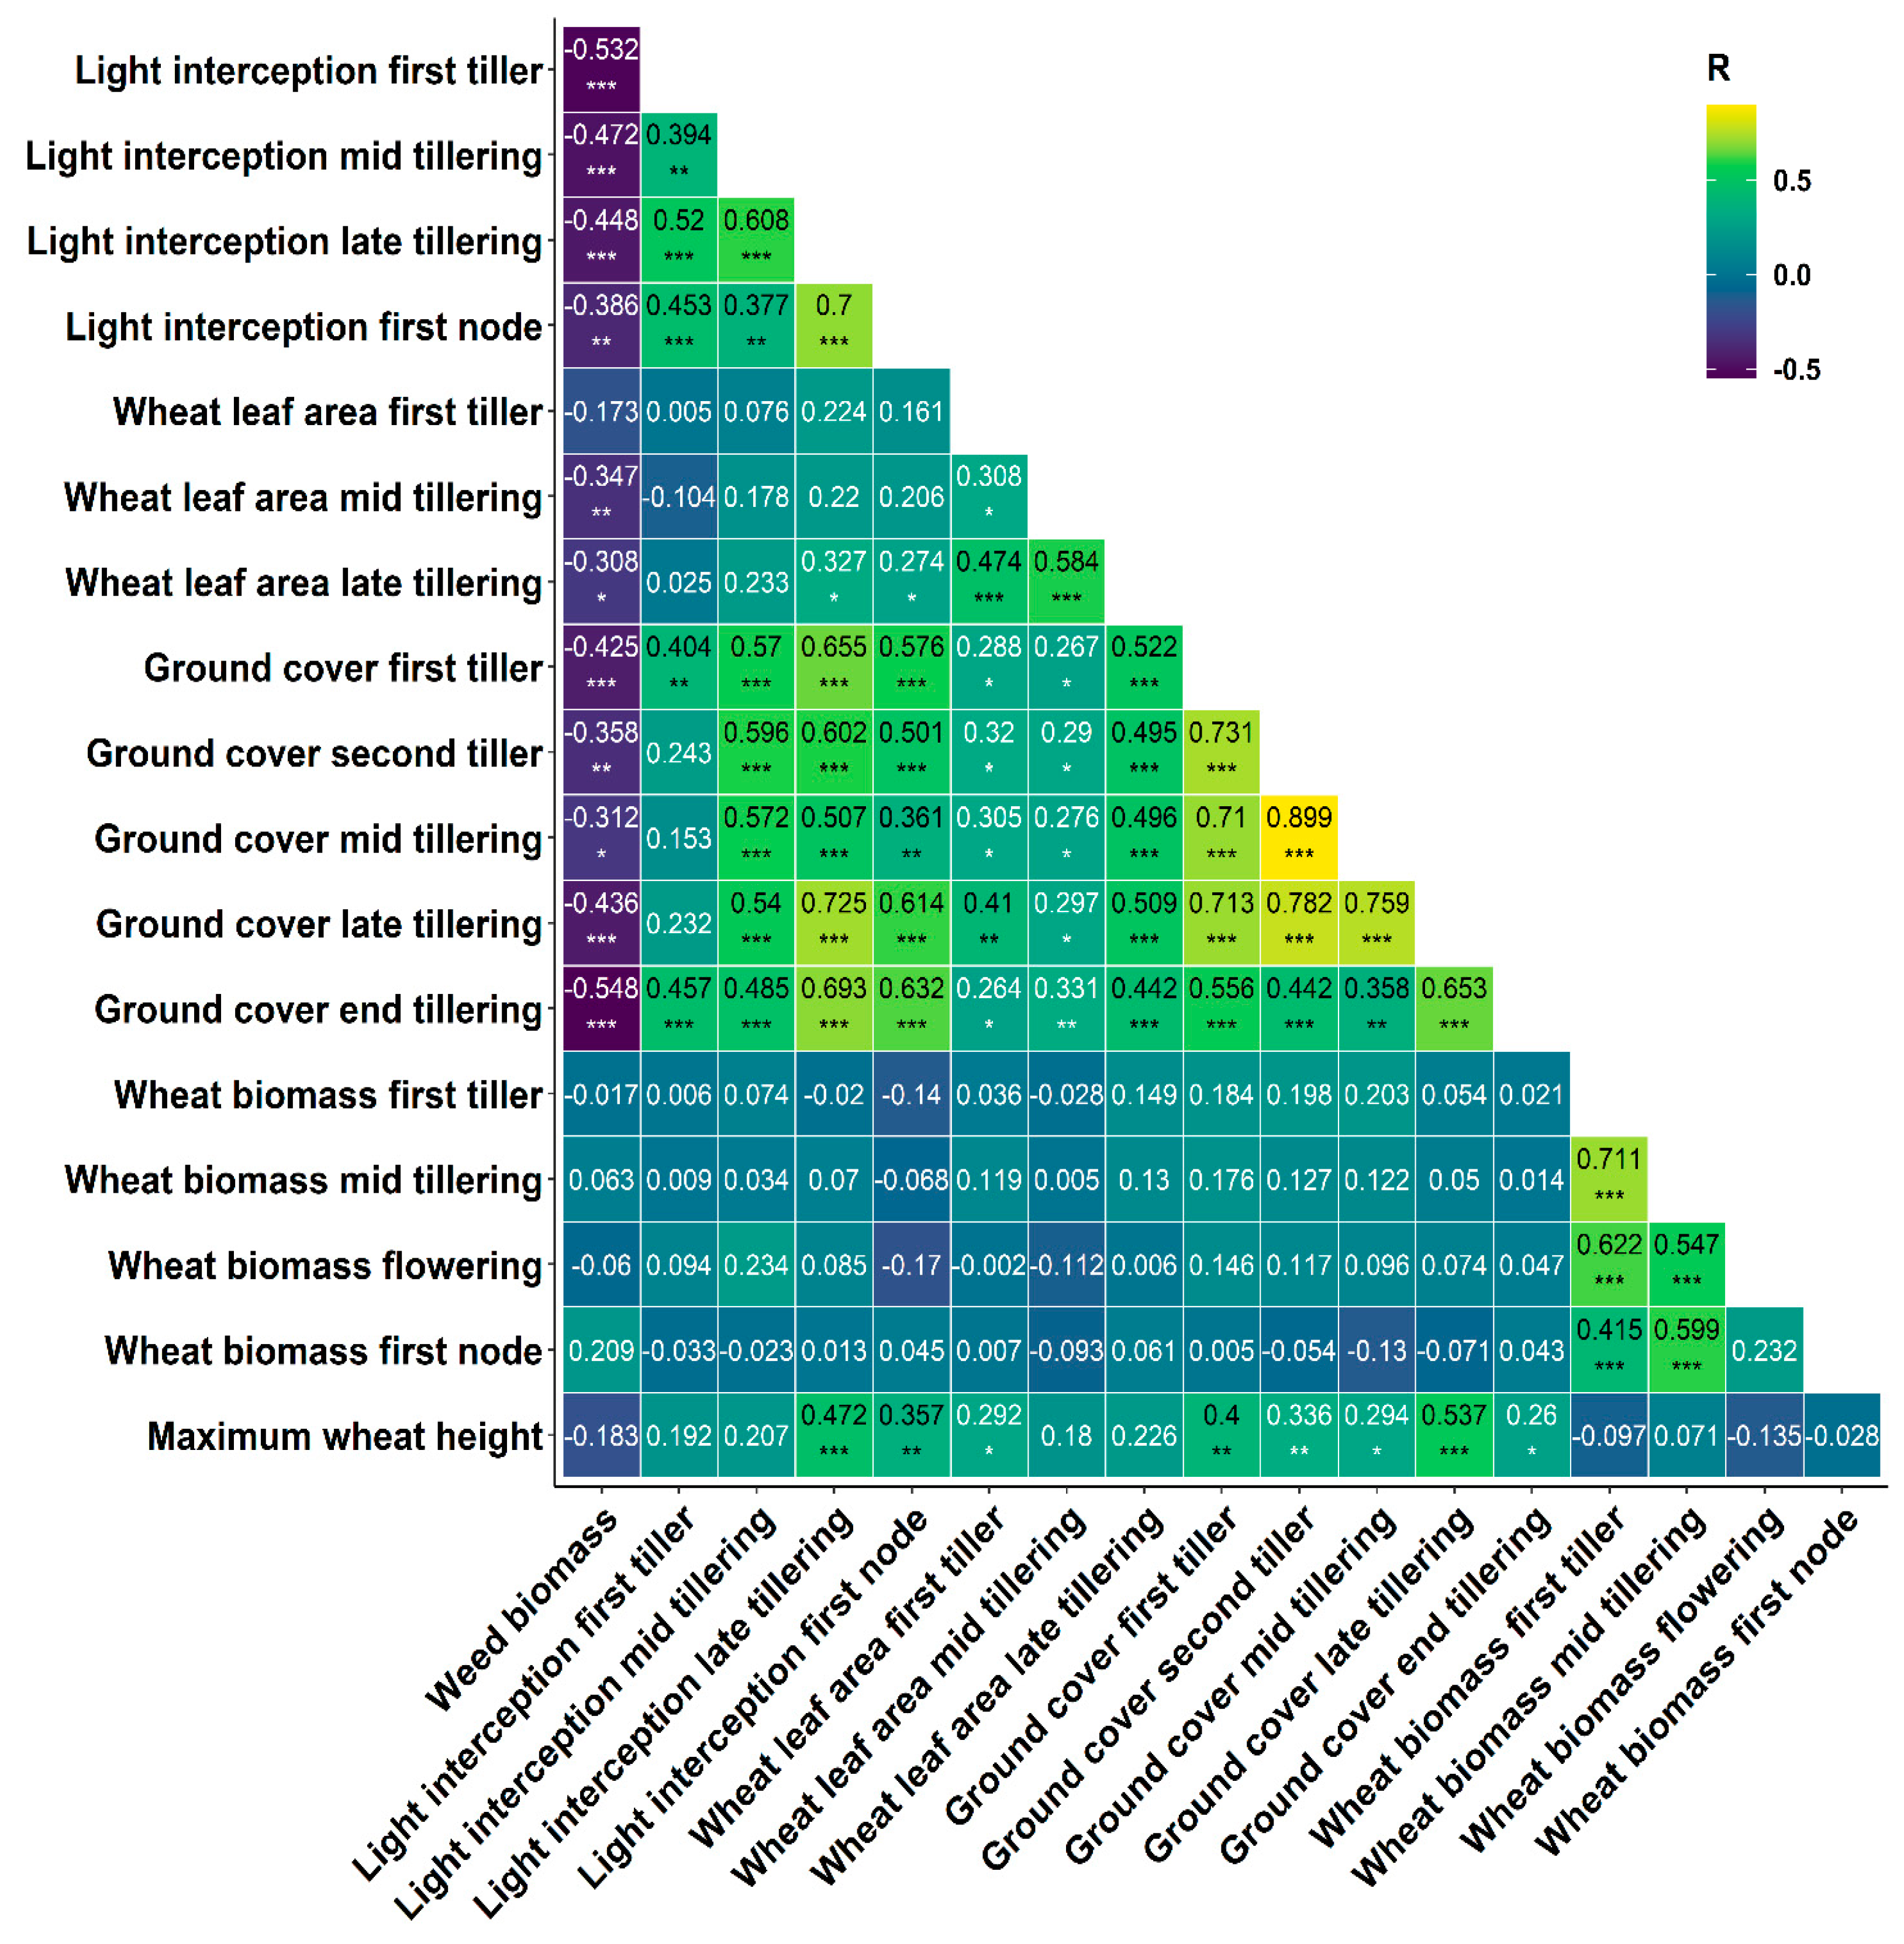
3.3.2. Weed Pressure
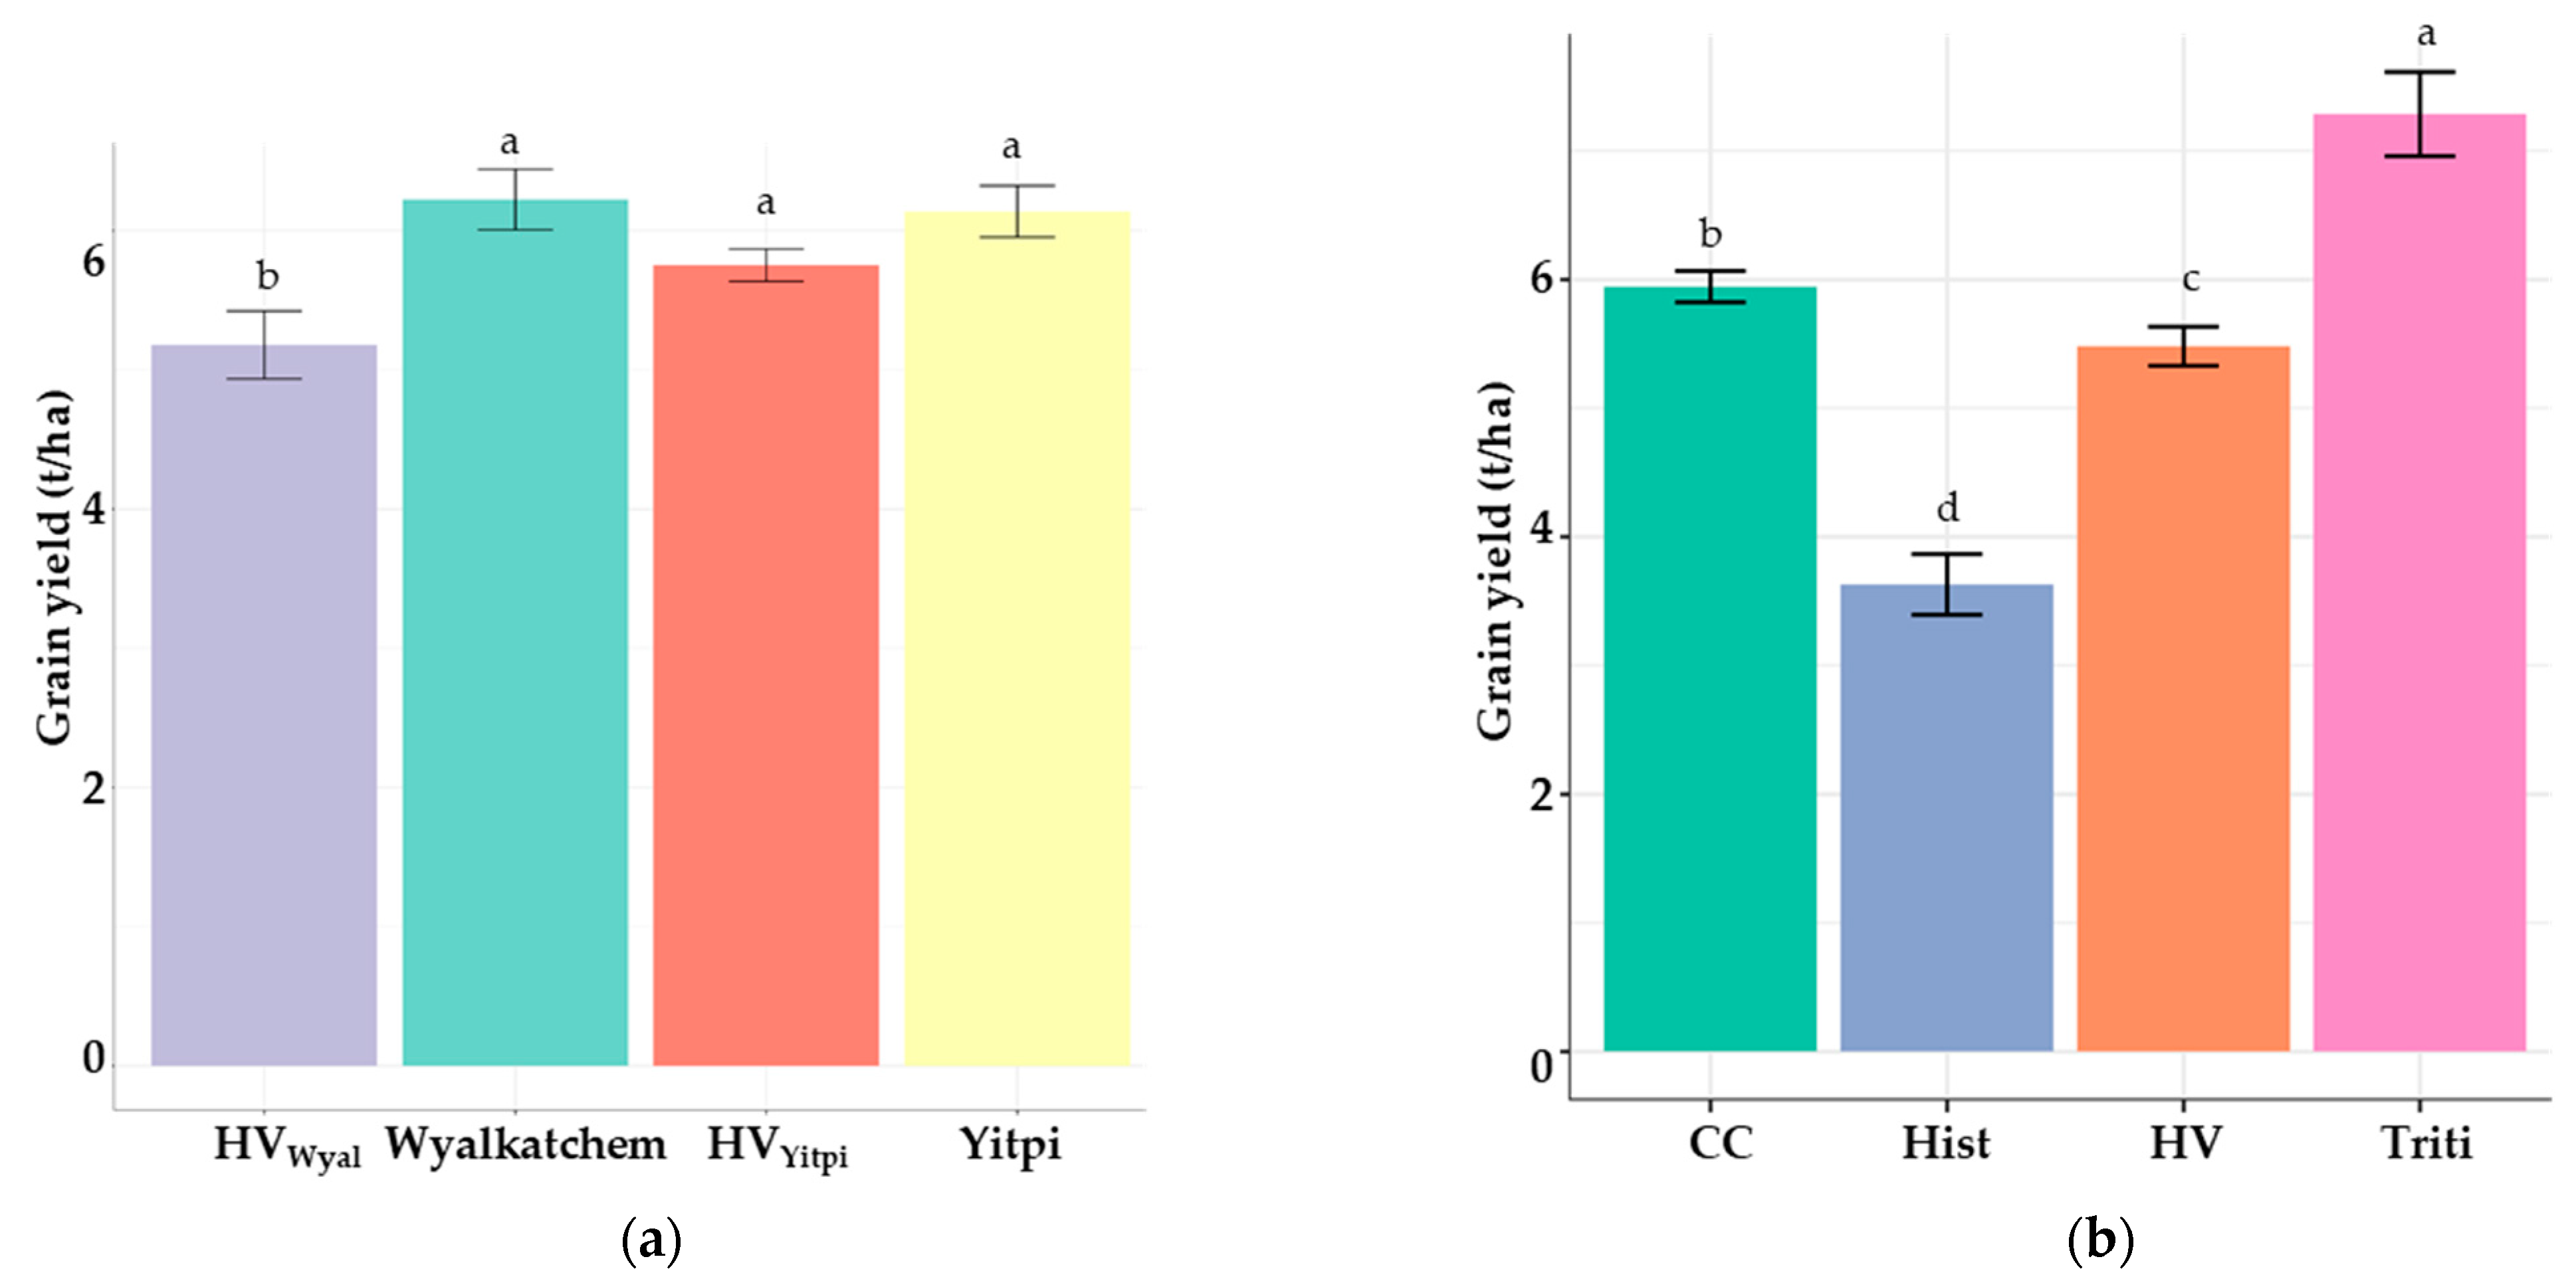
Weed presence in each plot was scored from early tillering through to early stem elongation. The dominant weed species included annual ryegrass (Lolium rigidum Gaud), fumitory (Fumaria spp. L.), and barley grass (Hordeum murinum L.). Between the first and second tiller stages, the presence of weeds increased in all of the wheat genotypes and no significant differences (p > 0.05) were detected between the HV lines and their parents (Figure 5A) or between the HV lines and other genotypes (Figure 5B). From mid tillering onwards, weed growth tended to plateau but, by late tillering and early stem elongation, the weed presence in both sets of HV lines was significantly lower than their respective parents (Figure 5A). When the four HV lines were combined and compared with other genotypes, they possessed significantly fewer weeds than the group of commercial cultivars from mid tillering onwards and were similar to triticale (Figure 5B). By the final measurement at early stem elongation, the weed pressure within the HV lines was approximately half the pressure within the commercial cultivars.
At anthesis, the total weed biomass under the Yitpi-derived HV lines (HVYitpi-1 and HVYitpi-2) was approximately 20% of the biomass for the Yitpi parent, and the weed biomass under the Wyalkatchem-derived HV lines (HVWyal-1 and HVWyal-3) was approximately 50% of the Wyalkatchem parent (Figure 6A). When the HV lines were combined, the weed biomass was similar to the Federation and triticale and comprised only 40% of the weed biomass achieved in the commercial cultivars (Figure 6B).

3.3.3. Yields

The harvest was performed using a small plot commercial harvester to determine whether increasing early vigour was associated with a yield penalty. The HV lines were first compared with their commercial parents. No significant differences were detected between Yitpi and the Yitpi-derived HV lines. Differences were detected between Wyalkatchem and the Wyalkatchem-derived HV lines (Figure 7A). When combined and compared with the other cultivars, the HV lines yielded 0.5 tonnes ha−1 (~8%) less than the commercial cultivars (Figure 7B).

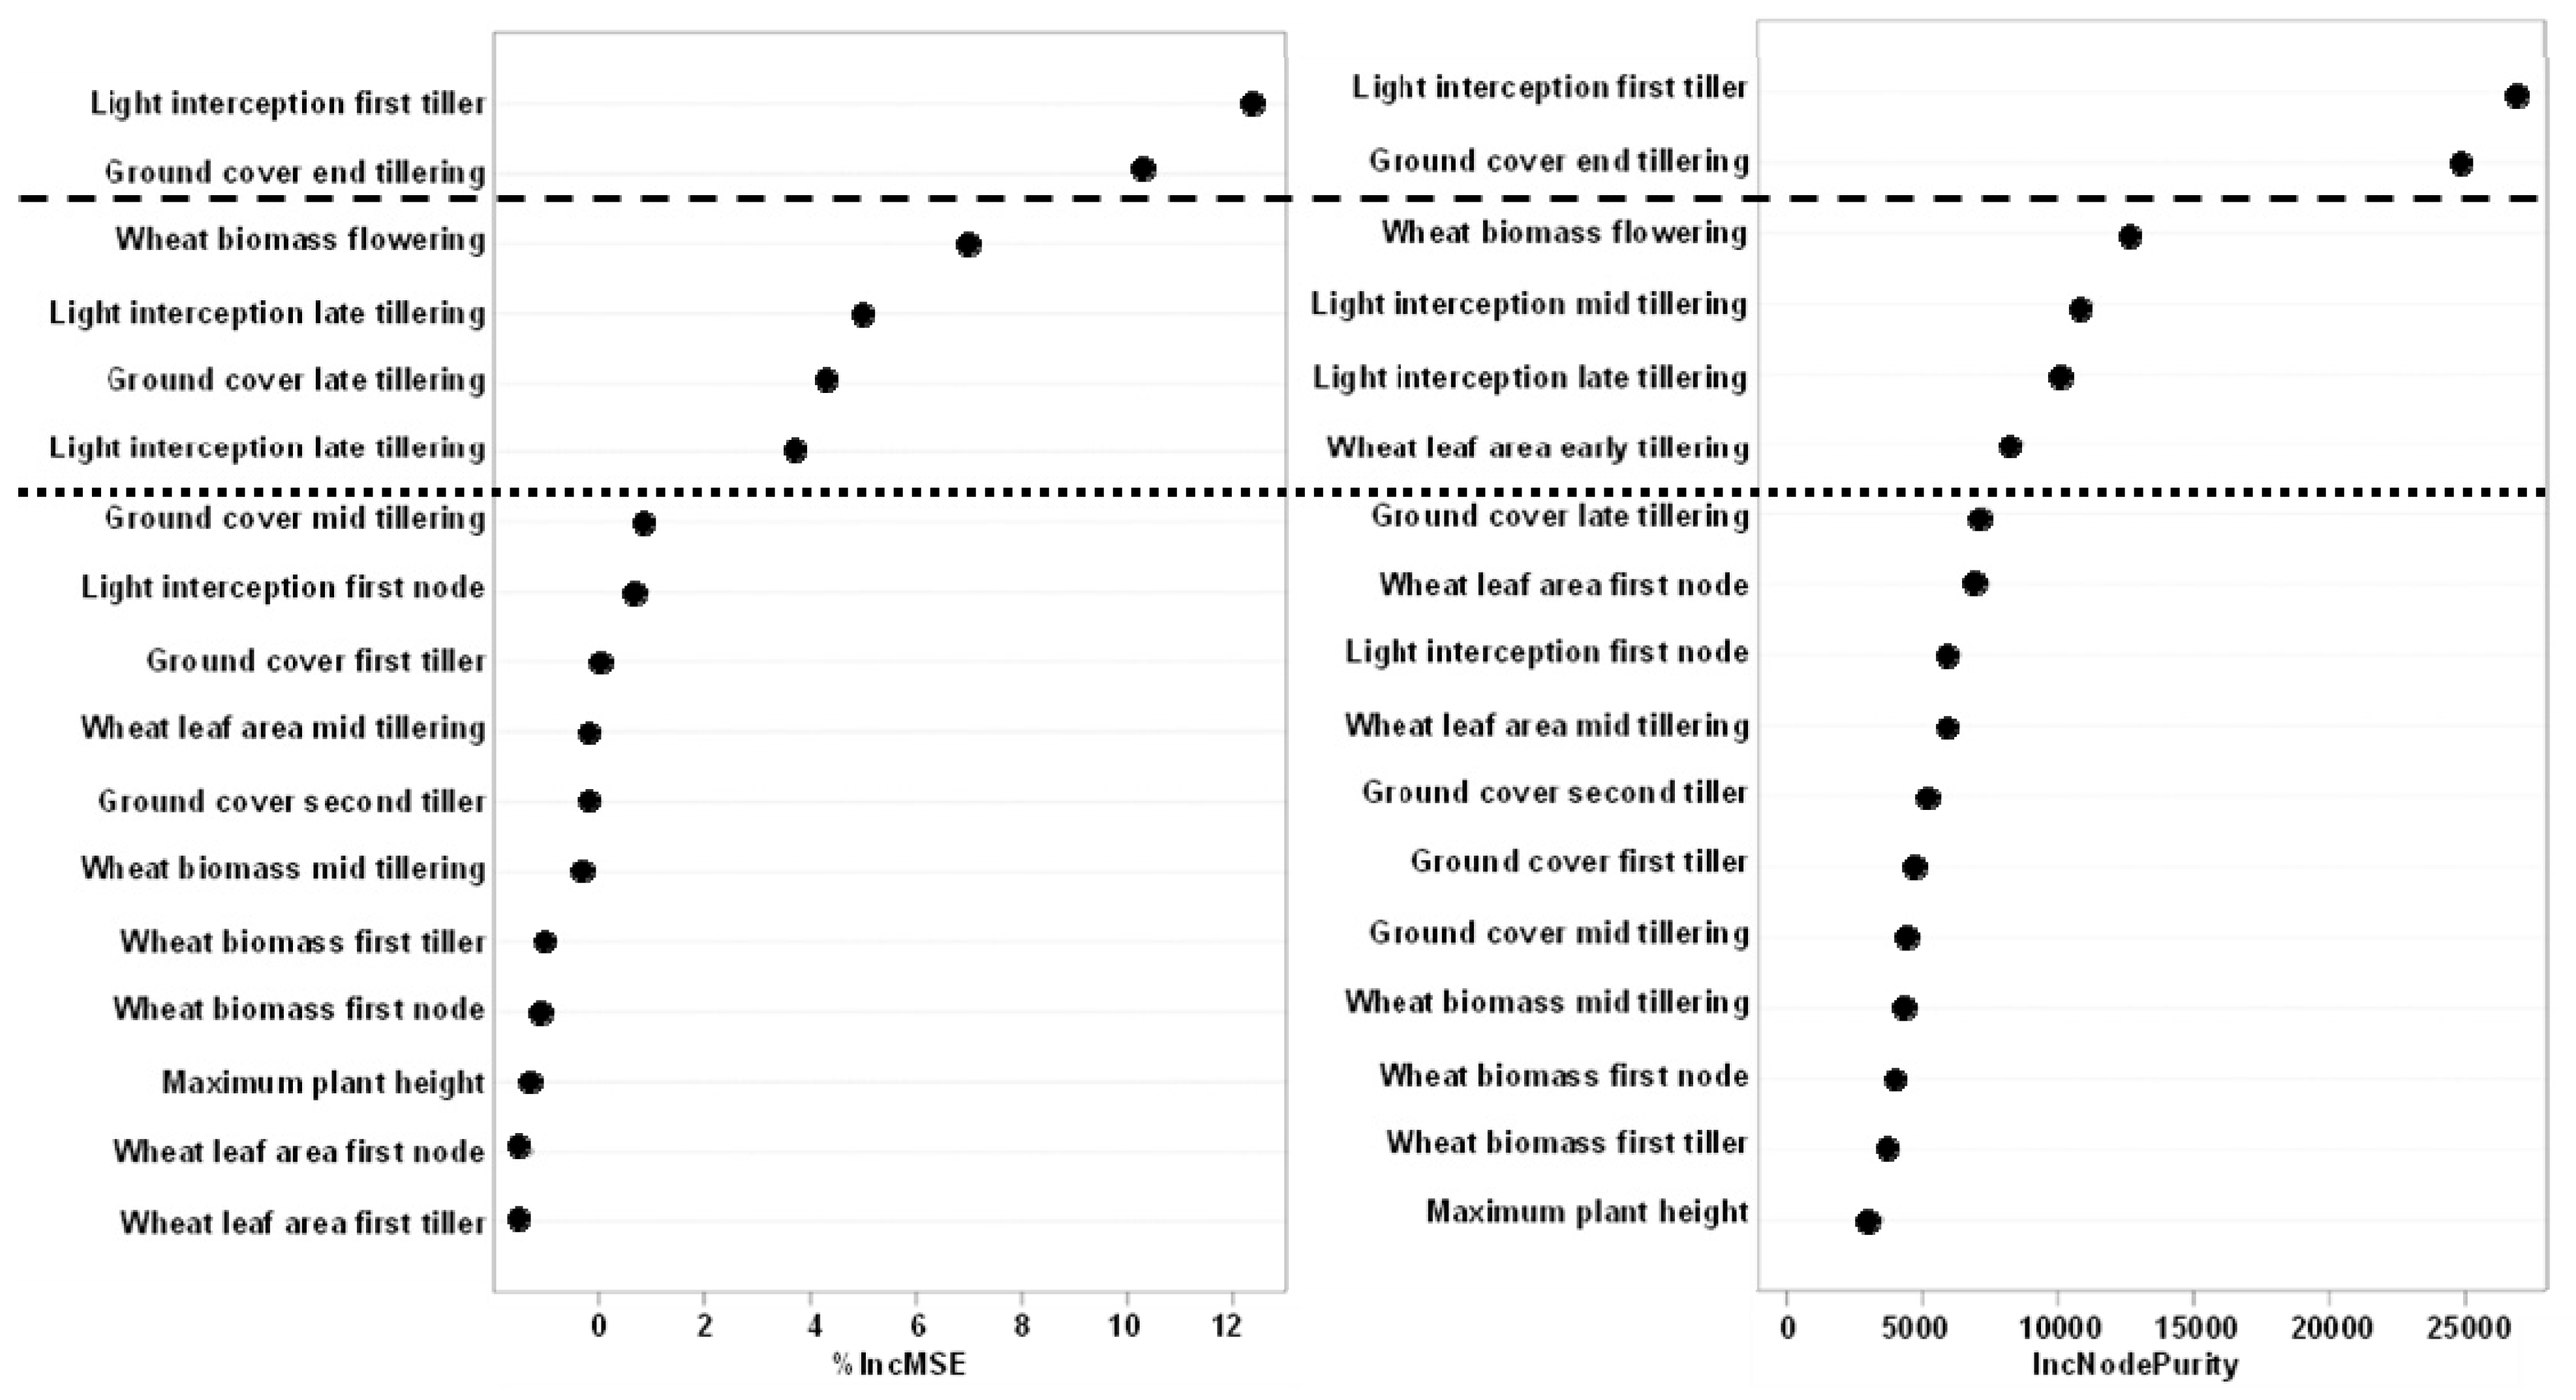
3.3.4. Modelling Weed Suppression Ability

Further analysis identified significant (p < 0.05) negative correlations between weed biomass at anthesis and several growth parameters, including leaf area, ground cover, and light interception measured during the tillering stages (Figure 8). However, the strongest correlations among all of the variables tested were between the light interception at early tillering and ground cover at the end of tillering.
To help in identifying the traits that best predict the weed pressure at anthesis, the complete dataset of all the measurements was analysed with the “Random Forest” package in R® (Figure 9). Based on the percent increase in mean squared error and increased node purity plots produced by the Random Forest regression algorithm, the variables that predict weed biomass at anthesis most reliably were light interception at early, mid, and late tillering, ground cover at late tillering and early stem elongation, and biomass at flowering. Light interception by the crops at early tillering and ground cover at the end of tillering appear to be the most important explanatory variables of these six variables. Based on these results, two models were tested with partial least square regressions. The first model included the six variables identified with the Random Forest and only two of these, light interception at the first tiller stage and ground cover at the end of tillering, had a significant impact on the model. This first model had an r² = 0.49 and accounted for about ~50% of the variability of weed biomass at anthesis (Supplementary Data Table S1). The second model included only light interception at the first tiller stage and ground cover at the end of tillering. Both explanatory variables were significant (p < 0.01) also with r² = 0.45.

4. Discussion

This study demonstrated that the early canopy growth of commercial cultivars of wheat can be significantly increased with a single cross to high vigour material. The high- vigour (HV) lines resulting from these crosses experienced less weed pressure than a group of commercial cultivars under field conditions. In addition, early shoot traits that were highly predictive of weed suppressiveness at anthesis were identified.
A top-cross between the two commercial wheat cultivars, Wyalkatchem and Yitpi, with high vigour breeding material generated HV lines with significantly greater early vigour than the commercial cultivars. This was demonstrated by the greater biomass, larger leaf area, and greater ground cover of the HV lines compared with the commercial cultivars throughout tillering in the 2019 and 2020 field trials. Indeed, the canopy growth of the HV lines was often the same as the triticale included as a positive control for early vigour.
The HV lines experienced less weed pressure than the other wheat genotypes, which is consistent with previous research identifying the significant variation in weed competitiveness among genotypes of wheat [15,29,43]. In the 2018 trial, the HV lines suppressed weed growth more than a group of commercial cultivars, and in the 2020 field trial, the HV plots had fewer weeds and less weed biomass at anthesis than the commercial cultivars tested. These commercial cultivars included Janz, Condo, and Yitpi, which are typically more competitive than many other existing cultivars [42,43]. In fact, the weed suppressiveness displayed by the HV lines was similar to triticale and to the tall heritage cultivar Federation, which is also considered competitive [42]. Plant biomass, leaf area index, specific leaf area, and production rate have all been previously linked with weed suppression [27,30,53]. Light interception by the canopy has also been shown to influence the competitive ability [21,22]. Indeed, photosynthetically active radiation (PAR) under the crop canopy positively correlated with weed seed production [28]. Our study confirms those findings and identifies light interception early at the first tiller stage and ground cover at the end of tillering as the most reliable predictors of weed pressure at anthesis. Several studies have shown the importance of flag leaf length, flag leaf orientation [25,36], and leaf angle [36,54,55] on the overall leaf area and canopy structure, which can in turn influence the PAR interception and competitiveness [28,56]. Therefore, leaf emergence and leaf angle may partially account for the genotypic variation in light interception and deserve further study.
In a research performed at the same NSW research site, Mwendwa et al. [43] were able to distinguish competitive wheat cultivars from less competitive cultivars within 100 days after sowing. The results from our experiments showed the possibility of detecting differences at significantly earlier growth stages. For instance, we could distinguish the competitive HV lines from the other commercial cultivars at early tillering (growth stage Z21) or 30 days after sowing. These findings are in agreement with certain previous studies, some performed as early as the beginning of the twentieth century, suggesting that rapid uniform germination and large canopies early in the season improve competitiveness in wheat [16,28,29,30,31,32,33,57,58]. Interestingly, the differences in vigour and weed competitiveness between the HV lines and other commercial cultivars were detected in both drier than average (2018) and wetter than average (2020) cropping seasons. These results suggest the robustness of this particular trait over very different cropping conditions.
Compared with the group of commercial cultivars, the HV lines showed a small but significant yield reduction. Previous studies investigating the link between crop competitiveness and grain harvest suggested that competitive crops may reduce the allocation to grain production by allocating more nutrients to the leaf and root growth [59]. Indeed, a yield penalty was found in some high vigour lines under weed-free conditions [60]. A yield reduction was not unexpected since the genotypes in the described experiments were selected based on high early vigour and not on agronomic performance [60]. However, the same study found that the higher vigour lines had a 10 to 20% greater yield than some well performing commercial cultivars (e.g., Derrumit) when weed pressure was more intense. Similarly, modelling by Zhao et al. [61] suggested that early vigour should improve yield in wetter seasons, similar to our 2020 field experiment. The fact that we did not see a yield increase in the very wet 2020 trial might be explained, in part, by the particular commercial cultivars used in this study. Indeed, some of the commercial cultivars (Mace and Condo) included in our 2020 trial, generally accounted for higher yield than the Derrimut cultivar used by Zerner et al. [60].
While the slight yield reduction in the HV lines could result in reduced farm income, other factors need to be considered, including grain quality, the future weed seedbank, and potential weed suppression. The HV lines reduced the weed pressure by half. Therefore, future economic analysis should include the cost savings associated with agrochemical weed management as well as any potential environmental benefits from the use of less herbicide. Weed management in Australian broad-acre crop production systems (excluding cotton) is estimated to cost AUS 1.7 billion pa. For example, fallow spraying has been estimated to cost approximately AUS 20 ha−1 per application [62], while the control of residual weeds cost approximately AUS 30 to 120 ha−1 per treatment [63]. Wheat represents more than 50% of the cropping area and production [63]. In addition, incorporating more competitive crops in the system could have a substantial impact on the farm income by reducing the cost of agrochemical weed control and by minimising yield losses caused by extra competition [64]. These financial benefits should be integrated into the economic value of using more competitive cultivars.
The very dry season in the 2018 field experiment led to canopy closure late in the season or potentially not at all. Nevertheless, rye, Federation wheat, and the HV lines suppressed 80 to 100% of potential weed growth in contrast to controls. This suggests that traits other than canopy closure may have contributed to the high level of weed suppression observed. Furthermore, in the very wet 2020 field season, our model only explained 40 to 49% of the variation in weed biomass, which again suggests that factors other than canopy size or closure may have contributed to suppression. We hypothesise that the below-ground competition could also be partially responsible for the observed differences in weed suppression. In addition, differential water use efficiency of some genotypes might enhance crop growth and result in weed suppression within the crop. Indeed, meta-data analyses [65,66] found that in the majority of studies, root competition for resources including soil moisture starts earlier than the above-ground competition and is important for the final outcome. Indeed, it has been suggested that the greater competitiveness of barley (Hordeum vulgare L.) compared with wheat relates to its greater root biomass accumulation during the early stages of growth [67]. In recent years, the selection for higher yielding wheat has been positively associated with a reduction in root system size [68], as well as a reduction in below-ground competitiveness. Therefore, it is possible that root traits associated with high vigour genotypes could contribute to the observed differences in competitiveness between the HV lines and commercial cultivars, possibly through increased water use efficiency, allelopathy or other as yet unknown factors.

5. Conclusions

We show that differences in crop competitiveness are apparent early in the growing season. Light interception at early growth stages was critical for the reduction in weed pressure. In general, early shoot vigour can be rapidly incorporated into commercial cultivars to enhance their weed competitiveness. Increasing the competitiveness of important cereal crops is a valuable and cost-effective pest management strategy, which could complement other cultural practices that are important for weed management. Indeed, herbicide efficacy can be improved when used in combination with competitive cultivars [24] and this could assist in extending their functionality and useful lifespan. Ongoing research will introduce early vigour into more recent wheat cultivars and genotypes and assess the way vigour affects the grain yield and quality. Finally, we provide evidence that the crop canopy size and architecture are possibly not the sole determinants of wheat competitiveness with weeds. Future studies should examine the physiology of above-ground traits before crop tillering as well as the way root traits and below-ground competitiveness might be contributing to crop performance in weedy environments.

Supplementary Materials

The following are available online at https://0-www-mdpi-com.brum.beds.ac.uk/article/10.3390/agronomy12020377/s1, Figure S1: Ground cover images analysed with a canopy cover program; Table S1: Output of different models tested with the partial least square method.

Author Contributions

Conceptualisation, L.A.W. and G.J.R.; methodology, L.A.W., G.J.R. and P.-W.H.; software, P.-W.H.; validation, P.-W.H. and S.G.; formal analysis, P.-W.H.; investigation, P.-W.H., S.G. and L.A.W.; resources, G.J.R., L.A.W. and P.-W.H.; data curation, L.A.W. and G.J.R.; writing—original draft preparation, P.-W.H., P.R.R., L.A.W.; writing—review and editing, P.R.R., S.G. and L.A.W.; supervision, L.A.W. and G.J.R.; project administration, L.A.W.; funding acquisition, G.J.R., L.A.W. and P.-W.H. All authors have read and agreed to the published version of the manuscript.

Funding

This research was funded by Grains Research and Development Corporation, project number CSP00182, “Breeding weed competitive wheat”, and US00084, “New technologies for weed management in the Northern Region”. P.-W.H. was supported by a CSU postgraduate research scholarship, the Graham Centre for Agricultural Innovation, and the AE Howard Memorial Trust through the Tim Healey Memorial Scholarship.

Data Availability Statement

Data are maintained at Charles Sturt University for at least 7 years following experimental completion and publication.

Acknowledgments

We acknowledge the support of field technical support staff for planting, plot maintenance, and data collection including Graeme Heath, William B. Brown, and Ian Johnson. We also thank Washington Gapare and Alex Zwart for their assistance with statistical analysis.

Conflicts of Interest

The authors declare no conflict of interest.

References

  1. Savary, S.; Willocquet, L.; Pethybridge, S.J.; Esker, P.; McRoberts, N.; Nelson, A. The global burden of pathogens and pests on major food crops. Nat. Ecol. Evol. 2019, 3, 430–439. [Google Scholar] [CrossRef] [PubMed]
  2. Manschadi, A.M.; Manske, G.; Vlek, P. Root architecture and resource acquisition—Wheat as a model plant. In Plant Roots—The Hidden Half, 4th ed.; CRC Press: Boca Raton, FL, USA, 2013; pp. 1–22. [Google Scholar]
  3. Tilman, D.; Balzer, C.; Hill, J.; Befort, B.L. Global food demand and the sustainable intensification of agriculture. Proc. Natl. Acad. Sci. USA 2011, 108, 20260–20264. [Google Scholar] [CrossRef] [PubMed] [Green Version]
  4. Chaumet, J.; Ghersi, G.; Rastoin, J. Food consumption in 2050. In Scenarios and Challenges for Feeding the World in 2050; Paillard, S., Dorin, T.S., Agrimonde, B., Eds.; Springer: Dordrecht, The Netherlands, 2014; pp. 59–72. [Google Scholar]
  5. Fischer, R.A. Definitions and determination of crop yield, yield gaps, and of rates of change. Field Crops Res. 2015, 182, 9–18. [Google Scholar] [CrossRef]
  6. Oerke, E.C. Crop losses to pests. J. Agric. Sci. 2006, 144, 31–43. [Google Scholar] [CrossRef]
  7. Gallandt, E.R.; Weiner, J. Crop-weed competition. In eLS; Wiley Online Library: Hoboken, NJ, USA, 2015; pp. 1–9. [Google Scholar]
  8. Evers, J.; Bastiaans, L. Quantifying the effect of crop spatial arrangement on weed suppression using functional-structural plant modelling. J. Plant Res. 2016, 129, 339–351. [Google Scholar] [CrossRef] [Green Version]
  9. Lowry, C.J.; Smith, R.G. Weed control through crop plant manipulation. In Non Chemical Weed Control; Jabran, K., Chauhan, B.S., Eds.; Elsevier Science: Amsterdam, The Netherlands, 2018; pp. 73–96. [Google Scholar]
  10. Lemerle, D.; Gill, G.; Murphy, C.E.; Walker, R.; Cousens, S.; Mokhtari, S.; Peltzer, D. Genetic improvement and agronomy for enhanced wheat competitiveness with weeds. Aust. J. Agric. Res. 2001, 52, 527. [Google Scholar] [CrossRef]
  11. Broster, J.C.; Koetz, E.A.; Wu, H. Herbicide resistance levels in annual ryegrass (Lolium rigidum Gaud.) and wild oat (Avena spp.) in southwestern New South Wales. Plant Prot. Q. 2013, 28, 126–132. [Google Scholar]
  12. Heap, I. Global perspective of herbicide-resistant weeds. Pest Manag. Sci. 2014, 70, 1306–1315. [Google Scholar] [CrossRef]
  13. Heap, I. The International Survey of Herbicide Resistant Weeds. Available online: https://weedscience.org/Home.aspx (accessed on 17 September 2021).
  14. Van Der Meulen, A.; Chauhan, B.S. A review of weed management in wheat using crop competition. Crop Prot. 2017, 95, 38–44. [Google Scholar] [CrossRef]
  15. Jordan, N. Prospects for weed control through crop interference. Ecol. Appl. 1993, 3, 84–91. [Google Scholar] [CrossRef]
  16. Lemerle, D.; Verbeek, B.; Orchard, B. Ranking the ability of wheat varieties to compete with Lolium rigidum. Weed Res. 2001, 41, 197–209. [Google Scholar] [CrossRef]
  17. Vandeleur, R.K.; Gill, G.S. The impact of plant breeding on the grain yield and competitive ability of wheat in Australia. Aust. J. Agric. Res. 2004, 55, 855–861. [Google Scholar] [CrossRef]
  18. Lemerle, D.; Smith, A.; Verbeek, B.; Koetz, E.; Lockley, P.; Martin, P. Incremental crop tolerance to weeds: A measure for selecting competitive ability in Australian wheats. Euphytica 2006, 149, 85–95. [Google Scholar] [CrossRef]
  19. Renton, M.; Chauhan, B.S. Modelling crop-weed competition: Why, what, how and what lies ahead? Crop Prot. 2017, 95, 101–108. [Google Scholar] [CrossRef]
  20. Kaur, S.; Kaur, R.; Chauhan, B.S. Understanding crop-weed-fertiliser-water interactions and their implications for weed management in agricultural systems. Crop Prot. 2018, 103, 65–72. [Google Scholar] [CrossRef]
  21. McPhee, C.; Aarssen, L. The separation of above- and below-ground competition in plants: A review and critique of methodology. Plant Ecol. 2001, 152, 119–136. [Google Scholar] [CrossRef]
  22. Barnes, P.; Beyschlag, W.; Ryel, R.; Flint, S.; Caldwell, M. Plant competition for light analysed with a multispecies canopy model. Oecologia 1990, 82, 560–566. [Google Scholar] [CrossRef]
  23. Reid, T.A. The Genetics of Competitive Ability in Spring Wheat. Ph.D. Thesis, University of Alberta, Edmonton, AB, Canada, 2010. [Google Scholar]
  24. Lemerle, D.; Verbeek, B.; Cousens, R.D.; Coombes, N.E. The potential for selecting wheat varieties strongly competitive against weeds. Weed Res. 1996, 36, 505–513. [Google Scholar] [CrossRef]
  25. Richards, M.C. Crop competitiveness as an aid to weed control. In Proceedings of the Crop Protection Conf Weeds, Brighton, UK, 20–23 November 1989; pp. 573–578. [Google Scholar]
  26. Rebetzke, G.J.; Richards, R.A. Genetic improvement of early vigour in wheat. Aust. J. Agric. Res. 1999, 50, 291–301. [Google Scholar] [CrossRef]
  27. Maydup, M.L.; Graciano, C.; Guiamet, J.J.; Tambussi, E.A. Analysis of early vigour in twenty modern cultivars of bread wheat (Triticum aestivum L.). Crop Pasture Sci. 2012, 63, 987–996. [Google Scholar] [CrossRef]
  28. Black, C.C.; Chen, T.M.; Brown, R.H. Biochemical basis for plant competition. Weed Sci. 1969, 17, 338–344. [Google Scholar] [CrossRef]
  29. Gaudet, C.L.; Keddy, P.A. A comparative approach to predicting competitive ability from plant traits. Nature 1988, 334, 242–243. [Google Scholar] [CrossRef]
  30. Coleman, R.K.; Gill, G.S.; Rebetzke, G.J. Identification of quantitative trait loci for traits conferring weed competitiveness in wheat (Triticum aestivum L.). Aust. J. Agric. Res. 2001, 52, 1235–1246. [Google Scholar] [CrossRef]
  31. Rebetzke, G.J.; Botwright, T.L.; Moore, C.S.; Richards, R.A.; Condon, A.G. Genotypic variation in specific leaf area for genetic improvement of early vigour in wheat. Field Crops Res. 2004, 88, 179–189. [Google Scholar] [CrossRef]
  32. Mason, H.; Navabi, A.; Frick, B.; O’Donovan, J.; Spaner, D. The weed-competitive ability of Canada western red spring wheat cultivars grown under organic management. Crop Sci. 2007, 47, 1167–1176. [Google Scholar] [CrossRef]
  33. Zerner, M.C.; Rebetzke, G.J.; Gill, G.S. Genotypic stability of weed competitive ability for bread wheat genotypes in multiple environments. Crop Pasture Sci. 2016, 67, 695–702. [Google Scholar] [CrossRef]
  34. Rebetzke, G.; Condon, A.; Richards, R. Inheritance of coleoptile tiller appearance and size in wheat. Aust. J. Agric. Res. 2008, 59, 863–873. [Google Scholar] [CrossRef]
  35. Ogg, A.G., Jr.; Seefeldt, S.S. Characterising traits that enhance the competitiveness of winter wheat (Triticum aestivum) against jointed goatgrass (Aegilops cylindrica). Weed Sci. 1999, 47, 74–80. [Google Scholar] [CrossRef]
  36. Murphy, K.M.; Dawson, J.C.; Jones, S.S. Relationship among phenotypic growth traits, yield and weed suppression in spring wheat landraces and modern cultivars. Field Crops Res. 2008, 105, 107–115. [Google Scholar] [CrossRef]
  37. Huel, D.G.; Hucl, P. Genotypic variation for competitive ability in spring wheat. Plant Breed. 1996, 115, 325–329. [Google Scholar] [CrossRef]
  38. Richards, M.C.; Whytock, G.P. Varietal competitiveness with weeds. Asp. Appl. Biol. 1993, 34, 345–354. [Google Scholar]
  39. Thomas, J.; Schaalje, G.; Grant, M. Height, competition and yield potential in winter wheat. Euphytica 1993, 74, 9–17. [Google Scholar] [CrossRef]
  40. Cossani, C.M.; Sadras, V. Symmetric response to competition in binary mixtures of cultivars associates with genetic gain in wheat yield. Evol. Appl. 2021, 14, 2064–2078. [Google Scholar] [CrossRef]
  41. Zhang, L.; Richards, R.A.; Condon, A.G.; Liu, D.C.; Rebetzke, G.J. Recurrent selection for wider seedling leaves increases early biomass and leaf area in wheat (Triticum aestivum L.). J. Exp. Bot. 2015, 66, 1215–1226. [Google Scholar] [CrossRef] [Green Version]
  42. Rebetzke, G.; Ingvordsen, C.; Newman, P.; Weston, L.A.; French, B.; Gill, G. Delivering weed-competitive wheat breeding lines to growers. In GRDC Grains Research Update; GRDC: Wagga Wagga, Australia, 2018; pp. 35–40. [Google Scholar]
  43. Mwendwa, J.M.; Brown, W.B.; Weidenhamer, J.D.; Weston, P.A.; Quinn, J.C.; Wu, H.; Weston, L.A. Evaluation of commercial wheat cultivars for canopy architecture, early vigour, weed suppression and yield. Agronomy 2020, 10, 983. [Google Scholar] [CrossRef]
  44. Beres, B.L.; Harker, K.N.; Clayton, G.W.; Bremer, E.; Blackshaw, R.E.; Graf, R.J. Weed-competitive ability of spring and winter cereals in the northern great plains. Weed Technol. 2010, 24, 108–116. [Google Scholar] [CrossRef]
  45. Zadoks, J.C.; Chang, T.T.; Konzak, C.F. A decimal code for the growth stages of cereals. Weed Res. 1974, 14, 415–421. [Google Scholar] [CrossRef]
  46. Li, Y.; Chen, D.; Walker, C.; Angus, J. Estimating the nitrogen status of crops using a digital camera. Field Crop Res. 2010, 3, 221–227. [Google Scholar] [CrossRef]
  47. Worthington, M.; Reberg-Horton, S.; Jordan, D.; Murphy, J. A comparison of methods for evaluating the suppressive ability of winter wheat cultivars against Italian ryegrass (Lolium perenne). Weed Sci. 2013, 61, 491–499. [Google Scholar] [CrossRef]
  48. R Core Team. R: A Language and Environment for Statistical Computing; R Foundation for Statistical Computing: Vienna, Austria, 2020. [Google Scholar]
  49. Lenth, R.; Singmann, H.; Love, J.; Buerkner, P.; Herve, M. Package “emmeans”: Estimated marginal means, aka least-squares means. In R Package Version 1.3.0; Available online: https://cran.r-project.org/bin/windows/base/ (accessed on 17 September 2021).
  50. Wang, L.A.; Zhou, X.; Zhu, X.; Dong, Z.; Guo, W. Estimation of biomass in wheat using random forest regression algorithm and remote sensing data. Crop J. 2016, 4, 212–219. [Google Scholar] [CrossRef] [Green Version]
  51. Liaw, A.; Weiner, M. Classification and regression by Random Forest. R News 2002, 2, 18–22. [Google Scholar]
  52. Liland, K.; Mevil, B.; Wehrens, R. Multivariate regression methods. In Partial Least Squares Regression (PLSR), Principal Component Regression (PCR) and Canonical Powered Partial Least Squares (CPPLS); Available online: https://cran.r-project.org/web/packages/pls/pls.pdf (accessed on 17 September 2021).
  53. Gée, C.; Denimal, E.; Merienne, J.; Larmure, A. Evaluation of weed impact on wheat biomass by combining visible imagery with a plant growth model: Towards new non-destructive indicators for weed competition. Precis. Agric. 2021, 22, 550–568. [Google Scholar] [CrossRef]
  54. Korres, N.E.; Froud-Williams, R.J. Effects of winter wheat cultivars and seed rate on the biological characteristics of naturally occurring weed flora. Weed Res. 2002, 42, 417–428. [Google Scholar] [CrossRef]
  55. Seavers, G.P.; Wright, K.J. Crop canopy development and structure influence weed suppression. Weed Res. 1999, 39, 319–328. [Google Scholar] [CrossRef]
  56. Reid, T.A.; Navabi, A.; Cahill, J.C.; Salmon, D.; Spaner, D. A genetic analysis of weed competitive ability in spring wheat. Can. J. Plant Sci. 2009, 89, 591–599. [Google Scholar] [CrossRef]
  57. Pavlychenko, T.K.; Harrington, J.B. Competitive efficiency of weeds and cereal crops. Can. J. Res. 1934, 10, 77–94. [Google Scholar] [CrossRef]
  58. Pavlychenko, T.K.; Harrington, J.B. Root development of weeds and crops in competition under dry farming. Sci. Agric. 1935, 16, 151–160. [Google Scholar]
  59. Weiner, J.; Du, Y.L.; Zhang, C.; Qin, X.L.; Li, F.M. Evolutionary agroecology: Individual fitness and population yield in wheat (Triticum aestivum). Ecology 2017, 98, 2261–2266. [Google Scholar] [CrossRef] [PubMed] [Green Version]
  60. Zerner, M.; Gill, G.; Vandeleur, R. Effect of height on the competitive ability of wheat with oats. Agron. J. 2008, 100, 1729–1734. [Google Scholar] [CrossRef]
  61. Zhao, Z.; Rebetzke, G.J.; Zheng, B.; Chapman, S.C.; Wang, E. Modelling impact of early vigour on wheat yield in dryland regions. J. Exp. Bot. 2019, 70, 2535–2548. [Google Scholar] [CrossRef] [PubMed]
  62. Cameron, J.; Storrie, A. Summer Fallow Weed Management in The Southern and Western Grains Regions of Australia—A Reference for Grain Growers and Adviser. 2014. Available online: https://grdc.com.au/__data/assets/pdf_file/0028/98632/summer-fallow-weed-management-manual.pdf.pdf?utm_source=website&utm_medium=download_link&utm_campaign=pdf_download&utm_term=South;%20West&utm_content=Summer%20fallow%20weed%20management (accessed on 17 September 2021).
  63. Schefe, C. Research for the Riverine plains 2016. 2016. Available online: https://riverineplains.org.au/wp-content/uploads/2016/10/Research-for-the-Riverine-Plains-2016.pdf (accessed on 17 September 2021).
  64. McLeod, R. Annual Costs of Weeds in Australia; eSYS Development Pty Limited; Centre for Invasive Species Solutions: Canberra, Australia, 2018. [Google Scholar]
  65. Kiær, L.P.; Weisbach, A.N.; Weiner, J. Root and shoot competition: A meta-analysis. J. Ecol. 2013, 101, 1298–1312. [Google Scholar] [CrossRef]
  66. Wilson, J. Shoot competition and root competition. J. Appl. Ecol. 1988, 25, 279–296. [Google Scholar] [CrossRef]
  67. Sardana, V.; Mahajan, G.; Jabran, K.; Chauhan, B.S. Role of competition in managing weeds: An introduction to the special issue. Crop Prot. 2017, 95, 1–7. [Google Scholar] [CrossRef]
  68. Evans, G.; Biernaskie, J.M.; Cockram, J.; Marr, E.C.; Oliver, A.G.; Ober, E.; Jones, H. Effects of breeding history and crop management on the root architecture of wheat. Plant Soil 2020, 452, 587–600. [Google Scholar]
Figure 1. Weed suppression in the 2018 field trial. Weed suppression was estimated by comparing the weed cover in the plots with the weed cover in the inter-plot border zones at maturity. The genotypes were grouped into commercial cultivars (CC, green, n = 32), a historical cultivar (Hist, blue, n = 8), the high vigour wheat lines (HV, orange, n = 16), and rye (pink, n = 8). Error bars are standard errors. Different letters identify significant differences between means at every growth stage (p = 0.05).
Agronomy 12 00377 g001
Figure 2. Comparison of leaf area and biomass in the 2019 field trial. Results show (a) leaf area and (b) shoot biomass for the commercial cultivars (CC, green, n = 24), a historical wheat cultivar (Hist, blue, n = 24), the high vigour lines (HV, orange, n = 60), and triticale (pink, n = 12). The progression of the y-axis was interrupted for (a) and (b). Error bars indicate standard errors. The different letters identify significant differences at every growth stage between means at p = 0.05.
Agronomy 12 00377 g002
Figure 3. Comparison of canopy growth of the HV lines and parental lines in the 2020 field trial. The genotypes included the HV lines derived from Wyalkatchem (purple, n = 20), the Wyalkatchem parent (red, n = 10), the HV lines derived from Yitpi (green, n = 20), and the Yitpi parent (yellow, n = 10). These were assessed for (a) biomass, (b) leaf area, (c) ground cover, and (d) light interception. The progression of the y-axis was interrupted for (a) and (b). Data presented include the treatment mean and standard errors. The different letters identify significant differences between the genotypes within each growth stage (p = 0.05).
Agronomy 12 00377 g003aAgronomy 12 00377 g003b
Figure 4. Comparison of canopy growth of the HV lines with other genotypes in the 2020 field trial. The genotypes included a group of five commercial cultivars (CC, green, n = 50), a historical wheat variety (Hist, blue, n = 10), the four high vigour lines (HV, orange, n = 40), and triticale (pink, n = 10). These groups were assessed for (a) biomass, (b) leaf area, (c) ground cover, and (d) light interception. The progression of the y-axis was interrupted for (a) and (b). Data show the mean and standard errors. Different letters above the bars indicate significant differences within each growth stage (p = 0.05).
Agronomy 12 00377 g004
Figure 5. Comparison of the weed presence under the HV lines with other genotypes in the 2020 field trial. Weed pressure was calculated as the percentage of ground covered by weed inside and outside the plots. Genotypes assessed in (a) were the HV lines derived from Wyalkatchem (purple, n = 20), the Wyalkatchem parent line (red, n = 10), HV lines derived from Yitpi (green, n = 20), and the Yitpi parental line (yellow, n = 10). Genotypes assessed in (b) include five commercial cultivars (CC, green, n = 50), a historical wheat variety (Hist, blue, n = 10), the four high vigour lines (HV, orange, n = 40), and triticale (pink, n = 10). Data show mean and standard errors. Different letters above the bars indicate significant differences within each growth stage (p = 0.05).
Agronomy 12 00377 g005
Figure 6. Comparison of the weed pressure of HV lines with other genotypes in the 2020 field trial. Weed biomass was measured under each plot at anthesis. Genotypes assessed in (a) were the HV lines derived from Wyalkatchem (purple, n = 20), the Wyalkatchem parent line (red, n = 10), HV lines derived from Yitpi (green, n = 20) and the Yitpi parental line (yellow, n = 10). Genotypes assessed in (b) include five commercial cultivars (CC, green, n = 50), a historical wheat variety (Hist, blue, n = 10), the four high vigour lines (HV, orange, n = 40), and triticale (pink, n = 10). Data show means and standard errors. Different letters indicate significant differences within each growth stage (p = 0.05).
Agronomy 12 00377 g006
Figure 7. Comparison of grain yields of the HV lines with other genotypes in the 2020 field trial. Genotypes assessed in (a) were the HV lines derived from Wyalkatchem (purple, n = 20), the Wyalkatchem parent line (red, n = 10), HV lines derived from Yitpi (green, n = 20), and the Yitpi parental line (yellow, n = 10). Genotypes assessed in (b) include five commercial cultivars (CC, green, n = 50), a historical wheat variety (Hist, blue, n = 10), the four high vigour lines (HV, orange, n = 40), and triticale (pink, n = 10). Data show means and standard errors. Different letters indicate significant differences within each growth stage (p = 0.05).
Agronomy 12 00377 g007
Figure 8. Correlation plot with r values between weed biomass and crop growth traits in the 2020 field trial. The colours indicate the correlation value between the two traits and the significant levels represented are indicated as follows: p < 0.05: *; p < 0.01: **; and p < 0.001: ***.
Agronomy 12 00377 g008
Figure 9. Identification of the important features for predicting weed biomass at anthesis. The importance level of the different variables in explaining differences in weed biomass at anthesis. The model included all of the variables measured above-ground in the field in Wagga Wagga in 2020 to explain the weed biomass present at tillering. The percent increase in mean squared error (%IncMSE) shows the decrease in accuracy when a particular variable is removed from the model. The increased node purity (IncNodePurity) is based on the decrease of Gini impurity when a variable is chosen to split a node. The importance levels indicate that light interception at the first tiller stage and ground cover at the end of tillering are the most important features to predict weed biomass at anthesis, given a threshold of 4%IncMSE (dotted line). However, if the threshold is set at 10%IncMSE (dashed line), only light interception at the first tiller stage and ground cover at the end of tillering are important parameters associated with variation observed.
Agronomy 12 00377 g009
Table 1. Monthly temperatures and rainfall (mm) and the total in-crop rainfall for the Wagga Wagga field trial site in 2018, 2019, and 2020 from the Australian government Bureau of meteorology (Australian Bureau of Meteorology, www.bom.gov.au, accessed on 14 November 2021).
Wagga WaggaJanFebMarAprMayJunJulAugSepOctNovDecAnnualIn-Crop
Season
Long- term Max temp (°C)31.230.527.222.21713.712.514.417.421.125.229.221.8
Min temp (°C)16.416.914.110.16.84.33.34.368.511.114.29.7
rain (mm)41.639.440.645.555.148.555.65454.260.642.840.7577.5363.6
2018Max temp (°C)34.332.429.927.718.414.813.814.719.12626.332.224.1
Min temp (°C)8.316.213.611.25.84.11.72.93.89.51317.59.8
rain (mm)69.853.610.253036.815.62126.426.47965.8439.6253.1
2019Max temp (°C)37.931.928.524.717.414.413.814.119.62627.133.624.1
Min temp (°C)22.316.715.311.86.52.83.41.13.78.211.416.19.9
rain (mm)28.211.4412453.9432318.820856.69.2337.1200.95
2020Max temp (°C)34.231.226.720.616.71413.513.819.222.529.228.922.5
Min temp (°C)17.718.114.29.54.83.92.946.710.413.313.19.9
rain (mm)2021.88186.72760.42170.257.48560.278.2668.9406.8
Publisher’s Note: MDPI stays neutral with regard to jurisdictional claims in published maps and institutional affiliations.

