
Vegetable Trade Flows and Chain Competitiveness Linkage Analysis Based on Spatial Panel Econometric Modelling and Porter’s Diamond Model

 ,
,  , , , and
Abstract
:1. Introduction
2. Materials and Methods
3. Results
3.1. Spatial Panel Econometric Modelling
3.2. Competitiveness Analysis: Balassa Index and Porter’s Diamond Model
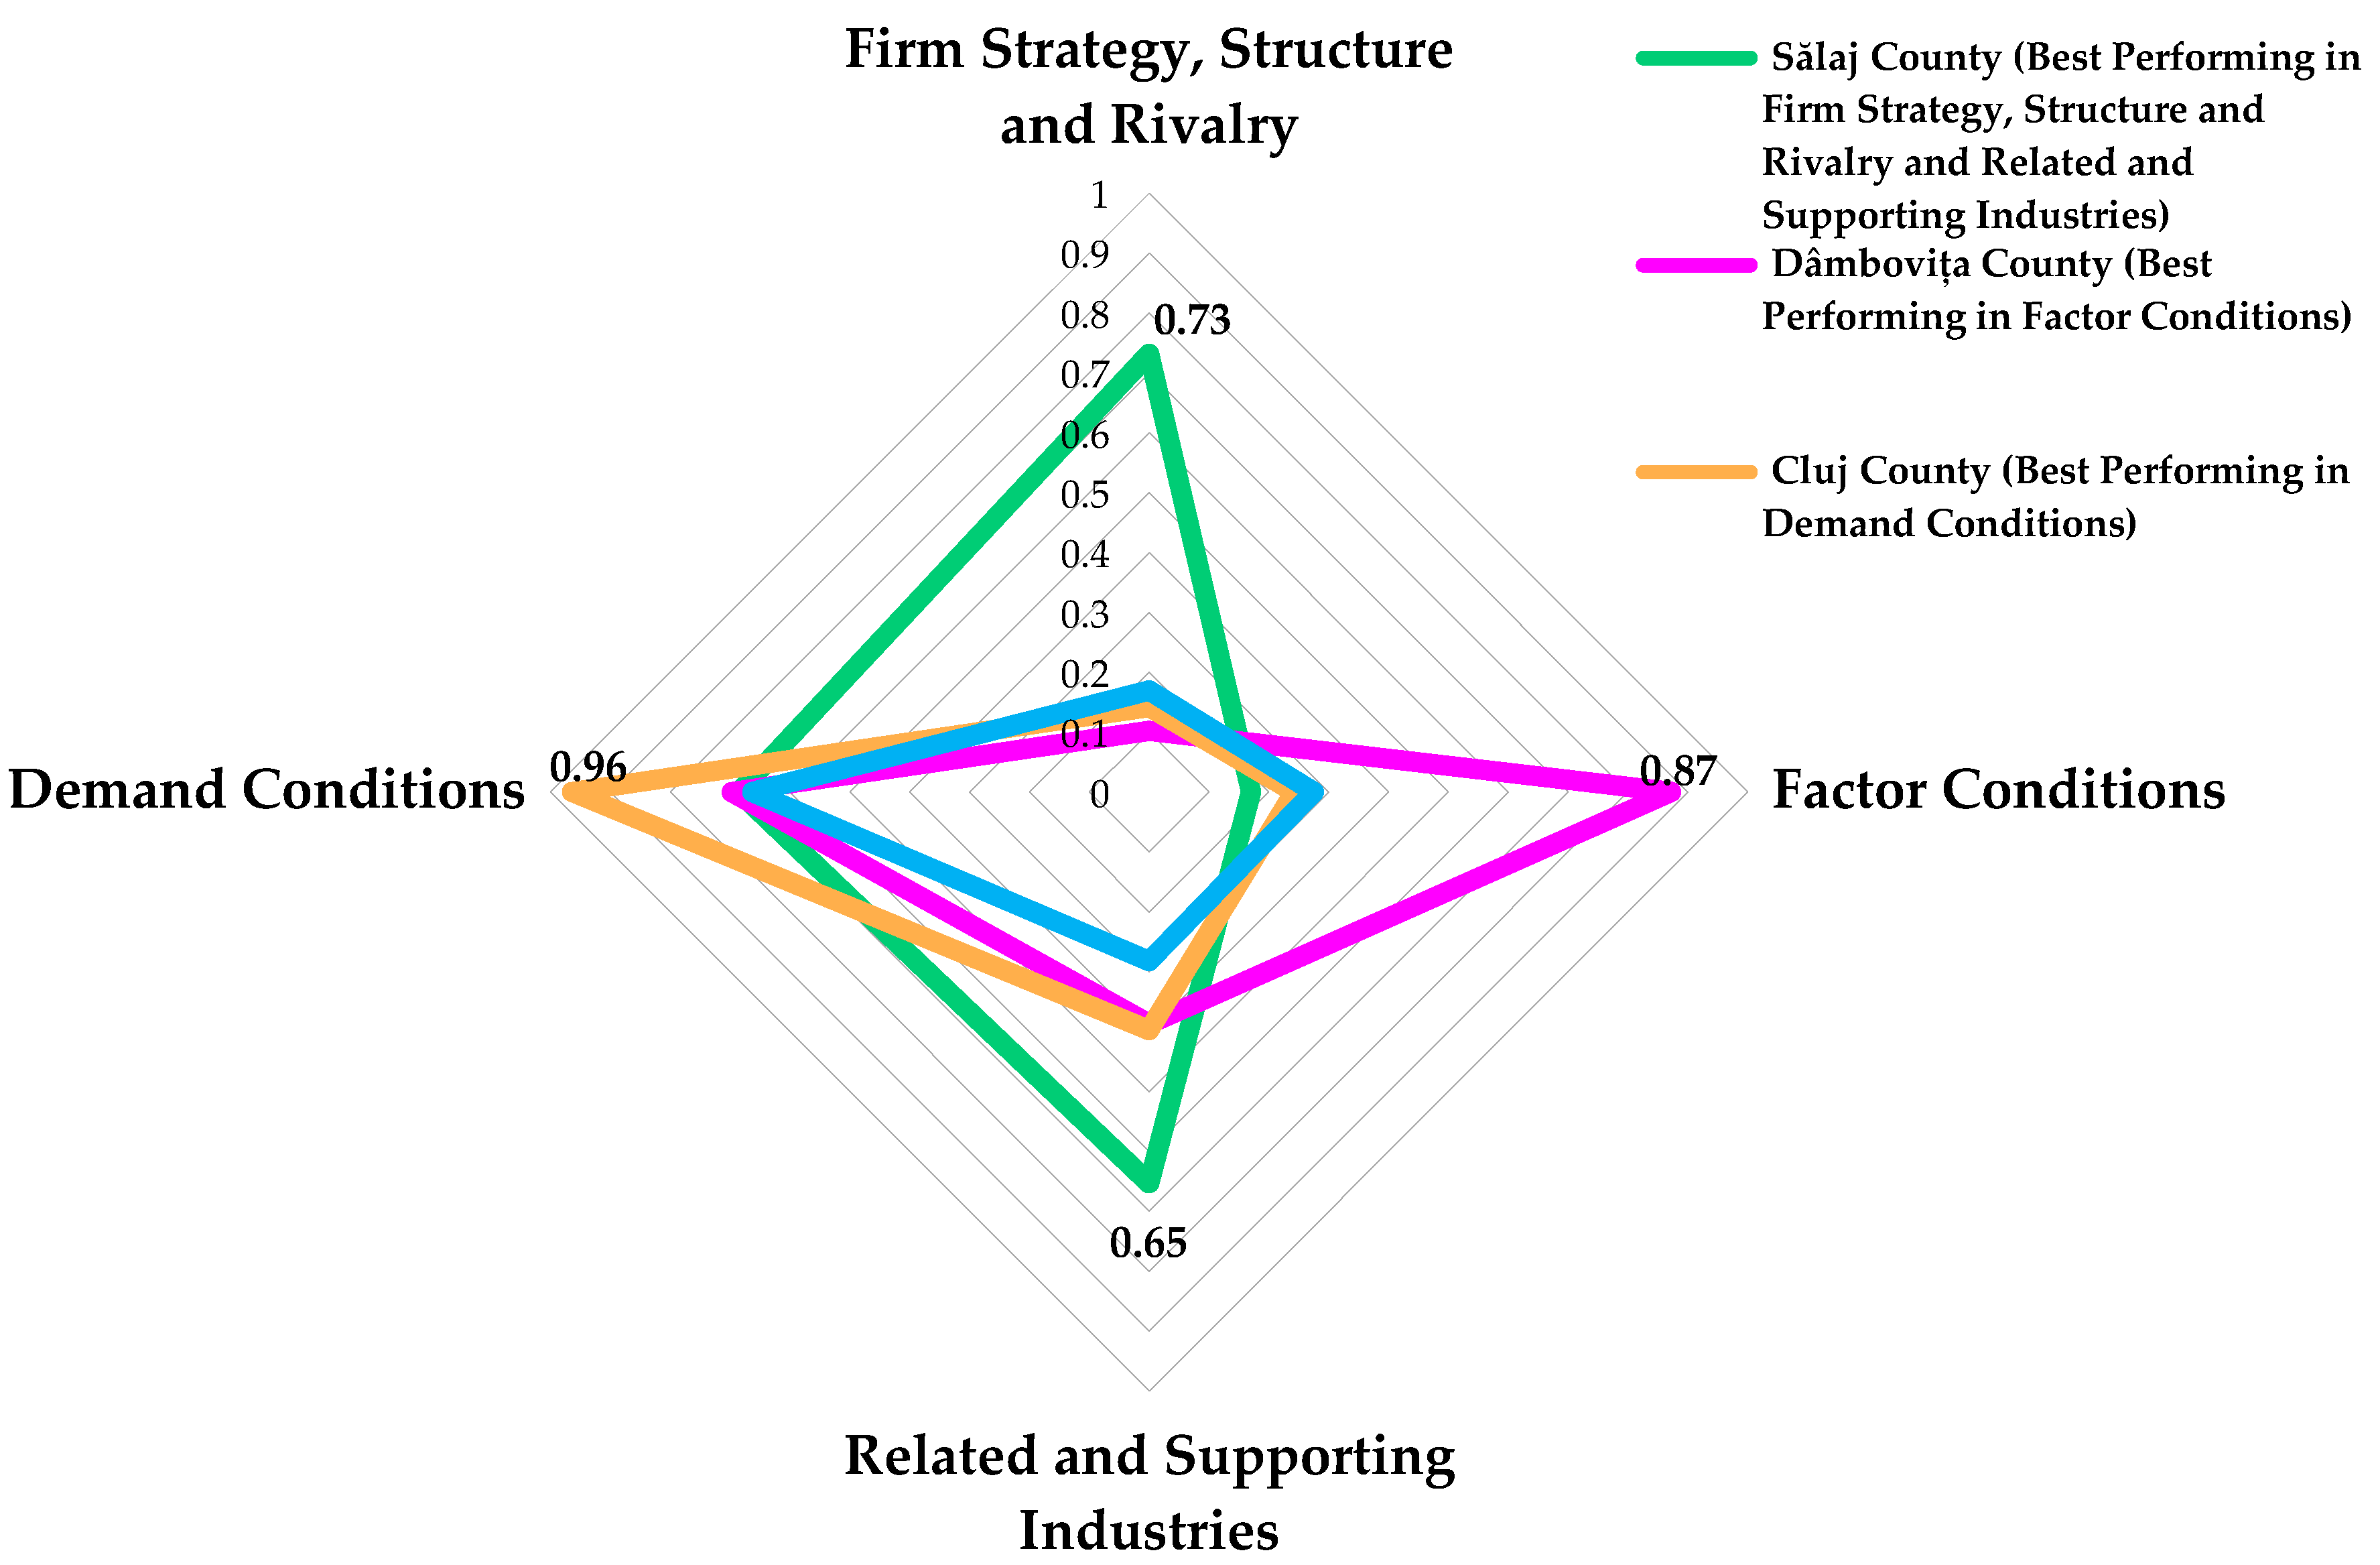
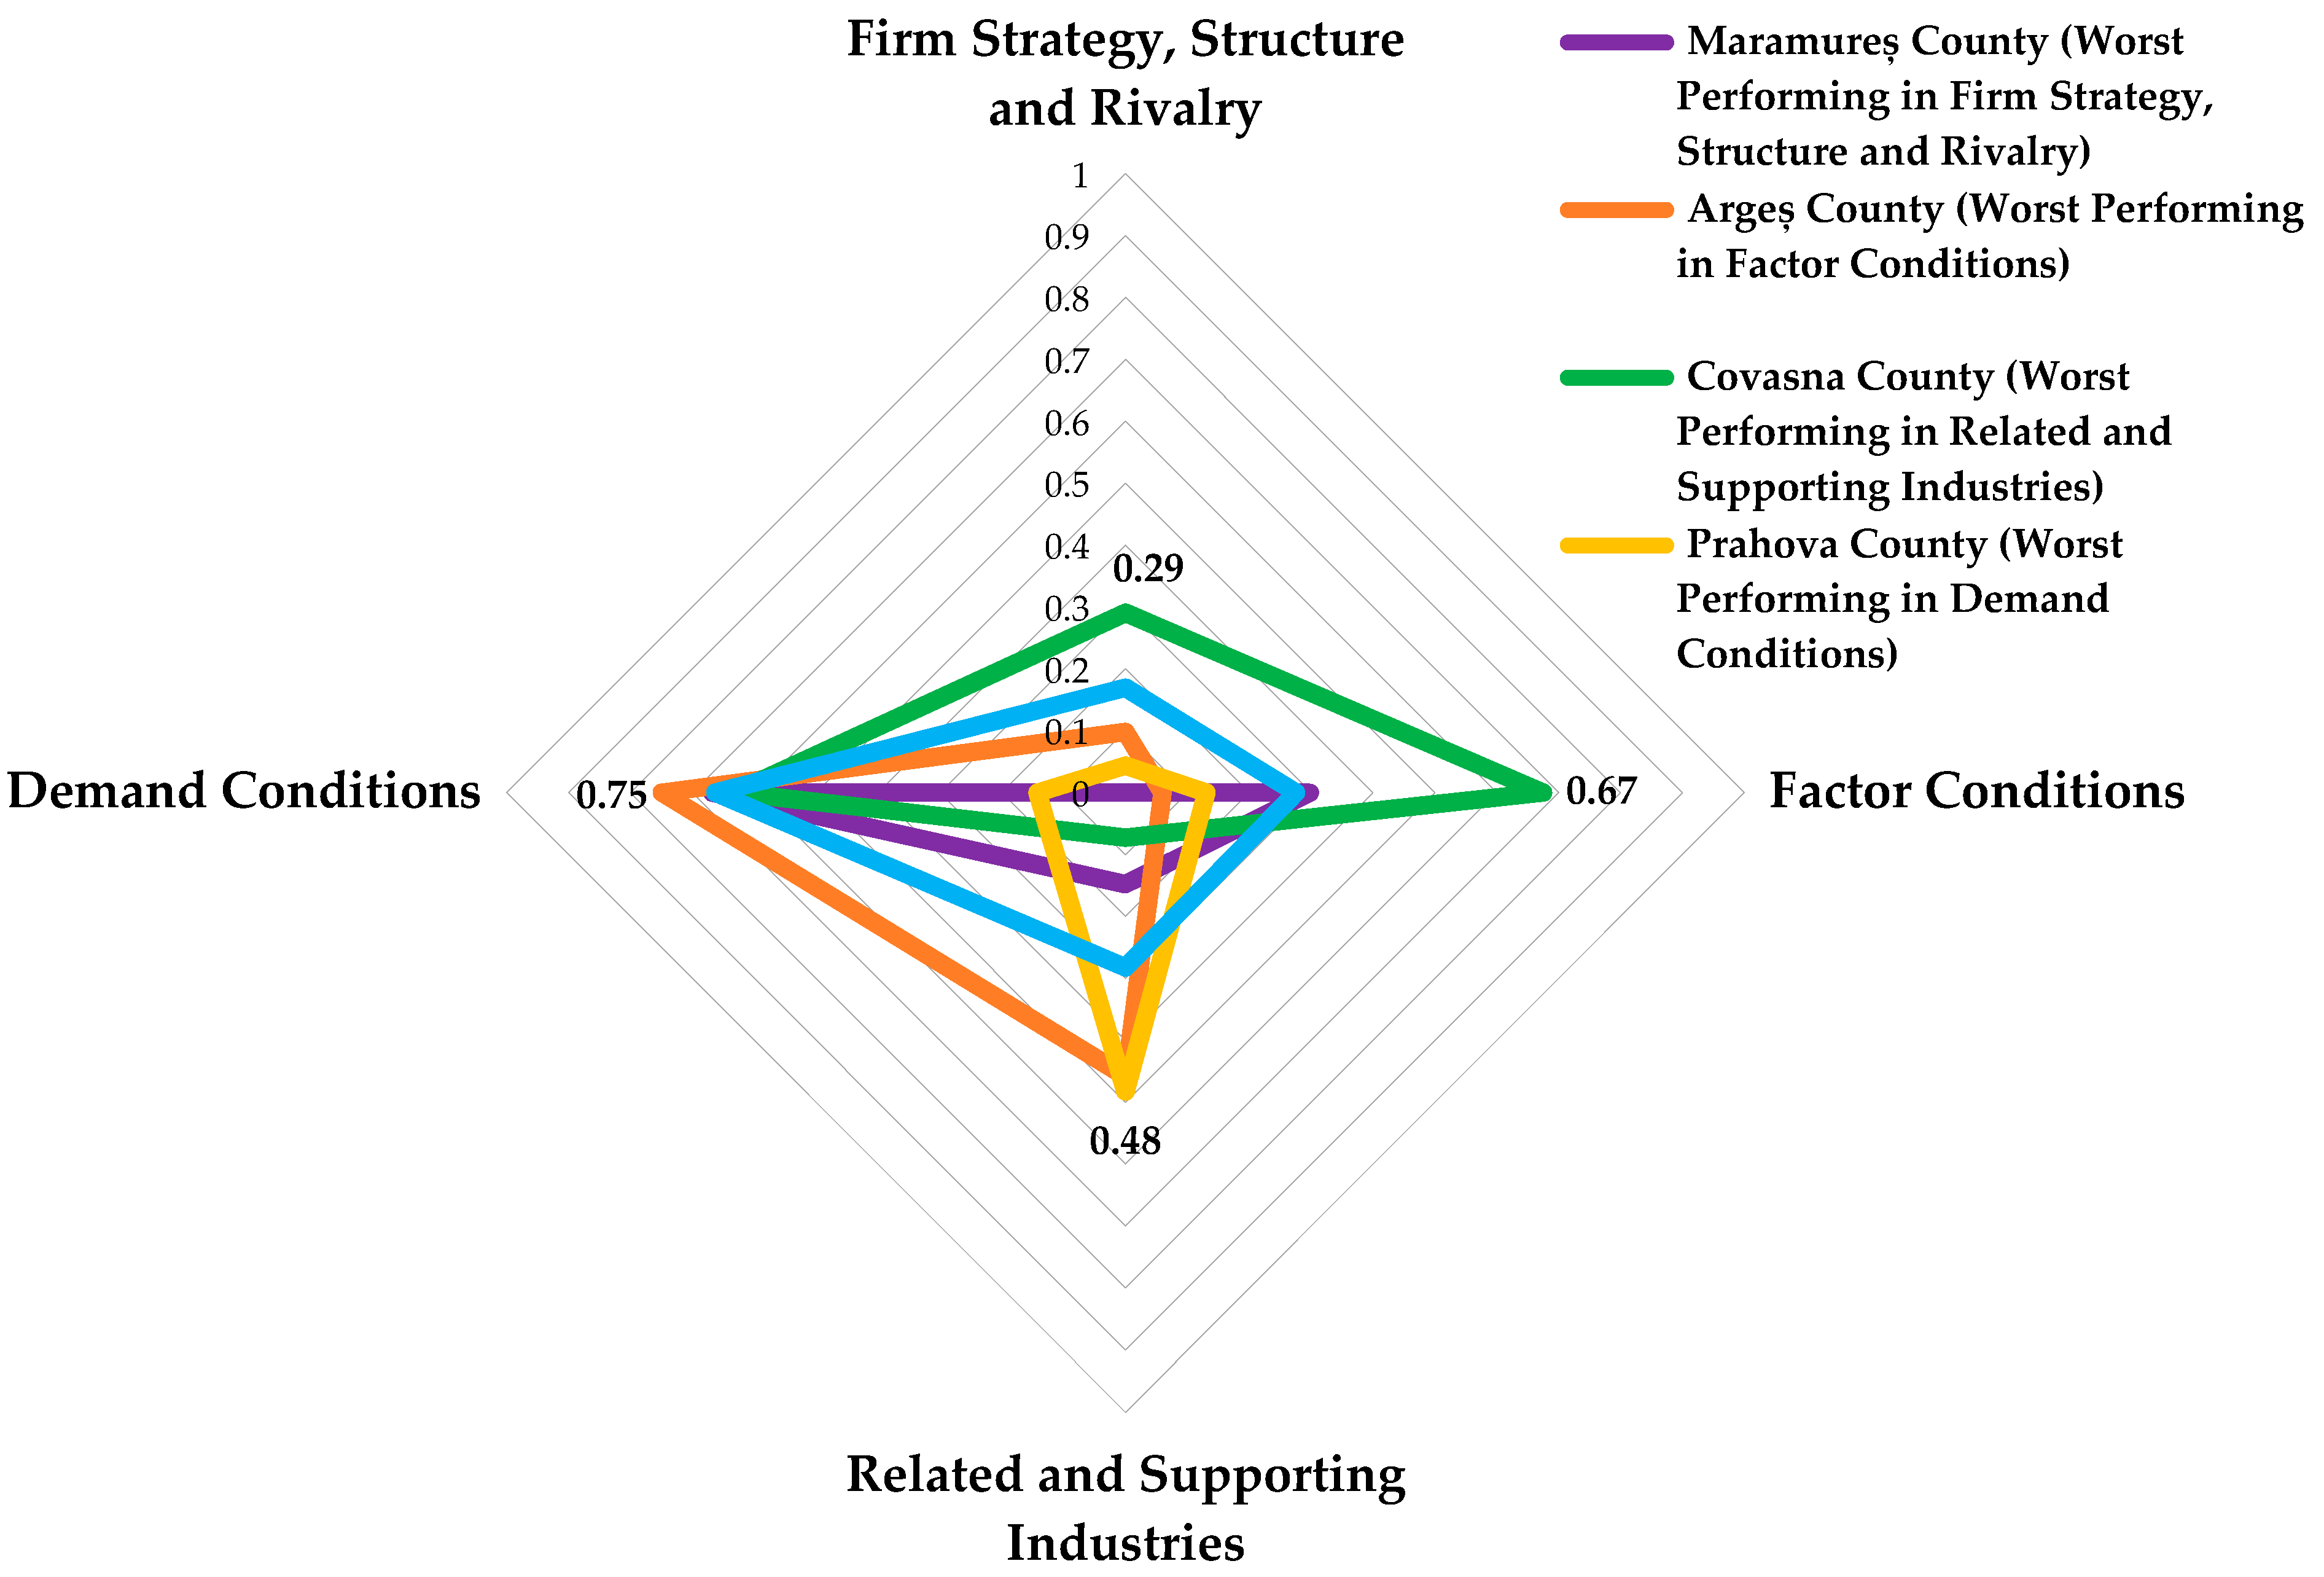
- Firm Strategy, Structure and Rivalry: At this level of the economic sector, the concentration of highly profitable Romanian companies involved in growing vegetables showed that most counties are not competitive and that only a handful of them are actually competitive in this agri-food chain. Yet, the national average profit margin for growing vegetables is rather high: 15.7%. From the perspective of the profit margin, despite the success of the active companies in this field, the vegetable sector does not succeed in attracting farmers or entrepreneurs to increase the intensity of the commercial activity. Growing vegetables contributed only 0.05% to the generation of the turnover registered by Romanian companies in 2020 from all economic sectors.
- Factor Conditions: The analysis of Romania’s position with respect to the factors of production is problematic. There were more than 400,000 hectares dedicated to vegetable production in Romania in 2020—a favorable situation nationally—but land use is different at the county-level and does not favor all Romanian counties. Regarding the machinery used in vegetable growing, the results confirm an uneven distribution of those at the county-level. Other research showed that the machinery is old, often lacking, and only mildly efficient [103,104]. On top of that, about half of the cultivated area belongs to subsistence farming, where the production is dedicated to self-consumption [105]. Given that Romania is in the EU top ranking regarding the percentage of subsistence farms [106], the post-communist fragmented agrarian structure acts as a brake in the face of the natural capital endowments.
- Related and Supporting Industries: The poor performance of the storage and transportation industries also has a significant negative impact in not achieving the full potential of the agri-food sector. The lack of efficient infrastructure affects most farmers by ‘forcing’ them to sell their production immediately after harvesting, when price volatility is increased due to the high volumes entering the market [107,108,109]. Besides the lack of development in these supporting industries, irrigation is another factor that prevents Romania from reaching its full potential in the agri-food sector due to the lack of investments in this regard [110].
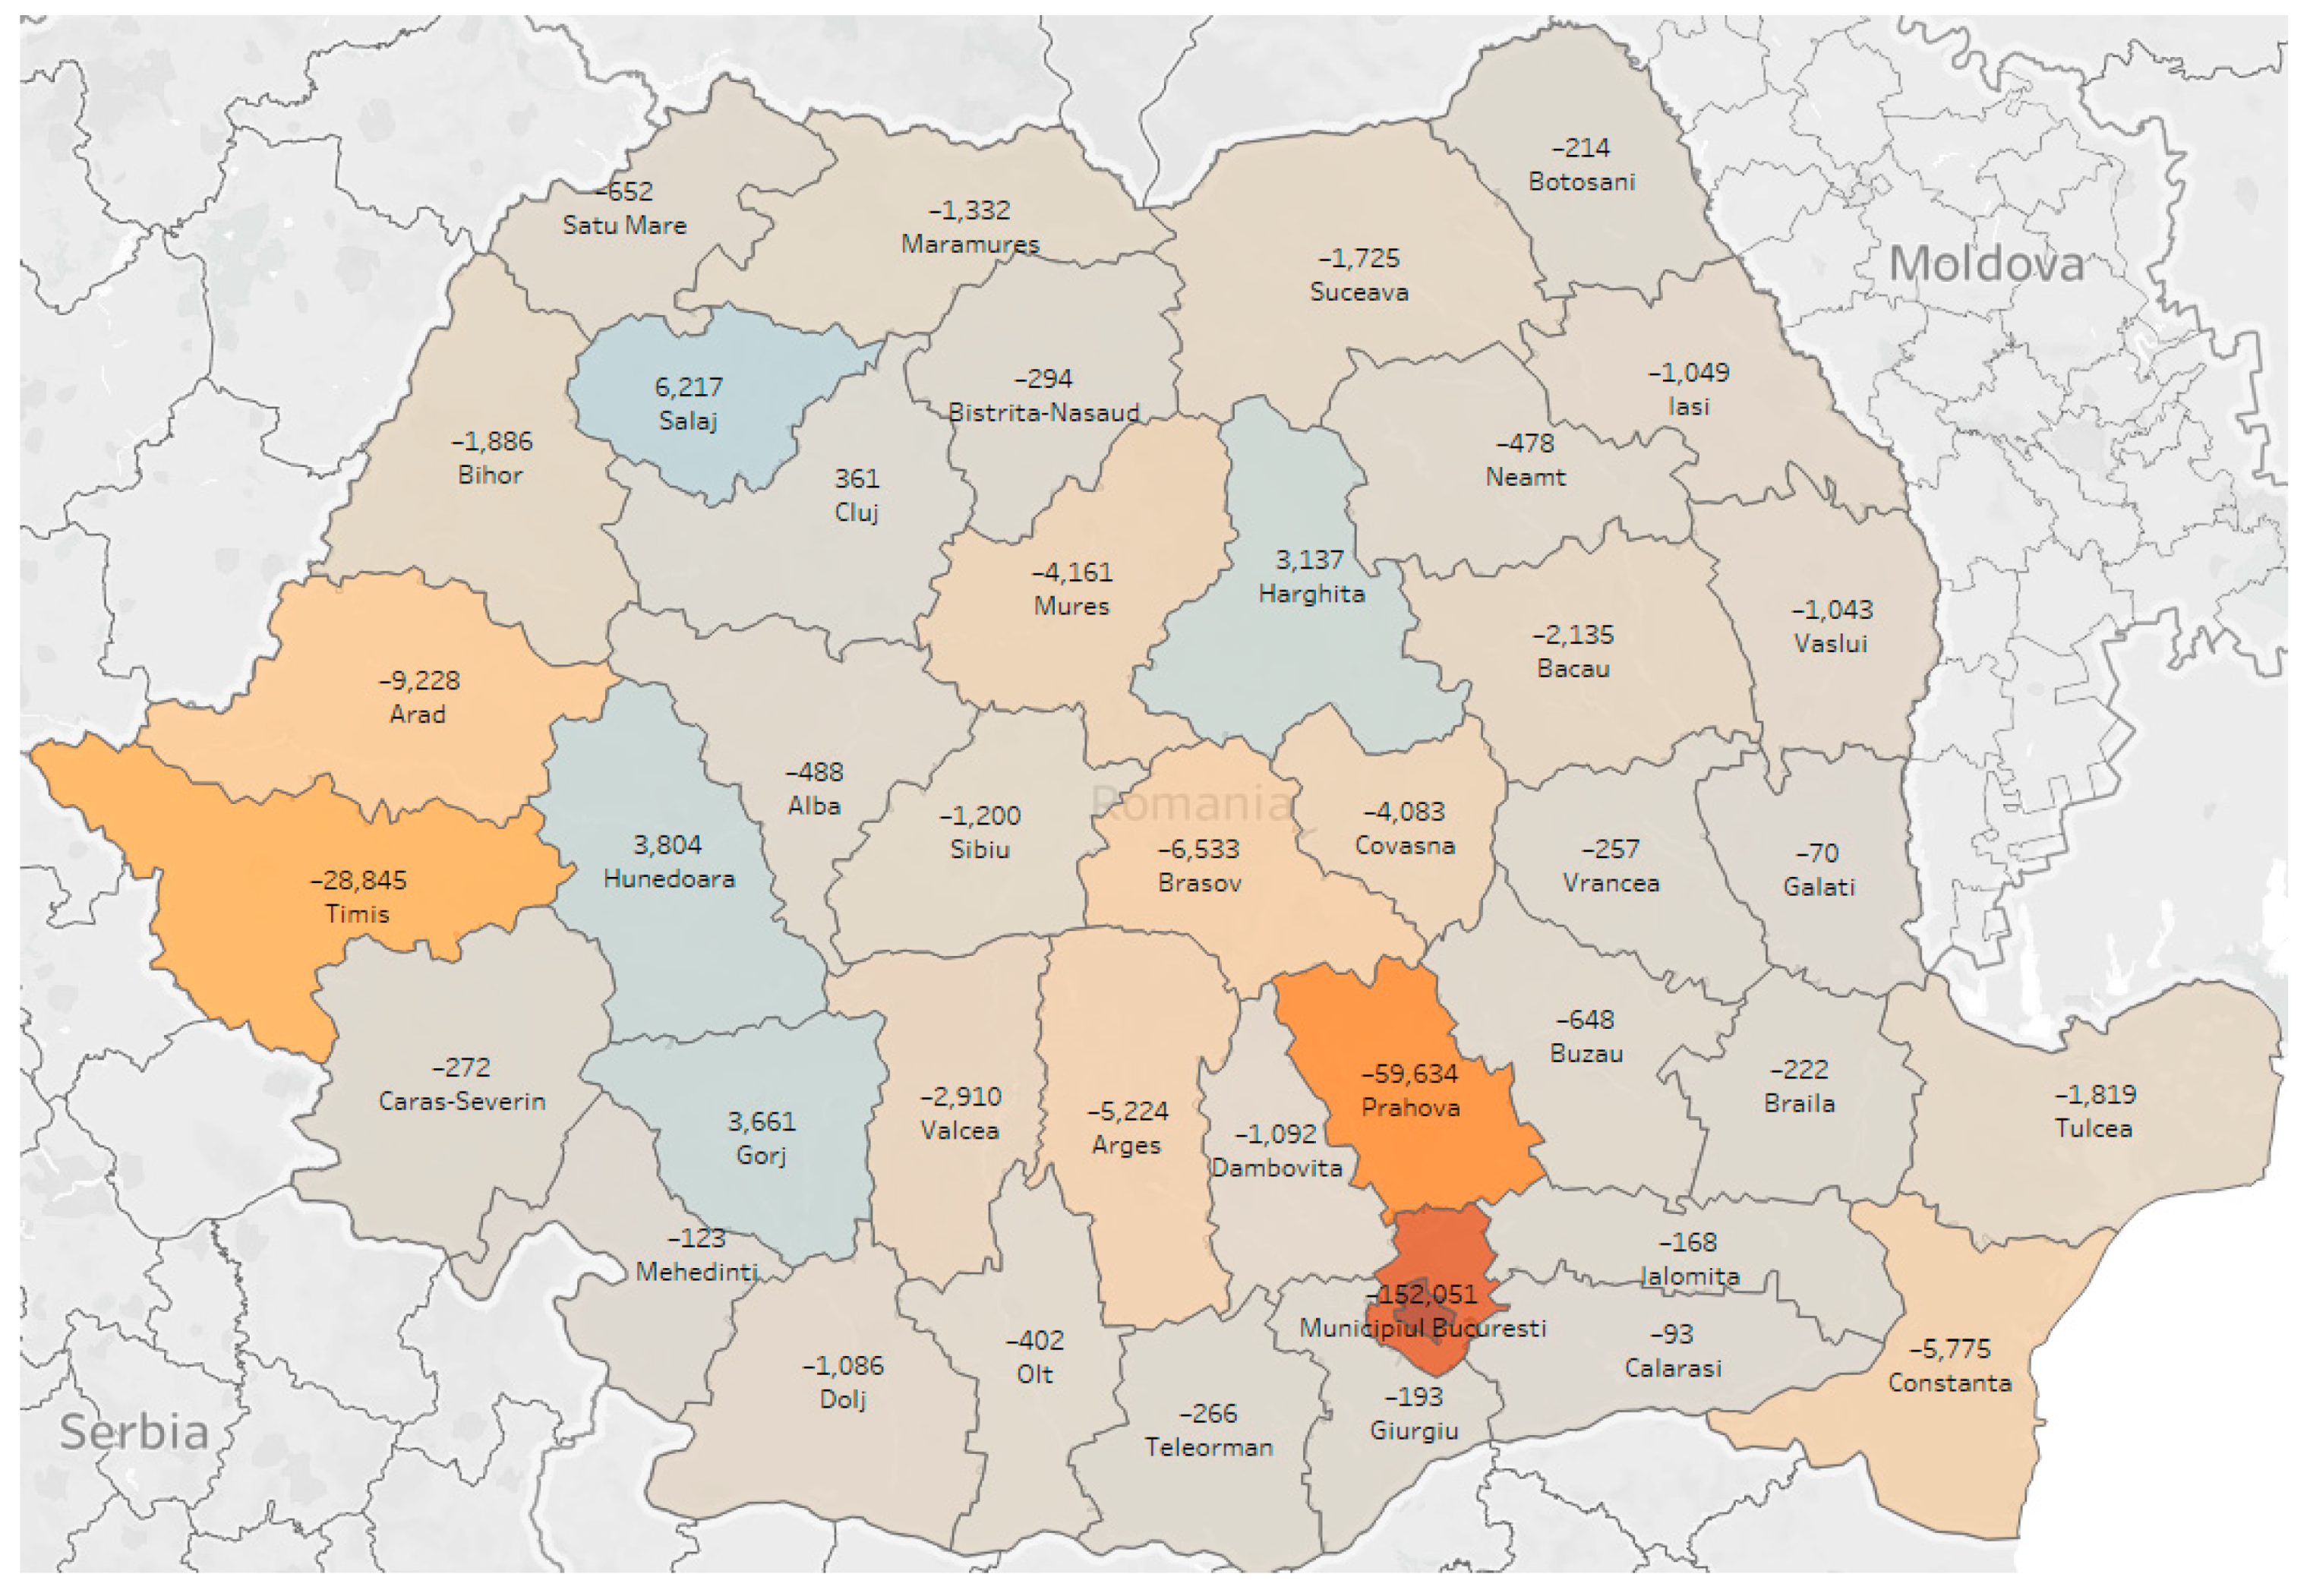
- Demand Conditions: What might appear to be a favorable situation regarding market demand is actually not because the 0.66 score recorded by this diamond attribute showed that a significant proportion of Romanian counties do not rely on high volumes of vegetable imports, but those that do cause major deficits at a national level. This result signals potential food security threats and the poor management of factor endowments at a national level. While the averages of A4.1 (0.91) and A4.2 (0.82) scored high values due to the considerable number of observations with minor deficit issues, the average of A4.3 is low (0.26)—therefore signaling that consumer purchasing power is rather weak. This is happening especially in counties with lower deficit volumes. The opposite was observed regarding the top deficit-generating counties: the consumer purchasing power was stronger there. This could partially explain the depth of the deficit.
4. Conclusions
Author Contributions
Funding
Institutional Review Board Statement
Informed Consent Statement
Data Availability Statement
Acknowledgments
Conflicts of Interest
References
- Soare, E.; Dobre, I.; David, L. Economic Analysis in Vegetable Sector of Romania. Scientific Papers Series Management. Econ. Eng. Agric. Rural. Dev. 2016, 16, 333–338. [Google Scholar]
- Kostov, P.; Lingard, J. Subsistence farming in transitional economies: Lessons from Bulgaria. J. Rural Stud. 2002, 18, 83–94. [Google Scholar] [CrossRef]
- Abele, S.; Frohberg, K. Subsistence Agriculture in Central and Eastern Europe: How to Break the Vicious Circle? Studies on the Agricultural and Food Sector; Institute of Agricultural Development in Transition Economies (IAMO): Halle, Germany, 2004. [Google Scholar]
- Mincyte, D. Subsistence and Sustainability in Post-industrial Europe: The Politics of Small-scale Farming in Europeanising Lithuania. Sociol. Rural. 2011, 51, 101–118. [Google Scholar] [CrossRef]
- Pawlak, K.; Smutka, L.; Kotyza, P. Agricultural Potential of the EU Countries: How Far Are They from the USA? Agriculture 2021, 11, 282. [Google Scholar] [CrossRef]
- Petrescu, D.C.; Petrescu-Mag, R.M. Valuing Land as a Finite and Precious Resource: Citizen Perceptions on Foreign Land Property Safety Limits in Romania. Qual. Access Success 2018, 19 (Suppl. 1), 386–391. [Google Scholar]
- Galli, F.; Grando, S.; Adamsone-Fiskovica, A.; Bjørkhaug, H.; Czekaj, M.; Duckett, D.G.; Almaas, H.; Karanikolas, P.; Moreno-Pérez, O.M.; Ortiz-Miranda, D.; et al. How do small farms contribute to food and nutrition security? Linking European small farms, strategies and outcomes in territorial food systems. Glob. Food Secur. 2020, 26, 100427. [Google Scholar] [CrossRef]
- Brumă, I.S.; Ulman, S.-R.; Cautisanu, C.; Tanasă, L.; Hoha, G.V. Sustainability in the Case of Small Vegetable Farmers: A Matrix Approach. Sustainability 2021, 13, 10320. [Google Scholar] [CrossRef]
- Andrei, J.V.; Chivu, L.; Constantin, M.; Subić, J. Economic Aspects of International Agricultural Trade and Possible Threats to Food Security in the EU-27: A Systematic Statistical Approach. In Shifting Patterns of Agricultural Trade: The Protectionism Outbreak and Food Security; Erokhin, V., Tianming, G., Andrei, J.V., Eds.; Springer: Singapore, 2021; pp. 229–261. ISBN 9789811632600. [Google Scholar] [CrossRef]
- Stefan, B.; Imre, F. Export competitiveness of the European Union in fruit and vegetable products in the global markets. Agric. Econ. 2016, 62, 299–310. [Google Scholar] [CrossRef] [Green Version]
- Popescu, A. Maize and Wheat—Top Agricultural Products Produced, Exported and Imported by Romania. Scientific Papers Series Management. Econ. Eng. Agric. Rural. Dev. 2018, 18, 339–352. [Google Scholar]
- Kruzslicika, M. Effects of CAP Measures for Increasing Competitiveness on the Cereal Chain in Romania. Agric. Econ. Rural. Dev. 2019, 16, 91–107. [Google Scholar]
- The Romanian National Institute for Statistics. The Romanian National Institute for Statistics Database, TEMPO Online; INS: Bucharest, Romania, 2022; Available online: http://statistici.insse.ro:8077/tempo-online/#/pages/tables/insse-table (accessed on 4 January 2022).
- Dias, J.S.; Ortiz, R. New Strategies and Approaches for Improving Vegetable Cultivars. In The Basics of Human Civilization; CRC Press: London, UK, 2021; pp. 349–381. [Google Scholar] [CrossRef]
- Pătărlăgeanu, S.R.; Miclea, A.; Sacală, M.-D.; Teodor, C.; Dinu, M.; Piștalu, M.; Constantin, M.; Lazăr, V. Study on the Romanian Trade Balance with Agri-Food Products during 2015–2020; Editura ASE: Bucharest, Romania, 2020; ISBN 978-606-34-0355-2. Available online: https://www.ceeol.com/search/book-detail?id=917212 (accessed on 1 December 2021).
- Ladaru, G.-R.; Ilie, D.; Diaconeasa, M.; Petre, I.; Marin, F.; Lazar, V. Influencing Factors of a Sustainable Vegetable Choice. The Romanian Consumers’ Case. Sustainability 2020, 12, 9991. [Google Scholar] [CrossRef]
- Luca, L.; Alexandri, C.; Pǎuna, B. Demand for Food Diversity in Romania. Available online: https://0-www-igi--global-com.brum.beds.ac.uk/chapter/demand-for-food-diversity-in-romania/www.igi-global.com/chapter/demand-for-food-diversity-in-romania/232989 (accessed on 31 January 2022).
- Varga, M. Resistant to change? Smallholder response to World Bank-sponsored “commercialisation” in Romania and Ukraine. Can. J. Dev. Stud. 2019, 40, 528–545. [Google Scholar] [CrossRef]
- Tudor, M.M. The Role of Small-Scale Agriculture in Romanian Context. In Proceedings of the Agrarian Economy and Rural Development—Realities and Perspectives for Romania, 6th Edition of the International Symposiumm, Bucharest, Romania, 15 November 2015; pp. 279–285. [Google Scholar]
- Ion, R.A. The Influence of People Income on Vegetables Consumption in Romania. In Proceedings of the Agrarian Economy and Rural Development—Realities and Perspectives for Romania, 9th Edition of the International Symposium, Bucharest, Romania, 18 November 2018; pp. 298–302. [Google Scholar]
- Muresan, I.C.; Harun, R.; Arion, F.H.; Brata, A.M.; Chereches, I.A.; Chiciudean, G.O.; Dumitras, D.E.; Oroian, C.F.; Tirpe, O.P. Consumers’ Attitude towards Sustainable Food Consumption during the COVID-19 Pandemic in Romania. Agriculture 2021, 11, 1050. [Google Scholar] [CrossRef]
- Bîlbîie, A.; Druică, E.; Dumitrescu, R.; Aducovschi, D.; Sakizlian, R.; Sakizlian, M. Determinants of Fast-Food Consumption in Romania: An Application of the Theory of Planned Behavior. Foods 2021, 10, 1877. [Google Scholar] [CrossRef] [PubMed]
- Bacârea, A.; Bacârea, V.; Cînpeanu, C.; Teodorescu, C.; Seni, A.; Guiné, R.; Tarcea, M. Demographic, Anthropometric and Food Behavior Data towards Healthy Eating in Romania. Foods 2021, 10, 487. [Google Scholar] [CrossRef]
- Nica, M.; Petre, I.L. Nutritional Security in Romania. In Proceedings of the 1st International Conference on Economics and Social Sciences, Bucharest, Romania, 16–17 April 2018; pp. 68–74. [Google Scholar]
- Grigoras, M.A. Trends in Romania’s Agricultural Production; Scientific Papers Series. Manag. Econ. Eng. Agric. Rural. Dev. 2016, 16, 183–192. [Google Scholar]
- Burghelea, C.; Bălan, M.; Volintiru, A.M.; Aceleanu, M.I. Trend in Producer Prices for Agricultural Products in Romania and EU. In Proceedings of the 25th International Business Information Management Association Conference—Innovation Vision 2020: From Regional Development Sustainability to Global Economic Growth, Amsterdam, The Netherlands, 7–8 May 2015; pp. 9–17. [Google Scholar]
- Lato, K.; Popa, M.; Lato, A.; Corches, M.; Radulov, I.; Berbecea, A.; Crista, F. Economic Efficiency of Main Soil Types from West Region of Romania for Various Agricultural Crops. J. Environ. Prot. Ecol. 2019, 20, 1022–1028. [Google Scholar]
- Andrei, J.V.; Popescu, G.H.; Nica, E.; Chivu, L. The impact of agricultural performance on foreign trade concentration and competitiveness: Empirical evidence from Romanian agriculture. J. Bus. Econ. Manag. 2020, 21, 317–343. [Google Scholar] [CrossRef] [Green Version]
- Tolmachev, M.; Tsypin, A.; Barashov, N. Statistical Study of Dynamics of the Agricultural Production of Post-Soviet Countries in the Context of Food Security. In Proceedings of the International Science and Technology Conference “FarEastCon 2019”, Vladivostok, Russia, 1–4 October 2019; pp. 699–711. [Google Scholar] [CrossRef]
- Chivu, L.; Constantin, M.; Privitera, D.; Andrei, J.V. Land Grabbing, Land Use, and Food Export Competitiveness: Bibliometric Study of a Paradigm Shift. In Shifting Patterns of Agricultural Trade: The Protectionism Outbreak and Food Security; Erokhin, V., Tianming, G., Andrei, J.V., Eds.; Springer: Singapore, 2021; pp. 143–164. [Google Scholar] [CrossRef]
- Pătărlăgeanu, S.R.; Constantin, M.; Strat, G.; Deaconu, M.E. Best Practices of Circular Activities in the Agri-Food Sector from the Netherlands and Romania; ASE Publishing House: Bucharest, Romania, 2021; ISBN 978-606-34-0375-0. Available online: https://www.ceeol.com/search/book-detail?id=949510 (accessed on 4 January 2022).
- Istudor, N.; Ion, R.A.; Sponte, M.; Petrescu, I.E. Food Security in Romania—A Modern Approach for Developing Sustainable Agriculture. Sustainability 2014, 6, 8796–8807. [Google Scholar] [CrossRef] [Green Version]
- Jerzak, M.A.; Śmiglak-Krajewska, M. Globalization of the Market for Vegetable Protein Feed and Its Impact on Sustainable Agricultural Development and Food Security in EU Countries Illustrated by the Example of Poland. Sustainability 2020, 12, 888. [Google Scholar] [CrossRef] [Green Version]
- Chiripuci, B.; Todirica, I.; Toderasc, A. The Impact of Globalization Phenomena on Food Safety. In Proceedings of the International Conference on Economics and Social Sciences, Bucharest University of Economic Studies, Bucharest, Romania, 16–17 April 2018; Volume 1, pp. 21–27. [Google Scholar]
- Teimoury, E.; Nedaei, H.; Ansari, S.; Sabbaghi, M. A multi-objective analysis for import quota policy making in a perishable fruit and vegetable supply chain: A system dynamics approach. Comput. Electron. Agric. 2013, 93, 37–45. [Google Scholar] [CrossRef]
- Gramzow, A.; Batt, P.J.; Afari-Sefa, V.; Petrick, M.; Roothaert, R. Linking smallholder vegetable producers to markets—A comparison of a vegetable producer group and a contract-farming arrangement in the Lushoto District of Tanzania. J. Rural Stud. 2018, 63, 168–179. [Google Scholar] [CrossRef]
- Kruse, H. Food safety in an international perspective. J. Consum. Prot. Food Saf. 2015, 10, 105–107. [Google Scholar] [CrossRef] [Green Version]
- Bloomberg. Food Supply Fears Are Growing as Romania Bans Grain Export; Bloomberg: New York, NY, USA, 2020. [Google Scholar]
- Navarro-Pabsdorf, R.M.; Martínez-Alcalá, C.; Moral-Pajares, E. Can International Trade Help Africa’s Least Developed Countries Achieve SDG-1? Sustainability 2020, 12, 4470. [Google Scholar] [CrossRef]
- Xu, Z.; Li, Y.; Chau, S.N.; Dietz, T.; Li, C.; Wan, L.; Zhang, J.; Zhang, L.; Li, Y.; Chung, M.G.; et al. Impacts of international trade on global sustainable development. Nat. Sustain. 2020, 3, 964–971. [Google Scholar] [CrossRef]
- Scown, M.W.; Nicholas, K.A. European agricultural policy requires a stronger performance framework to achieve the Sustainable Development Goals. Glob. Sustain. 2020, 3, e11. [Google Scholar] [CrossRef] [Green Version]
- Park, E.; Gachukia, M.K. The Role of the Local Innovation System for Inclusive Upgrading in the Global Value Chain: The Case of KenyaGAP in the Kenyan Horticultural Sector. Eur. J. Dev. Res. 2020, 33, 578–603. [Google Scholar] [CrossRef]
- Tyce, M. A ‘Private-sector Success Story’? Uncovering the Role of Politics and the State in Kenya’s Horticultural Export Sector. J. Dev. Stud. 2020, 56, 1877–1893. [Google Scholar] [CrossRef] [Green Version]
- Martindale, W.; Swainson, M.; Choudhary, S. The Impact of Resource and Nutritional Resilience on the Global Food Supply System. Sustainability 2020, 12, 751. [Google Scholar] [CrossRef] [Green Version]
- Feyaerts, H.; Broeck, G.V.D.; Maertens, M. Global and local food value chains in Africa: A review. Agric. Econ. 2019, 51, 143–157. [Google Scholar] [CrossRef]
- Wakiyama, T.; Lenzen, M.; Faturay, F.; Geschke, A.; Malik, A.; Fry, J.; Nansai, K. Responsibility for food loss from a regional supply-chain perspective. Resour. Conserv. Recycl. 2019, 146, 373–383. [Google Scholar] [CrossRef]
- Von Oppenkowski, M.; Hassler, M.; Roesler, T. Informal markets and global value chains—The disembedding of Romanian dairy smallholders. Eur. Plan. Stud. 2019, 27, 995–1012. [Google Scholar] [CrossRef]
- Olaitan, O.F.; Hubbard, N.; Bamford, C.G. The potential for the participation of Nigeria in global horticulture value chains. Int. J. Emerg. Mark. 2019, 15, 93–110. [Google Scholar] [CrossRef] [Green Version]
- Vetter, T.; Larsen, M.N.; Bruun, T.B. Supermarket-Led Development and the Neglect of Traditional Food Value Chains: Reflections on Indonesia’s Agri-Food System Transformation. Sustainability 2019, 11, 498. [Google Scholar] [CrossRef] [Green Version]
- Thow, A.M.; Priyadarshi, S. Aid for Trade: An opportunity to increase fruit and vegetable supply. Bull. World Heal. Organ. 2012, 91, 57–63. [Google Scholar] [CrossRef]
- Raab, V.; O’Hagan, J.; Stecher, F.; Fürtjes, M.; Brugger, A.; Bratzler, M.; Wibbe, B.; Petersen, B. A preventive approach to risk management in global fruit and vegetable supply chains. WIT Trans. Ecol. Environ. 2013, 170, 147–158. [Google Scholar] [CrossRef] [Green Version]
- Maertens, M.; Minten, B.; Swinnen, J. Modern Food Supply Chains and Development: Evidence from Horticulture Export Sectors in Sub-Saharan Africa. Dev. Policy Rev. 2012, 30, 473–497. [Google Scholar] [CrossRef]
- Dolan, C.; Humphrey, J. Changing Governance Patterns in the Trade in Fresh Vegetables between Africa and the United Kingdom. Environ. Plan. A Econ. Space 2004, 36, 491–509. [Google Scholar] [CrossRef]
- Enache, C. An Econometric Analysis of Romania’s Agricultural Foreign Trade with Developing Countries. J. East. Eur. Res. Bus. Econ. 2015, 2015, 1–11. [Google Scholar] [CrossRef]
- Dinu, T.; Enache, C.; Condei, R.; Niculae, I.; Stoian, E. Romania’s Foreign Trade in Agricultural Products Measurement Methods and Techniques. J. East. Eur. Res. Bus. Econ. 2015, 1–11. [Google Scholar] [CrossRef] [Green Version]
- Dragos, S.L.; Mare, C. An econometric approach to factors affecting crop insurance in Romania. E+M Èkon. Manag. 2014, 17, 93–103. [Google Scholar] [CrossRef]
- Ignat, R.; Constantin, M. Short-Term Effects of COVID-19 Pandemic on Agri-Food Value Chains in Romania. In Proceedings of the 3rd International Conference on Economics and Social Sciences, Bucharest, Romania, 15–16 October 2020; pp. 578–588. [Google Scholar] [CrossRef]
- Voicu-Dorobanțu, R.; Volintiru, C.; Popescu, M.-F.; Nerău, V.; Ștefan, G. Tackling Complexity of the Just Transition in the EU: Evidence from Romania. Energies 2021, 14, 1509. [Google Scholar] [CrossRef]
- Chevallier-Chantepie, A.; Batt, P.J. Sustainable Purchasing of Fresh Food by Restaurants and Cafes in France. Agronomy 2021, 11, 2357. [Google Scholar] [CrossRef]
- Dragoi, M.C.; Andrei, J.V.; Mieila, M.; Panait, M.; Dobrota, C.E.; Ladaru, R. Food Safety and Security in Romania—An Econometric Analysis in the Context of National Agricultural Paradigm Transformation. Amfiteatru Econ. 2018, 20, 134–150. [Google Scholar] [CrossRef]
- Porter, M. Competitive Advantage of Nations; Macmillan: New York, NY, USA, 1990. [Google Scholar]
- Salima, B.A.; Julie, L.G.; Lionel, V. Spatial Econometrics on Panel Data. In Handbook of Spatial Analysis: Theory and Practical Application with R; Institut National de la Statistique et des Études Économiques: Paris, France, 2018; pp. 179–203. [Google Scholar]
- Kapoor, M.; Kelejian, H.H.; Prucha, I.R. Panel data models with spatially correlated error components. J. Econ. 2007, 140, 97–130. [Google Scholar] [CrossRef] [Green Version]
- Baltagi, B.H.; Bresson, G.; Pirotte, A. Panel unit root tests and spatial dependence. J. Appl. Econ. 2007, 22, 339–360. [Google Scholar] [CrossRef] [Green Version]
- Lee, L.-F.; Yu, J. Some recent developments in spatial panel data models. Reg. Sci. Urban Econ. 2010, 40, 255–271. [Google Scholar] [CrossRef]
- Baltagi, B.H.; Li, D. Prediction in the Panel Data Model with Spatial Correlation. Adv. Spat. Econom. 2004, 283–295. [Google Scholar] [CrossRef]
- Elhorst, J.P. Spatial Panel Data Analysis. Encycl. GIS 2017, 2050–2058. [Google Scholar] [CrossRef]
- Debarsy, N.; Ertur, C. Testing for spatial autocorrelation in a fixed effects panel data model. Reg. Sci. Urban Econ. 2010, 40, 453–470. [Google Scholar] [CrossRef] [Green Version]
- Millo, G.; Piras, G. splm: Spatial Panel Data Models inR. J. Stat. Softw. 2012, 47, 1–38. [Google Scholar] [CrossRef] [Green Version]
- Anselin, L.; Syabri, I.; Kho, Y. GeoDa: An Introduction to Spatial Data Analysis. In Handbook of Applied Spatial Analysis; Springer: Berlin/Heidelberg, Germany, 2009; pp. 73–89. [Google Scholar] [CrossRef]
- Ciutacu, C.; Chivu, L.; Andrei, J.V. Similarities and dissimilarities between the EU agricultural and rural development model and Romanian agriculture. Challenges and perspectives. Land Use Policy 2015, 44, 169–176. [Google Scholar] [CrossRef] [Green Version]
- Chivu, L.; Andrei, J.V.; Zaharia, M.; Gogonea, R.-M. A regional agricultural efficiency convergence assessment in Romania—Appraising differences and understanding potentials. Land Use Policy 2020, 99, 104838. [Google Scholar] [CrossRef]
- Gavrilescu, C. The Romanian Agri-Food Trade: In a Permanent Deficit? An Analysis of the Last Two Decades. In Proceedings of the Agrarian Economy and Rural Development—Realities and Perspectives for Romania, 9th Edition of the International Symposium, Bucharest, Romania, 15 November 2018; The Research Institute for Agricultural Economy and Rural Development (ICEADR): Bucharest, Romania, 2018; pp. 16–22. [Google Scholar]
- Stoicescu, A.; Alecu, I.N.; Tudor, V. Demographic Analysis of Bucharest-Ilfov Region. Procedia Econ. Finance 2013, 6, 392–398. [Google Scholar] [CrossRef] [Green Version]
- Anna, N.; Agnieszka, K. Agricultural competitiveness: The case of the European Union countries. Agric. Econ. 2016, 62, 507–516. [Google Scholar] [CrossRef]
- Delgado, M.; Ketels, C.; Porter, M.E.; Stern, S. The Determinants of National Competitiveness; Working Paper Series; National Bureau of Economic Research: Cambridge, MA, USA, 2012. [Google Scholar] [CrossRef]
- Jambor, A.; Babu, S. Understanding the Factors Behind Agricultural Competitiveness. Compet. Glob. Agric. 2016, 131–149. [Google Scholar] [CrossRef]
- Hochuli, A.; Hochuli, J.; Schmid, D. Competitiveness of diversification strategies in agricultural dairy farms: Empirical findings for rural regions in Switzerland. J. Rural Stud. 2021, 82, 98–106. [Google Scholar] [CrossRef]
- Zhao, L. Determinants of Food Industry Competitiveness in China from the Perspectives of Porter’s Diamond Model. In Proceedings of the 3rd International Conference on Judicial, Administrative and Humanitarian Problems of State Structures and Economic Subjects (JAHP 2018), Domodedovo, Russia, 1–4 April 2018; Atlantis Press: Paris, France, 2018; pp. 281–286. [Google Scholar]
- Jiang, Z.; Jing, G.; Lijiao, X. Analysis on the Competitiveness of High-End Agricultural Industry in Beijing by Diamond Model. In Proceedings of the Information Science and Management Engineering III, Wuhan, China, 7–8 October 2015; SCITEPRESS Science and Technology Publications: Sanya, China, 2015; pp. 36–41. [Google Scholar]
- Khaengkhan, M.; Hotrawisaya, C.; Kiranantawat, B.; Shaharudin, M.R. Comparative Analysis of Multiple Criteria Decision Making (MCDM) Approach in Warehouse Location Selection of Agricultural Products in Thailand. Int. J. Supply Chain. Manag. 2019, 8, 168–175. [Google Scholar]
- Toming, K. The Impact of EU Accession on the Export Competitiveness of the Estonian Food Processing Industry. Post-Communist Econ. 2007, 19, 187–207. [Google Scholar] [CrossRef]
- Berti, G.; Mulligan, C. Competitiveness of Small Farms and Innovative Food Supply Chains: The Role of Food Hubs in Creating Sustainable Regional and Local Food Systems. Sustainability 2016, 8, 616. [Google Scholar] [CrossRef] [Green Version]
- Kherbach, O.; Mocan, M.L. The Importance of Logistics and Supply Chain Management in the Enhancement of Romanian SMEs. Procedia Soc. Behav. Sci. 2016, 221, 405–413. [Google Scholar] [CrossRef] [Green Version]
- Herciu, M. Measuring International Competitiveness of Romania by Using Porter’s Diamond and Revealed Comparative Advantage. Procedia Econ. Finance 2013, 6, 273–279. [Google Scholar] [CrossRef] [Green Version]
- Bojnec, Š.; Fertő, I. Agro-food trade competitiveness of Central European and Balkan countries. Food Policy 2009, 34, 417–425. [Google Scholar] [CrossRef]
- Bojnec, Š.; Fertő, I. Complementarities of trade advantage and trade competitiveness measures. Appl. Econ. 2012, 44, 399–408. [Google Scholar] [CrossRef]
- Smith, V.H.; Glauber, J.W. Trade, policy, and food security. Agric. Econ. 2020, 51, 159–171. [Google Scholar] [CrossRef] [Green Version]
- Puma, M.J. Resilience of the global food system. Nat. Sustain. 2019, 2, 260–261. [Google Scholar] [CrossRef]
- Bojnec, Š.; Fertő, I. Determinants of agro-food trade competition of Central European countries with the European Union. China Econ. Rev. 2009, 20, 327–337. [Google Scholar] [CrossRef]
- Christiaensen, L.; Rutledge, Z.; Taylor, J.E. Viewpoint: The future of work in agri-food. Food Policy 2020, 99, 101963. [Google Scholar] [CrossRef]
- Rugman, A.M.; Verbeke, A. How to operationalize porter’s diamond of international competitiveness. Int. Exec. 1993, 35, 283–299. [Google Scholar] [CrossRef]
- Balassa, B. Trade Liberalisation and “Revealed” Comparative Advantage. Manch. Sch. 1965, 33, 99–123. [Google Scholar] [CrossRef]
- Council Regulation (EEC) No 2658/87 of 23 July 1987 on the Tariff and Statistical Nomenclature and on the Common Customs Tariff; Council of the European Union: Brussels, Belgium, 1987.
- Ianoş, I.; Sorensen, A.; Merciu, C. Incoherence of urban planning policy in Bucharest: Its potential for land use conflict. Land Use Policy 2017, 60, 101–112. [Google Scholar] [CrossRef]
- Ion, R.A.; Popescu, C.G. Income Influence on Diet and Health. Qual. Access Success 2018, 19, 254–259. [Google Scholar]
- Török, I. Competitiveness of Romanian Regions in the Spatial Structure of the EU. IOP Conf. Series Earth Environ. Sci. 2017, 95, 52013. [Google Scholar] [CrossRef]
- Neagu, O.; Neagu, M.-I. Regional Specialisation and Economic Concentration in Romania. Stud. Univ. “Vasile Goldis” Arad Econ. Ser. 2016, 26, 1–17. [Google Scholar] [CrossRef] [Green Version]
- Constantin, M.; Strat, G.; Deaconu, M.E.; Pătărlăgeanu, S.R. Innovative Agri-Food Value Chain Management Through a Unique Urban Ecosystem. Manag. Res. Pract. 2021, 13, 5–22. Available online: https://www.researchgate.net/publication/354161934_Innovative_Agri-food_Value_Chain_Management_Through_a_Unique_Urban_Ecosystem (accessed on 1 December 2021).
- Grădinaru, S.R.; Triboi, R.; Iojă, C.I.; Artmann, M. Contribution of agricultural activities to urban sustainability: Insights from pastoral practices in Bucharest and its peri-urban area. Habitat Int. 2018, 82, 62–71. [Google Scholar] [CrossRef]
- A Petrovici, D.; Ritson, C. Factors influencing consumer dietary health preventative behaviours. BMC Public Health 2006, 6, 222. [Google Scholar] [CrossRef] [PubMed] [Green Version]
- Alexandri, C.; Luca, L. Food and Nutrition Security in Romania in the Post-Accession Period. Food Nutr. 2016, 16, 11–18. [Google Scholar]
- Buliga-Ștefanescu, A. Realities and Perspectives on the Mechanization of Romanian Agriculture. Res. J. Agric. Sci. 2019, 51, 39–48. [Google Scholar]
- Agarwal, B.; Dobay, K.M.; Sabates-Wheeler, R. Revisiting group farming in a post-socialist economy: The case of Romania. J. Rural Stud. 2020, 81, 148–158. [Google Scholar] [CrossRef]
- Burja, V.; Tamas-Szora, A.; Dobra, I.B. Land Concentration, Land Grabbing and Sustainable Development of Agriculture in Romania. Sustainability 2020, 12, 2137. [Google Scholar] [CrossRef] [Green Version]
- Alexandri, C.; Luca, L.; Kevorchian, C. Subsistence Economy and Food Security—The Case of Rural Households from Romania. Procedia Econ. Financ. 2015, 22, 672–680. [Google Scholar] [CrossRef] [Green Version]
- Alexandri, C. Agricultural Price Volatility—Effects on Food Security. Lucr. Sci. Manag. Agric. 2016, 18, 5. [Google Scholar]
- Vasile, A.J.; Andreea, I.R.; Popescu, G.H.; Elvira, N.; Marian, Z. Implications of agricultural bioenergy crop production and prices in changing the land use paradigm—The case of Romania. Land Use Policy 2016, 50, 399–407. [Google Scholar] [CrossRef] [Green Version]
- Alboiu, C. Romanian Vegetable Volatility and Comparisons with Other EU Countries. Lucr. Sci. Manag. Agric. 2016, 18, 5. [Google Scholar]
- Florea, N.V.; Duică, M.C.; Ionescu, C.A.; Duică, A.; Ibinceanu, M.C.O.; Stanescu, S.G. An Analysis of the Influencing Factors of the Romanian Agricultural Output within the Context of Green Economy. Sustainability 2021, 13, 9649. [Google Scholar] [CrossRef]
- Levshin, A.; Ivashova, O.; Gasparyan, I.; Gasparyan, S.; Deniskina, N. Competitiveness of Early Potato Production in Two-Crop Culture. In Advances in Economics, Business and Management Research. Proceedings of the International Conference on Policies and Economics Measures for Agricultural Development, Voronezh, Russia, 25–26 May 2020; Atlantis Press: Paris, France, 2020; pp. 208–212. [Google Scholar] [CrossRef]
- Vlad, I.-M.; Beciu, S.; Ladaru, G.-R. Seasonality and Forecasting in the Romanian Trade with Live Animals. Agric. Agric. Sci. Procedia 2015, 6, 712–719. [Google Scholar] [CrossRef] [Green Version]
- Hoehn, D.; Margallo, M.; Laso, J.; Ruiz-Salmón, I.; Batlle-Bayer, L.; Bala, A.; Fullana-I-Palmer, P.; Aldaco, R. A Novel Composite Index for the Development of Decentralized Food Production, Food Loss, and Waste Management Policies: A Water-Climate-Food Nexus Approach. Sustainability 2021, 13, 2839. [Google Scholar] [CrossRef]
- Rahoveanu, A.T.; Zugravu, A.G.; Soare, I.; Hassan, A.A.M.; Saleh, K.M. Rural Development—Necessity for Reducing Regional Gaps in Romania. In Proceedings of the International Conference “Risk in Contemporary Economy”, Galati, Romania, 19 March–20 May 2016; Editura Universității “Dunărea de Jos”: Galați, Romania, 2016; pp. 564–569. [Google Scholar]
- Borychowski, M.; Stępień, S.; Polcyn, J.; Tošović-Stevanović, A.; Ćalović, D.; Lalić, G.; Žuža, M. Socio-Economic Determinants of Small Family Farms’ Resilience in Selected Central and Eastern European Countries. Sustainability 2020, 12, 10362. [Google Scholar] [CrossRef]
- Fraser, E.D.; Stringer, L.C. Explaining agricultural collapse: Macro-forces, micro-crises and the emergence of land use vulnerability in southern Romania. Glob. Environ. Chang. 2009, 19, 45–53. [Google Scholar] [CrossRef]
- Torky, M.; Hassanein, A.E. Integrating blockchain and the internet of things in precision agriculture: Analysis, opportunities, and challenges. Comput. Electron. Agric. 2020, 178, 105476. [Google Scholar] [CrossRef]
- Boboc, D.; Popescu, G.; Stoian, M.; Lădaru, G.-R.; Petrache, D.C. Best Practices for Integrating the Romanian Small Farmers into the Agri-Food Chain. Amfiteatru Econ. 2017, 19, 315–326. [Google Scholar]
- Henson, S.; Humphrey, J. Understanding the Complexities of Private Standards in Global Agri-Food Chains as They Impact Developing Countries. J. Dev. Stud. 2010, 46, 1628–1646. [Google Scholar] [CrossRef] [PubMed]
- Jha, K.; Doshi, A.; Patel, P.; Shah, M. A comprehensive review on automation in agriculture using artificial intelligence. Artif. Intell. Agric. 2019, 2, 1–12. [Google Scholar] [CrossRef]


| Author(s) & Publication Year | Method | Findings | Observations | Findings in Relation to the Romanian Context |
|---|---|---|---|---|
| Park and Gachukia, 2021 [42] | Case study on the export-oriented fresh fruit and vegetable sector | The authors highlight the essential role of local institutions, innovation systems, and R&D in supporting the local links and their integration in the vegetable global value chain | This research was focused on the fresh fruit and vegetable sector in Kenya | Innovation is needed to improve the Romanian supporting industries and ensure the integration of small farmers in the vegetable value chain |
| Tyce, 2020 [43] | Historically grounded form of political settlement analysis | Domestic political economy dynamics has played a central role in horticultural success. The state’s regulatory role is crucial in regard to vegetable taxation and export licensing. | The authors focused on the main success stories in sub-Saharan Africa | The role of the state is important in harnessing the horticultural potential in terms of economic income |
| Martindale et al., 2020 [44] | The critical control points method; multi-indicator methods | All the external resources included in the production and distribution of foods, including vegetables, should be re-evaluated from the perspective of their impact on the final experience of the consumers, the last chain link | Another topic tackled by this research is the resilience of the global food supply through the lens of food security and sustainability | The Romanian vegetable market needs more time in order for the initial chain links to put the final experience of consumers at the top of their priority ranking |
| Feyaerts et al., 2020 [45] | Review of empirical evidence | In the context of the rapid evolution of agri-food exports in the global value chain, the main challenge remains to enhance and increase the efficiency along the links of the local food value chains | The research was focused on the relationship between the global and local food value chains in Africa | The Romanian vegetable value chain demands more attention in terms of its integration on the global market |
| Wakiyama et al., 2019 [46] | Footprint analysis | Along the Japanese regional vegetable supply chains, the vegetables are not delivered to a market but are instead discarded in the field. This issue is mitigated by governmental measures correlated with the relationship between the regional supply chains and the vegetable global value chain. | The authors of this research focused on the regional Japanese agri-food products supply chains, including vegetables | Food waste is an issue encountered due to high price volatility during peak harvesting seasons, which causes a loss of competitiveness. |
| von Oppenkowski et al., 2019 [47] | Correlation of statistical data and national & international policies | The Romanian agri-food sector is marked by subsistence and semi-subsistence farms, and, because of that, the authors argue that informal markets must be included in the global agri-food value chain and the global production networks | The Romanian small farms are in the spotlight of this research and, in particular, their lack of contribution to the global agri-food value chain | Not applicable |
| Olaitan et al., 2019 [48] | A single-case, embedded research design was applied, with a total of 26 participants (including farmers) | The mix of the existing institutional framework, infrastructure, and logistics issues, on the one side, and market penetration issues and stakeholders’ incompetence, on the other side, are prominent barriers that require viable resolutions if horticultural product exports are to increase | The authors focused on Nigeria’s contribution to the global horticulture value chains, restricting the research to five key stakeholder groups situated upstream in the supply chain | Some areas of Nigeria are facing the same issues noticed in Romania concerning competitiveness loss: (a) poor infrastructure and logistics, (b) market integration issues. |
| Vetter et al., 2019 [49] | A mix of qualitative and quantitative research methods | Traditional Indonesian food retail appears not to be in complete demise but rather adaptive and resilient to its modern competitors in the global agri-food value chains | This research is specific to Indonesia’s agri-food system and its integration in the global agri-food value chains | Agri-food sector tends to be resilient, but it does not mean that it is internationally competitive |
| Thow and Priyadarshi, 2013 [50] | Qualitative and quantitative methods | It is possible to design a mechanism for increasing the supply of fruits and vegetables in developing countries, contribute to achieving food security, and to mitigating health issues. | The relationship between the global vegetable value chain and public health issues was emphasized. | Ensuring food security is a priority, but the economic competitiveness of the vegetable sector should not be neglected |
| Raab et al., 2013 [51] | A range of qualitative and quantitative methods and tools: tree diagram, failure mode, and effects analysis | Responsibilities for preventive consumer protection constantly change in the case of international commercial trade in fruits and vegetables, just like any other food chain. As a result, the authors designed a proactive risk management system for the selection of suppliers and the evaluation of risks in the international trade in fruits and vegetables | The authors concentrated on elaborating an instrument—a proactive risk management system in the global fruit and vegetable value chains | Considering the high price volatility in Romania in the case of vegetable production, a risk management system is needed in order to mitigate the negative effects of the poor performance of the supporting industries and the decoupling of small farmers from the global market |
| Maertens et al., 2012 [52] | Mix of research methods | Increased high-value exports from the horticulture sector and the modernization of export supply chains cause important positive welfare effects on the economy. This can occur in various ways through the effects of the product or the labor market—directly or indirectly | The uniqueness of this study resides in the fact that the horticulture export activities in sub-Saharan Africa were approached from the perspective of various regional supply chains | The vegetable sector can contribute more efficiently to the welfare of the Romanian economy if decision-makers adopt strategies designed to support the day-to-day agricultural activities of farmers |
| Dolan and Humphery, 2004 [53] | Interview, empirical research review, short statistical analysis | Because of the demand for vegetables, the UK puts a great deal of pressure on the global agri-food value chain. Through its high demand, the UK influences the chain over all its stages, from the way crops are grown to their processing and storage, even though the UK does not take ownership of the products until they are delivered to regional distribution centers. | This research contributes to the field of international vegetable trade with a unique perspective regarding the governmental actions concerning the trade in fresh vegetables between Africa and the United Kingdom | Romania should strive to properly integrate small farmers in the global agri-food value chain and focus on findings solutions to connect the national production capabilities with UK’s demand for vegetables |
| Porter’s Diamond Attributes | Variable Code | Variable Name | Rationale |
|---|---|---|---|
| Firm Strategy, Structure and Rivalry | C1.1 | Profit of the companies registered under 0331 NACE Code | The 0331 NACE code consists of activities dedicated to the growing of vegetables and melons, roots, and tubers. Values closer to one signal highly performant Romanian counties based on the economic and financial results of the companies growing vegetables. |
| C1.2 | Profit margin of the companies registered under 0331 NACE Code | ||
| C1.3 | Profit per hectare of vegetable crops | ||
| Factor Conditions | C2.1 | Area cultivated with vegetables | Nowak and Kaminska [75] assessed agricultural competitiveness in the EU at country level by resorting to many variables, including agricultural area. The literature is rich in similar research [76,77,78]. Moreover, machinery used in agricultural activities is essential in the assessment of agricultural competitiveness [79,80]. |
| C2.2 | Share of area cultivated with vegetable from total agricultural area | ||
| C2.3 | Combines for potato harvesting and other similar machinery | ||
| Related and Supporting Industries | C3.1 | Profit of the companies registered under 5210 NACE Code | The 5210 NACE code consists of activities dedicated to warehousing and storage. As studied in Refs. [81,82,83,84], storage facilities, warehousing, and efficient logistics management are essential for ensuring high levels of economic competitiveness in the agri-food sector, as well as a performant transportation infrastructure [85]. |
| C3.2 | Profit margin of the companies registered under 5210 NACE Code | ||
| C3.3 | Length of public roads | ||
| Demand Conditions | C4.1 | Value of imported vegetables | A comprehensive assessment model of agricultural production also includes evaluating the state of agricultural trade flows [86,87]. High volumes of deficit signal possible food security threats [88] and poor agri-food sector resilience [89]. However, they can also contribute to market development [90]. Regarding income, it is a variable of great importance in evaluating demand conditions [91]. |
| C4.2 | Value of imported vegetables reported to the value of exported vegetables | ||
| C4.3 | Average monthly nominal net earnings |
| Production | Imports | Exports | |
|---|---|---|---|
| Production | 1 | −0.19 | −0.10 |
| Imports | −0.19 | 1 | 0.38 |
| Exports | −0.10 | 0.38 | 1 |
| Test | Test Value | p-Value |
|---|---|---|
| LM test for spatial lag dependence | 105.01 | 2.2e–16 |
| LM test for spatial error dependence | 103.88 | 2.2e–16 |
| Locally robust LM test for spatial lag and spatial error | 3.9148 | 0.04786 |
| SAR | SEM | SARAR | |
|---|---|---|---|
| Vegetables Import | −0.00093286 | −0.058453 | −0.170650 a |
| Spatial Parameters | |||
| Lambda | Not applicable | 1.20047 a | 1.25529 a |
| Rho | 0.45306 a | Not applicable | −0.999 a |
| Export | Import | |||||
|---|---|---|---|---|---|---|
| Year 2011 | Year 2019 | Dynamic Index | Year 2011 | Year 2019 | Dynamic Index | |
| Romania—Vegetable share from total | 3.88 | 3.27 | 0.84 | 4.30 | 4.90 | 1.14 |
| World—Vegetable share from total | 2.95 | 2.97 | 1.01 | 3.19 | 3.18 | 1.00 |
| Balassa index | 1.32 | 1.10 | 0.84 | 1.35 | 1.54 | 1.14 |
| No. | Romanian County | Vegetable Trade Balance Result a (Unit of Measurement: Thousand EUR) | Ii b |
|---|---|---|---|
| 1 | Alba | −488 | 1.112 |
| 2 | Arad | −9.228 | −1.608 |
| 3 | Argeș | −5.224 | 1.078 |
| 4 | Bacău | −2.135 | 1.164 |
| 5 | Bihor | −1.886 | −1.033 |
| 6 | Bistrița-Năsaud | −294 | 1.229 |
| 7 | Botoșani | −214 | 1.114 |
| 8 | Brăila | −222 | 0.966 |
| 9 | Brașov | −6.533 | 1.105 |
| 10 | Buzău | −648 | 1.033 |
| 11 | Călărași | −93 | 1.079 |
| 12 | Caraș-Severin | −272 | 1.390 |
| 13 | Cluj | 361 | 1.022 |
| 14 | Constanța | −5.775 | 1.194 |
| 15 | Covasna | −4.083 | 1.077 |
| 16 | Dâmbovița | −1.092 | −1.666 |
| 17 | Dolj | −1.086 | −0.954 |
| 18 | Galați | −70 | −0.900 |
| 19 | Giurgiu | −193 | 0.893 |
| 20 | Gorj | 3.661 | −1.794 |
| 21 | Harghita | 3.137 | −1.261 |
| 22 | Hunedoara | 3.804 | 1.031 |
| 23 | Ialomița | −168 | 1.027 |
| 24 | Iași | −1.049 | 0.999 |
| 25 | Ilfov | −110,588 | 1.109 |
| 26 | Maramureș | −1.332 | 1.039 |
| 27 | Mehedinți | −123 | 1.048 |
| 28 | București | −152,051 | 1.210 |
| 29 | Mureș | −4.161 | 1.049 |
| 30 | Neamț | −478 | 1.133 |
| 31 | Olt | −402 | 1.051 |
| 32 | Prahova | −59,634 | 1.368 |
| 33 | Sălaj | 6.217 | −1.511 |
| 34 | Satu Mare | −652 | 1.087 |
| 35 | Sibiu | −1.200 | 1.070 |
| 36 | Suceava | −1.725 | 1.078 |
| 37 | Teleorman | −266 | 1.174 |
| 38 | Timiș | −28,845 | 1.110 |
| 39 | Tulcea | −1.819 | 1.157 |
| 40 | Vâlcea | −2.910 | 1.154 |
| 41 | Vaslui | −1.043 | −1.370 |
| 42 | Vrancea | −257 | 1.382 |
| No. | County | Firm Strategy, Structure and Rivalry | Factor Conditions | Related and Supporting Industries | Demand Conditions | ||||||||
|---|---|---|---|---|---|---|---|---|---|---|---|---|---|
| A1.1 | A1.2 | A1.3 | A2.1 | A2.2 | A2.3 | A3.1 | A3.2 | A3.3 | A4.1 | A4.2 | A4.3 | ||
| 1 | Sălaj | 1.000 | 0.195 | 1.000 | 0.166 | 0.301 | 0.044 | 0.025 | 1.000 | 0.934 | 0.907 | 0.995 | 0.154 |
| 2 | Galați | 0.488 | 0.372 | 0.180 | 0.669 | 0.684 | 0.014 | 0.049 | 0.184 | 0.552 | 0.947 | 0.981 | 0.259 |
| 3 | Bihor | 0.465 | 0.287 | 0.351 | 0.263 | 0.132 | 0.243 | 0.185 | 0.178 | 0.666 | 0.571 | 0.979 | 0.095 |
| 4 | Covasna | 0.421 | 0.162 | 0.289 | 0.302 | 0.722 | 1.000 | 0.003 | 0.006 | 0.208 | 0.912 | 0.908 | 0.076 |
| 5 | Ialomița | 0.354 | 0.249 | 0.188 | 0.426 | 0.395 | 0.003 | 0.003 | 0.327 | 0.282 | 0.999 | 0.860 | 0.133 |
| 6 | Timiș | 0.287 | 0.398 | 0.154 | 0.423 | 0.129 | 0.070 | 0.262 | 0.072 | 0.580 | 0.518 | 0.000 | 0.835 |
| 7 | Bacău | 0.287 | 1.000 | 0.327 | 0.131 | 0.135 | 0.015 | 0.017 | 0.065 | 0.590 | 0.965 | 0.622 | 0.271 |
| 8 | Giurgiu | 0.265 | 0.252 | 0.174 | 0.320 | 0.453 | 0.000 | 0.038 | 0.048 | 0.488 | 0.999 | 0.830 | 0.324 |
| 9 | Mureș | 0.243 | 0.314 | 0.185 | 0.258 | 0.186 | 0.152 | 0.262 | 0.163 | 0.473 | 0.916 | 0.886 | 0.390 |
| 10 | Cluj | 0.160 | 0.157 | 0.109 | 0.307 | 0.211 | 0.210 | 0.111 | 0.340 | 0.741 | 0.909 | 0.983 | 1.000 |
| 11 | Dâmbovița | 0.140 | 0.112 | 0.054 | 0.624 | 1.000 | 0.991 | 0.005 | 0.277 | 0.880 | 0.977 | 0.922 | 0.193 |
| 12 | Neamț | 0.143 | 0.561 | 0.065 | 0.517 | 0.711 | 0.074 | 0.108 | 0.043 | 0.520 | 0.993 | 0.844 | 0.085 |
| 13 | Olt | 0.129 | 0.281 | 0.054 | 0.567 | 0.438 | 0.002 | 0.011 | 0.173 | 0.752 | 0.995 | 0.683 | 0.302 |
| 14 | Constanța | 0.094 | 0.102 | 0.023 | 1.000 | 0.604 | 0.003 | 1.000 | 0.333 | 0.499 | 0.895 | 0.793 | 0.345 |
| 15 | Tulcea | 0.089 | 0.296 | 0.055 | 0.346 | 0.327 | 0.000 | 0.146 | 0.113 | 0.000 | 0.969 | 0.753 | 0.268 |
| 16 | Gorj | 0.082 | 0.079 | 0.097 | 0.124 | 0.233 | 0.001 | 0.008 | 0.066 | 0.690 | 0.979 | 1.000 | 0.297 |
| 17 | Suceava | 0.080 | 0.132 | 0.021 | 0.920 | 0.991 | 0.607 | 0.089 | 0.352 | 0.580 | 0.955 | 0.943 | 0.129 |
| 18 | Harghita | 0.076 | 0.443 | 0.081 | 0.147 | 0.091 | 0.416 | 0.015 | 0.112 | 0.431 | 0.974 | 0.998 | 0.000 |
| 19 | Satu Mare | 0.069 | 0.366 | 0.074 | 0.146 | 0.158 | 0.069 | 0.369 | 0.139 | 0.639 | 0.974 | 0.965 | 0.137 |
| 20 | Iași | 0.062 | 0.130 | 0.030 | 0.472 | 0.432 | 0.019 | 0.169 | 0.899 | 0.823 | 0.972 | 0.948 | 0.669 |
| 21 | Brăila | 0.056 | 0.193 | 0.038 | 0.306 | 0.255 | 0.010 | 0.000 | 0.008 | 0.251 | 0.998 | 0.856 | 0.098 |
| 22 | Dolj | 0.053 | 0.043 | 0.013 | 0.963 | 0.543 | 0.013 | 0.111 | 0.113 | 0.473 | 0.968 | 0.953 | 0.384 |
| 23 | Buzău | 0.053 | 0.076 | 0.026 | 0.457 | 0.386 | 0.005 | 0.000 | 0.000 | 0.790 | 0.988 | 0.910 | 0.128 |
| 24 | Prahova | 0.051 | 0.027 | 0.053 | 0.157 | 0.233 | 0.002 | 0.138 | 0.435 | 0.874 | 0.000 | 0.000 | 0.427 |
| 25 | Caraș-Severin | 0.049 | 0.490 | 0.068 | 0.086 | 0.031 | 0.069 | 0.000 | 0.000 | 0.261 | 0.989 | 0.978 | 0.132 |
| 26 | Arad | 0.047 | 0.214 | 0.028 | 0.361 | 0.204 | 0.035 | 0.068 | 0.302 | 0.465 | 0.760 | 0.938 | 0.220 |
| 27 | Hunedoara | 0.040 | 0.291 | 0.032 | 0.237 | 0.327 | 0.493 | 0.029 | 0.040 | 0.908 | 0.978 | 1.000 | 0.106 |
| 28 | Argeș | 0.036 | 0.210 | 0.049 | 0.091 | 0.071 | 0.017 | 0.148 | 0.227 | 1.000 | 0.866 | 0.937 | 0.444 |
| 29 | Sibiu | 0.036 | 0.268 | 0.058 | 0.057 | 0.060 | 0.320 | 0.003 | 0.035 | 0.417 | 0.979 | 0.847 | 0.541 |
| 30 | Alba | 0.033 | 0.156 | 0.037 | 0.140 | 0.144 | 0.062 | 0.037 | 0.121 | 0.921 | 0.970 | 0.973 | 0.288 |
| 31 | Călărași | 0.024 | 0.372 | 0.016 | 0.303 | 0.214 | 0.006 | 0.051 | 0.369 | 0.294 | 0.996 | 0.890 | 0.227 |
| 32 | Vâlcea | 0.022 | 0.045 | 0.030 | 0.095 | 0.180 | 0.001 | 0.000 | 0.000 | 0.678 | 0.953 | 0.104 | 0.098 |
| 33 | Botoșani | 0.020 | 0.217 | 0.009 | 0.484 | 0.426 | 0.082 | 0.142 | 0.082 | 0.997 | 0.997 | 0.931 | 0.149 |
| 34 | Brașov | 0.016 | 0.105 | 0.038 | 0.000 | 0.000 | 1.004 | 0.085 | 0.130 | 0.406 | 0.880 | 0.801 | 0.498 |
| 35 | Bistrița-Năsăud | 0.013 | 0.443 | 0.015 | 0.140 | 0.173 | 0.134 | 0.008 | 0.046 | 0.390 | 0.989 | 0.966 | 0.044 |
| 36 | Teleorman | 0.011 | 0.060 | 0.004 | 0.546 | 0.346 | 0.021 | 0.112 | 0.044 | 0.307 | 0.997 | 0.778 | 0.044 |
| 37 | Vaslui | 0.009 | 0.317 | 0.010 | 0.139 | 0.080 | 0.002 | 0.000 | 0.000 | 0.715 | 0.984 | 0.625 | 0.151 |
| 38 | Mehedinți | 0.007 | 0.703 | 0.003 | 0.415 | 0.540 | 0.000 | 0.000 | 0.000 | 0.637 | 1.000 | 0.716 | 0.161 |
| 39 | Vrancea | 0.004 | 0.676 | 0.007 | 0.103 | 0.176 | 0.000 | 0.014 | 0.071 | 0.576 | 0.998 | 0.759 | 0.062 |
| 40 | Maramureș | 0.000 | 0.000 | 0.000 | 0.233 | 0.281 | 0.378 | 0.032 | 0.062 | 0.348 | 0.958 | 0.956 | 0.089 |
Publisher’s Note: MDPI stays neutral with regard to jurisdictional claims in published maps and institutional affiliations. |
© 2022 by the authors. Licensee MDPI, Basel, Switzerland. This article is an open access article distributed under the terms and conditions of the Creative Commons Attribution (CC BY) license (https://creativecommons.org/licenses/by/4.0/).
Share and Cite
Constantin, M.; Sacală, M.-D.; Dinu, M.; Piștalu, M.; Pătărlăgeanu, S.R.; Munteanu, I.-D. Vegetable Trade Flows and Chain Competitiveness Linkage Analysis Based on Spatial Panel Econometric Modelling and Porter’s Diamond Model. Agronomy 2022, 12, 411. https://0-doi-org.brum.beds.ac.uk/10.3390/agronomy12020411
Constantin M, Sacală M-D, Dinu M, Piștalu M, Pătărlăgeanu SR, Munteanu I-D. Vegetable Trade Flows and Chain Competitiveness Linkage Analysis Based on Spatial Panel Econometric Modelling and Porter’s Diamond Model. Agronomy. 2022; 12(2):411. https://0-doi-org.brum.beds.ac.uk/10.3390/agronomy12020411
Chicago/Turabian StyleConstantin, Marius, Mihail-Dumitru Sacală, Mihai Dinu, Maria Piștalu, Simona Roxana Pătărlăgeanu, and Irina-Denisa Munteanu. 2022. "Vegetable Trade Flows and Chain Competitiveness Linkage Analysis Based on Spatial Panel Econometric Modelling and Porter’s Diamond Model" Agronomy 12, no. 2: 411. https://0-doi-org.brum.beds.ac.uk/10.3390/agronomy12020411