Article

Heat Stress during Meiosis Has Lasting Impacts on Plant Growth and Reproduction in Wheat (Triticum aestivum L.)

by
Mukesh Choudhary
1,2,3,
Guijun Yan
1,2,
Kadambot H. M. Siddique
1,2 and
Wallace A. Cowling
1,2,*
1
The UWA Institute of Agriculture, The University of Western Australia, Perth, WA 6009, Australia
2
UWA School of Agriculture and Environment, The University of Western Australia, Perth, WA 6009, Australia
3
ICAR-Indian Institute of Maize Research, Ludhiana 141004, Punjab, India
*
Author to whom correspondence should be addressed.
Submission received: 14 March 2022 / Revised: 2 April 2022 / Accepted: 18 April 2022 / Published: 20 April 2022
(This article belongs to the Collection Crop Physiology and Stress)

Abstract

:
Meiosis is the least explored stage for thermotolerance in wheat. We evaluated the impact of 5 d of moderate transient daily heat stress during meiosis in the main stem spike on physiological and grain yield traits in 30 diverse wheat cultivars which vary widely in heat tolerance and sensitivity. We found that a moderate heat stress event during meiosis in the main stem spike had lasting impacts on plant growth and reproduction in heat-sensitive, but not heat-tolerant, wheat cultivars. Heat-tolerant cultivars maintained grain yield, grain number and individual grain weight in the main stem spike and also total plant grain yield and biomass in the heat stress treatment relative to the control. Heat-sensitive cultivars responded to heat stress by producing fewer and smaller grains per spikelet on the main stem, fewer tillers, lower biomass and lower total plant grain yield in the high temperature treatment relative to the control. Heat-sensitive cultivars produced higher flag leaf chlorophyll content in the high temperature treatment relative to the control than heat-tolerant cultivars during the first 3 d of heat treatment. There was small reduction in pollen viability from 98% to 96% following heat stress during meiosis which was unrelated to heat tolerance or sensitivity. Moderate transient heat stress during meiosis did not greatly reduce the production of viable male gametes, but had long-lasting negative impacts on fertilization and subsequent seed production in heat-sensitive cultivars.

1. Introduction

Bread wheat (Triticum aestivum L.) is an important crop due to its broad geographical adaptation and it accounts for 19% of global calorie consumption in human diets [1]. Wheat is cultivated on 219 Mha globally with an annual production of 760.93 Mt [2]. Wheat consumption per capita is expected to increase by 13% from 2015–2017 to 2027 [2], with an additional 100 Mt of wheat grain required by 2050 [3]. However, gradual increases in ambient temperature and unpredictable climatic variations have caused substantial yield losses in wheat in recent years [4,5]. The mean global land temperature has increased by 1.59 °C from 1850–1900 to 2011–2020 [6], and two-thirds of this warming has occurred since 1975, by roughly 0.15–0.20 °C per decade [6,7]. The mean global temperature is expected to increase by a further 3.3–5.7 °C by the end of the 21st century [6], supported by a recent analysis that predicted an average increase of 0.18 °C per decade in mean global temperature since 1981 [8]. The negative impact of higher average temperatures on wheat production has already been felt in Australia where wheat is a major contributor to the economy [9], and the water-limited yield potential of wheat has declined by 27% in the past three decades [10]. This implicates rising temperatures as a cause of declining wheat production [10].
The optimum temperature range for wheat is 15–25 °C [11,12,13]. Above the temperature threshold of 25 °C [14], heat stress in wheat increasingly affects dry matter accumulation, floral initiation, pollination, fertilization and grain yield [15,16,17,18]. Heat stress triggers significant changes in biological and developmental processes in wheat, which can decrease grain yield depending on the magnitude and length of exposure [5,17,18,19,20,21,22]. Heat stress has a greater impact on the reproductive phase than the vegetative phase in wheat [19,23], and heat stress at meiosis decreases pollen development, fertilization and ultimately, grain yield [24,25,26,27]. The Sirius wheat model, based on wheat growth and development in major wheat-growing sites of Europe, predicts an increased frequency of heat stress events (days with temperature >30 °C) during meiosis by 2050 [28,29].
Meiosis occurs synchronously in male (pollen mother cells) and female (megaspore mother cells) cells in a single floret and takes 24 h to complete [30]. Generally, meiosis begins in the middle spikelets of the inflorescence and progresses up and down the spike to the distal positions [31,32]. Meiosis is synchronous within the anthers or ovule of a single floret, but varies between florets within a spikelet by ~12 to 26 h [32]. Saini and Aspinall [24] reported variation in meiosis of up to 3 d between the most advanced primary floret and the least advanced tertiary floret in wheat spikelets, and concluded that later stages of meiosis were the most temperature sensitive. Heat stress post-anthesis reduced grain yield due to a reduction in average individual grain weight [33,34,35,36], but heat stress ≥30 °C at meiosis (or before anthesis) reduced grain yield due to a reduction in grain number [12,24,28,37,38,39]. Heat stress at meiosis results in unbalanced gametes or unviable gametes due to irregular chromosome segregation (laggards), failure of spindle fiber formation and decreased chiasmata formation [32,40,41,42]. Deformed or shriveled anthers and ovules, and abnormal pollen, stigma and style development are often observed; thus, heat stress at meiosis affects both male and female fertility [24,43]. These abnormalities in male and female fertility reduce grain number and grain yield. However, studies on heat stress at/around meiosis are limited [38,41,43] due to the difficulty of timing heat stress events with meiosis.
Saini and Aspinall [24] first investigated the impact of heat stress (3 d for 30 °C) during meiosis in wheat cultivar Gabo. They observed abnormal ovaries and reduced pollen viability with varied responses across florets, i.e., primary florets were affected more than secondary florets, and tertiary florets were unaffected [24,43]. In addition, heat stress affected grain number in all regions of the spike (apical, middle and basal) [24]. Heat stress during meiosis resulted in meiotic abnormalities in ‘Chinese Spring’ wheat [41], and Draeger and Moore [38] reported that the leptotene stage was the most temperature-sensitive period of meiosis in ‘Chinese Spring’. However, these studies used only one cultivar or short periods of high stress; thus knowledge on the impact of heat stress during meiosis on grain number and individual grain weight is limited and restricted to a few cultivars.
Grain number and individual grain weight vary across the spike, with spikelets in the middle region containing more and heavier grains than spikelets in the distal regions [44]. Likewise, the frequency of viable seeds differs between the primary, secondary and tertiary florets of a spikelet [24]. Therefore, we expect that heat stress will affect florets and spikelets differently according to their stage of meiosis during heat stress. Therefore, to screen multiple genotypes for heat stress tolerance at meiosis, systematic efforts are needed to apply heat stress at the same developmental stage in each genotype and assess the impact of heat stress on individual spikelets and florets.
Field-based screening for heat stress tolerance is often subject to the confounding effects of drought stress, but this can be avoided in controlled environment studies by maintaining the same relative water content and water potential of plants in the heat stress and control treatments [24]. According to Saini and Aspinall [24], 3–5 d of heat stress beginning at the early meiosis stage in the main stem spike should expose all florets to heat stress. However, there is a lack of practical information in the literature on predicting early meiosis in a range of cultivars. A common morphological marker for the start of meiosis is auricle distance (AD), i.e., the distance between the auricle of the flag leaf and the penultimate leaf on the main stem. In most cultivars, meiosis initiates when AD is between 1 and 2 cm [32,38,45,46,47]. However, in some studies, the heat stress period began when AD was 4 cm [48,49], or about 24 h after meiosis was initiated in the central region of the spike.
There have been no studies to date in wheat where the impact of heat stress during meiosis has been evaluated in more than one or two genotypes. Meiosis in wheat begins around two weeks before anthesis, and most studies evaluate heat stress tolerance during anthesis or seed filling stages [19,22,50]. In this study, we focus on moderate heat stress at meiosis which follows the precedent set in previous studies at meiosis [23,42] and also matches predictions of heat stress during meiosis in the Sirius wheat model [28,29]. We assess the impact of moderate heat stress at meiosis in a diverse range of wheat cultivars previously reported to be heat-tolerant or sensitive. We hypothesized that heat-tolerant cultivars would have greater ability to cool leaf tissue and maintain chlorophyll and photosynthetic activity during heat stress at meiosis than heat-sensitive cultivars, which would improve the capacity of wheat to set and fill grains on the main stem and the whole plant following a heat stress event during meiosis.

2. Materials and Methods

2.1. Experimental Location and Plant Material

Experiments were conducted in the glasshouse and controlled environment rooms (CERs) at The University of Western Australia, Perth, Western Australia (31° 57′ S and 115° 52′ E) from June to November 2020. An extensive literature review for heat stress studies in wheat revealed several diverse spring wheat cultivars which were reported to be heat stress tolerant or sensitive at various growth stages (vegetative and reproductive), from which we selected 26 cultivars and added four recently released untested cultivars (Supplementary Table S1).

2.2. Growth Conditions before Temperature Treatment

Plastic pots (1.9 L capacity, 150 mm in diameter, 150 mm in height) were filled with 1.6 kg of pasteurized potting mix comprising of fine composted pine bark, cocopeat and quartz river sand in a 5:2:3 ratio. Each pot was fertilized weekly with 2 g of a N:P:K:Ca:Mg (15:2.2:12.4:5:1.8) solution dissolved in 125 mL water (16 g L–1) from three weeks after sowing until maturity. The soil was watered to field capacity, defined as the weight of water retained by soil in pots after 24 h of free drainage, every second day, so soil water content never fell below 70% field capacity. Three seeds were sown per pot, and, with the least vigorous seedlings removed at the two-leaf stage to retain one seedling per pot. There were 2 temperature treatments (high temperature and control), 30 cultivars and 3 replicate pots per cultivar per heat treatment (180 pots in total). One replicate pot in control for three varieties and one replicate pot in the high temperature treatment for one cultivar was missing due to the failure of seeds to germinate. Pots were placed in a phytotron set at 24/16 °C day/night and 16/8 h light/dark, with photosynthetically active radiation of 420 μmol m−2 s−1 at noon.

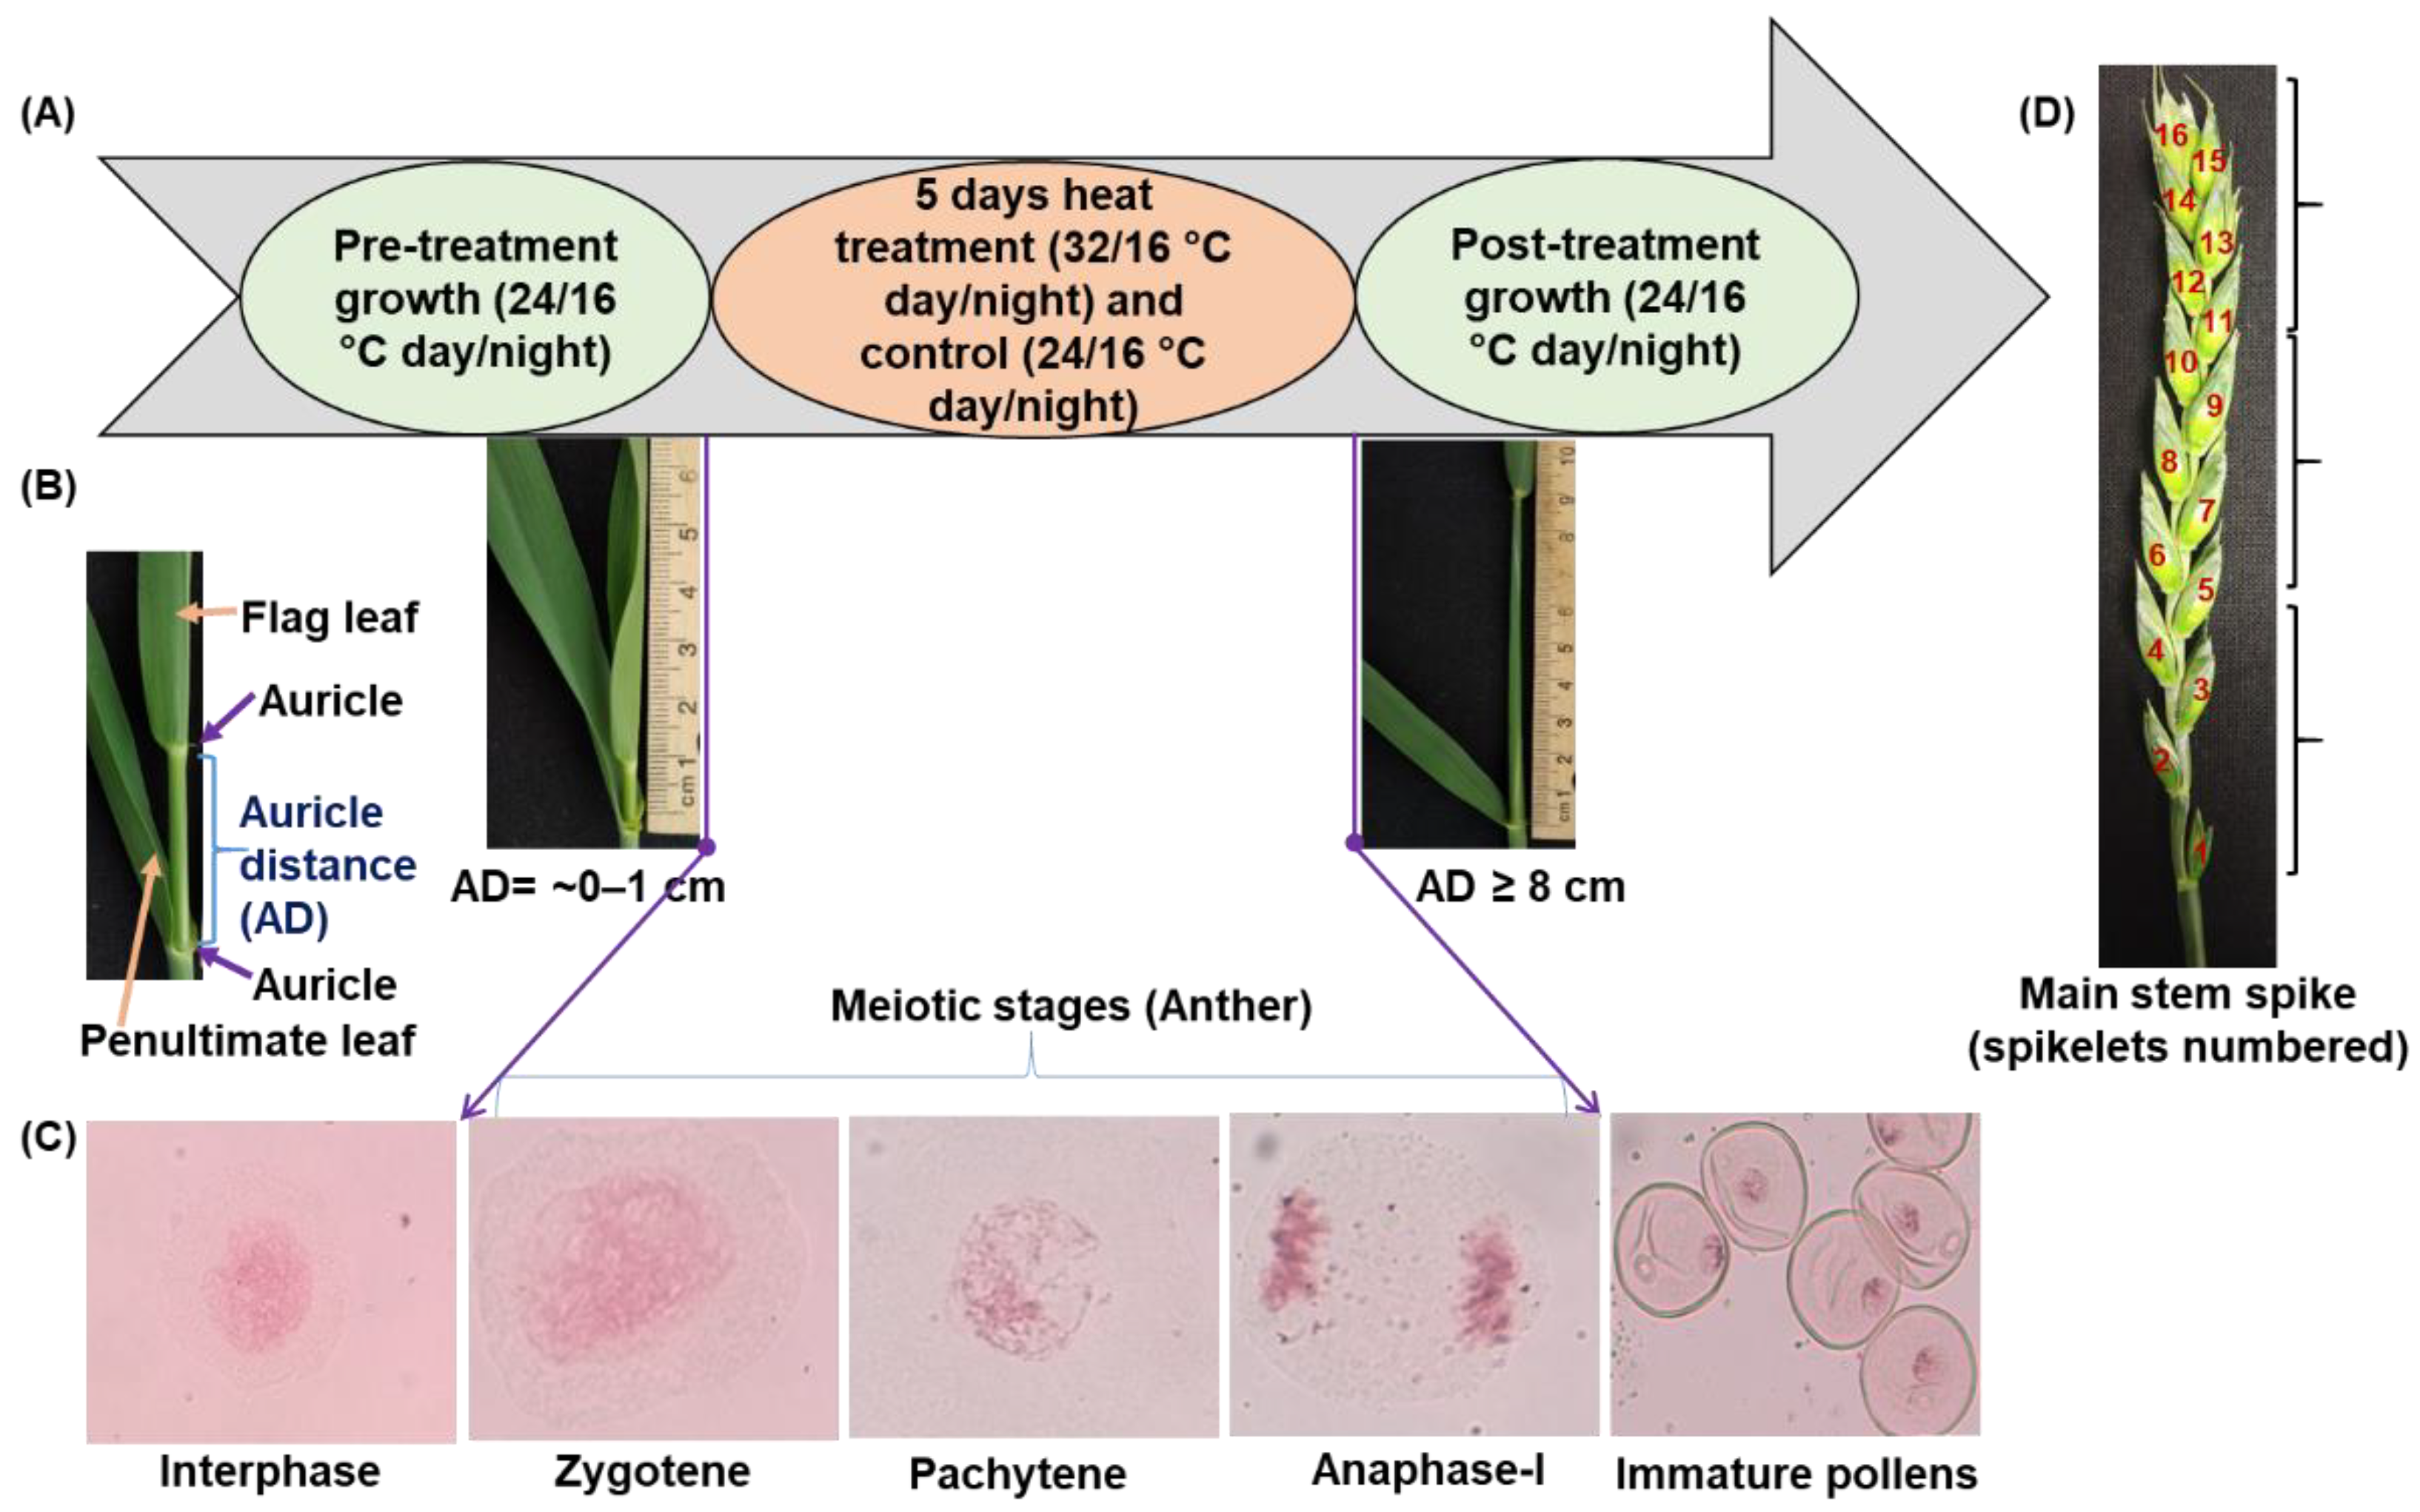
2.3. Auricle Distance at the Beginning of Meiosis

In preliminary experiments, plants were monitored regularly for imminent meiosis by dissecting the developing main stem spike and assessing the stage of meiosis when the AD was between 0 and 8 cm (Figure 1). Meiosis in a diverse range of cultivars was found by microscopic evaluation to begin when AD on the main stem spike was 1 cm (Figure 1). On the morning of the day when AD reached 1 cm, plants were moved from the CER to the temperature treatment. The days from sowing to AD 1 cm (DTAD) and days from sowing to anthesis (DTA) were recorded on individual plants of each cultivar.

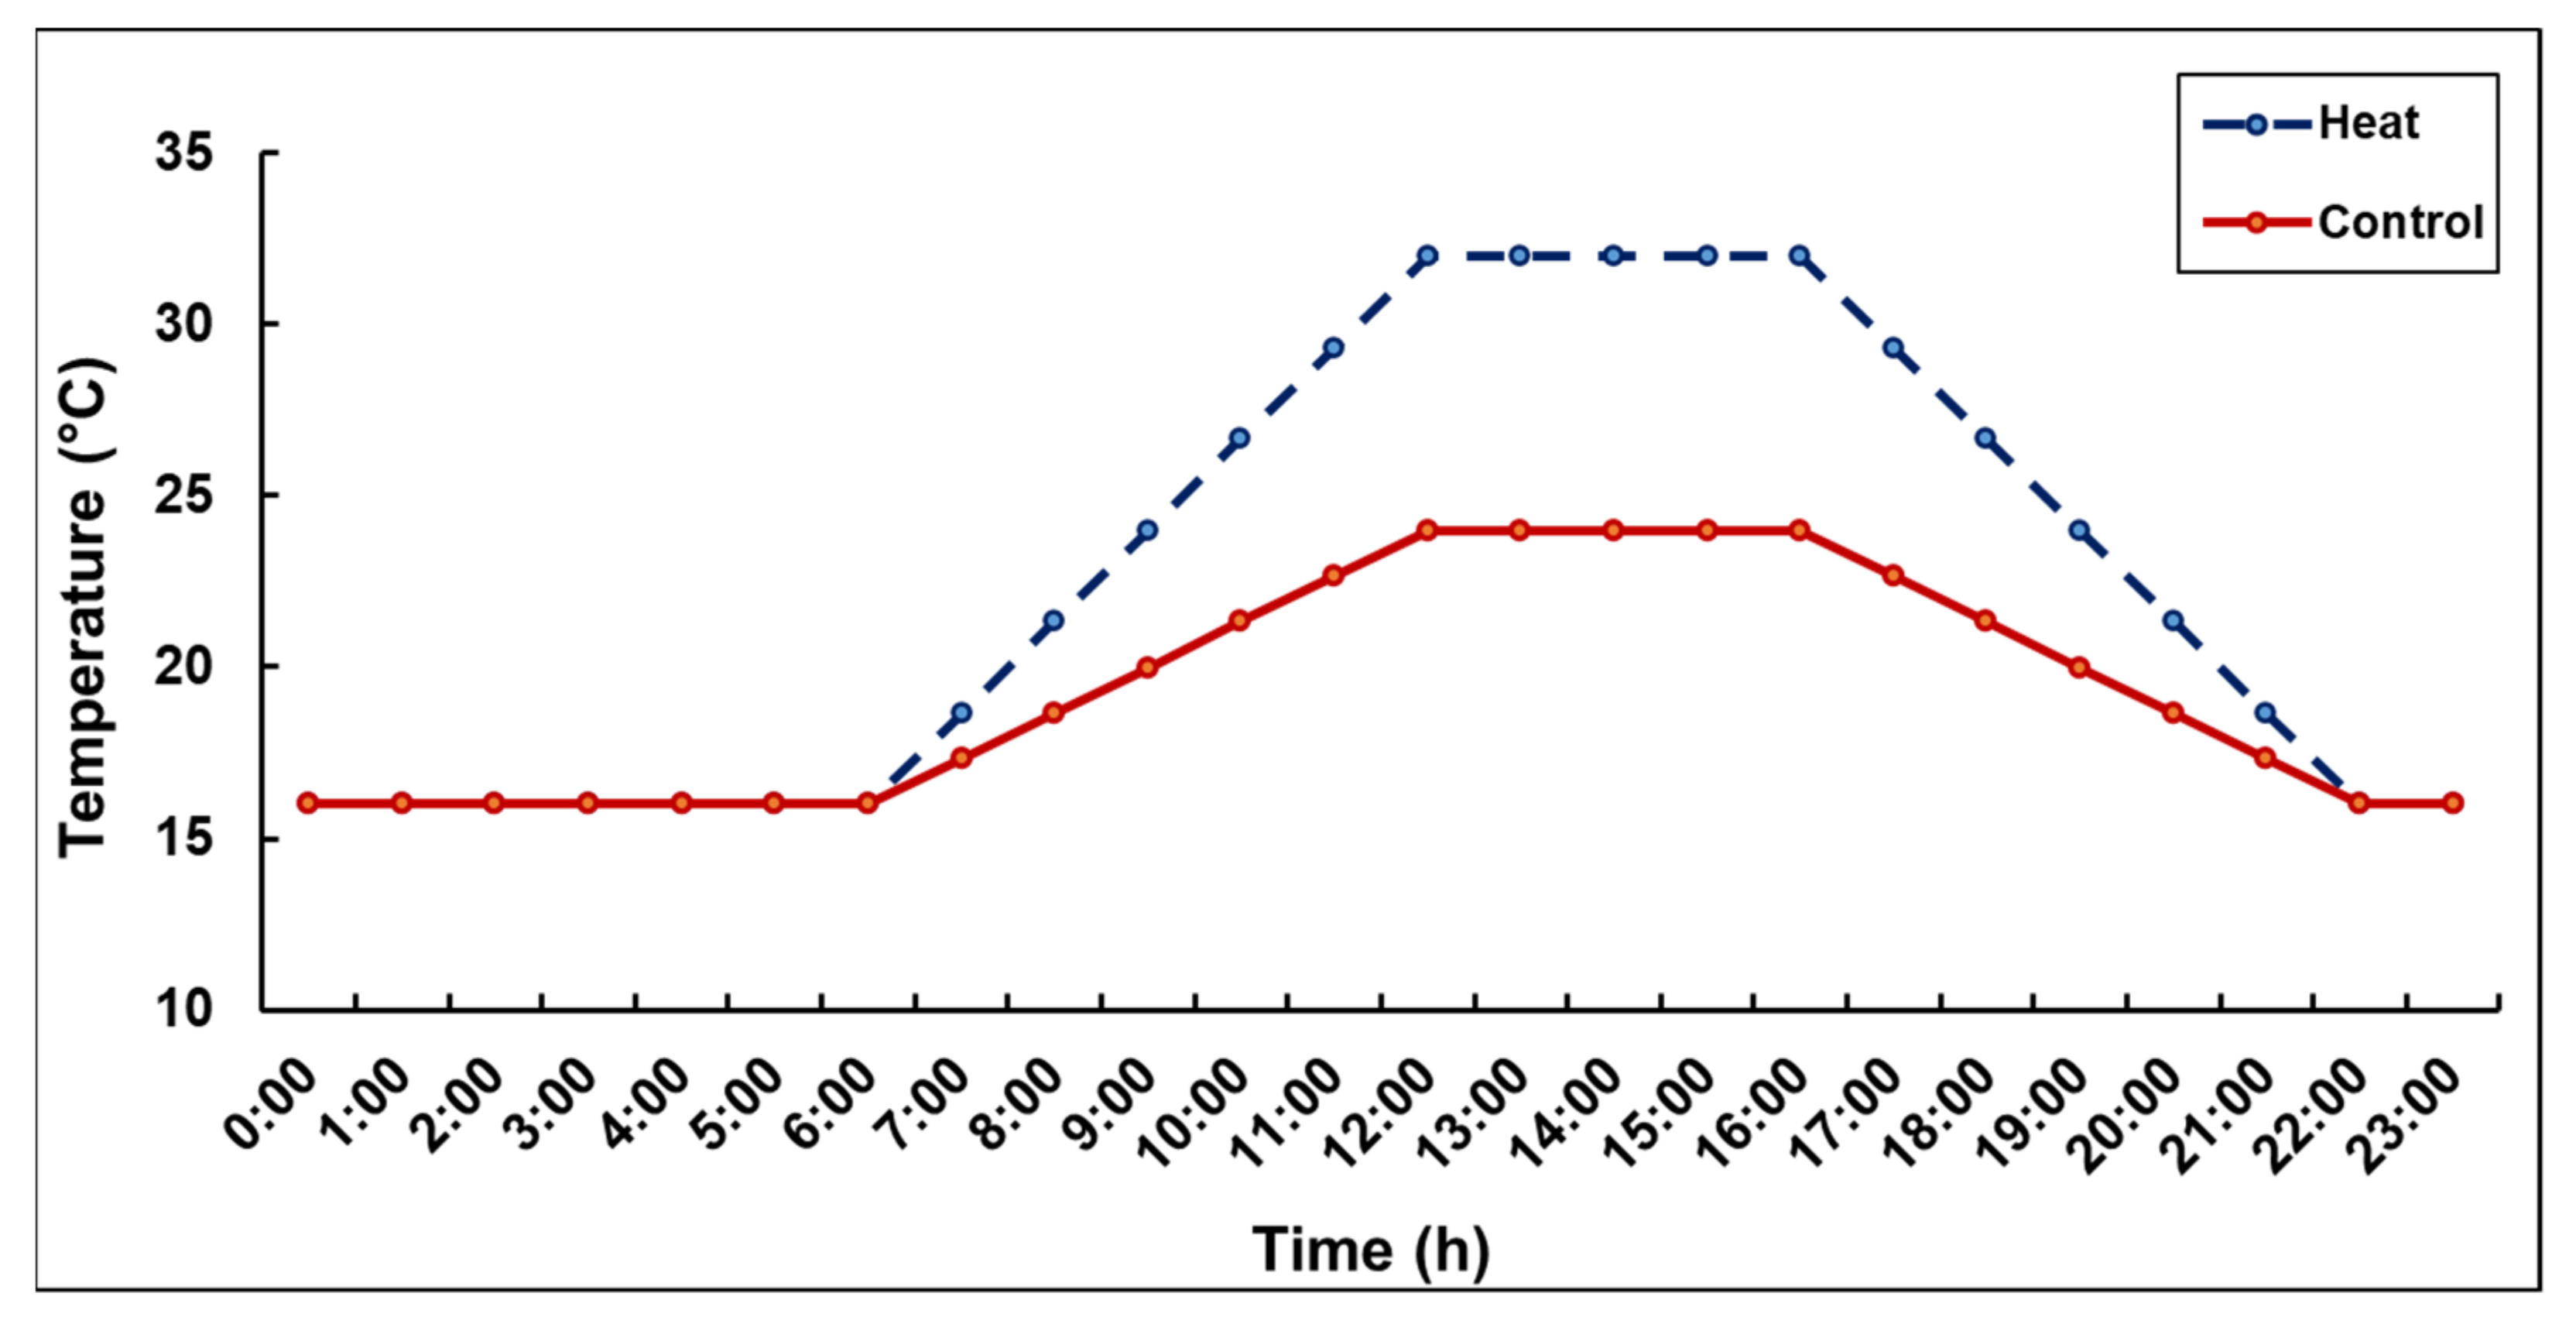
2.4. Temperature Treatments during Meiosis

The main stem was tagged during growth, and on the morning of the day when AD reached 1 cm pots were moved to a CER for 5 d of control or high temperature treatment. Both CERs were set to 16 h light (photosynthetically active radiation of 420 μmol m−2 s−1) from 06:00–22:00 h and 8 h dark from 22:00–06:00 h. Relative humidity was set at ~60% using an automated humidity control. Both CERs were set to a constant 16 °C in the dark, and soil moisture content was maintained above 70% field capacity in both temperature treatments.
The high temperature treatment in this study used moderately high transient daily maximum temperatures. Temperature gradually increased from 16 °C at 06:00 h until 12:00 h when it reached a maximum of 32 °C. This maximum was maintained for 4 h from 12:00–16:00 h, following which, temperature gradually decreased to 16 °C by 22:00 h (Figure 2). In the control treatment, the temperature gradually increased from 16 °C to a maximum of 24 °C (maintained from 12:00 to 16:00 h), and then decreased gradually to 16 °C by 22:00 h. After the temperature treatment, plants were returned to the glasshouse bench and watered regularly to 100% field capacity until seed harvest. Conditions in the glasshouse were 24 °C maximum, 12 °C minimum, with an average relative humidity of 66% and average daily ambient photosynthetically active radiation of 499 ± 5 μmol m−2 s−1 at noon.

2.5. Measurement of Traits during and Immediately after Temperature Treatment

The flag leaf temperature on each cultivar was recorded with an Impac Model IN 15 plus (Luma Sense Technologies GmbH, Santa Clara, CA, USA) infrared thermometer with a minimum 2.2 mm diameter measurement area. Ambient temperature was measured simultaneously with a digital thermometer (Luma Sense Technologies GmbH, Santa Clara, CA, USA) with a 1 s response time. Flag leaf temperature depression (FLTD) was calculated as the difference between ambient and flag leaf temperature. FLTD was measured on day 1 (FLTD_1D), day 3 (FLTD_3D) and day 5 (FLTD_5D) of treatment. Flag leaf chlorophyll content was estimated with a soil plant analysis development (SPAD) plus chlorophyll meter (Konica Minolta, Tokyo, Japan) on day 1 (SPAD_1D), day 3 (SPAD_3D) and day 5 (SPAD_5D) of temperature treatment. SPAD units are closely correlated with leaf chlorophyll content [51] and wheat flag leaf SPAD units are commonly referred to in terms of chlorophyll content [52]. A pocket plant efficiency analyzer (PEA) (Hansatech Instruments Ltd., King’s Lynn, Norfolk, UK) was used to record the quantum yield of photosynthesis on flag leaves as the ratio of variable fluorescence (Fv) and maximum fluorescence (Fm) after leaves were dark-adapted for 20 min. Fv/Fm was measured on day 1 (Fv/Fm_1D), day 3 (Fv/Fm_3D) and day 5 (Fv/Fm_5D) of treatment on all cultivars, except one cultivar on day 3 and day 5 of treatment. Flag leaf stomatal conductance (SC; mmol m−2 s−1) was measured on day 3 of the heat treatment in a subgroup of random cultivars using a Decagon porometer (Model SC-1 Decagon Devices, Inc. Pullman, WA, USA). FLTD, SPAD, Fv/Fm and SC was measured between 13:00 and 15:00 h in the control and high temperature treatment.
Pollen viability (PV) of cultivars was measured at anthesis. One drop of 2% aceto carmine was placed on top of a microscope slide. Mature anthers from a freshly opened flower on the main stem spike were crushed to extract pollen grains which were dispersed into the stain and covered with a coverslip. Viable (bright orange-stained) and non-viable (non-stained) pollen grains were counted under an Olympus microscope (Olympus, Shinjuku, Tokyo, Japan) with 40× magnification, and PV (%) was calculated from staining counts on 200 pollen grains.

2.6. Measurements of Traits at Maturity

When plants were mature and ready for grain harvest, the entire above-ground biomass (BM) was recorded after oven-drying the above-ground plant parts at 37 °C until constant weight. The main stem length (MSL; cm) was measured, and yield-related traits measured on the main stem spike included grain yield (GY; g), grain number (GN) and average individual grain weight (GW; mg) determined by dividing GY by GN, spikelet number (SN) and spike length (SL; cm).
In a separate analysis for cultivars Vixen, Gladius, Hellfire and W156, grain number per spikelet (GNs) and average individual grain weight per spikelet (GWs) were recorded at each spikelet position, with spikelet position numbered from the base of the spike upwards (Figure 1). GNs and GWs were regressed against spikelet position (from spikelets 4 to 13) using linear and quadratic models. Spikelets 4 to 13 were chosen for analysis because these spikelets were present in all varieties. Whole plant traits included BM, total number of tillers (TNT), effective number of tillers (ENT; number of tillers with viable seeds), percentage effective tillers (ET; 100 × ENT/TNT) and total plant grain yield (TGY; total weight of grains harvested from effective tillers).

2.7. Statistical Analyses

Statistical analysis was performed using linear mixed models with residual maximum likelihood (REML) estimation, using ASReml-R V4 [53]. For all the traits, treatment was considered as fixed effect and cultivar, cultivar × treatment and error as random effects to estimate Wald statistic and variance components, respectively. Principal component analysis-based clustering (PCA) was performed using the ‘factoextra’ and ‘FactoMineR’ packages in R Version 1.4.1717. Correlation analysis was done using ‘xtable’ package, and correlation plot was made using ‘GGally’ package in R Version 1.4.1717. Linear and quadratic (polynomial) regression of GNs and GWs against spikelet position was undertaken on individual cultivars using ordinary least squares analysis with base R inbuilt lm() function, and the graphs were prepared using the ‘ggplot2′package in R.

3. Results

The 30 wheat cultivars in this experiment ranged in DTAD from 40 to 69 d and in DTA from 58 to 85 d. DTAD occurred on average 16 d before anthesis (Supplementary Table S1).

3.1. Effect of Heat Stress on Traits Measured Immediately after Temperature Treatment or at Maturity

REML analysis showed significant effects of the heat treatment on many traits (Table 1). The high temperature treatment reduced the average GN across all cultivars by 11.8% and GY by 14.1% on the main stem spike relative to the control treatment, but individual GW on the main stem spike was not affected by high temperature relative to the control (Table 1). The high temperature treatment reduced average TGY by 11.7% and BM by 9.3% (Table 1), but did not affect average MSL, SL, SN, TNT, ENT, or ET relative to the control. There was no significant cultivar × temperature treatment interaction for these yield component traits (Table 1).
Averaged across all cultivars, GY was reduced in the high temperature treatment relative to the control, but this was the result of a reduction in GN but not GW (Figure 3, Table 1, Supplementary Table S2). Cultivars Chinese Spring, Devil, Waagan and Young had a slight reduction in GN (<10%) but a high reduction in GY (>20%) in the high temperature relative to the control temperature treatment (Figure 3A, Supplementary Table S2). The most heat-tolerant cultivars were Babax, Hellfire, Vixen and Tevere which had small reductions in GY and GN (<10%) in the heat temperature relative to the control treatment. The most heat-sensitive cultivars were Excalibur, Gladius, Kinsei, Mace, Rockstar and W156 which had more than 20% reduction in GN and GY in the heat temperature relative to the control treatment (Figure 3A, Supplementary Table S2). GY in Vixen and Suntop increased slightly in the high temperature treatment relative to the control due to a large increase in GW in the heat temperature treatment (Figure 3, Supplementary Table S2).
There was a small but significant average reduction in BM following the high temperature treatment (Table 1), but cultivars Hellfire and RAC875 increased in BM by 11.8% and 11.5%, respectively, whereas Sundor and EGA Gregory decreased in BM by 35.3% and 30.8%, respectively, in the high temperature treatment relative to the control treatment (Supplementary Table S2). Cultivar Young increased in SL and MSL by 7.5% and 29.5%, respectively, in the high temperature treatment compared to the control whereas W156 and Rockstar decreased SL and MSL by 11.5% and 12.4%, respectively (Supplementary Table S2).
PV decreased slightly from 98.7% in the control to 96.2% in the high temperature treatment (Table 1); cultivar Devil had the smallest reduction (1.0%) and Mace had the highest (4.9%) (Supplementary Table S2).

3.2. Effect of Heat Stress on Physiological Traits Measured during the Heat Stress Treatment

High temperature treatment significantly increased flag leaf stomatal conductance (SC), increased flag leaf temperature depression (FLTD) and slightly reduced the quantum yield of photosynthesis (Fv/Fm) but did not change chlorophyll content (SPAD) of the flag leaf on average relative to the control (Table 1). Cultivars varied significantly in flag leaf SPAD and Fv/Fm at days 1, 3 and 5 of temperature treatment, but did not vary in FLTD (Table 1). No significant cultivar × temperature treatment interaction effects occurred for SPAD, but significant interactions occurred for Fv/Fm_5D (Table 1). The maximum reductions in FLTD with heat treatment occurred in Halberd (4.5%), Babax (7.9%) and Sundor (29.9%) (Supplementary Table S2). Most cultivars had higher FLTD in the heat temperature treatment relative to the control treatment (that is, a negative value for % reduction), especially in FLTD_1D in Mace (–142.9%), FLTD_3D in Millewa (–147.6%) and FLTD_5D in Chinese Spring (–88.5%) (Supplementary Table S2). For SPAD_1D, SPAD_3D and SPAD_5D, the maximum % reduction in the heat stress treatment relative to the control treatment occurred in Suntop (6.3%), RAC875 (6.4%) and Gladius (5.6%), respectively; in contrast SPAD_1D, SPAD_3D and SPAD_5D increased under heat stress relative to the control in Mace (–7.5%), Devil (–9.5%) and Mitre (–8.1%), respectively (Supplementary Table S2). The maximum reduction in Fv/Fm (2.8%) on day 1 of heat stress (Fv/Fm_1D) treatment occurred in Reeves, Suntop, Vixen and Waagan, whereas Ninja had a 4.4% reduction on day 5 of heat stress (Fv/Fm_5D). Fv/Fm was least affected in Seri M82 and Babax (Supplementary Table S2). Stomatal conductance (SC) did not vary between the cultivars but increased (−28.72%) significantly in the heat stress treatment relative to the control treatment, since moisture content of soil was maintained at >70% field capacity in both temperature treatments.

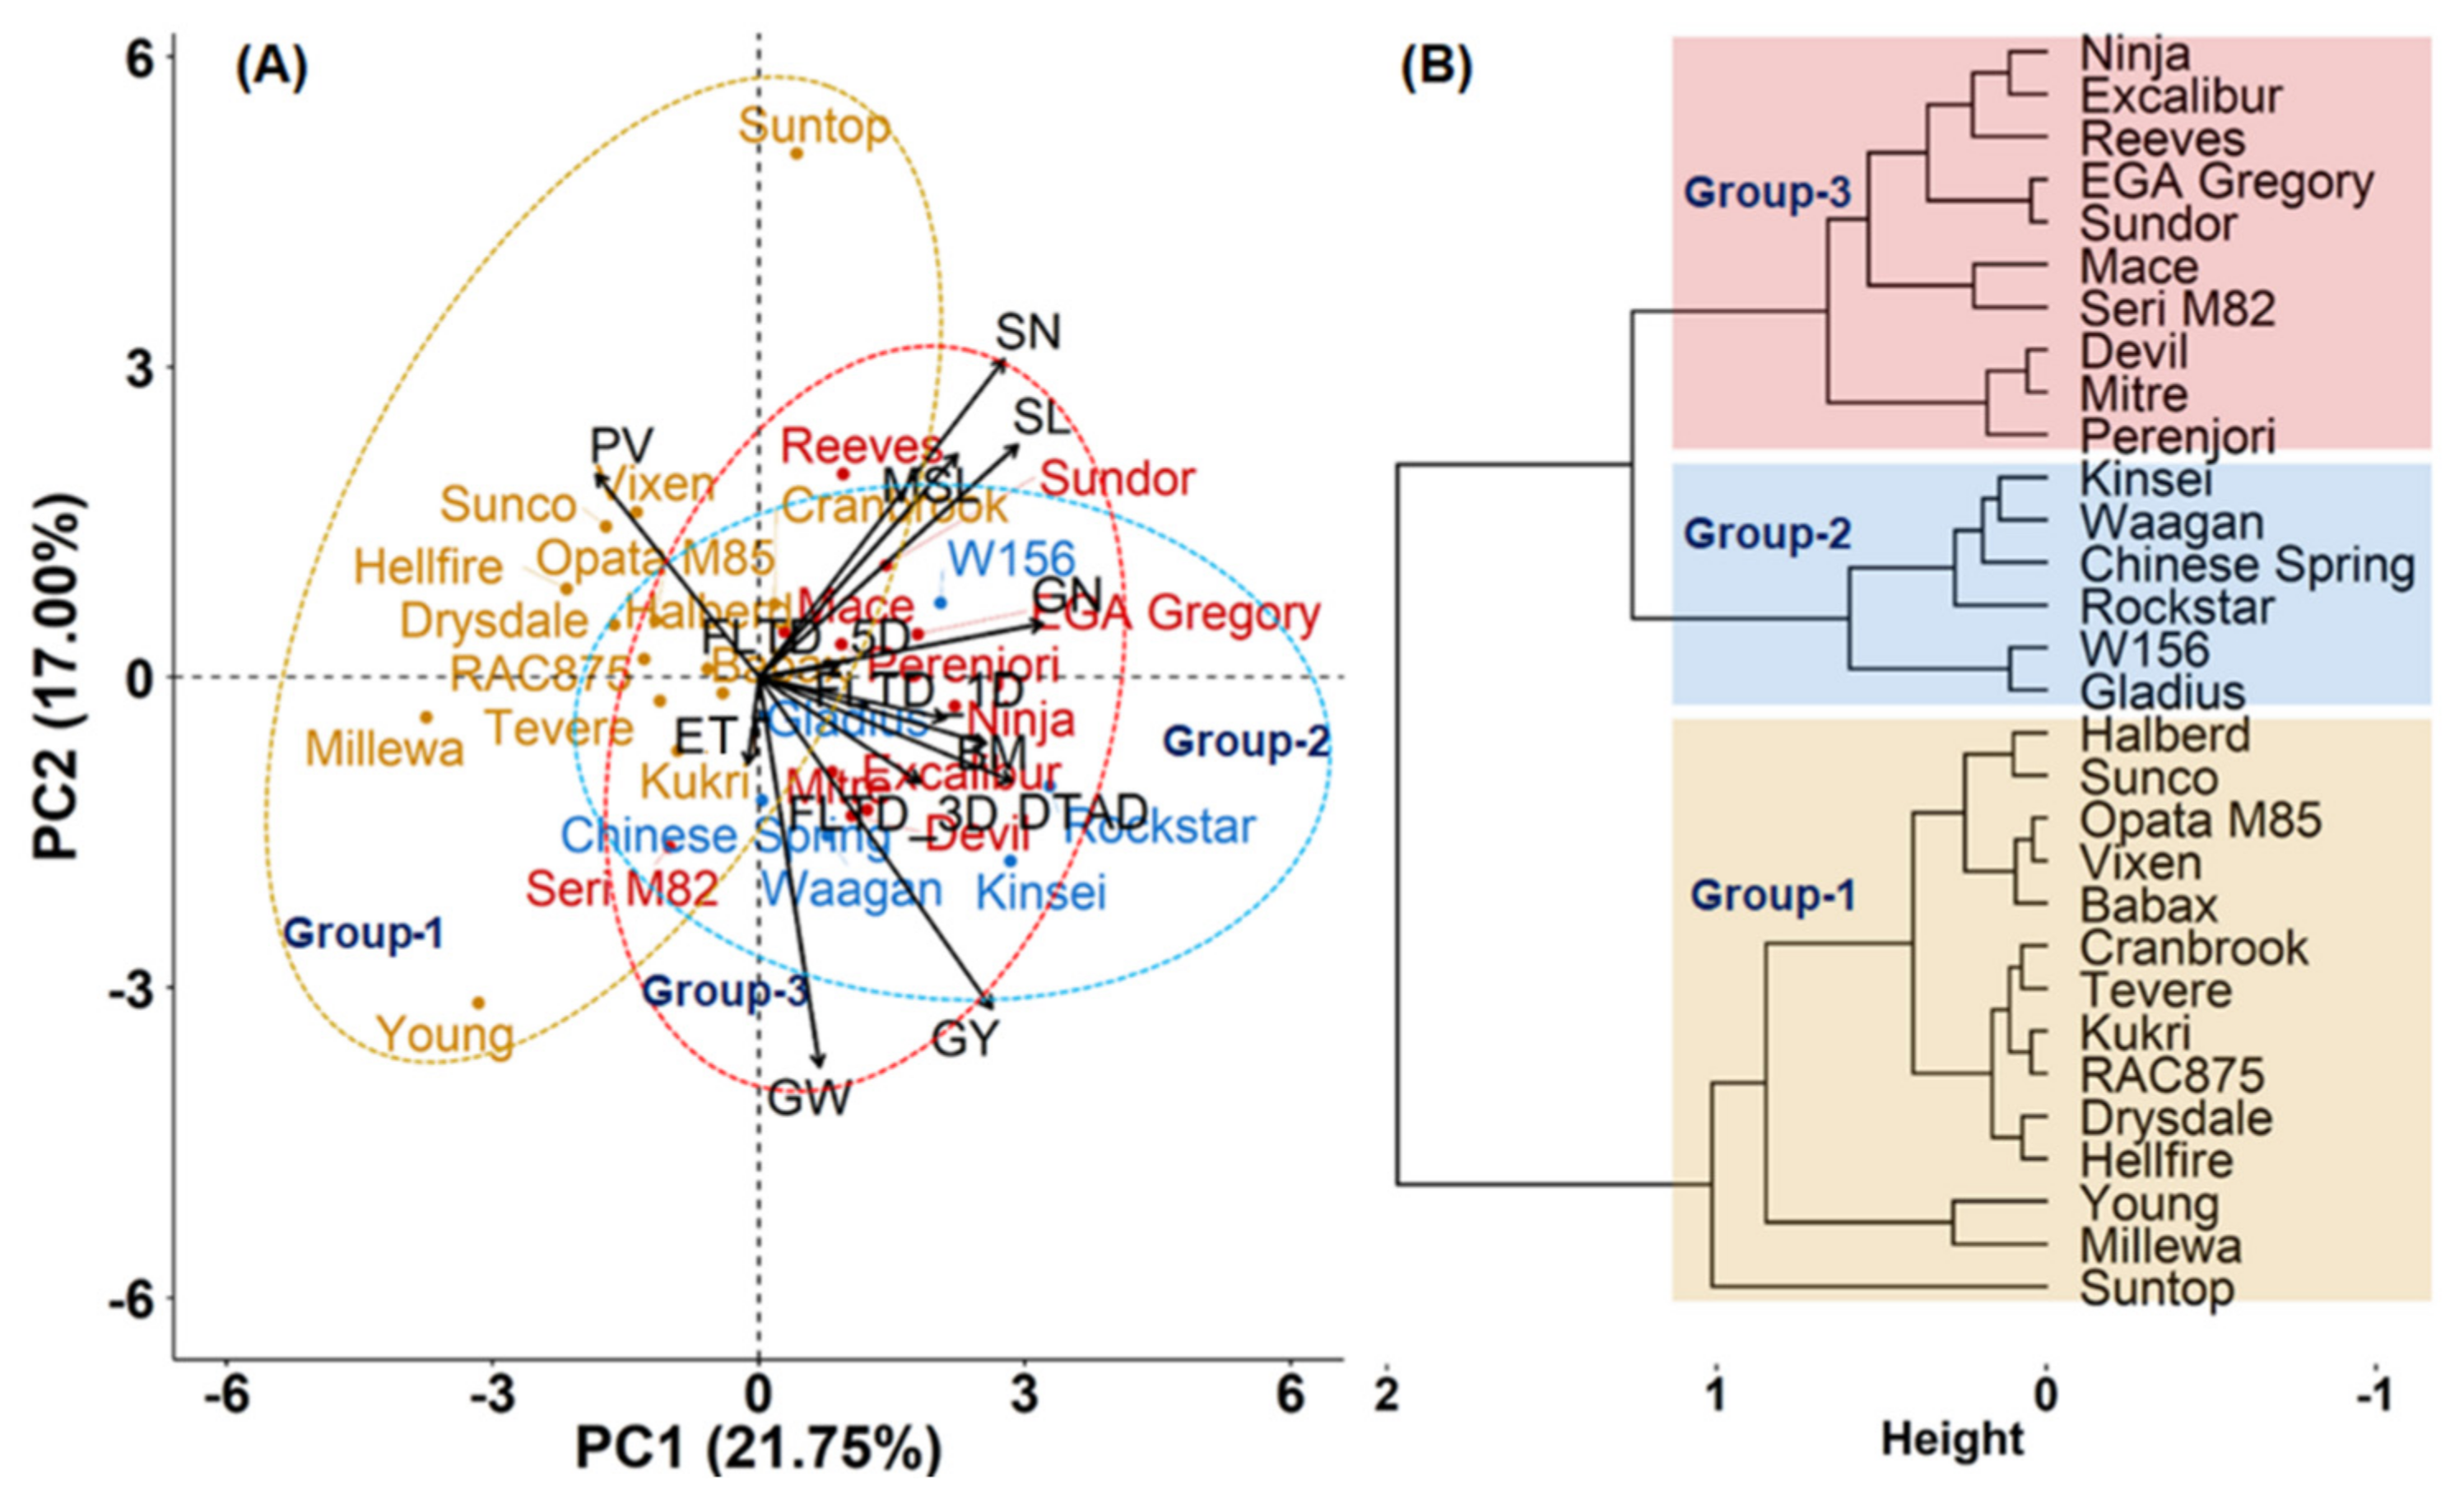
3.3. Principal Component Analysis and Clustering of Cultivars Based on Response to Heat Stress

Principal component analysis (PCA) included traits that were significantly affected by temperature treatment (Table 1) and DTAD (Figure 4A, Supplementary Table S3). The first principal component (PC) axis accounted for 21.75% of the total variance with GN (0.40), BM (0.32) and SL (0.36) being the key contributing traits (Supplementary Table S3). The second PC axis contributed 17.0% of total variation with GY (–0.45), GW (–0.52) and SN (0.43) being the key contributing traits. The first six principal components explained 80% of the total variation in the dataset (Supplementary Table S3).
Cluster analysis revealed three major groups of cultivars, defined as Groups 1, 2 and 3 (Figure 4B) which are circled in Figure 4A, and the average trait values of groups are shown in Table 2. Group 1 (heat-tolerant cultivars) showed only slightly reduced GY, GN and GW, and no reduction in BM in the high temperature relative to the control treatments (Figure 4; Table 2; Supplementary Table S3); whereas Groups 2 and 3 (heat-sensitive cultivars) showed reductions in GN and BM in the high temperature relative to the control treatments (Figure 4B; Table 2; Supplementary Table S3). Based on reductions in GN and BM, Group 3 was the most heat-sensitive group. Group 2 also had the highest leaf temperature depression in FLTD_3D and FLTD_5D (Table 2). The vectors for a greater % reduction in GN, BM and SL in the high temperature relative to the control treatments in the PCA biplot (Figure 4A) point towards the heat-sensitive Groups 2 and 3, and away from heat-tolerant Group 1 on PC1. Similarly, vectors for a greater % reduction in GY and GW in the high temperature relative to the control treatments pointed towards heat-sensitive Groups 2 and 3, and away from heat-tolerant Group 1 on PC2.
The significant cultivar × heat treatment interactions for Fv/Fm_5D (Table 1) were explored in the cluster groups. For Fv/Fm, Group 3 (heat-sensitive) showed slight reductions in Fv/Fm at fifth day of heat stress. Group 3 (heat-sensitive) under heat stress had less ability to reduce temperature in the flag leaf on day 5 (FLTD_5D) than the control, as compared to Groups 1 and 2.

3.4. Correlations across Cultivars for Percent Reduction in Physiological and Yield-Related Traits

The correlation between cultivar means for “% reduction FLTD” and “% reduction SPAD” was negative, that is, cultivars with higher cooling ability under heat stress (higher FLTD) tended to maintain chlorophyll content (SPAD units) under heat stress, whereas cultivars with lower cooling ability (lower FLTD) tended to produce higher chlorophyll content (SPAD units) under heat stress (Supplementary Table S4). SC varied from 290.1 to 415.3 mmol m−2 s−1 across eight cultivars (Supplementary Table S2). Cultivars with lower leaf SC on day 3 tended to have higher SPAD and less cooling ability (lower FLTD) than those with higher SC. For example, Kukri and Mitre had a higher SPAD response, lower FLTD and lower SC than Hellfire and Vixen (Supplementary Table S2).
In terms of plant growth responses, cultivars which produced higher flag leaf chlorophyll content (SPAD units) in the high temperature relative to the control treatment (more negative values of “% reduction SPAD”) tended to produce relatively fewer tillers, lower biomass and lower total grain yield under heat stress (that is, more positive values of “% reduction” in ENT, TNT, BM and TGY), and hence there were significant negative correlations between these traits (Supplementary Figure S1 and Table S4). Cultivars that had higher cooling ability (larger negative values of “% reduction FLTD”) tended to have relatively more tillers under heat stress (lower values of “% reduction” in ENT and TNT) and there were significant positive correlations between these traits (Supplementary Table S4).
There were small but significant average reductions of between 1.5% and 1.8% in Fv/Fm in the high temperature relative to the control treatment across days 1, 3 and 5 (Table 1). The cultivar means for “% reduction Fv/Fm_1D” and “% reduction GW” were negatively correlated (Supplementary Table S4), that is, cultivars that experienced high “% reduction Fv/Fm_1D” tended to have less impact of heat stress on GW. However, the values associated with “% reduction Fv/Fm_1D” were small.
There was a small but significant reduction in PV in the high temperature relative to the control treatment. The “% reduction PV” was inversely correlated with the “% reduction FLTD_1D”; that is, cultivars with higher cooling ability in the flag leaf under heat stress tended to have relatively higher PV (Supplementary Table S4).

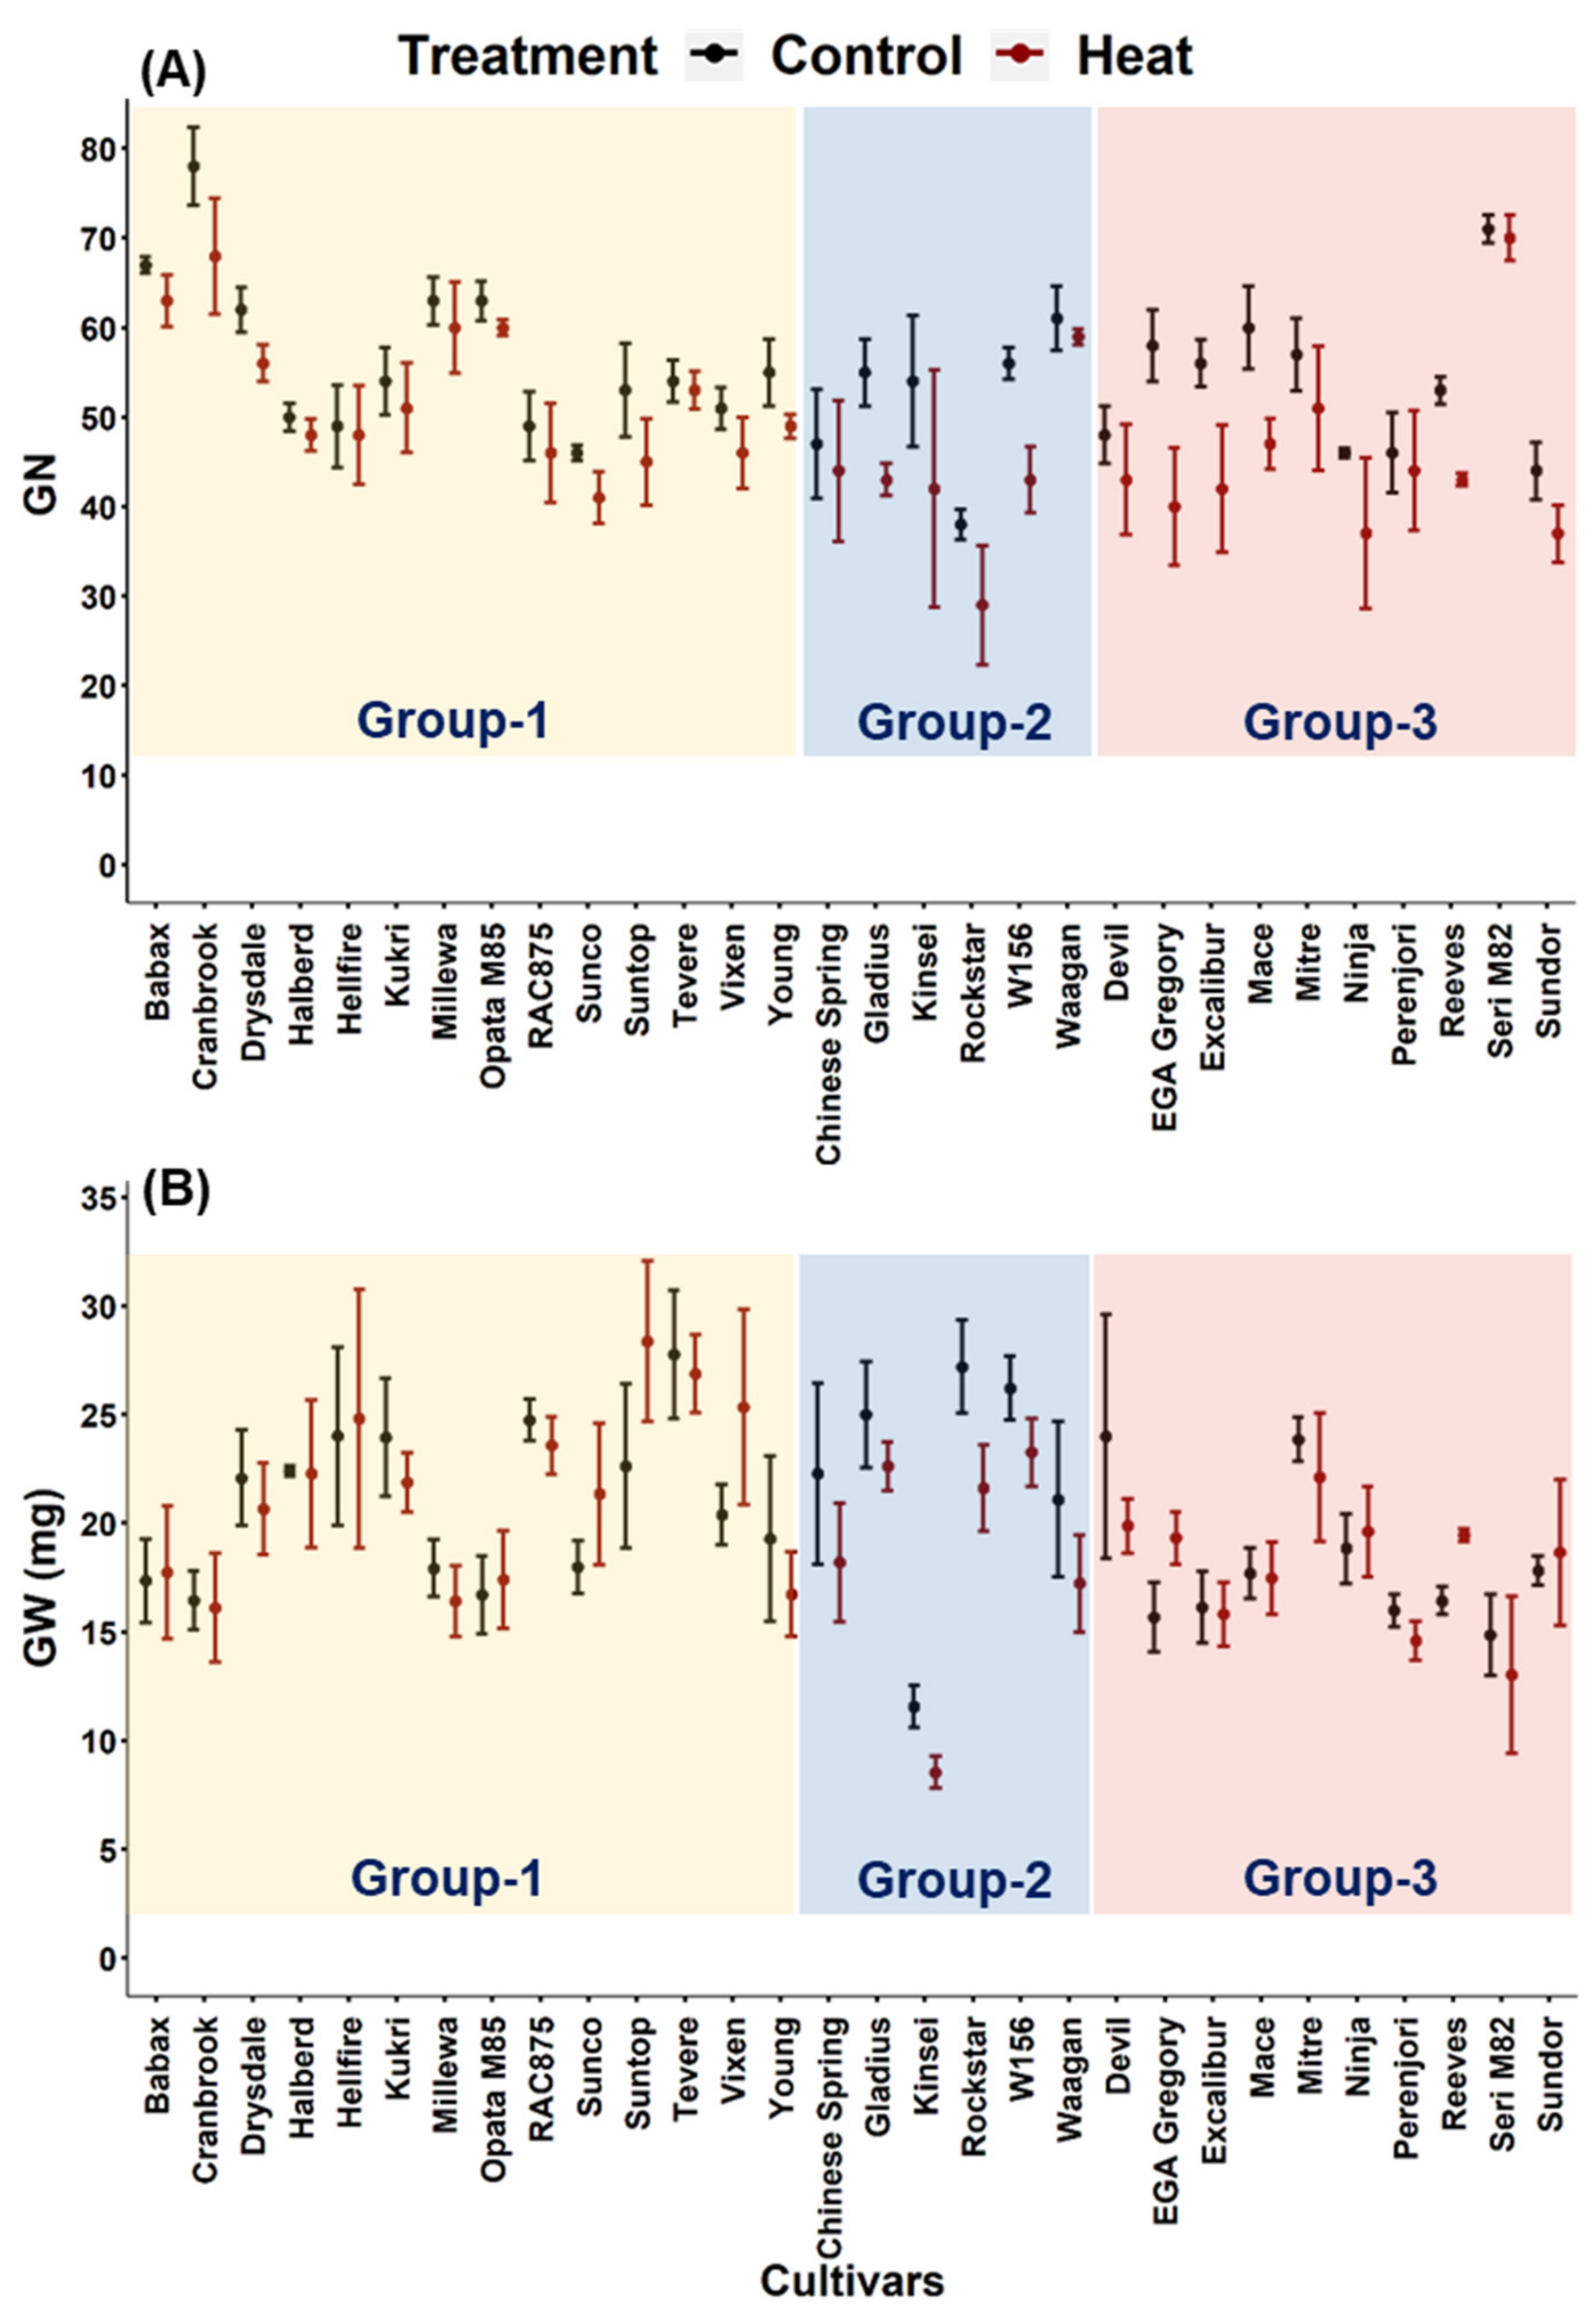
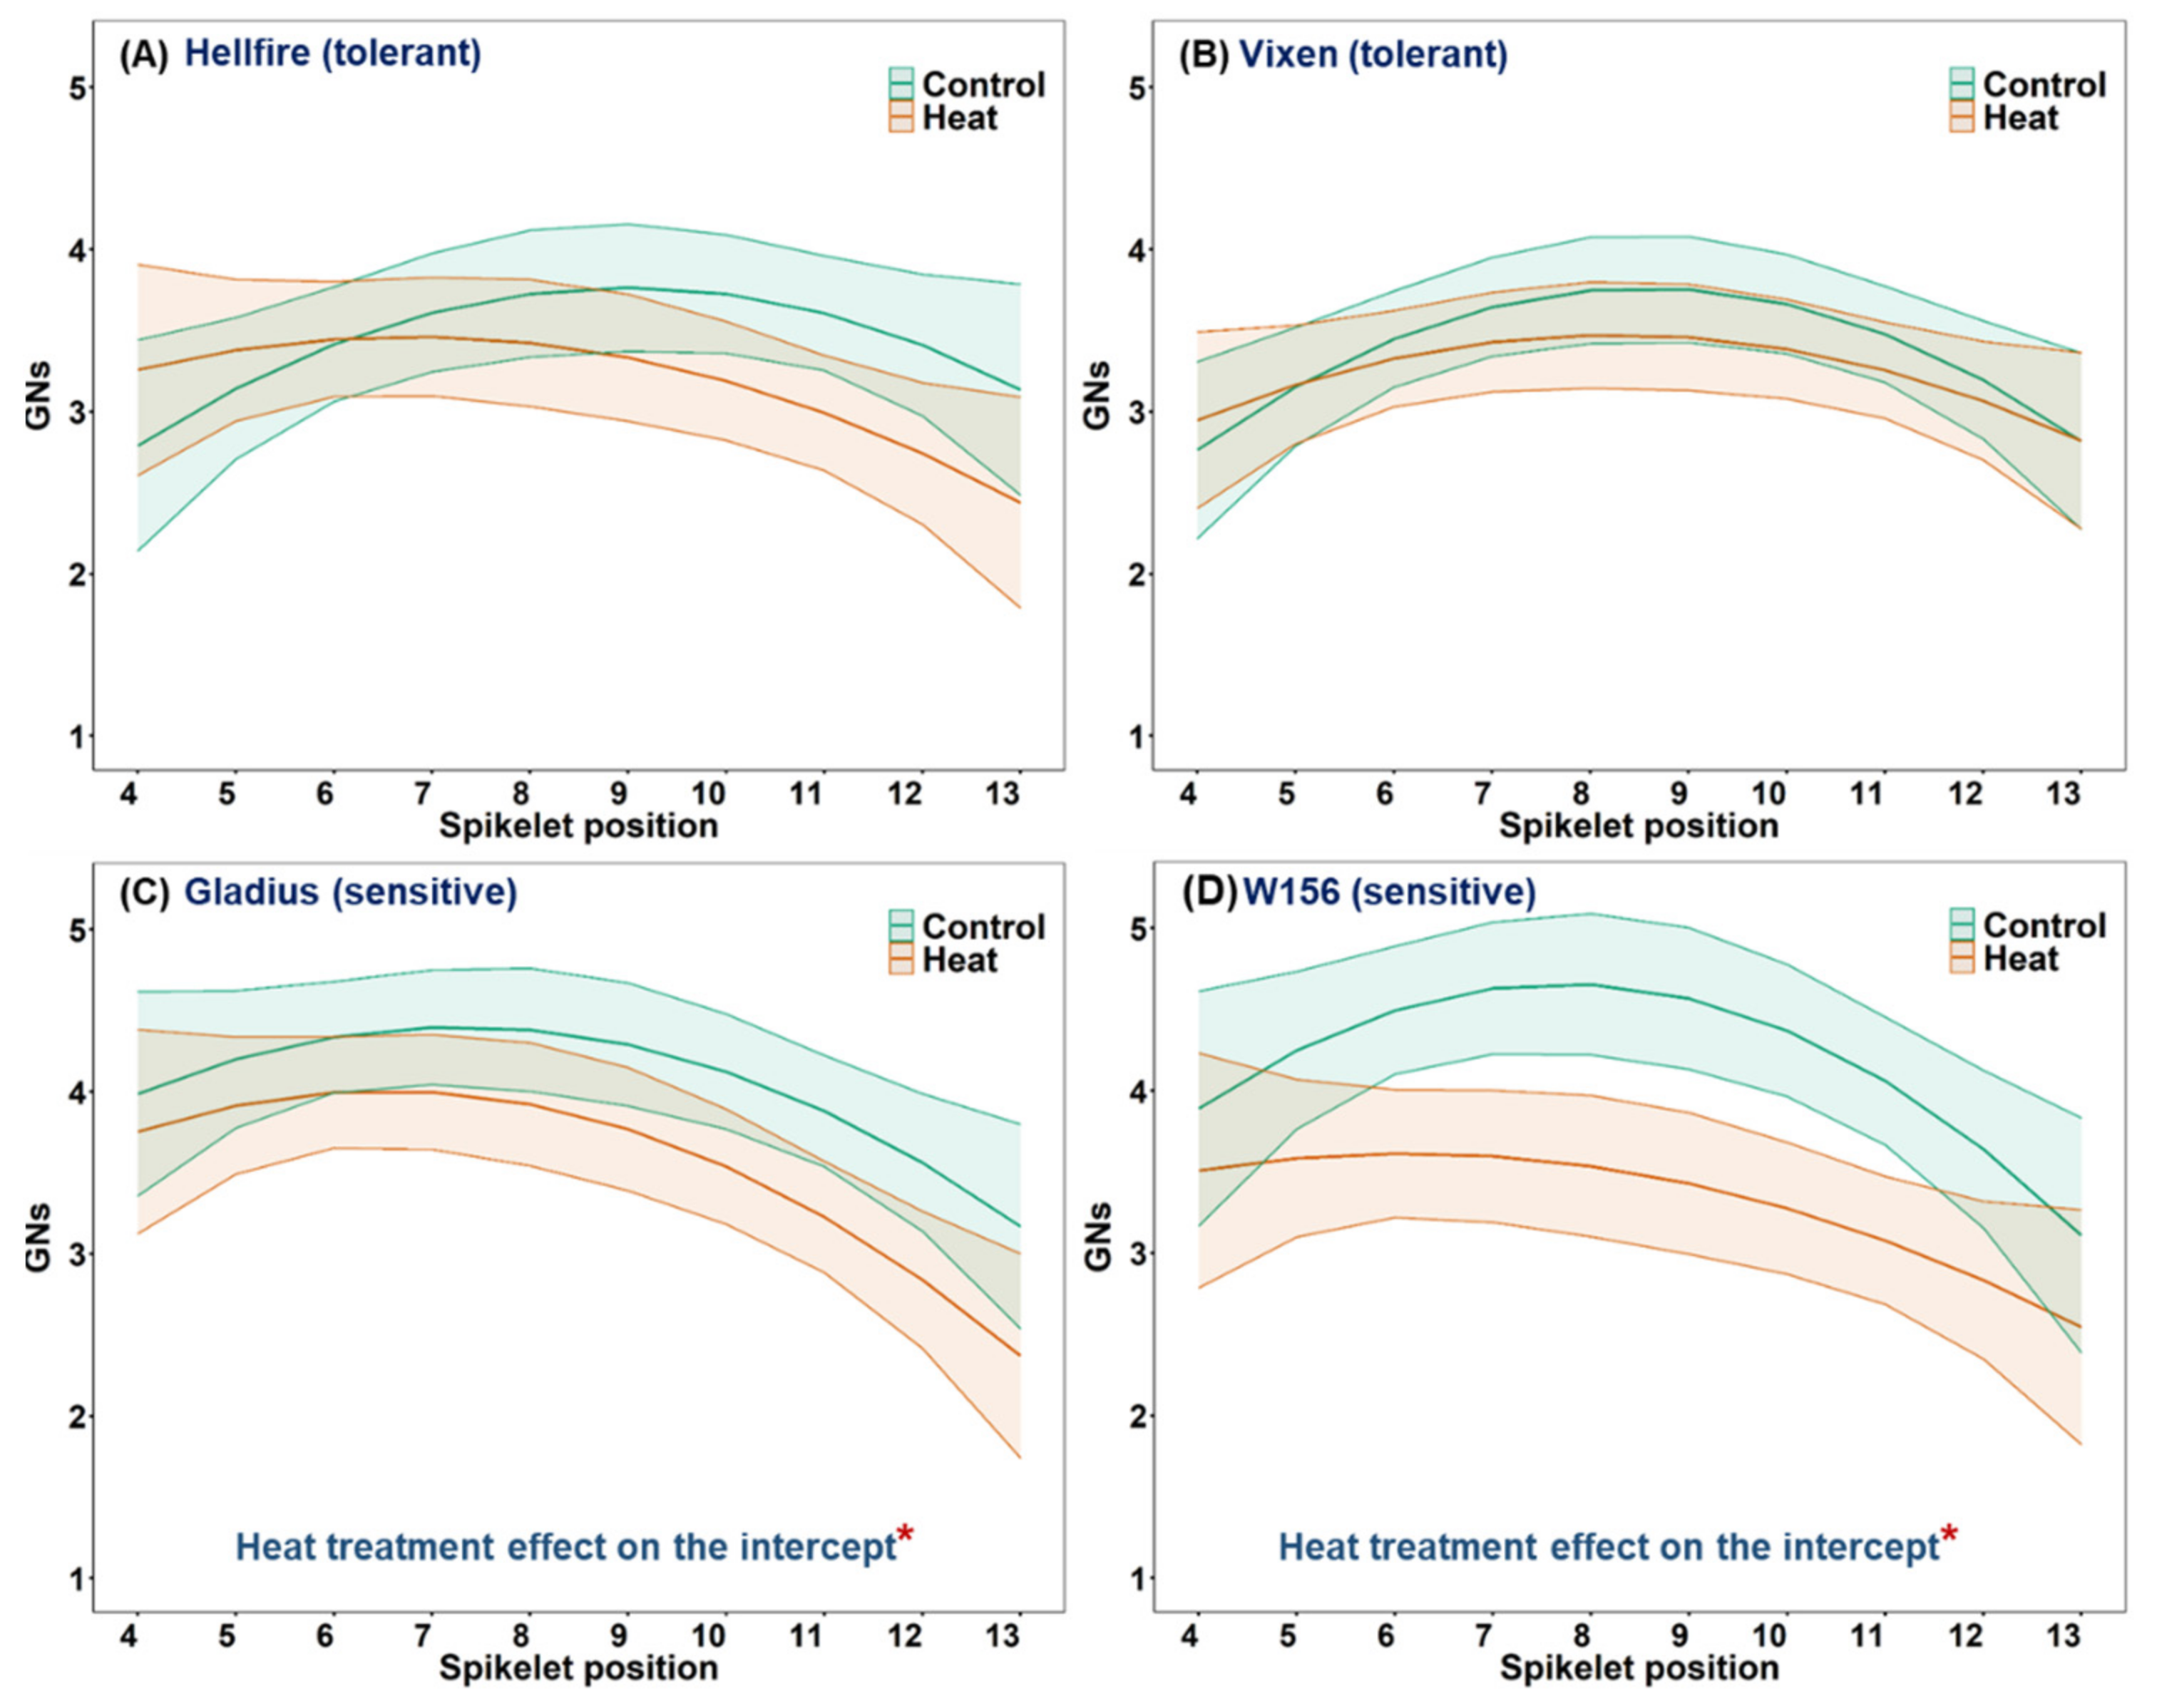
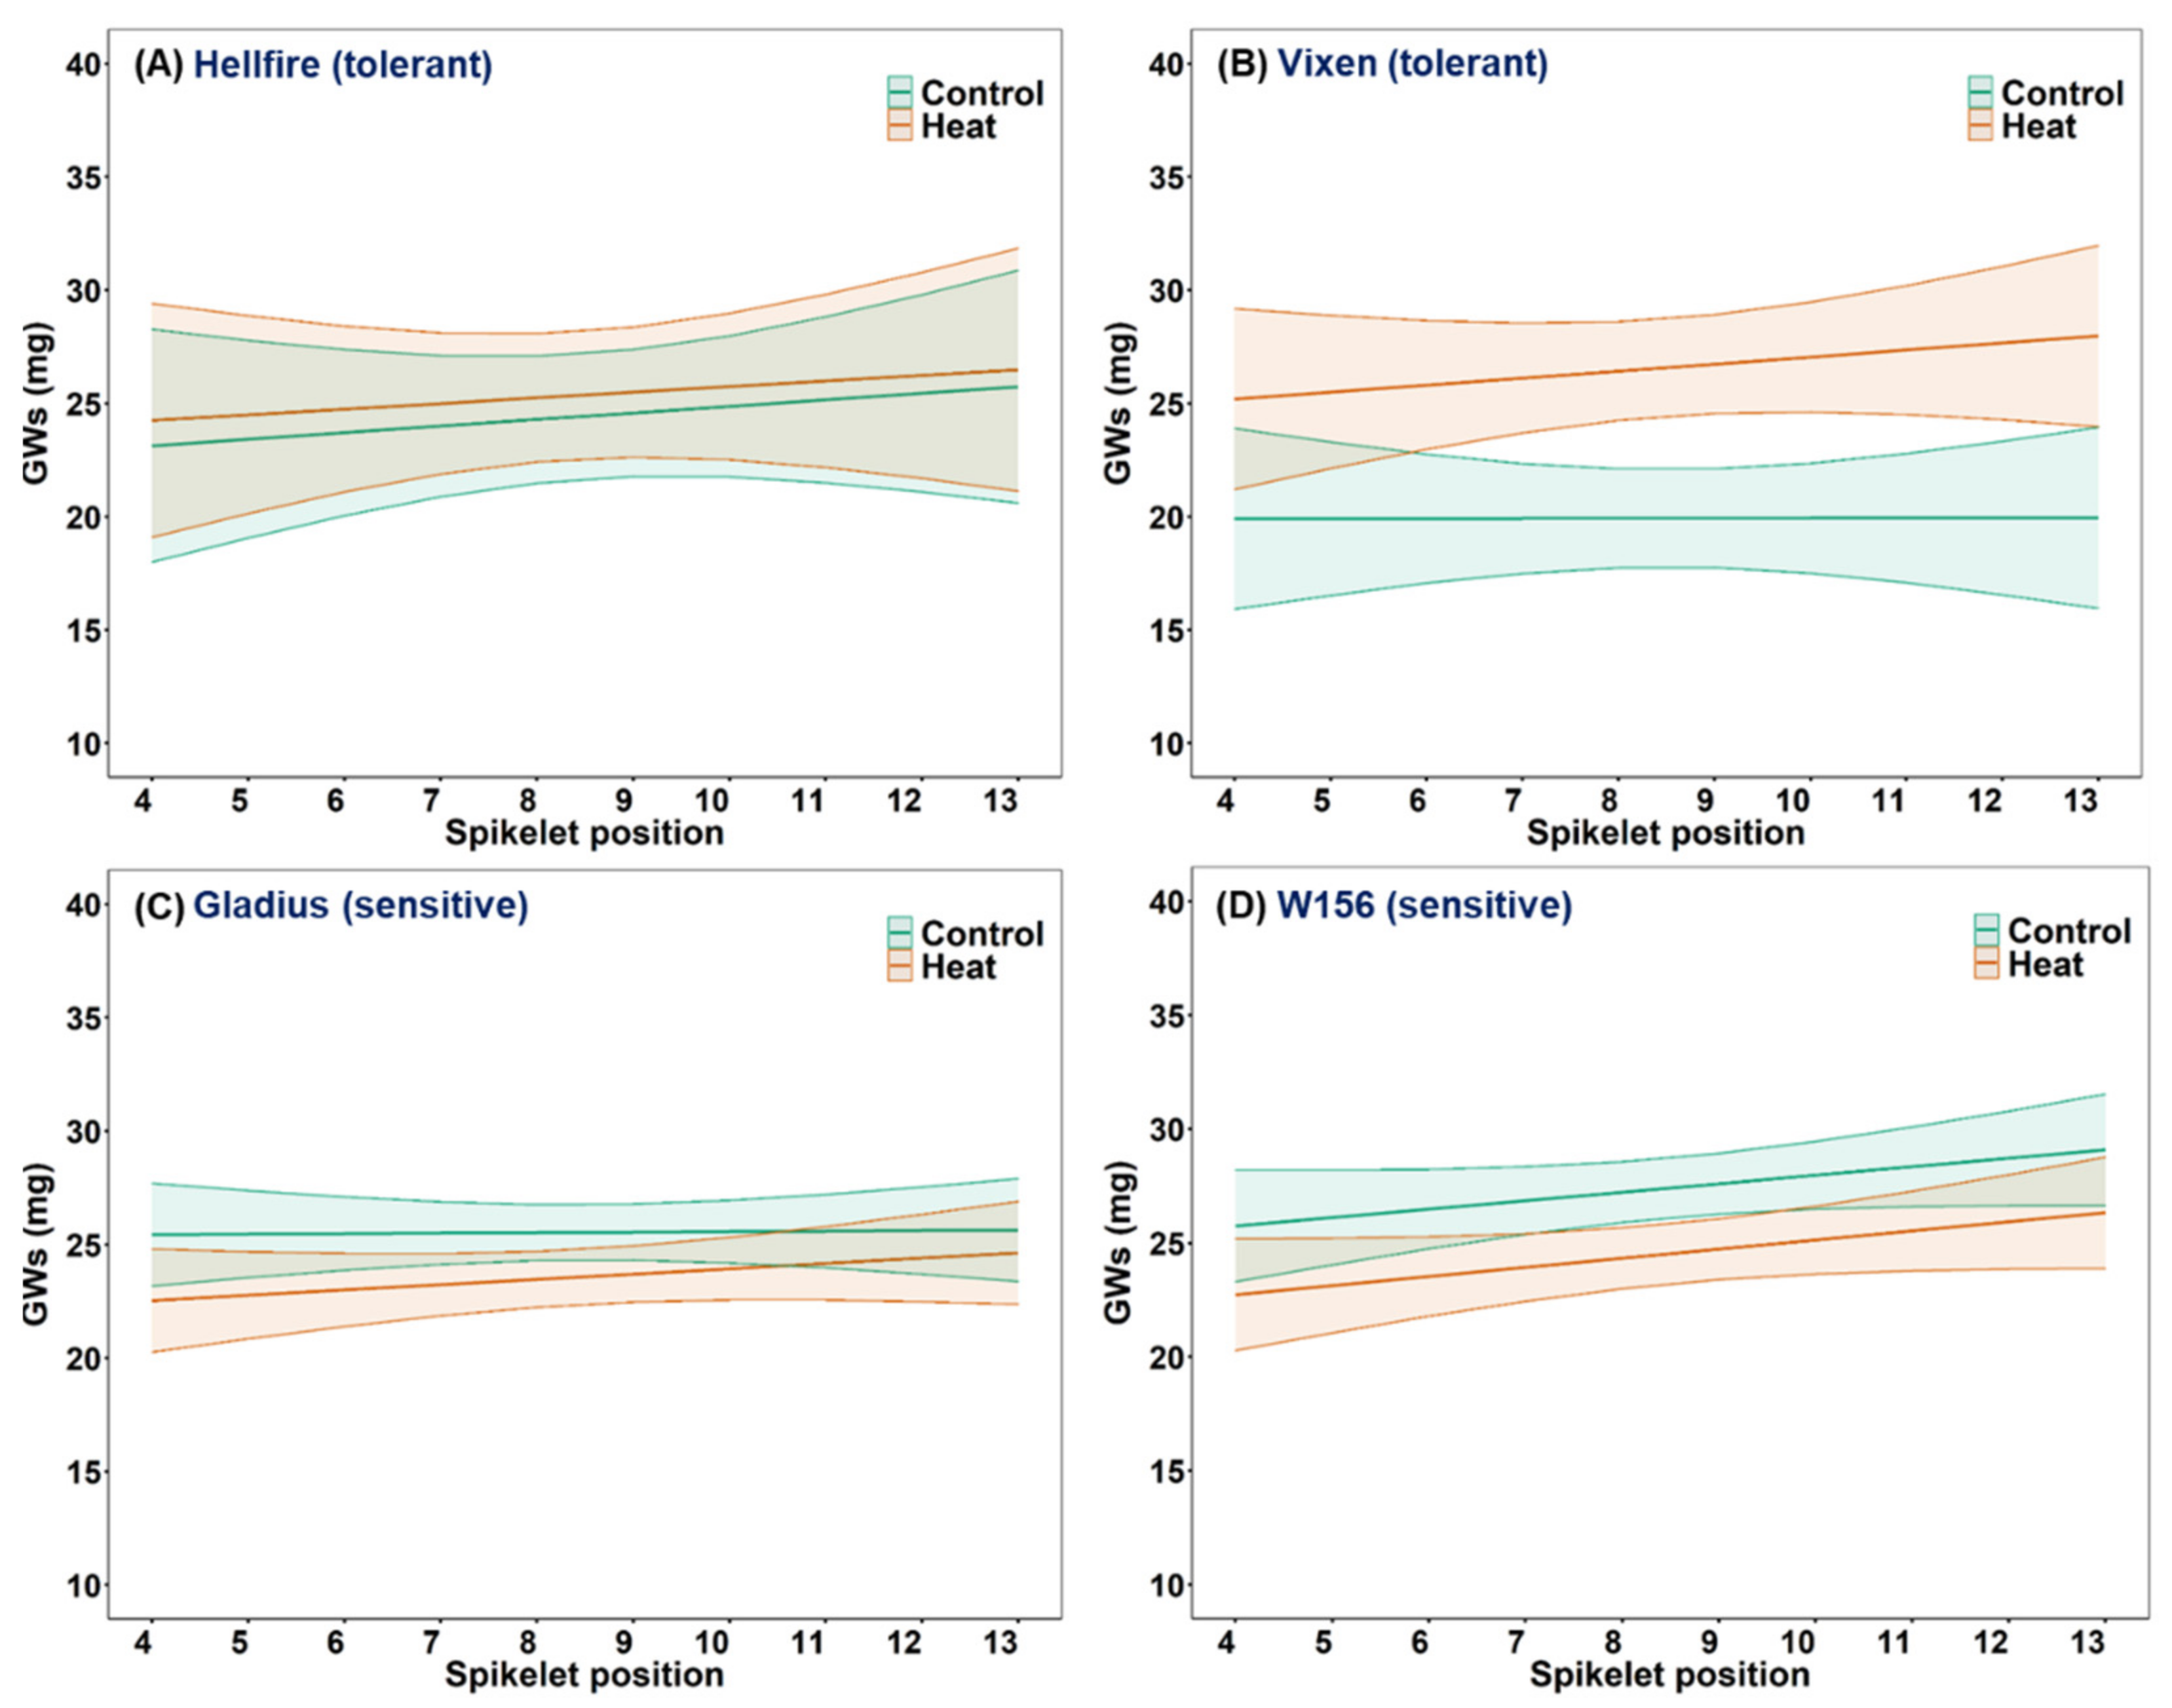
3.5. Effect of Heat Stress on Grain Number and Average Individual Grain Weight at Different Spikelet Positions on the Main Stem Spike

Four varieties with similar DTA (Supplementary Table S1) were chosen for regression analysis of GNs and GWs: two from heat-tolerant Group 1 (Hellfire and Vixen) and two from heat-sensitive Group 2 (Gladius and W156).
The quadratic model provided a better fit than the linear model for the regression of GNs against spikelet position (Figure 5) with significant quadratic terms for all four cultivars (Supplementary Table S5). GNs on spikelets 4 to 13 followed an inverse quadratic curve, peaking in the center of the spike. The two heat-sensitive cultivars, Gladius (Figure 5C) and W156 (Figure 5D), had fewer GNs following heat stress than the two heat-tolerant cultivars, Hellfire (Figure 5A) and Vixen (Figure 5B), as shown by the significantly negative treatment effect on intercept (Supplementary Table S5). However, the treatment effect on slope was not significant for any cultivar (Supplementary Table S5).
The linear model provided the best fit for the regression of GWs against spikelet position (Figure 6), with no significant slope or treatment effects and no treatment effect on the slope for any cultivar (Supplementary Table S5). It was not possible to separate the regression lines in the high temperature and control treatments; however there was a non-significant increase in GWs in Vixen in the high temperature treatment relative to the control (Figure 6B). Therefore, GWs could not be used to separate heat-tolerant cultivars Hellfire and Vixen from heat-sensitive cultivars Gladius and W156 (Figure 6).

4. Discussion

A diverse set of 30 spring wheat cultivars significantly varied in their reaction to transient daily heat stress for 5 d during meiosis in the main stem spike. The plants were moved into the heat treatment on the day when AD reached 1 cm (DTAD) when meiosis began in the main stem spike (Figure 1). DTAD occurred on average 16 d before anthesis (Supplementary Table S1). The high temperature treatment in this study included 4 h of maximum temperature 32 °C day and 16 °C night, which is moderate heat stress compared to previous studies at 35 °C or above [34,38,39]. This is the first report of heat tolerance and sensitivity in a diverse group of spring wheat cultivars when moderate heat stress was applied during meiosis on the main stem spike.
There were lasting impacts of 5 d moderate heat stress during meiosis on heat-sensitive cultivars, which lost biomass (BM) and seed-bearing tillers (ENT), and produced less grain yield on the main stem spike (GY) and total plant grain yield (TGY), compared to heat-tolerant cultivars which maintained BM, ENT, GY and TGY. The plants were never deficient in water or nutrients throughout their entire growth cycle, therefore, the effect of heat stress was not confounded with other stresses such as drought or nutritional stress.
Based on their reaction to this single heat stress event during meiosis on the main stem, the 30 wheat cultivars were classified as tolerant (Group 1) or sensitive (Groups 2 and 3) to heat stress (Figure 3 and Figure 4; Table 2). The distinguishing feature of heat-tolerant Group 1 was the maintenance of GY, GW and GN on the main stem spike, and TGY and BM on the whole plant following 5 d of moderate heat stress beginning when AD reached 1 cm.
Our results are consistent with other studies on the impact of heat stress which reduced GN, GW and GY in wheat and rice [24,38,39,43,54]. BM was higher in heat-tolerant than heat-sensitive wheat cultivars under heat stress and was attributed to better assimilation and translocation of photosynthetic reserves, and improved evaporative cooling in heat-tolerant genotypes [55]. Further, enhanced tillering under heat stress in tolerant cultivars provides additional resources for assimilate production, contributing to higher GW in the main stem spike [56].
During heat stress, flag leaf temperature depression (FLTD) significantly increased and quantum yield of photosynthesis (Fv/Fm) significantly decreased, consistent with previous results for these traits [57,58,59]. In our study, flag leaf chlorophyll content (SPAD) was not affected by heat stress on average across all cultivars, and this contrasts with a previous study where a maximum temperature of 37 °C during early grain filling significantly reduced chlorophyll content in wheat [52]. We also observed that heat-sensitive cultivars, which showed elevated chlorophyll content (SPAD units) in the flag leaf in the high temperature treatment relative to the control after 1 and 3 d of heat stress, produced fewer ENT and lower BM and TGY than heat-tolerant cultivars. Transient changes in flag leaf chlorophyll content (SPAD units) during the first few days of high temperature treatment at meiosis are potentially the result of short-term heat adaptation responses in photosystem II which can occur within minutes of exposure to heat stress [60]. More work is required to resolve the mechanism by which short-term responses in chlorophyll content to heat stress may be associated with heat sensitivity in terms of subsequent ENT, BM and TGY. However, SPAD measurements of the flag leaf chlorophyll content during the first few days of heat stress at meiosis may be a useful physiological marker of subsequent heat stress tolerance and sensitivity, and the veracity of this association can be tested in populations segregating for these traits based on the results of our research.
Although we have limited data for leaf stomatal conductance, cultivars with lower stomatal conductance under heat stress (Kukri and Mitre) also produced more chlorophyll and had low ability to cool the flag leaf under heat stress (negative values of “% reduction FLTD”). This is an interesting area for future research into mechanisms of heat stress tolerance during meiosis in the main stem of wheat, as meiosis takes place in the developing inflorescence in the stem, enclosed in the leaf sheath of the emerging flag leaf. Cooler canopies during the reproductive phase may contribute to better grain set and development in crops [50].
PV was slightly reduced under heat stress, and the inverse correlation of PV with FLTD reveals that better cooling ability is associated with higher pollen viability. This corroborates with the findings of Reddy et al. [61] in cotton under drought and heat stress.
Only slight differences in Fv/Fm were observed in control vs. heat treatment (maximum 32 °C) in our study (Table 2), but higher temperatures during heat stress (>38 °C) may result in better separation of cultivars for Fv/Fm [58]. Fv/Fm varied only slightly among Groups 1, 2 and 3 during the five-day heat stress treatment in our study. Our results contrast with field studies of Bhusal et al. [62], when heat stress occurred 7 d post-anthesis (all tillers nearly fully developed), whereas heat stress occurred much earlier during meiosis on the main stem in our study. Cultivars in heat-tolerant Group 1 and heat-sensitive Group 3 (which both maintained GW in the main stem spike) had relatively higher reduction in FV/FM_1D. These cultivars may have been able to assimilate and supply photosynthates to the sink (grains developing in the main stem spike), and hence maintain GW under heat stress. However, photosynthetic performance varies widely across cultivars [63].
Reports vary on the physiological response of wheat to heat stress. Some suggest that yield components under heat stress may be predicted by physiological traits [58,59,64,65], whereas Balla et al. [39] found that physiological traits were relatively poor indicators for heat stress response. These discrepancies may be attributed to the different genotypes used and the timing (stage, intensity and duration) of heat treatment, or because these physiological traits have higher temperature (sensitivity) thresholds at meiosis relative to GY and BM [39,50]. Based on our results, it would be worthwhile to investigate further a potential mechanism for heat tolerance in wheat at meiosis based on the ability of heat-tolerant cultivars to maintain (not increase) chlorophyll content and photosynthetic activity in the flag leaf during moderate heat stress, and to cool the flag leaf more efficiently than heat-sensitive cultivars.
Many of the cultivars in this study were evaluated previously at the seedling, anthesis or post-anthesis stages for heat tolerance, and four recently released cultivars have not been previously tested (Supplementary Table S1). Twelve cultivars which we report as heat-tolerant at meiosis in Group 1 (Young, Babax, Cranbrook, Drysdale, Halberd, Millewa, Opata M85, RAC875, SeriM82, Sunco, Suntop and Vixen) were previously reported as tolerant to heat stress at seedling, anthesis and/or post-anthesis stages (Figure 4, Supplementary Table S1). However, nine cultivars which were previously reported as tolerant to heat stress at seedling, anthesis and/or post-anthesis stages were sensitive to heat stress at meiosis in Groups 2 and 3 (EGA Gregory, Excalibur, Gladius, Mace, Mitre, Perenjori, Tevere, W156 and Waagan) (Figure 4, Supplementary Table S1). Kukri was reported as sensitive to heat stress at post-anthesis stage [66] but appears tolerant at meiosis (Figure 4, Supplementary Table S1). Different tolerance mechanisms may be involved at different developmental stages in these cultivars, and each study varies in heat treatment duration, intensity (maximum and minimum daily temperatures) and developmental stage [67]. This is the first report of heat tolerance in cultivar Hellfire (Group 1) (Supplementary Table S1). Two cultivars (Suntop and Vixen) had a compensatory effect of reducing GN and increasing GW in the moderate temperature treatment relative to the control, also reported by Balla et al. [39] in winter wheat cultivars, but this contradicts Saini and Aspinall [24] for cultivar Gabo. Genotype-specific behavior could explain these differences.
Omidi et al. [42] reported that heat stress affected meiosis in pollen mother cells, resulting in meiotic abnormalities and decreased PV, which they claimed reduced GN. However, in our study with moderate heat stress at meiosis, PV did not decline much under heat stress and PV was not associated with GN reduction (Figure 4). Heat-sensitive cultivars had a significant reduction in GN despite high PV. It is likely that the limiting step in producing grains following moderate heat stress at meiosis is not pollen viability but ovule viability and/or the formation of viable embryos at or after fertilization. Stigma functionality (morphology and anatomy of pistils) and fertility are affected by heat stress immediately after meiosis in pollen mother cells [68]. Additionally, heat stress at meiosis causes abnormal or degenerated embryo sacs [43].
The PCA-based clustering showed that GN, GY, BM and GW were the key contributing traits to the first two PC axes (Figure 4). The GN reduction was related partly to GY reduction. GY and GW were closely correlated, but GW was unrelated to GN. GN is the main outcome of meiosis, pollination and fertilization, whereas GW results from the assimilation of reserves from the source (photosynthetic reserves). PCA-based clustering helped to differentiate heat-tolerant cultivars in Group 1, which experienced the lowest reductions for most traits under heat treatment, from heat-sensitive cultivars in Group 2 (reduced GN, GY and GW) and Group 3 (reduced GN and GY but not GW). The differential expression/response of the cultivars to heat stress may be due to differences in their genetic makeup. The inability to assimilate photosynthetic products could be due to a loss in sink capacity (less or poor seed set) in sensitive cultivars [69].
In contrast to the findings of Erena [70], we did not find differential sensitivities to heat stress in the central (middle) part of the spike and distal parts, and our results support an equal reduction in GNs across spikelet positions in heat-sensitive cultivars. However, Erena [70] used a 37 °C heat treatment for 3 d. Saini and Aspinall [24] also observed an equal reduction in GN in all parts of the spike in cultivar Gabo exposed to 30 °C heat stress for 3 d during meiosis. Hence, it can be inferred that heat-tolerant cultivars regulated source-sink relations to produce a similar GN, GW and TGY in the high temperature as in the control treatment following 5 d of transient moderate heat stress during meiosis, whereas heat-sensitive cultivars are not able to recover from heat stress at meiosis and experience a loss in GN, GW, BM and TGY.
The four cultivars described in Figure 5 and Figure 6 do not show a reduction in grain weight per spikelet (GWs) following heat stress, so GWs was not useful to distinguish heat-tolerant from heat-sensitive cultivars in that case. However, that is not a general conclusion, because PCA and cluster analysis of the larger group of 30 cultivars showed that reduction in grain weight averaged across the entire main stem spike (GW) was a key contributing trait to the second axis in PCA (Figure 4, Supplementary Table S3). The fact that GWs did not significantly decrease in sensitive cultivars under heat stress is consistent with the findings of Saini and Aspinall [24] and Balla et al. [71], who reported no significant reductions in individual grain weight in the main spike following heat stress at meiosis. However, considering the higher contribution of middle spikelets to GY [44,72,73], more emphasis should be paid to selecting enhanced GNs and GWs in the central spikelets. Selection for GNs and GWs in central spikelets should enhance GN and GW across the whole spike, based on our results which suggest a constant slope but reduction in intercept for GN under heat stress in heat-sensitive cultivars.

5. Conclusions

This study demonstrated that a diverse set of wheat cultivars varied in tolerance to moderate heat stress at meiosis in the main stem spike. Cultivars that were heat sensitive at meiosis suffered prolonged negative effects of the heat stress event and failed to maintain grain yield and biomass, whereas heat-tolerant cultivars maintained grain number and individual grain weight in the main stem spike, total plant grain yield and mature plant biomass in the high temperature relative to the control treatment. The reduction in seed set in heat-sensitive cultivars was not due to loss in pollen viability, although pollen viability was reduced by a small but significant amount by heat stress during meiosis. Heat-sensitive cultivars responded by producing higher chlorophyll concentration in the flag leaf during the first few days of heat stress than heat-tolerant cultivars, therefore flag leaf SPAD measurements during the first few days of heat stress at meiosis may act as a potential physiological marker of subsequent heat stress sensitivity and tolerance. We confirmed that meiosis in the main stem spike is a critical period for heat sensitivity and tolerance in wheat, and more research is necessary to determine if heat stress tolerance at meiosis is under similar or different genetic and physiological controls than heat stress tolerance at seedling, anthesis or post-anthesis stages.

Supplementary Materials

The following supporting information can be downloaded at: https://0-www-mdpi-com.brum.beds.ac.uk/article/10.3390/agronomy12050987/s1, Figure S1: Scatterplot of traits (average percent reduction in cultivar means under heat stress relative to control) for chlorophyll content on day 1 (SPAD_1D) vs. biomass (BM), effective number of tillers (ENT) and total plant grain yield (TGY). (A) SPAD1_D vs. BM, (B) SPAD1_D vs. ENT and (C) SPAD_1D vs. TGY. Group 1 refers to tolerant cultivars, whereas Groups 2 and 3 refers to sensitive cultivars as shown in Figure 4, Table S1: Details of spring bread wheat cultivars used for heat treatment in the study (Pedigree information: Plant Breeder Rights Database (http://pericles.ipaustralia.gov.au/pbr_db/, accessed on 29 March 2022) and Genetic Resources Information System for Wheat and Triticale of CIMMYT (http://wheatpedigree.net, accessed on 29 March 2022). Days to anthesis (DTA) and days to auricle distance 1 cm (DTAD) were measured in this study. Information on ‘Tolerance and stage of growth’ was from previous publications (‘References’) and abbreviated as follows: heat-tolerant (HT) or heat-sensitive (HS) at seedling stage (S), anthesis (A) or post-anthesis (PA). Cultivars were chosen to represent a diverse set of wheat cultivars from previous heat stress studies [74,75,76,77,78,79,80,81], Table S2: Cultivar mean values for several yield-related and physiological traits. Percent reduction in traits is the relative value of the mean in the high temperature treatment (“Heat”) and the mean in the control temperature treatment (“Control”), and positive values indicate that the high temperature means are lower than the control means, Table S3: Eigenvalues for the corresponding principal components (PCs) and PC loadings for target traits (average percent reduction under heat treatment, relative to control), Table S4: Pairwise correlations for traits (average percent reduction in cultivar means under heat stress relative to control), Table S5: Regression estimates for grain number per spikelet (GNs) and average individual grain weight per spikelet (GWs) against spikelet position on the main stem spike of heat-tolerant wheat cultivars Hellfire and Vixen, and heat-sensitive cultivars Gladius and W156.

Author Contributions

Conceptualization and methodology, M.C., W.A.C., G.Y. and K.H.M.S.; Formal analysis, M.C. and W.A.C.; Investigation, M.C.; writing—original draft preparation, M.C.; writing—review and editing, W.A.C., G.Y., K.H.M.S. and M.C.; visualization, M.C.; supervision, W.A.C., G.Y. and K.H.M.S.; project administration, M.C. and W.A.C.; funding acquisition, W.A.C. and K.H.M.S. All authors have read and agreed to the published version of the manuscript.

Funding

This study was supported partly by the Australian Government Research Training Program scholarships and operating funds from the UWA School of Agriculture and Environment and the UWA Institute of Agriculture.

Institutional Review Board Statement

Not applicable.

Informed Consent Statement

Not applicable.

Data Availability Statement

Data are contained within the article and Supplementary Materials.

Acknowledgments

The authors acknowledge Daniel Mullan (Senior Wheat Breeder, InterGrain, WA) and Sally Norton (Leader, Australian Grains Genebank, Horsham, Victoria) for providing cultivar seeds; Katia Stefanova for help with the experimental design; Robert Creasy (Manager, Plant Growth Facilities, UWA) for phytotron and CER facility set up; Sheng Chen (Research Fellow, The UWA Institute of Agriculture, UWA, Perth) for providing infrared thermometer for data recording, and Zakaria Solaiman (Senior Research Fellow, UWA school of Agriculture and Environment, Perth) for providing the microscope facility.

Conflicts of Interest

The authors declare no conflict of interest.

Abbreviations

ADauricle distance
BMabove-ground biomass
CERscontrolled environment rooms
DTAdays from sowing to anthesis
DTADdays from sowing to AD 1 cm
ENTeffective number of tillers
ETpercentage effective tillers
FLTDflag leaf temperature depression
GNgrain number (main stem spike)
GNsgrain number per spikelet (main stem spike)
GWsindividual grain weight per spikelet (main stem spike)
GYgrain yield (main stem spike)
GWindividual grain weight (main stem spike)
MSLmain stem length
PVpollen viability
SLspike length (main stem spike)
SNspikelet number (main stem spike)
TGYtotal plant grain yield
TNTtotal number of tillers

References

  1. Shiferaw, B.; Smale, M.; Braun, H.-J.; Duveiller, E.; Reynolds, M.; Muricho, G. Crops that feed the world 10. Past successes and future challenges to the role played by wheat in global food security. Food Secur. 2013, 5, 291–317. [Google Scholar] [CrossRef] [Green Version]
  2. Food and Agriculture Organization of the United Nations. FAOSTAT Database. Crops and Livestock Products. Available online: https://www.fao.org/faostat/en/#data/QCL (accessed on 19 April 2022).
  3. Fischer, R.A.; Byerlee, D.; Edmeades, G. Crop Yields and Global Food Security: Will Yield Increase Continue to Feed the World? ACIAR Monograph No. 158; Australian Centre for International Agricultural Research: Canberra, Australia, 2014; p. 634. Available online: https://www.aciar.gov.au/publication/books-and-manuals/crop-yields-and-global-food-security-will-yield-increase-continue-feed-world (accessed on 10 August 2021).
  4. Sehgal, A.; Sita, K.; Siddique, K.H.M.; Kumar, R.; Bhogireddy, S.; Varshney, R.K.; Hanumantha, R.B.; Nair, R.M.; Prasad, P.V.; Nayyar, H. Drought or/and Heat-Stress Effects on Seed Filling in Food Crops: Impacts on Functional Biochemistry, Seed Yields, and Nutritional Quality. Front. Plant Sci. 2018, 9, 1705. [Google Scholar] [CrossRef] [PubMed] [Green Version]
  5. Ray, D.K.; West, P.C.; Clark, M.; Gerber, J.S.; Prishchepov, A.V.; Chatterjee, S. Climate change has likely already affected global food production. PLoS ONE 2019, 14, e0217148. [Google Scholar] [CrossRef] [PubMed]
  6. IPCC. Summary for policymakers 2021. In Climate Change 2021: The Physical Science Basis. Contribution of Working Group I to the Sixth Assessment Report of the Intergovernmental Panel on Climate, Change; Masson-Delmotte, V., Zhai, P., Pirani, A., Connors, S.L., Péan, C., Berger, S., Caud, N., Chen, Y., Goldfarb, L., Gomis, M.I., et al., Eds.; Cambridge University Press: Cambridge, UK, 2021; Available online: https://www.ipcc.ch/report/ar6/wg1/#FullReport (accessed on 30 March 2022).
  7. Lorenz, R.; Stalhandske, Z.; Fischer, E.M. Detection of a Climate Change Signal in Extreme Heat, Heat Stress, and Cold in Europe from Observations. Geophys. Res. Lett. 2019, 46, 8363–8374. [Google Scholar] [CrossRef] [Green Version]
  8. NOAA. National Centers for Environmental Information. State of the Climate: Global Climate Report for Annual 2020. 2021. Available online: https://www.ncdc.noaa.gov/sotc/global/202013 (accessed on 12 September 2021).
  9. Australian Bureau of Agricultural and Resource Economics and Sciences. Agricultural Commodities: September Quarter 2021; Australian Bureau of Agricultural and Resource Economics and Sciences: Canberra, Australia, 2021. [Google Scholar] [CrossRef]
  10. Hochman, Z.; Gobbett, D.; Horan, H. Climate trends account for stalled wheat yields in Australia since 1990. Glob. Chang. Biol. 2017, 23, 2071–2081. [Google Scholar] [CrossRef]
  11. Warrington, I.; Dunstone, R.; Green, L. Temperature effects at three development stages on the yield of the wheat ear. Aust. J. Agric. Res. 1977, 28, 11–27. [Google Scholar] [CrossRef]
  12. Porter, J.R.; Gawith, M. Temperatures and the growth and development of wheat: A review. Eur. J. Agron. 1999, 10, 23–36. [Google Scholar] [CrossRef]
  13. Wang, E.; Martre, P.; Zhao, Z.; Ewert, F.; Maiorano, A.; Rötter, R.; Kimball, B.A.; Ottman, M.J.; Wall, G.W.; White, J.W.; et al. The uncertainty of crop yield projections is reduced by improved temperature response functions. Nat. Plants 2017, 3, 17102. [Google Scholar] [CrossRef] [Green Version]
  14. Deryng, D.; Conway, D.; Ramankutty, N.; Price, J.; Warren, R. Global crop yield response to extreme heat stress under multiple climate change futures. Environ. Res. Lett. 2014, 9, 034011. [Google Scholar] [CrossRef] [Green Version]
  15. Demirevska-Kepova, K.; Holzer, R.; Simova-Stoilova, L.; Feller, U. Heat stress effects on ribulose-1,5-bisphosphate carboxylase/oxygenase, Rubisco binding protein and Rubisco activase in wheat leaves. Biol. Plant. 2005, 49, 521–525. [Google Scholar] [CrossRef]
  16. Kadam, N.N.; Xiao, G.; Melgar, R.J.; Bahuguna, R.N.; Quinones, C.; Tamilselvan, A.; Prasad, P.V.; Jagadish, K.S. Agronomic and Physiological Responses to High Temperature, Drought, and Elevated CO2 Interactions in Cereals. Adv. Agron. 2014, 127, 111–156. [Google Scholar] [CrossRef]
  17. Ullah, A.; Nadeem, F.; Nawaz, A.; Siddique, K.H.M.; Farooq, M. Heat stress effects on the reproductive physiology and yield of wheat. J. Agron. Crop Sci. 2021, 208, 1–17. [Google Scholar] [CrossRef]
  18. Mishra, D.; Shekhar, S.; Chakraborty, S.; Chakraborty, N. High temperature stress responses and wheat: Impacts and alleviation strategies. Environ. Exp. Bot. 2021, 190, 104589. [Google Scholar] [CrossRef]
  19. Farooq, M.; Bramley, H.; Palta, J.A.; Siddique, K.H.M. Heat Stress in Wheat during Reproductive and Grain-Filling Phases. Crit. Rev. Plant Sci. 2011, 30, 491–507. [Google Scholar] [CrossRef]
  20. Grant, R.F.; Kimball, B.A.; Conley, M.M.; White, J.W.; Wall, G.W.; Ottman, M.J. Controlled Warming Effects on Wheat Growth and Yield: Field Measurements and Modeling. Agron. J. 2011, 103, 1742–1754. [Google Scholar] [CrossRef]
  21. Jagadish, S.V.K.; Pal, M.; Sukumaran, S.; Parani, M.; Siddique, K.H.M. Heat stress resilient crops for future hotter environments. Plant Physiol. Rep. 2020, 25, 529–532. [Google Scholar] [CrossRef]
  22. Zahra, N.; Wahid, A.; Hafeez, M.B.; Ullah, A.; Siddique, K.H.; Farooq, M. Grain development in wheat under combined heat and drought stress: Plant responses and management. Environ. Exp. Bot. 2021, 188, 104517. [Google Scholar] [CrossRef]
  23. Viswanathan, C.; Khanna-Chopra, R. Effect of Heat Stress on Grain Growth, Starch Synthesis and Protein Synthesis in Grains of Wheat (Triticum aestivum L.) Varieties Differing in Grain Weight Stability. J. Agron. Crop Sci. 2001, 186, 1–7. [Google Scholar] [CrossRef]
  24. Saini, H.S.; Aspinall, D. Abnormal Sporogenesis in Wheat (Triticum aestivum L.) Induced by Short Periods of High Temperature. Ann. Bot. 1982, 49, 835–846. [Google Scholar] [CrossRef]
  25. Porter, J.R.; Semenov, M. Crop responses to climatic variation. Philos. Trans. R. Soc. B Biol. Sci. 2005, 360, 2021–2035. [Google Scholar] [CrossRef]
  26. Zinn, K.E.; Tunc-Ozdemir, M.; Harper, J.F. Temperature stress and plant sexual reproduction: Uncovering the weakest links. J. Exp. Bot. 2010, 61, 1959–1968. [Google Scholar] [CrossRef] [PubMed] [Green Version]
  27. Dolferus, R.; Ji, X.; Richards, R.A. Abiotic stress and control of grain number in cereals. Plant Sci. 2011, 181, 331–341. [Google Scholar] [CrossRef]
  28. Semenov, M.; Stratonovitch, P.; Alghabari, F.; Gooding, M. Adapting wheat in Europe for climate change. J. Cereal Sci. 2014, 59, 245–256. [Google Scholar] [CrossRef] [PubMed] [Green Version]
  29. Rezaei, E.E.; Webber, H.; Gaiser, T.; Naab, J.; Ewert, F. Heat stress in cereals: Mechanisms and modelling. Eur. J. Agron. 2015, 64, 98–113. [Google Scholar] [CrossRef]
  30. Bennett, M.D.; Chapman, V.; Riley, R. The duration of meiosis in pollen mother cells of wheat, rye and Triticale. Proc. R. Soc. London. Ser. B Biol. Sci. 1971, 178, 259–275. [Google Scholar] [CrossRef]
  31. Bennett, M.D.; Finch, R.A.; Smith, J.B.; Rao, M.K. The time and duration of female meiosis in wheat, rye and barley. Proc. R. Soc. London. Ser. B Biol. Sci. 1973, 183, 301–319. [Google Scholar] [CrossRef]
  32. Bennett, M.D.; Rao, M.K.; Smith, J.B.; Bayliss, M.W. Cell development in the anther, the ovule, and the young seed of Triticum aestivum L. var. Chinese Spring. Philos. Trans. R. Soc. B Biol. Sci. 1973, 266, 39–81. [Google Scholar] [CrossRef]
  33. Wardlaw, I.; Dawson, I.; Munibi, P. The tolerance of wheat to hight temperatures during reproductive growth. 2. Grain development. Aust. J. Agric. Res. 1989, 40, 15–24. [Google Scholar] [CrossRef]
  34. Prasad, P.V.; Pisipati, S.R.; Ristic, Z.; Bukovnik, U.; Fritz, A.K. Impact of Nighttime Temperature on Physiology and Growth of Spring Wheat. Crop Sci. 2008, 48, 2372–2380. [Google Scholar] [CrossRef]
  35. Talukder, A.; McDonald, G.K.; Gill, G.S. Effect of short-term heat stress prior to flowering and early grain set on the grain yield of wheat. Field Crops Res. 2014, 160, 54–63. [Google Scholar] [CrossRef]
  36. Kaur, V.; Behl, R. Grain yield in wheat as affected by short periods of high temperature, drought and their interaction during pre- and post-anthesis stages. Cereal Res. Commun. 2010, 38, 514–520. [Google Scholar] [CrossRef]
  37. Wheeler, T.R.; Batts, G.R.; Ellis, R.H.; Hadley, P.; Morison, J.I.L. Growth and yield of winter wheat (Triticum aestivum) crops in response to CO2and temperature. J. Agric. Sci. 1996, 127, 37–48. [Google Scholar] [CrossRef]
  38. Draeger, T.; Moore, G. Short periods of high temperature during meiosis prevent normal meiotic progression and reduce grain number in hexaploid wheat (Triticum aestivum L.). Theor. Appl. Genet. 2017, 130, 1785–1800. [Google Scholar] [CrossRef] [Green Version]
  39. Balla, K.; Karsai, I.; Bónis, P.; Kiss, T.; Berki, Z.; Horváth, Á.; Mayer, M.; Bencze, S.; Veisz, O. Heat stress responses in a large set of winter wheat cultivars (Triticum aestivum L.) depend on the timing and duration of stress. PLoS ONE 2019, 14, e0222639. [Google Scholar] [CrossRef] [PubMed]
  40. Dowrick, G.J. The influence of temperature on meiosis. Heredity 1957, 11, 37–49. [Google Scholar] [CrossRef]
  41. Rezaei, M.; Arzani, A.; Sayed-Tabatabaei, B.E. Meiotic behaviour of tetraploid wheats (Triticum turgidum L.) and their synthetic hexaploid wheat derivates influenced by meiotic restitution and heat stress. J. Genet. 2010, 89, 401–407. [Google Scholar] [CrossRef]
  42. Omidi, M.; Siahpoosh, M.R.; Mamghani, R.; Modarresi, M. The Influence of Terminal Heat Stress on Meiosis Abnormalities in Pollen Mother Cells of Wheat. CYTOLOGIA 2014, 79, 49–58. [Google Scholar] [CrossRef] [Green Version]
  43. Saini, H.; Sedgley, M.; Aspinall, D. Effect of Heat Stress During Floral Development on Pollen Tube Growth and Ovary Anatomy in Wheat (Triticum aestivum L.). Funct. Plant Biol. 1983, 10, 137–144. [Google Scholar] [CrossRef]
  44. Loss, S.; Kirby, E.; Siddique, K.; Perry, M. Grain growth and development of old and modern Australian wheats. Field Crops Res. 1989, 21, 131–146. [Google Scholar] [CrossRef]
  45. Ji, X.; Shiran, B.; Wan, J.; Lewis, D.C.; Jenkins, C.; Condon, A.; Richards, R.A.; Dolferus, R. Importance of pre-anthesis anther sink strength for maintenance of grain number during reproductive stage water stress in wheat. Plant Cell Environ. 2010, 33, 926–942. [Google Scholar] [CrossRef]
  46. Barton, D.A.; Cantrill, L.C.; Law, A.M.K.; Phillips, C.G.; Sutton, B.G.; Overall, R.L. Chilling to zero degrees disrupts pollen formation but not meiotic microtubule arrays in Triticum aestivum L. Plant Cell Environ. 2014, 37, 2781–2794. [Google Scholar] [CrossRef] [PubMed]
  47. Onyemaobi, I.; Liu, H.; Siddique, K.H.M.; Yan, G. Both Male and Female Malfunction Contributes to Yield Reduction under Water Stress during Meiosis in Bread Wheat. Front. Plant Sci. 2017, 7, 2071. [Google Scholar] [CrossRef] [PubMed] [Green Version]
  48. Morgan, J.M. Possible role of abscisic acid in reducing seed set in water-stressed wheat plants. Nature 1980, 285, 655–657. [Google Scholar] [CrossRef]
  49. Agar, O.; Tan, D.K.; Barton, D.A.; Trethowan, R.M. Genetic variation in wheat pollen heat tolerance. In Proceedings of the 17th ASA Conference, Hobart, Australia, 20–24 September 2015; Available online: http://agronomyaustraliaproceedings.org/images/sampledata/2015_Conference/pdf/agronomy2015final00011.pdf (accessed on 5 April 2021).
  50. Bita, C.E.; Gerats, T. Plant tolerance to high temperature in a changing environment: Scientific fundamentals and production of heat stress-tolerant crops. Front. Plant Sci. 2013, 4, 273. [Google Scholar] [CrossRef] [Green Version]
  51. Ling, Q.; Huang, W.; Jarvis, P. Use of a SPAD-502 meter to measure leaf chlorophyll concentration in Arabidopsis thaliana. Photosynth. Res. 2011, 107, 209–214. [Google Scholar] [CrossRef] [PubMed] [Green Version]
  52. Shirdelmoghanloo, H.; Lohraseb, I.; Rabie, H.S.; Brien, C.; Parent, B.; Collins, N.C. Heat susceptibility of grain filling in wheat (Triticum aestivum L.) linked with rapid chlorophyll loss during a 3-day heat treatment. Acta Physiol. Plant. 2016, 38, 208. [Google Scholar] [CrossRef]
  53. Butler, D.G.; Gogel, B.G.; Cullis, B.R.; Thompson, R. Navigating from ASReml-R Version 3 to 4; VSN Int. Ltd.: Hemel Hempstead, UK, 2017; Available online: https://asreml.kb.vsni.co.uk/wp-content/uploads/sites/3/2018/07/Navigating-from-ASReml-R-3-to-4.pdf.pdf (accessed on 15 November 2021).
  54. Cao, Y.Y.; Duan, H.; Yang, L.N.; Wang, Z.Q.; Zhou, S.C.; Yang, J.C. Effect of Heat Stress During Meiosis on Grain Yield of Rice Cultivars Differing in Heat Tolerance and Its Physiological Mechanism. Acta Agron. Sin. 2008, 34, 2134–2142. [Google Scholar] [CrossRef]
  55. Reynolds, M.P.; Delgado, M.I.B.; Gutiérrez-Rodríguez, M.; Saavedra, A.L. Photosynthesis of wheat in a warm, irrigated environment: I: Genetic diversity and crop productivity. Field Crops Res. 2000, 66, 37–50. [Google Scholar] [CrossRef]
  56. Bányai, J.; Karsai, I.; Balla, K.; Kiss, T.; Bedő, Z.; Lang, L. Heat stress response of wheat cultivars with different ecological adaptation. Cereal Res. Commun. 2014, 42, 413–425. [Google Scholar] [CrossRef] [Green Version]
  57. Mondal, S.; Mason, R.E.; Huggins, T.; Hays, D.B. QTL on wheat (Triticum aestivum L.) chromosomes 1B, 3D and 5A are associated with constitutive production of leaf cuticular wax and may contribute to lower leaf temperatures under heat stress. Euphytica 2015, 201, 123–130. [Google Scholar] [CrossRef]
  58. Sharma, D.K.; Andersen, S.B.; Ottosen, C.-O.; Rosenqvist, E. Wheat cultivars selected for high Fv/Fm under heat stress maintain high photosynthesis, total chlorophyll, stomatal conductance, transpiration and dry matter. Physiol. Plant. 2015, 153, 284–298. [Google Scholar] [CrossRef] [PubMed]
  59. Shirdelmoghanloo, H.; Cozzolino, D.; Lohraseb, I.; Collins, N.C. Truncation of grain filling in wheat (Triticum aestivum) triggered by brief heat stress during early grain filling: Association with senescence responses and reductions in stem reserves. Funct. Plant Biol. 2016, 43, 919–930. [Google Scholar] [CrossRef] [PubMed]
  60. Havaux, M. Rapid photosynthetic adaptation to heat stress triggered in potato leaves by moderately elevated temperatures. Plant Cell Environ. 1993, 16, 461–467. [Google Scholar] [CrossRef]
  61. Reddy, K.R.; Bheemanahalli, R.; Saha, S.; Singh, K.; Lokhande, S.B.; Gajanayake, B.; Read, J.J.; Jenkins, J.N.; Raska, D.A.; De Santiago, L.M.; et al. High-Temperature and Drought-Resilience Traits among Interspecific Chromosome Substitution Lines for Genetic Improvement of Upland Cotton. Plants 2020, 9, 1747. [Google Scholar] [CrossRef] [PubMed]
  62. Bhusal, N.; Sharma, P.; Sareen, S.; Sarial, A.K. Mapping QTLs for chlorophyll content and chlorophyll fluorescence in wheat under heat stress. Biol. Plant. 2018, 62, 721–731. [Google Scholar] [CrossRef]
  63. Feng, B.; Liu, P.; Li, G.; Dong, S.T.; Wang, F.H.; Kong, L.A.; Zhang, J.W. Effect of Heat Stress on the Photosynthetic Characteristics in Flag Leaves at the Grain-Filling Stage of Different Heat-Resistant Winter Wheat Varieties. J. Agron. Crop Sci. 2014, 200, 143–155. [Google Scholar] [CrossRef]
  64. Ali, M.; Ibrahim, A.M.H.; Hays, D.B.; Ristic, Z.; Fu, J. Wild Tetraploid Wheat (Triticum turgidum L.) Response to Heat Stress. J. Crop Improv. 2010, 24, 228–243. [Google Scholar] [CrossRef]
  65. Bergkamp, B.; Impa, S.; Asebedo, A.; Fritz, A.; Jagadish, S.K. Prominent winter wheat varieties response to post-flowering heat stress under controlled chambers and field based heat tents. Field Crops Res. 2018, 222, 143–152. [Google Scholar] [CrossRef]
  66. Bennett, D.; Reynolds, M.; Mullan, D.; Izanloo, A.; Kuchel, H.; Langridge, P.; Schnurbusch, T. Detection of two major grain yield QTL in bread wheat (Triticum aestivum L.) under heat, drought and high yield potential environments. Theor. Appl. Genet. 2012, 125, 1473–1485. [Google Scholar] [CrossRef]
  67. Telfer, P.; Edwards, J.; Bennett, D.; Ganesalingam, D.; Able, J.; Kuchel, H. A field and controlled environment evaluation of wheat (Triticum aestivum) adaptation to heat stress. Field Crops Res. 2018, 229, 55–65. [Google Scholar] [CrossRef]
  68. Fábián, A.; Sáfrán, E.; Szabó-Eitel, G.; Barnabás, B.; Jäger, K. Stigma Functionality and Fertility Are Reduced by Heat and Drought Co-stress in Wheat. Front. Plant Sci. 2019, 10, 244. [Google Scholar] [CrossRef] [PubMed]
  69. Chen, J.; Tang, L.; Shi, P.; Yang, B.; Sun, T.; Cao, W.; Zhu, Y. Effects of short-term high temperature on grain quality and starch granules of rice (Oryza sativa L.) at post-anthesis stage. Protoplasma 2017, 254, 935–943. [Google Scholar] [CrossRef] [PubMed]
  70. Erena, M.F. Genetic and Physiological Bases of Heat-Induced Floret Sterility in Wheat. Ph.D. Thesis, The University of Adelaide, Adelaide, Australia, 2018. Available online: https://hdl.handle.net/2440/122076 (accessed on 15 July 2021).
  71. Balla, K.; Karsai, I.; Kiss, T.; Horváth, A.; Berki, Z.; Cseh, A.; Bónis, P.; Árendás, T.; Veisz, O. Single versus repeated heat stress in wheat: What are the consequences in different developmental phases? PLoS ONE 2021, 16, e0252070. [Google Scholar] [CrossRef] [PubMed]
  72. Feng, F.; Han, Y.; Wang, S.; Yin, S.; Peng, Z.; Zhou, M.; Gao, W.; Wen, X.; Qin, X.; Siddique, K. The Effect of Grain Position on Genetic Improvement of Grain Number and Thousand Grain Weight in Winter Wheat in North China. Front. Plant Sci. 2018, 9, 129. [Google Scholar] [CrossRef] [PubMed] [Green Version]
  73. Philipp, N.; Weichert, H.; Bohra, U.; Weschke, W.; Schulthess, A.W.; Weber, H. Grain number and grain yield distribution along the spike remain stable despite breeding for high yield in winter wheat. PLoS ONE 2018, 13, e0205452. [Google Scholar] [CrossRef] [Green Version]
  74. Pinto, R.S.; Lopes, M.S.; Collins, N.C.; Reynolds, M.P. Modelling and genetic dissection of staygreen under heat stress. Theor. Appl. Genet. 2016, 129, 2055–2074. [Google Scholar] [CrossRef] [Green Version]
  75. Qin, D.; Wu, H.; Peng, H.; Yao, Y.; Ni, Z.; Li, Z.; Zhou, C.; Sun, Q. Heat stress-responsive transcriptome analysis in heat susceptible and tolerant wheat (Triticum aestivum L.) by using Wheat Genome Array. BMC Genom. 2008, 9, 432. [Google Scholar] [CrossRef] [Green Version]
  76. Mufti, M.U. Screening Wheat Seedlings for Heat and Drought Tolerance by In Vivo Chlorophyll Fluorescence. Ph.D. Thesis, The University of Adelaide, Adelaide, Australia, 2005. Available online: https://hdl.handle.net/2440/22299 (accessed on 15 October 2021).
  77. Maphosa, L.; Langridge, P.; Taylor, H.; Parent, B.; Emebiri, L.; Kuchel, H.; Reynolds, M.P.; Chalmers, K.J.; Okada, A.; Edwards, J.; et al. Genetic control of grain yield and grain physical characteristics in a bread wheat population grown under a range of environmental conditions. Theor. Appl. Genet. 2014, 127, 1607–1624. [Google Scholar] [CrossRef]
  78. Tura, H.; Edwards, J.; Gahlaut, V.; Garcia, M.; Sznajder, B.; Baumann, U.; Shahinnia, F.; Reynolds, M.P.; Langridge, P.; Balyan, H.S.; et al. QTL analysis and fine mapping of a QTL for yield-related traits in wheat grown in dry and hot environments. Theor. Appl. Genet. 2020, 133, 239–257. [Google Scholar] [CrossRef]
  79. Mason, R.E.; Mondal, S.; Beecher, F.W.; Pacheco, A.; Jampala, B.; Ibrahim, A.M.H.; Hays, D.B. QTL associated with heat susceptibility index in wheat (Triticum aestivum L.) under short-term reproductive stage heat stress. Euphytica 2010, 174, 423–436. [Google Scholar] [CrossRef]
  80. Alsamadany, H. Diversity and Genetic Studies of Heat Tolerance in Wheat. Ph.D. Thesis, The University of Western Australia, Perth, Australia, 2015. Available online: https://research-repository.uwa.edu.au/en/publications/diversity-and-genetic-studies-of-heat-tolerance-in-wheat (accessed on 15 March 2021).
  81. Thistlethwaite, R.; Bokshi, A.; He, S.; Joukhadar, R.; Tan, D.; Daetwyler, H.; Trethowan, R. How Heat Tolerant are Our Current Wheat Varieties? 2021. GRDC Update Paper. Available online: https://grdc.com.au/resources-and-publications/grdc-update-papers/tab-content/grdc-update-papers/2021/02/how-heat-tolerant-are-our-current-wheat-varieties (accessed on 19 April 2022).
Figure 1. Overview of (A) timing of heat stress in relation to (B) auricle distance (AD, cm) and (C) stages of meiosis in wheat. Meiosis (in anthers) starts when AD reaches 1 cm in most cultivars and ends at AD 8 cm under heat stress. Immature pollen grains (microspores) are formed in anthers after AD ≥8 cm. (D) The heat treatment effect on grain number and grain weight in the main stem spike is measured on spikelets from the base upwards.
Agronomy 12 00987 g001
Figure 2. Diurnal temperatures in the controlled environment room (CER) during the 5 d temperature treatments. The control CER was set at 24/16 °C (day/night), while the high temperature CER was set at 32/16 °C (day/night). In the high temperature CER, temperature gradually increased from 16 °C to 32 °C from 06.00 h to 12:00 h (maximum temperature held from 12.00 to 16.00 h) and gradually decreased from 32 °C to 16 °C from 16:00 to 22.00 h. In the control CER, temperature was gradually increased from 16 °C to 24 °C from 06:00 to 10:00 h (maximum temperature held from 10:00 to 16:00 h) and decreased gradually from 24 °C to 16 °C from 16:00 to 22:00 h.
Agronomy 12 00987 g002
Figure 3. (A) Grain number (GN) and (B) average individual grain weight (GW) in the main stem spike for wheat cultivars under high temperature (red) and control (black) treatments during meiosis. The ‘tolerant’ cultivars are in pale yellow box (Group 1) and ‘sensitive’ cultivars are in the pale blue (Group 2) and pink (Group 3) boxes. The groupings are based on the principal component analysis in Figure 4.
Agronomy 12 00987 g003
Figure 4. (A) Principal component analysis (PCA) biplot of 30 wheat cultivars and the measured variables/traits (% reduction under high temperature relative to the control temperature treatment); length of arrows indicates the relative size of contribution of the trait, and direction of arrows indicates impact on variety response to traits in the PCA, (B) Hierarchical cluster diagram of varieties (Euclidean distance and Ward’s method). Varieties formed three clusters or groups as shown in (A) and (B) Group 1 includes ‘tolerant’ cultivars with a low percent reduction in yield, yield-associated traits and FLTD_5D under high temperature relative to control treatment. Group 2 includes ‘sensitive cultivars’ with higher reduction in GN, GY, GW, FLTD_1D and FLTD_3D under high temperature relative to control treatment. Group 3 includes ‘sensitive cultivars’ with higher reduction in GN, BM and FLTD_1D under high temperature relative to control treatment. Group 1 had the greatest relative reduction in PV. Abbreviations: GN, grain number (main stem); GY, grain yield (main stem); GW, average individual grain weight (main stem); SL, spike length (main stem); SN, spikelet number (main stem); MSL, main stem length; PV, pollen viability (main stem); BM, above-ground biomass; ET, percentage effective tillers; FLTD_1D, flag leaf temperature depression day 1; FLTD_3D, flag leaf temperature depression day 3; FLTD_5D, flag leaf temperature depression day 5; DTAD, days from sowing to auricle distance 1 cm.
Agronomy 12 00987 g004
Figure 5. Impact of heat stress on grain number per spikelet (GNs) at different spikelet positions on the main stem spike in ‘tolerant’ wheat cultivars, (A) Hellfire and (B) Vixen, and ‘sensitive’ cultivars, (C) Gladius and (D) W156. The graphs show the regression lines (95% confidence interval) of the quadratic model for GNs against spikelet position (4 to 13) following control and high temperature treatments at meiosis. ‘Tolerant’ cultivars under high temperature treatment responded similarly to the control for GNs, whereas GNs were significantly reduced in ‘sensitive’ cultivars under high temperature treatment relative to control based on the significantly negative heat treatment effect on the intercept (Supplementary Table S5). (* indicates significance at p < 0.05).
Agronomy 12 00987 g005
Figure 6. Impact of heat stress on average individual grain weight per spikelet (GWs) at different spikelet positions on the main spike in ‘tolerant’ wheat cultivars, (A) Hellfire and (B) Vixen, and ‘sensitive’ cultivars, (C) Gladius and (D) W156. The graphs show the regression lines (95% confidence interval) of the linear model for GWs against spikelet position (4 to 13) following control and high temperature treatments at meiosis. Refer to Supplementary Table S5 for further details.
Agronomy 12 00987 g006
Table 1. The effect of cultivar and temperature treatment on various physiological and agronomic traits on the main stem and whole plants of 30 wheat genotypes exposed to 5 d of high temperature (“Heat”) or control temperature (“Control”) treatments during meiosis. The significance of variance components was evaluated by a one-tailed Z-test, and significance of temperature treatment (fixed effect) by the Wald statistic. Percent reduction in the high temperature treatment means is expressed relative to the control, and positive values indicate that the high temperature treatment means are lower than the control treatment. Individual cultivar means under high temperature and control treatments are provided in Supplementary Table S2.
TraitAbbreviation (Units)Random Effects (Variance Components)Fixed Effect
(Wald Statistic)
Temperature Treatment Means
CultivarCultivar ×
Temperature Treatment
ErrorTemperature TreatmentControlHeatPercent Reduction
Main stem traits
Degrees of freedom 29291161
Grain numberGN 63.74 ***3.67 × 10−655.72 ***33.63 ***54.6548.2311.8
Grain yield GY (g)0.04 **4.11 × 10−70.05 ***20.90 ***1.090.9414.1
Individual grain weight GW (mg)12.5 **9.85 × 10−716.89 ***0.8820.2819.702.9
Spike length SL (cm)1.46 ***1.44 × 10−70.56 ***2.099.549.371.8
Spikelet number SN4.99 ***1.25 × 10−62.01 ***1.7718.3818.091.6
Main stem length MSL (cm)37.33 ***1.5923.66 ***0.9351.7752.64−1.7
Pollen viabilityPV (%)0.90 **0.051.15 ***212 ***98.7296.212.5
Whole plant traits
Degrees of freedom 2929116
Above-ground biomassBM (g)36.39 ***1.65 × 10−633.91 ***9.98 **30.1927.389.3
Total no. tillersTNT21.14 **6.39 × 10−624.70 ***1.0722.621.843.6
Effective no. tillersENT27.47 ***1.27 × 10−621. 23 ***0.3118.8318.432.1
% effective tillersET (%)98.24 ***2.97 × 10−5119.67 ***0.2382.8583.65−1.0
Total plant grain yield TGY (g)5.82 **2.12 × 10−611.07 ***4.99 *9.488.311.7
Physiological traits
Flag leaf chlorophyll content
Degrees of freedom 2929116
Day 1SPAD_1D4.01 ***2.82 × 10−75.10 ***0.9046.1346.47−0.7
Day 3SPAD_3D3.69 **0.354.69 ***3.1050.4751.12−1.3
Day 5SPAD_5D3.37 **0.574.31 ***2.4053.5454.08−1.0
Flag leaf temperature depression
Degrees of freedom 2929116
Day 1FLTD_1D (°C)1.79 × 10−74.79 × 10−70.39 ***120.17 ***1.752.80−60.2
Day 3FLTD_3D (°C)2.52 × 10−70.050.36 ***74.27 ***1.952.86−46.6
Day 5FLTD_5D (°C)8.89 × 10−80.050.29 ***29.51 ***2.172.71−25.3
Quantum yield of photosynthesis
Degrees of freedom 2929116
Day 1Fv/Fm_1D1.62 × 10−5 *1.35 × 10−85.67 × 10−5 ***192 ***0.8170.8021.8
Day 3Fv/Fm_3D4.83 × 10−6 *8.15 × 10−92.05 × 10−5 ***300 ***0.8190.8061.6
Day 5Fv/Fm_5D6.35 × 10−99.11 × 10−6 *1.88 × 10−5 ***145 ***0.8210.8091.5
Stomatal conductance
Degrees of freedom 71301
Day 3SC (mmol m−2 s−1)1182.911.16 × 10−31741.32 ***37.76 ***259.48333.48−28.72
*, ** and *** indicates significance at p < 0.05, p < 0.01 and p < 0.001, respectively.
Table 2. Trait mean values for several yield-related and physiological traits in three groups of wheat cultivars based on PCA-based clustering for heat tolerance and sensitivity at meiosis. Percent reduction in traits is the relative value of the mean in the high temperature treatment (“Heat”) and the mean in the control temperature treatment (“Control”), and positive values indicate that the high temperature means are lower than the control means. The separation of cultivars into three groups based on their heat tolerance and sensitivity is shown in Figure 4.
TraitsGroup 1 (Tolerant)Group 2 (Sensitive)Group 3 (Sensitive)
ControlHeatPercent ReductionControlHeatPercent ReductionControlHeatPercent Reduction
GN56.5752.437.351.7843.4416.153.6845.2215.8
GY1.171.105.51.130.7929.80.960.8017.5
GW20.921.4–2.022.218.616.418.118.00.8
PV98.4395.692.898.5896.452.299.2196.792.4
BM29.4029.380.132.3328.4512.030.023.9520.2
SL9.729.700.29.128.783.79.559.272.9
SN17.8117.790.117.7817.004.419.5519.181.9
MSL51.9252.72–1.555.1954.141.949.5151.62–4.3
TGY10.210.3–2.69.37.022.78.16.117.4
TNT22.023.7–7.523.720.911.322.619.513.0
ENT19.621.2–8.817.915.412.818.016.09.3
ET88.3589.26–1.075.0073.831.679.8581.68–2.3
SPAD_1D46.5646.270.645.5145.58–0.245.9247.27–2.9
SPAD_3D51.3551.170.449.6550.09–0.949.7351.67–3.9
SPAD_5D54.1254.66–1.052.5252.83–0.653.3254.01–1.3
FLTD_1D1.702.83–66.81.932.67–37.91.722.85–66.2
FLTD_3D1.812.87–58.41.843.01–63.02.202.75–24.8
FLTD_5D2.042.74–34.01.993.22–61.62.442.372.8
Fv/Fm_1D0.8170.8021.90.8150.8021.60.8170.8021.8
Fv/Fm_3D0.8190.8061.60.8180.8041.60.8190.8061.6
Fv/Fm_5D0.8220.8101.50.8200.8091.30.8200.8061.7
GN, grain number (main stem); GY, grain yield (main stem; g); GW, average individual grain weight (main stem; mg); PV, pollen viability (main stem; %); BM, above-ground biomass (g); SL, spike length (main stem; cm); SN, spikelet number (main stem); MSL, main stem length (cm); TGY, total plant grain yield (g); TNT, total number of tillers; ENT, effective number of tillers; ET, percentage effective tillers; SPAD_1D, flag leaf chlorophyll content day 1; SPAD_3D, flag leaf chlorophyll content day 3; SPAD_5D, flag leaf chlorophyll content day 5; Fv/Fm_1D, quantum yield of photosynthesis day 1; Fv/Fm_3D, quantum yield of photosynthesis day 3; Fv/Fm_5D, quantum yield of photosynthesis day 5; FLTD_1D, flag leaf temperature depression day 1 (°C); FLTD_3D, flag leaf temperature depression day 3 (°C); FLTD_5D, flag leaf temperature depression day 5 (°C).
Publisher’s Note: MDPI stays neutral with regard to jurisdictional claims in published maps and institutional affiliations.

