
Agronomic Performance of Chickpea Affected by Drought Stress at Different Growth Stages

 , and
, and 
Abstract
:1. Introduction
2. Materials and Methods
2.1. Experimental Material, Selection of Soil and Stress Treatment
2.2. Drought Stress Application and Management
2.2.1. Plant Height
2.2.2. Relative Water Content
2.2.3. Membrane Stability Index
2.2.4. Chlorophyll Index
2.2.5. Protein Content (Leaf)
2.2.6. Days to Flowering and Days to Maturity
2.2.7. Yield Traits
2.3. Data Analysis
3. Results
3.1. Physiological Changes under Drought Stress
3.1.1. Drought Stress at Vegetative Stage
3.1.2. Drought Stress at Reproductive Stage
3.2. Screening of Genotypes Based on Drought Susceptibility Index (DSI)
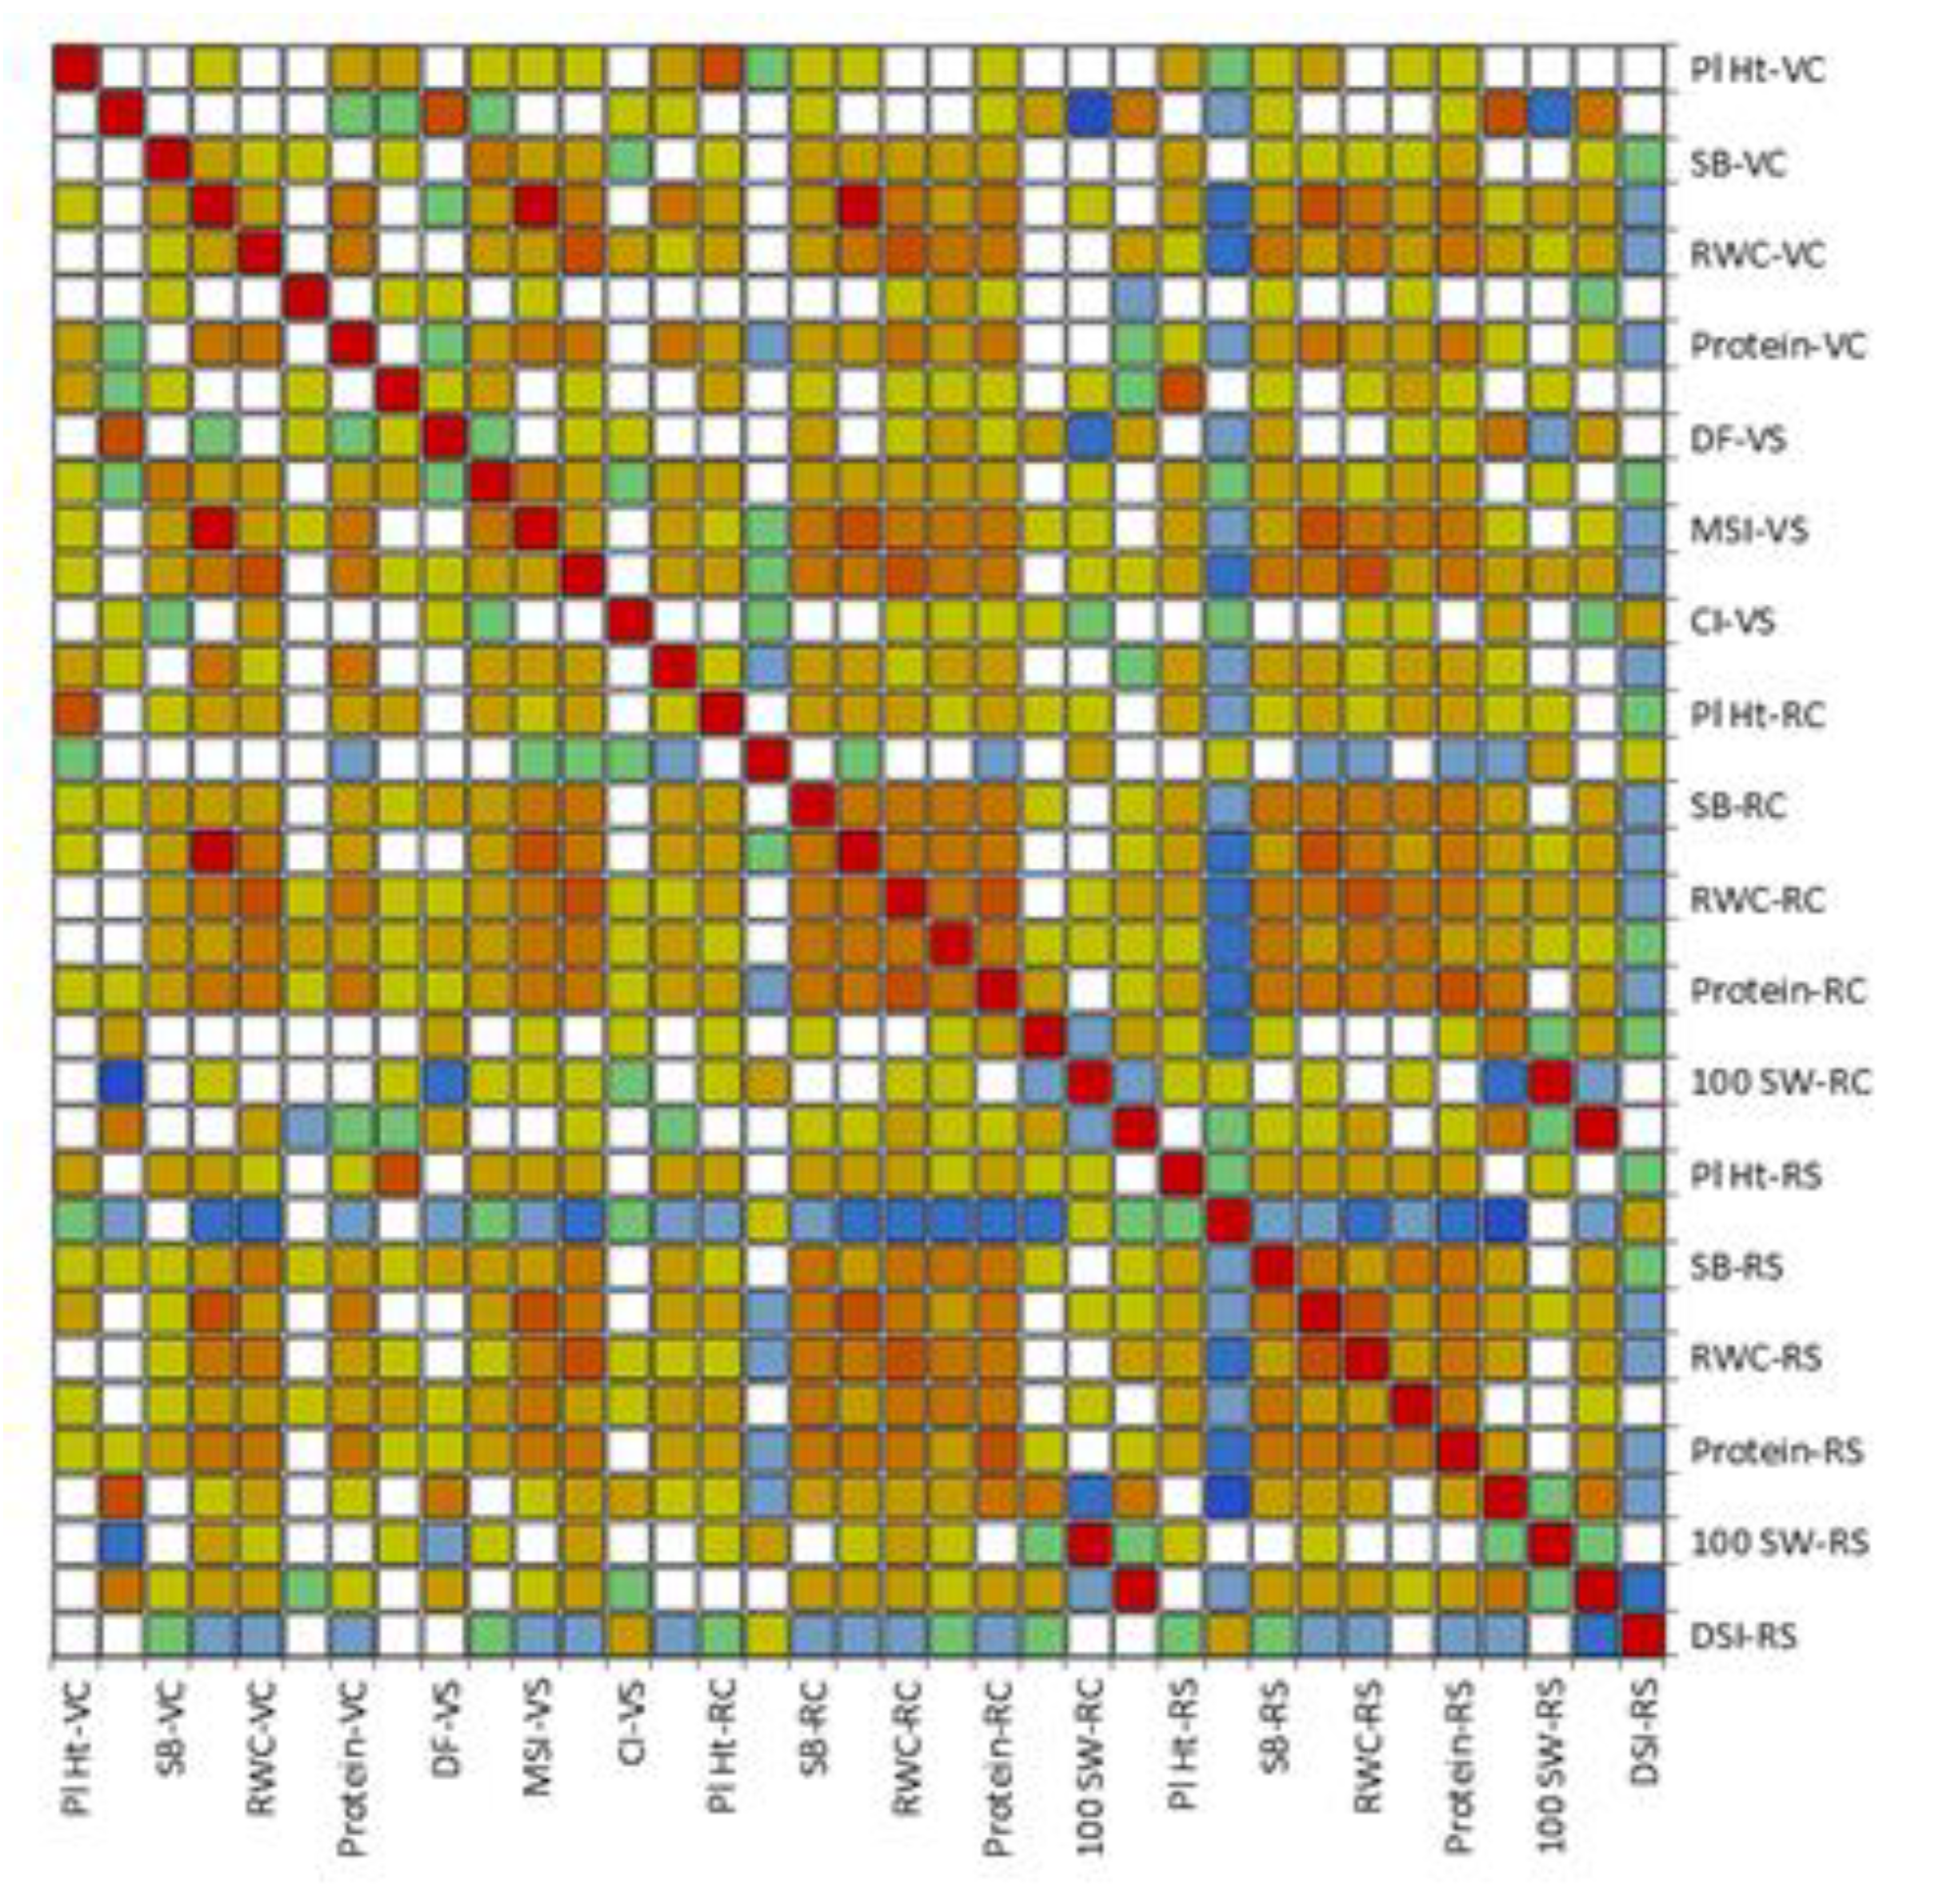
3.3. Association of Multiple Traits under Drought Stress
3.4. Principal Component Analysis
3.5. Performance of Ten Most Tolerant Genotypes under Stressed Conditions
4. Discussion
5. Conclusions
Author Contributions
Funding
Data Availability Statement
Acknowledgments
Conflicts of Interest
References
- Sachdeva, S.; Dawar, S.; Rani, U.; Patil, B.S.; Soren, K.R.; Singh, S.; Sanwal, S.K.; Chauhan, S.K.; Bharadwaj, C. Identification of SSR markers linked to Botrytis grey mould resistance in chickpea (Cicer arietinum L.). Phytopathol. Mediterr. 2019, 58, 283–292. [Google Scholar]
- Varshney, R.K.; Song, C.; Saxena, R.K.; Azam, S.; Yu, S.; Sharpe, A.G.; Cannon, S.; Baek, J.; Rosen, B.D.; Tar’an, B.; et al. Draft genome sequence of chickpea (Cicer arietinum L.) provides a resource for trait improvement. Nat. Biotechnol. 2013, 31, 240–246. [Google Scholar] [CrossRef] [PubMed] [Green Version]
- Bharadwaj, C.; Chauhan, S.K.; Rajguru, G.; Srivastava, R.; Tara Satyavathi, C.; Yadav, S.; Hasan Rizvi, A.; Kumar, J.; Solanki, R.K. Diversity analysis of chickpea (Cicer arietinum L.) cultivars using STMS markers. Indian J. Agric. Sci. 2010, 80, 947. [Google Scholar]
- FAOSTAT, F.A.O. Crops. Food and Agriculture Organization of the United Nations. 2012. Available online: https://www.fao.org/statistics/en/ (accessed on 10 November 2021).
- Sachdeva, S.; Bharadwaj, C.; Singh, R.K.; Jain, P.K.; Patil, B.S.; Roorkiwal, M.; Varshney, R. Characterization of ASR gene and its role in drought tolerance in chickpea (Cicer arietinum L.). PLoS ONE 2020, 15, e0234550. [Google Scholar] [CrossRef] [PubMed]
- Neeraj, K.; Bharadwaj, C.; Satyavathi, C.T.; Madan, P.; Tapan, K.; Tripti, S.; Supriya, S.; Jain, P.K.; Patil, B.S.; Soren, K.R. Morpho-Physiological characterization and grouping (SAHN) of chickpea genotypes for salinity tolerance. Vegetos 2017, 30, 116–123. [Google Scholar]
- Tiwari, S.; Lata, C.; Chauhan, P.S.; Nautiyal, C.S. Pseudomonas putida attunes morphophysiological, biochemical and molecular responses in Cicer arietinum L. during drought stress and recovery. Plant Physiol. Biochem. 2016, 99, 108–117. [Google Scholar] [CrossRef]
- Khoyerdi, F.F.; Shamshiri, M.H.; Estaji, A. Changes in some physiological and osmotic parameters of several pistachio genotypes under drought stress. Sci. Hortic. 2016, 198, 44–51. [Google Scholar] [CrossRef]
- Deshmukh, R.; Sonah, H.; Patil, G.; Chen, W.; Prince, S.; Mutava, R.; Vuong, T.; Valliyodan, B.; Nguyen, H.T. Integrating omic approaches for abiotic stress tolerance in soybean. Front. Plant Sci. 2014, 5, 244. [Google Scholar] [CrossRef]
- Mir, R.R.; Zaman-Allah, M.; Sreenivasulu, N.; Trethowan, R.; Varshney, R.K. Integrated genomics, physiology and breeding approaches for improving drought tolerance in crops. Theor. Appl. Genet. 2012, 125, 625–645. [Google Scholar] [CrossRef] [Green Version]
- Jha, U.C.; Chaturvedi, S.K.; Bohra, A.; Basu, P.S.; Khan, M.S.; Barh, D. Abiotic stresses, constraints and improvement strategies in chickpea. Plant Breed. 2014, 133, 163–178. [Google Scholar] [CrossRef]
- Pandey, V.; Shukla, A. Acclimation and tolerance strategies of rice under drought stress. Rice Sci. 2015, 22, 147–161. [Google Scholar] [CrossRef] [Green Version]
- Maqbool, M.A.; Aslam, M.; Ali, H.; Shah, T.M.; Farid, B.; Zaman, Q.U. Drought tolerance indices based evaluation of chickpea advanced lines under different water treatments. Res. Crops 2015, 16, 336–344. [Google Scholar] [CrossRef]
- Parameshwarappa, S.G.; Salimath, P.M.; Upadhyaya, H.D.; Patil, S.S.; Kajjidoni, S.T.; Patil, B.C. Characterization of drought tolerant accessions identified from the minicore of chickpea (Cicer arietinum L.). Indian J. Genet. Plant Breed. 2010, 70, 125–131. [Google Scholar]
- Yaqoob, M.; Hollington, P.A.; Mahar, A.B.; Gurmani, Z.A. Yield performance and responses studies of chickpea (Cicer arietinum L.) genotypes under drought stress. Emir. J. Food Agric. 2013, 25, 117–123. [Google Scholar] [CrossRef] [Green Version]
- Choukri, H.; Hejjaoui, K.; El-Baouchi, A.; Smouni, A.; Maalouf, F.; Thavarajah, D.; Kumar, S. Heat and Drought Stress Impact on Phenology, Grain Yield, and Nutritional Quality of Lentil (Lens culinaris Medikus). Front. Nutr. 2020, 7, 596307. [Google Scholar] [CrossRef] [PubMed]
- Daryanto, S.; Wang, L.; Jacinthe, P.A. Global synthesis of drought effects on food legume production. PLoS ONE 2015, 10, e0127401. [Google Scholar] [CrossRef] [Green Version]
- Lu, H.; Tabassum, A.; Zhou, G. Plant hydraulic conductivity determines photosynthesis in rice under PEG-induced drought stress. Pak. J. Bot. 2021, 53, 409–417. [Google Scholar]
- Tomer, A.; Singh, S.K. Drought Stress Tolerance in Legume Crops. In Agronomic Crops; Springer: Singapore, 2020; pp. 149–155. [Google Scholar]
- Ulemale, C.S.; Mate, S.N.; Deshmukh, D.V. Physiological indices for drought tolerance in chickpea (Cicer arietinum L.). World J. Agric. Sci. 2013, 9, 123–131. [Google Scholar]
- Mafakheri, A.; Siosemardeh, A.F.; Bahramnejad, B.; Struik, P.C.; Sohrabi, Y. Effect of drought stress on yield, proline and chlorophyll contents in three chickpea cultivars. Aust. J. Crop Sci. 2010, 4, 580–585. [Google Scholar]
- Barrs, H.D.; Weatherley, P.E. A re-examination of the relative turgidity technique for estimating water deficits in leaves. Aust. J. Biol. Sci. 1962, 15, 413–428. [Google Scholar] [CrossRef] [Green Version]
- Blum, A.; Ebercon, A. Cell membrane stability as a measure of drought and heat tolerance in wheat. Crop Sci. 1981, 21, 43–47. [Google Scholar] [CrossRef]
- Hameed, A.; Shah, T.M.; Atta, B.M.; Iqbal, N.; Haq, M.A.; Ali, H. Comparative seed storage protein profiling of Kabuli chickpea genotypes. Pak. J. Bot. 2009, 41, 703–710. [Google Scholar]
- Panse, V.G.; Sukhatme, P.V. Statistical methods for agricultural workers. In Statistical Methods for Agricultural Workers; Indian Council of Agricultural Research (ICAR): New Delhi, India, 1954. [Google Scholar]
- Pang, J.; Turner, N.C.; Du, Y.L.; Colmer, T.D.; Siddique, K.H. Pattern of water use and seed yield under terminal drought in chickpea genotypes. Front. Plant Sci. 2017, 8, 1375. [Google Scholar] [CrossRef] [PubMed] [Green Version]
- Rani, A.; Devi, P.; Jha, U.C.; Sharma, K.D.; Siddique, K.H.; Nayyar, H. Developing climate-resilient chickpea involving physiological and molecular approaches with a focus on temperature and drought stresses. Front. Plant Sci. 2020, 1759. [Google Scholar] [CrossRef]
- Ramamoorthy, P.; Lakshmanan, K.; Upadhyaya, H.D.; Vadez, V.; Varshney, R.K. Shoot traits and their relevance in terminal drought tolerance of chickpea (Cicer arietinum L.). Field Crops Res. 2016, 197, 10–27. [Google Scholar] [CrossRef] [Green Version]
- Khatun, M.; Sarkar, S.; Era, F.M.; Islam, A.K.M.M.; Anwar, P.; Fahad, S.; Datta, R.; Islam, A.K.M.A. Drought Stress in Grain Legumes: Effects, Tolerance Mechanisms and Management. Agronomy 2021, 11, 2374. [Google Scholar] [CrossRef]
- Pereira, J.W.L.; Silva, E.C.A.; Luz, L.N.; Nogueira, R.J.M.C.; Melo Filho, P.A.; Lima, L.M.; Santos, R.C. Cluster analysis to select peanut drought tolerance lines. Aust. J. Crop Sci. 2015, 9, 1095–1105. [Google Scholar]
- Devasirvatham, V.; Tan, D.K.Y.; Gaur, P.M.; Raju, T.N.; Trethowan, R.M. High temperature tolerance in chickpea and its implications for plant improvement. Crop Pasture Sci. 2012, 63, 419–428. [Google Scholar] [CrossRef] [Green Version]
- Golldack, D.; Li, C.; Mohan, H.; Probst, N. Tolerance to drought and salt stress in plants: Unraveling the signaling networks. Front. Plant Sci. 2014, 5, 151. [Google Scholar] [CrossRef] [Green Version]
- Shavrukov, Y.; Kurishbayev, A.; Jatayev, S.; Shvidchenko, V.; Zotova, L.; Koekemoer, F.; Groot, S.D.; Kathleen Soole, K.; Langridge, P. Early flowering as a drought escape mechanism in plants: How can it aid wheat production? Front. Plant Sci. 2017, 8, 1950. [Google Scholar] [CrossRef]
- Kamanga, R.M.; Mbega, E.; Ndakidemi, P. Drought tolerance mechanisms in plants: Physiological responses associated with water deficit stress in Solanum lycopersicum. Adv. Crop Sci. Technol. 2018, 6, 1–8. [Google Scholar] [CrossRef]
- Bechtold, U. Plant life in extreme environments: How do you improve drought tolerance? Front. Plant Sci. 2018, 9, 543. [Google Scholar] [CrossRef] [PubMed] [Green Version]
- Krishnamurthy, L.; Gaur, P.M.; Basu, P.S.; Chaturvedi, S.K.; Tripathi, S.; Vadez, V.; Rathore, A.; Varshney, R.K.; Gowda, C.L.L. Large genetic variation for heat tolerance in the reference collection of chickpea (Cicer arietinum L.) germplasm. Plant Genet. Resour. 2011, 9, 59–69. [Google Scholar] [CrossRef] [Green Version]
- Leport, L.; Turner, N.C.; French, R.J.; Barr, M.D.; Duda, R.; Davies, S.L.; Tennant, D.; Siddique, K.H.M. Physiological responses of chickpea genotypes to terminal drought in a Mediterranean-type environment. Eur. J. Agron. 1999, 11, 279–291. [Google Scholar] [CrossRef]
- Sachdeva, S.; Bharadwaj, C.; Sharma, V.; Patil, B.S.; Soren, K.R.; Roorkiwal, M.; Varshney, R.; Bhat, K.V. Molecular and phenotypic diversity among chickpea (Cicer arietinum L.) genotypes as a function of drought tolerance. Crop Pasture Sci. 2018, 69, 142–153. [Google Scholar] [CrossRef]
- Fathi, A.; Tari, D.B. Effect of drought stress and its mechanism in plants. Int. J. Life Sci. 2016, 10, 1–6. [Google Scholar] [CrossRef] [Green Version]
- Jiang, Y.; Huang, B. Protein alterations in tall fescue in response to drought stress and abscisic acid. Crop Sci. 2002, 42, 202–207. [Google Scholar] [CrossRef]
- Maqbool, M.A.; Aslam, M.; Ali, H. Breeding for improved drought tolerance in Chickpea (Cicer arietinum L.). Plant Breed. 2017, 136, 300–318. [Google Scholar] [CrossRef] [Green Version]
- Ye, H.; Roorkiwal, M.; Valliyodan, B.; Zhou, L.; Chen, P.; Varshney, R.K.; Nguyen, H.T. Genetic diversity of root system architecture in response to 2015drought stress in grain legumes. J. Exp. Bot. 2018, 69, 3267–3277. [Google Scholar] [CrossRef] [Green Version]
- Ahmadi, J.; Pour-Aboughadareh, A.; Ourang, S.F.; Mehrabi, A.A.; Siddique, K.H. Wild relatives of wheat: Aegilops–Triticum accessions disclose differential antioxidative and physiological responses to water stress. Acta Physiol. Plant. 2018, 40, 1–14. [Google Scholar] [CrossRef]
- Basheer-Salimia, R.; Aloweidat, M.Y.; Al-Salimiya, M.A.; Hamdan, Y.A.S.; Sayara, T.A.S. Comparative study of five legume species under drought conditions. Legume Res.-Int. J. 2021, 44, 712–717. [Google Scholar] [CrossRef]
- Kumar, P.; Deshmukh, P.S.; Kushwaha, S.R.; Kumari, S. Effect of terminal drought on biomass production, its partitioning and yield of chickpea genotypes. Ann. Agric. Res. 2001, 22, 408–441. [Google Scholar]
- Varshney, R.K.; Thudi, M.; Nayak, S.N.; Gaur, P.; Kashiwagi, J.; Krishnamurthy, L.; Jaganathan, D.; Koppolu, J.; Bohra, A.; Tripathi, S.; et al. Genetic dissection of drought tolerance in chickpea (Cicer arietinum L.). Theor. Appl. Genet. 2014, 127, 445–462. [Google Scholar] [CrossRef] [PubMed]


| SNo. | Variety | Biological Status | Source | Pedigree | Seed Type |
|---|---|---|---|---|---|
| 1 | ICCV09313 | Training population | ICRISAT, Hyderabad | ICCV92311 × ICC14198 | Kabuli |
| 2 | ICCV10313 | Training population | ICRISAT, Hyderabad | ICCV92337 × ICC14194 | Kabuli |
| 3 | ICCV08310 | Training population | ICRISAT, Hyderabad | ICCV95311 × ICC17109 | Kabuli |
| 4 | ICCV097309 | Training population | ICRISAT, Hyderabad | (ICC2588 × ICCC32) × [(ICCC49 × ICC15980) × ICCV3] | Kabuli |
| 5 | ICCV03311 | Training population | ICRISAT, Hyderabad | ICCV92328 × [(ICCC32 × ICC12034) × ICC19686] | Kabuli |
| 6 | ICCV01309 | Training population | ICRISAT, Hyderabad | (ICC4973 × ICC14196) × ICCV92329 | Kabuli |
| 7 | ICCV09312 | Training population | ICRISAT, Hyderabad | ICCV92337 × ICC7344 | Kabuli |
| 8 | ICCV9314 | Training population | ICRISAT, Hyderabad | ICCV92311 × ICC17109 | Kabuli |
| 9 | ICCV10304 | Training population | ICRISAT, Hyderabad | ICCV92311 × ICC14215 | Kabuli |
| 10 | ICCV10307 | Training population | ICRISAT, Hyderabad | ICCV92311 × ICC17109 | Kabuli |
| 11 | ICCV10306 | Training population | ICRISAT, Hyderabad | ICCV92311 × ICC17109 | Kabuli |
| 12 | ICCV10316 | Training population | ICRISAT, Hyderabad | ICCV92337 × ICC17109 | Kabuli |
| 13 | ICCV92337 | Training population | ICRISAT, Hyderabad | (ICCV2 × ICC12034) × ICC7344 | Kabuli |
| 14 | ICCV00109 | Training population | ICRISAT, Hyderabad | ICC18746 × ICCV10 | Desi |
| 15 | ICCV03103 | Training population | ICRISAT, Hyderabad | [ICCV92014 × JG23) × BG1032] | Kabuli |
| 16 | ICCV09307 | Training population | ICRISAT, Hyderabad | ICCV92337 × ICC17109 | Kabuli |
| 17 | ICCV95423 | Training population | ICRISAT, Hyderabad | (ICC7676 × ICCC32) × ((ICCC49 × ICC15980) × ICCV3) | Kabuli |
| 18 | ICCV97404 | Training population | ICRISAT, Hyderabad | (ICCC32 × ICC4967) × [(ICCC49 × ICC15980) × ICCV3] | Kabuli |
| 19 | ICCV10 | Released variety | ICRISAT, Hyderabad | ICC1376 × ICC1443 | Desi |
| 20 | ICC1882 | Breeding line | ICRISAT, Hyderabad | Traditional landrace P1506-4 from ICRISAT | Desi |
| 21 | BGD72 | Released variety | ICAR-IARI, New Delhi | P1231 × P1265 | Desi |
| 22 | Pusa1103 | Released variety | ICAR-IARI, New Delhi | (Pusa256 × Cicerreticulatum) × Pusa362 | Desi |
| 23 | ICC4958 | Breeding line | ICRISAT, Hyderabad | GW 5/7, a drought tolerant breeding line from ICRISAT | Desi |
| 24 | ICCV00301 | Training population | ICRISAT, Hyderabad | ICCV92502 × ICCV2 | Kabuli |
| 25 | ICCV0302 | Training population | ICRISAT, Hyderabad | FLIP 91-18C × ICCV2 | Kabuli |
| 26 | ICCV01301 | Training population | ICRISAT, Hyderabad | GNG1044 × (ICCC32 × ICC12034) | Kabuli |
| 27 | L550 | Breeding line | PAU, Ludhiana | PBG7 × Rabat | Kabuli |
| 28 | ICCV03403 | Training population | ICRISAT, Hyderabad | (ICC4973 × ICC14196) × ICCV92329 | Kabuli |
| 29 | C235 | Released variety | PAU, Ludhiana | IP58 × C1234 | Desi |
| 30 | ICCV03404 | Training population | ICRISAT, Hyderabad | (ICC4973 × ICC14196) × ICCV92329 | Kabuli |
| 31 | ICCV03310 | Training population | ICRISAT, Hyderabad | BG70 × ICCV92329 | Kabuli |
| 32 | ICCV07301 | Training population | ICRISAT, Hyderabad | ICCC95334 × (ICCV2 × ICCV98506) | Kabuli |
| 33 | ICCV05312 | Training population | ICRISAT, Hyderabad | ICCV2 × ICCV92325 | Kabuli |
| 34 | ICCV5308 | Training population | ICRISAT, Hyderabad | ICCV2 × ICCV92311 | Kabuli |
| 35 | ICCV5313 | Training population | ICRISAT, Hyderabad | ICCV2 × ICCV92325 | Kabuli |
| 36 | ICCV4310 | Training population | ICRISAT, Hyderabad | (ICC4973 × ICC14196) × ICCV92329 | Kabuli |
| 37 | Pusa1003 | Released variety | ICAR-IARI, New Delhi | Mutant of L532 | Kabuli |
| 38 | CSG8962 | Released variety | ICAR-CSSRI, Karnal | Selection from GPF7035 | Desi |
| 39 | ICCV4303 | Training population | ICRISAT, Hyderabad | (ICC4973 × ICC14196) × ICCV92329 | Kabuli |
| 40 | ICCV2 | Released variety | ICRISAT, Hyderabad | [(ICC5003 × ICC 4953) × ICC 583] × (ICC4973 × ICC7347) | Kabuli |
| Vegetative Stage | Reproductive Stage | |||||
|---|---|---|---|---|---|---|
| Source of Variation | Df | Stressed Conditions | Control Conditions | Df | Stressed Conditions | Control Conditions |
| Genotypes | 39 | 271.68 * | 506.51 * | 39 | 397.36 * | 581.92 * |
| Columns | 5 | 97,621.19 * | 81,684.56 * | 11 | 110,107.07 * | 165,032.75 * |
| Interactions | 195 | 179.39 * | 440.80 * | 429 | 269.63 * | 343.79 * |
| Error | 480 | 6.91 | 3.99 | 960 | 7.3 | 4.77 |
| Total | 719 | 1439 | ||||
| A | |||||||||||||||||||||||||||||||||||||||||||||||||||||
|---|---|---|---|---|---|---|---|---|---|---|---|---|---|---|---|---|---|---|---|---|---|---|---|---|---|---|---|---|---|---|---|---|---|---|---|---|---|---|---|---|---|---|---|---|---|---|---|---|---|---|---|---|---|
| PH | MSI | RWC% | CI | Protein Content | |||||||||||||||||||||||||||||||||||||||||||||||||
| GS | Drought | Control | Drought | Control | Drought | Control | Drought | Control | Drought | Control | |||||||||||||||||||||||||||||||||||||||||||
| Avg | SE | Avg | SE | Avg | SE | Avg | SE | Avg | SE | Avg | SE | Avg | SE | Avg | SE | Avg | SE | Avg | SE | ||||||||||||||||||||||||||||||||||
| ICC1882 | Veg | 23.67 | 1.02 | 27.33 | 0.34 | 39.87 | 0.44 | 47.44 | 0.10 | 49.18 | 0.24 | 61.99 | 0.14 | 50.60 | 1.06 | 51.05 | 0.48 | 23.43 | 0.14 | 27.76 | 0.40 | ||||||||||||||||||||||||||||||||
| Flw | 25.33 | 1.61 | 30.33 | 1.12 | 57.34 | 0.85 | 60.29 | 1.15 | 52.76a | 0.84 | 56.33a | 1.15 | 36.15a | 0.64 | 48.95a | 0.26 | 13.32a | 0.25 | 14.67a | 0.05 | |||||||||||||||||||||||||||||||||
| ICC4958 | Veg | 31.33 | 0.47 | 33.00 | 0.45 | 76.15 | 0.62 | 78.67 | 0.14 | 80.45 | 0.37 | 82.03 | 0.25 | 55.05 | 0.24 | 61.75 | 0.22 | 31.47 | 0.00 | 33.51 | 0.11 | ||||||||||||||||||||||||||||||||
| Flw | 36.67 | 2.44 | 40.00 | 2.36 | 73.16 | 0.37 | 76.45 | 0.52 | 76.05b | 0.46 | 84.88b | 0.93 | 52.45b | 0.12 | 58.30b | 0.38 | 23.06b | 0.13 | 25.60b | 0.31 | |||||||||||||||||||||||||||||||||
| PUSA1103 | Veg | 29.00 | 0.59 | 31.00 | 0.22 | 61.69 | 0.18 | 68.26 | 0.19 | 69.09 | 0.24 | 72.56 | 0.15 | 46.30 | 0.43 | 54.55 | 0.41 | 24.67 | 0.15 | 27.56 | 0.61 | ||||||||||||||||||||||||||||||||
| Flw | 32.00 | 1.63 | 34.67 | 0.86 | 73.10 | 0.48 | 75.29 | 0.64 | 69.07c | 0.27 | 71.07c | 0.24 | 50.15c | 0.05 | 53.90c | 0.24 | 17.01c | 0.08 | 17.53c | 0.08 | |||||||||||||||||||||||||||||||||
| BGD72 | Veg | 28.67 | 0.72 | 30.00 | 0.98 | 69.12 | 0.38 | 70.62 | 0.11 | 71.77 | 0.54 | 72.48 | 0.13 | 52.00 | 0.59 | 53.05 | 0.46 | 27.79 | 0.26 | 28.84 | 0.59 | ||||||||||||||||||||||||||||||||
| Flw | 30.33 | 1.25 | 33.00 | 1.93 | 70.86 | 0.38 | 71.28 | 0.34 | 69.13c | 0.33 | 71.54c | 0.24 | 50.95c | 0.46 | 53.40c | 0.36 | 19.94d | 0.38 | 19.52d | 0.17 | |||||||||||||||||||||||||||||||||
| P-1003 | Veg | 30.33 | 0.34 | 29.33 | 0.56 | 47.02 | 0.24 | 51.50 | 0.07 | 41.01 | 0.19 | 50.54 | 0.07 | 41.25 | 0.35 | 49.40 | 0.26 | 25.75 | 0.76 | 26.14 | 0.36 | ||||||||||||||||||||||||||||||||
| Flw | 27.33 | 0.57 | 29.67 | 0.69 | 47.33 | 0.64 | 53.92 | 0.91 | 41.67d | 1.24 | 56.85a | 0.59 | 41.75d | 0.39 | 47.50d | 0.56 | 15.38e | 0.07 | 15.79e | 0.15 | |||||||||||||||||||||||||||||||||
| CSG8962 | Veg | 29.33 | 0.69 | 33.00 | 1.19 | 70.07 | 0.26 | 71.25 | 0.25 | 70.63 | 0.16 | 80.45 | 0.14 | 56.20 | 0.18 | 54.05 | 0.57 | 32.10 | 0.41 | 34.37 | 0.17 | ||||||||||||||||||||||||||||||||
| Flw | 31.67 | 1.51 | 33.67 | 1.46 | 69.88 | 0.12 | 71.01 | 0.24 | 70.52c | 0.29 | 75.04d | 0.82 | 50.95c | 1.14 | 54.85e | 0.26 | 18.59h | 0.27 | 20.97f | 0.12 | |||||||||||||||||||||||||||||||||
| C-235 | Veg | 26.67 | 1.16 | 29.67 | 1.28 | 44.00 | 0.32 | 58.90 | 0.68 | 60.27 | 0.13 | 62.64 | 0.08 | 48.10 | 0.43 | 49.50 | 0.43 | 28.92 | 0.56 | 29.85 | 0.29 | ||||||||||||||||||||||||||||||||
| Flw | 26.33 | 1.07 | 30.33 | 1.12 | 54.10 | 0.46 | 62.78 | 0.51 | 55.28e | 0.78 | 50.02e | 1.41 | 40.75e | 1.59 | 44.30f | 0.15 | 17.86c | 0.17 | 16.46g | 0.17 | |||||||||||||||||||||||||||||||||
| ICCV3310 | Veg | 31.33 | 0.34 | 36.00 | 0.98 | 64.83 | 0.18 | 67.82 | 0.28 | 62.40 | 0.45 | 62.99 | 0.12 | 40.55 | 1.06 | 53.95 | 0.35 | 28.60 | 0.78 | 32.01 | 0.12 | ||||||||||||||||||||||||||||||||
| Flw | 33.67 | 1.25 | 36.33 | 1.12 | 63.51 | 0.58 | 67.03 | 0.72 | 56.45f | 0.58 | 67.12f | 0.83 | 46.40f | 0.22 | 51.45g | 0.57 | 15.04e | 0.22 | 16.54g | 0.20 | |||||||||||||||||||||||||||||||||
| ICCV3311 | Veg | 30.67 | 0.34 | 33.33 | 0.79 | 73.11 | 0.16 | 77.05 | 0.21 | 65.83 | 0.24 | 72.30 | 0.09 | 40.20 | 0.57 | 52.55 | 1.93 | 27.71 | 0.15 | 29.63 | 0.17 | ||||||||||||||||||||||||||||||||
| Flw | 33.33 | 0.26 | 35.33 | 1.07 | 74.63 | 1.45 | 75.00 | 0.65 | 70.19c | 0.26 | 80.67g | 1.00 | 44.50g | 0.24 | 53.45c | 0.78 | 18.09f | 0.10 | 19.47d | 0.21 | |||||||||||||||||||||||||||||||||
| ICCV3403 | Veg | 31.00 | 0.22 | 32.33 | 0.56 | 43.98 | 0.38 | 44.67 | 0.15 | 66.56 | 0.48 | 69.01 | 0.24 | 37.85 | 1.05 | 47.05 | 1.20 | 30.63 | 0.89 | 30.75 | 0.08 | ||||||||||||||||||||||||||||||||
| Flw | 30.67 | 1.37 | 33.33 | 1.90 | 45.88 | 1.40 | 47.14 | 0.48 | 50.77g | 1.16 | 56.59a | 0.96 | 49.35h | 0.14 | 44.75f | 0.84 | 15.79e | 0.02 | 16.54g | 0.08 | |||||||||||||||||||||||||||||||||
| ICCV3404 | Veg | 30.67 | 0.47 | 30.33 | 1.36 | 64.31 | 0.36 | 65.89 | 0.19 | 45.01 | 0.48 | 45.14 | 0.17 | 23.90 | 1.57 | 52.85 | 2.35 | 27.70 | 0.29 | 29.28 | 0.17 | ||||||||||||||||||||||||||||||||
| Flw | 31.67 | 0.69 | 33.33 | 2.10 | 64.40 | 0.80 | 67.65 | 1.94 | 52.55a | 1.41 | 59.02h | 0.73 | 46.15f | 0.41 | 47.30d | 1.06 | 15.77e | 0.11 | 16.89g | 0.13 | |||||||||||||||||||||||||||||||||
| ICCV7301 | Veg | 30.00 | 0.22 | 32.00 | 0.45 | 66.33 | 0.40 | 66.87 | 0.27 | 60.34 | 0.23 | 63.08 | 0.15 | 56.60 | 0.34 | 57.95 | 0.29 | 32.06 | 0.80 | 29.75 | 0.11 | ||||||||||||||||||||||||||||||||
| Flw | 29.67 | 0.13 | 30.00 | 0.45 | 63.54 | 0.39 | 65.40 | 0.68 | 66.82h | 0.91 | 64.18i | 0.71 | 45.70i | 2.01 | 55.90h | 0.20 | 15.42e | 0.09 | 18.02h | 0.14 | |||||||||||||||||||||||||||||||||
| ICCV4303 | Veg | 21.67 | 0.47 | 22.67 | 1.13 | 56.48 | 0.59 | 56.76 | 0.23 | 66.67 | 0.22 | 69.77 | 0.14 | 29.20 | 2.31 | 62.05 | 0.29 | 30.26 | 0.97 | 31.59 | 0.21 | ||||||||||||||||||||||||||||||||
| Flw | 21.67 | 0.47 | 33.67 | 3.07 | 58.73 | 0.73 | 61.92 | 0.35 | 58.20i | 1.98 | 65.50i | 0.74 | 44.8g | 2.19 | 56.10i | 0.20 | 16.46h | 0.17 | 18.75h | 0.24 | |||||||||||||||||||||||||||||||||
| ICCV4310 | Veg | 30.33 | 0.34 | 31.00 | 0.22 | 56.27 | 0.28 | 59.59 | 0.16 | 67.10 | 0.35 | 67.87 | 0.16 | 53.30 | 0.39 | 57.40 | 0.29 | 29.60 | 1.01 | 30.61 | 0.21 | ||||||||||||||||||||||||||||||||
| Flw | 32.67 | 1.25 | 33.00 | 0.82 | 60.08 | 0.65 | 61.61 | 0.61 | 62.17j | 1.05 | 61.87j | 0.69 | 52.85b | 0.30 | 51.50g | 0.56 | 16.98h | 0.13 | 18.59h | 0.18 | |||||||||||||||||||||||||||||||||
| ICCV5312 | Veg | 30.67 | 0.27 | 31.67 | 0.47 | 70.89 | 0.80 | 73.60 | 0.14 | 66.18 | 0.61 | 69.58 | 0.16 | 45.40 | 0.80 | 59.75 | 0.26 | 32.02 | 1.16 | 32.05 | 0.50 | ||||||||||||||||||||||||||||||||
| Flw | 34.00 | 1.20 | 34.33 | 0.57 | 68.67 | 1.28 | 72.31 | 0.61 | 65.77k | 0.72 | 69.40k | 0.31 | 54.55j | 0.39 | 56.60i | 0.47 | 16.63h | 0.20 | 17.86c | 0.01 | |||||||||||||||||||||||||||||||||
| ICCV9312 | Veg | 30.00 | 0.22 | 30.00 | 0.22 | 52.14 | 0.43 | 55.88 | 0.23 | 68.59 | 0.41 | 70.21 | 0.18 | 54.45 | 0.39 | 45.60 | 0.89 | 27.81 | 0.23 | 29.57 | 0.11 | ||||||||||||||||||||||||||||||||
| Flw | 30.67 | 0.47 | 32.33 | 1.12 | 52.03 | 0.91 | 57.14 | 0.57 | 51.0g | 1.01 | 66.98f | 0.46 | 40.60e | 2.35 | 51.75g | 0.50 | 16.89h | 0.23 | 17.84c | 0.20 | |||||||||||||||||||||||||||||||||
| ICCV9313 | Veg | 32.33 | 0.34 | 33.33 | 0.72 | 59.84 | 0.17 | 65.78 | 0.15 | 60.42 | 0.39 | 64.95 | 0.12 | 44.30 | 0.84 | 55.15 | 0.18 | 26.67 | 0.16 | 29.75 | 0.16 | ||||||||||||||||||||||||||||||||
| Flw | 33.33 | 0.47 | 35.00 | 0.68 | 58.13 | 0.57 | 66.52 | 0.85 | 56.86l | 0.93 | 60l | 0.92 | 44.30g | 0.83 | 51.85g | 0.87 | 16.48h | 0.29 | 17.86c | 0.23 | |||||||||||||||||||||||||||||||||
| ICCV9314 | Veg | 27.00 | 1.17 | 29.33 | 0.47 | 54.13 | 0.28 | 69.30 | 0.30 | 72.41 | 0.19 | 73.28 | 0.26 | 33.50 | 2.03 | 44.55 | 0.53 | 26.46 | 0.07 | 28.41 | 0.21 | ||||||||||||||||||||||||||||||||
| Flw | 30.33 | 2.15 | 32.67 | 1.51 | 60.08 | 0.91 | 70.07 | 0.36 | 62.67j | 0.81 | 58.82h | 0.81 | 41.60d | 1.04 | 48.45a | 0.35 | 16.46h | 0.06 | 17.84c | 0.24 | |||||||||||||||||||||||||||||||||
| ICCV10313 | Veg | 26.33 | 69.00 | 28.33 | 0.85 | 63.57 | 0.21 | 70.95 | 0.21 | 76.50 | 0.37 | 84.72 | 0.22 | 51.51 | 0.29 | 54.30 | 0.33 | 21.24 | 0.04 | 28.41 | 0.13 | ||||||||||||||||||||||||||||||||
| Flw | 31.00 | 0.23 | 34.67 | 2.10 | 63.33 | 0.79 | 69.54 | 0.18 | 70.06c | 0.51 | 72.14c | 0.57 | 50.85c | 0.19 | 54.45e | 0.35 | 18.19f | 0.29 | 19.21d | 0.25 | |||||||||||||||||||||||||||||||||
| ICCV10 | Veg | 24.67 | 1.24 | 32.33 | 0.34 | 70.59 | 0.33 | 72.59 | 0.17 | 77.62 | 0.38 | 82.73 | 0.10 | 52.20 | 0.21 | 52.60 | 0.73 | 31.27 | 0.15 | 31.09 | 0.28 | ||||||||||||||||||||||||||||||||
| Flw | 31.33 | 1.29 | 34.33 | 0.57 | 75.31 | 0.61 | 78.38 | 0.76 | 70.93c | 0.14 | 78.34m | 0.34 | 50.65c | 0.14 | 53.90c | 0.47 | 17.29c | 0.20 | 20.71f | 0.34 | |||||||||||||||||||||||||||||||||
| ICCV2 | Veg | 30.00 | 0.22 | 30.00 | 0.81 | 44.04 | 0.66 | 48.26 | 0.49 | 55.64 | 0.40 | 68.00 | 0.30 | 46.95 | 0.72 | 56.55 | 0.21 | 26.90 | 0.70 | 30.15 | 0.48 | ||||||||||||||||||||||||||||||||
| Flw | 29.33 | 0.35 | 30.67 | 1.02 | 45.81 | 0.62 | 48.17 | 0.80 | 52.28a | 0.76 | 58.19h | 0.68 | 37.2k | 0.63 | 46.00j | 0.45 | 14.67g | 0.18 | 15.93e | 0.17 | |||||||||||||||||||||||||||||||||
| ICCV92337 | Veg | 27.67 | 0.56 | 28.33 | 0.67 | 65.94 | 0.59 | 67.65 | 0.08 | 64.04 | 0.62 | 65.07 | 0.25 | 44.15 | 0.78 | 47.05 | 0.18 | 29.85 | 0.22 | 30.53 | 0.09 | ||||||||||||||||||||||||||||||||
| Flw | 31.33 | 1.61 | 32.33 | 1.70 | 61.71 | 0.38 | 69.47 | 0.50 | 60.52m | 0.85 | 61.50l | 0.58 | 42.7l | 2.64 | 46.50j | 0.33 | 16.85h | 0.25 | 18.09h | 0.23 | |||||||||||||||||||||||||||||||||
| ICCV8310 | Veg | 32.33 | 0.56 | 30.00 | 0.22 | 52.07 | 0.24 | 56.29 | 0.21 | 68.22 | 0.89 | 72.35 | 0.17 | 46.60 | 0.59 | 49.50 | 0.56 | 24.83 | 0.17 | 30.08 | 0.20 | ||||||||||||||||||||||||||||||||
| Flw | 31.67 | 0.80 | 33.33 | 1.51 | 60.00 | 1.12 | 62.03 | 0.78 | 63.24n | 1.09 | 64.03i | 0.91 | 40.80e | 1.04 | 45.40k | 0.36 | 18.24f | 0.25 | 18.57h | 0.29 | |||||||||||||||||||||||||||||||||
| ICCV97309 | Veg | 22.33 | 0.56 | 28.00 | 0.59 | 77.12 | 0.60 | 78.09 | 0.13 | 65.97 | 0.69 | 68.36 | 0.15 | 41.95 | 1.08 | 52.30 | 0.46 | 26.08 | 0.31 | 30.42 | 0.33 | ||||||||||||||||||||||||||||||||
| Flw | 33.33 | 1.02 | 36.33 | 2.27 | 72.22 | 0.82 | 76.10 | 0.70 | 70c | 0.23 | 74.00d | 0.92 | 45.90i | 1.31 | 52.15l | 0.48 | 19.52d | 0.09 | 20.42f | 0.32 | |||||||||||||||||||||||||||||||||
| ICCV1309 | Veg | 29.00 | 0.22 | 34.33 | 1.02 | 65.15 | 0.60 | 64.21 | 0.32 | 50.00 | 0.27 | 52.15 | 0.16 | 55.05 | 0.90 | 55.30 | 0.32 | 24.65 | 0.11 | 29.89 | 0.17 | ||||||||||||||||||||||||||||||||
| Flw | 31.33 | 0.52 | 34.00 | 1.04 | 59.90 | 0.66 | 61.44 | 0.41 | 53.02a | 1.04 | 60.55l | 0.68 | 44.25g | 1.55 | 46.00j | 1.24 | 15.36e | 0.11 | 17.84c | 0.23 | |||||||||||||||||||||||||||||||||
| ICCV10304 | Veg | 24.33 | 0.69 | 32.33 | 0.56 | 68.96 | 0.62 | 70.80 | 0.14 | 61.92 | 0.26 | 62.63 | 0.16 | 37.15 | 1.84 | 49.75 | 1.17 | 28.16 | 0.31 | 30.10 | 0.09 | ||||||||||||||||||||||||||||||||
| Flw | 30.33 | 0.35 | 32.00 | 0.68 | 68.93 | 0.60 | 70.44 | 0.42 | 65.93k | 11.24 | 56.58a | 0.82 | 37.35k | 0.66 | 43.90k | 0.88 | 16.83h | 0.03 | 17.86c | 0.12 | |||||||||||||||||||||||||||||||||
| ICCV10307 | Veg | 25.33 | 0.56 | 32.67 | 0.34 | 60.82 | 0.20 | 65.02 | 0.28 | 70.65 | 0.30 | 65.02 | 0.25 | 40.50 | 1.10 | 67.10 | 1.39 | 26.92 | 0.12 | 30.68 | 0.13 | ||||||||||||||||||||||||||||||||
| Flw | 30.33 | 0.57 | 33.33 | 0.47 | 67.53 | 1.02 | 68.85 | 0.59 | 61.82m | 1.02 | 65.33i | 1.02 | 40.75e | 1.09 | 44.70m | 0.74 | 16.54h | 0.12 | 17.84c | 0.10 | |||||||||||||||||||||||||||||||||
| ICCV10306 | Veg | 23.00 | 0.81 | 34.00 | 0.59 | 59.82 | 0.28 | 67.35 | 0.30 | 68.04 | 0.93 | 69.67 | 0.05 | 52.60 | 1.38 | 54.75 | 0.86 | 27.41 | 0.12 | 31.28 | 0.24 | ||||||||||||||||||||||||||||||||
| Flw | 29.00 | 0.82 | 35.67 | 0.73 | 55.42 | 1.08 | 64.44 | 0.63 | 62.90n | 0.57 | 69.67m | 0.34 | 48.00m | 0.67 | 50.20n | 0.63 | 16.35h | 0.14 | 17.84c | 0.20 | |||||||||||||||||||||||||||||||||
| ICCV10316 | Veg | 25.00 | 0.67 | 33.33 | 0.34 | 55.73 | 0.21 | 60.50 | 0.35 | 63.47 | 0.46 | 65.13 | 0.24 | 47.00 | 0.30 | 55.40 | 0.65 | 27.09 | 0.21 | 29.51 | 0.30 | ||||||||||||||||||||||||||||||||
| Flw | 29.00 | 0.82 | 35.00 | 0.68 | 62.50 | 0.62 | 65.65 | 0.35 | 66.66k | 1.06 | 68.00m | 0.91 | 48.90m | 0.40 | 51.95g | 0.69 | 16.83h | 0.34 | 17.86c | 0.21 | |||||||||||||||||||||||||||||||||
| ICCV00109 | Veg | 22.67 | 0.47 | 30.33 | 0.34 | 55.17 | 0.56 | 61.76 | 0.16 | 60.26 | 0.26 | 64.46 | 0.29 | 53.30 | 1.25 | 54.85 | 1.31 | 27.88 | 0.35 | 29.46 | 0.10 | ||||||||||||||||||||||||||||||||
| Flw | 28.00 | 0.68 | 31.33 | 0.73 | 60.04 | 1.04 | 63.33 | 0.65 | 58.59 | 1.41 | 60.87l | 0.61 | 44.45g | 1.25 | 49.60o | 1.38 | 16.52h | 0.24 | 17.84c | 0.21 | |||||||||||||||||||||||||||||||||
| ICCV3103 | Veg | 23.33 | 0.34 | 29.00 | 0.22 | 61.61 | 0.31 | 66.84 | 0.17 | 40.67 | 0.26 | 70.82 | 0.13 | 57.20 | 0.46 | 63.05 | 0.31 | 29.88 | 0.14 | 30.53 | 0.07 | ||||||||||||||||||||||||||||||||
| Flw | 25.00 | 0.99 | 29.67 | 0.47 | 64.13 | 0.23 | 65.05 | 0.91 | 48.22 | 0.80 | 60.49l | 0.62 | 47.50n | 0.56 | 48.50a | 1.69 | 16.41h | 0.16 | 17.86c | 0.18 | |||||||||||||||||||||||||||||||||
| ICCV9307 | Veg | 28.00 | 0.45 | 30.67 | 0.34 | 71.14 | 0.28 | 73.04 | 0.26 | 61.75 | 0.32 | 69.43 | 0.18 | 53.95 | 0.45 | 54.35 | 1.48 | 26.75 | 0.14 | 29.82 | 0.35 | ||||||||||||||||||||||||||||||||
| Flw | 30.67 | 0.26 | 32.67 | 0.47 | 70.99 | 0.34 | 72.78 | 0.37 | 58.31i | 0.79 | 68.78m | 0.46 | 50.45c | 0.55 | 53.55c | 0.55 | 18.13f | 0.46 | 18.55h | 0.08 | |||||||||||||||||||||||||||||||||
| ICCV95423 | Veg | 28.00 | 0.39 | 32.33 | 0.47 | 60.33 | 0.27 | 60.81 | 0.39 | 62.33 | 0.23 | 64.65 | 0.21 | 53.40 | 0.67 | 48.50 | 0.28 | 23.32 | 0.14 | 25.24 | 0.30 | ||||||||||||||||||||||||||||||||
| Flw | 29.33 | 0.13 | 32.00 | 0.60 | 65.65 | 0.81 | 66.00 | 0.78 | 63.55n | 0.91 | 66.21 | 0.55 | 43.10o | 1.15 | 46.40j | 0.22 | 15.79e | 0.07 | 17.86c | 0.15 | |||||||||||||||||||||||||||||||||
| ICCV97404 | Veg | 15.67 | 1.16 | 28.33 | 0.34 | 63.84 | 0.44 | 67.02 | 0.33 | 52.91 | 0.53 | 56.50 | 0.13 | 46.20 | 0.50 | 46.30 | 0.16 | 29.57 | 0.19 | 29.42 | 0.21 | ||||||||||||||||||||||||||||||||
| Flw | 25.00 | 0.45 | 30.00 | 0.23 | 60.36 | 0.53 | 62.75 | 0.52 | 53.96a | 0.91 | 59.19l | 0.61 | 42.00l | 0.45 | 45.70k | 0.52 | 15.77e | 0.14 | 16.81g | 0.07 | |||||||||||||||||||||||||||||||||
| ICCV0301 | Veg | 26.67 | 0.34 | 31.33 | 0.72 | 54.29 | 0.49 | 58.50 | 0.40 | 57.64 | 0.87 | 60.32 | 0.15 | 49.75 | 0.28 | 50.35 | 0.38 | 31.34 | 1.07 | 32.04 | 0.27 | ||||||||||||||||||||||||||||||||
| Flw | 27.33 | 0.57 | 31.67 | 0.65 | 55.00 | 0.82 | 56.11 | 0.67 | 56.55f | 0.81 | 63.22n | 0.97 | 46.75f | 0.39 | 49.35o | 0.14 | 15.42e | 0.20 | 16.94g | 0.22 | |||||||||||||||||||||||||||||||||
| ICCV0302 | Veg | 25.33 | 0.56 | 23.00 | 0.81 | 51.96 | 0.21 | 56.25 | 0.24 | 60.00 | 0.45 | 63.73 | 0.09 | 54.60 | 0.18 | 55.15 | 1.17 | 29.86 | 0.99 | 29.88 | 0.05 | ||||||||||||||||||||||||||||||||
| Flw | 26.00 | 0.82 | 25.67 | 0.92 | 52.38 | 0.57 | 57.14 | 0.36 | 55.63e | 1.52 | 62.76n | 0.58 | 41.50d | 0.33 | 47.15d | 0.64 | 14.62g | 0.06 | 16.56g | 0.11 | |||||||||||||||||||||||||||||||||
| ICCV1301 | Veg | 25.00 | 0.59 | 29.00 | 0.22 | 61.67 | 0.21 | 68.12 | 0.24 | 54.78 | 0.61 | 56.16 | 0.10 | 50.00 | 0.05 | 55.95 | 0.31 | 28.04 | 0.83 | 30.39 | 0.20 | ||||||||||||||||||||||||||||||||
| Flw | 26.00 | 0.23 | 29.67 | 0.13 | 66.85 | 0.80 | 69.23 | 0.82 | 54.72e | 1.71 | 60.38l | 1.00 | 44.10g | 1.38 | 45.70k | 2.01 | 15.04e | 0.14 | 16.79g | 0.09 | |||||||||||||||||||||||||||||||||
| L-550 | Veg | 18.67 | 0.52 | 26.67 | 0.56 | 55.78 | 0.45 | 61.76 | 0.22 | 62.61 | 0.31 | 64.46 | 0.17 | 46.70 | 0.52 | 45.95 | 1.45 | 28.18 | 0.93 | 29.66 | 0.22 | ||||||||||||||||||||||||||||||||
| Flw | 24.67 | 0.57 | 27.00 | 0.68 | 52.63 | 0.57 | 57.45 | 0.99 | 57.25f | 1.27 | 63.15n | 0.62 | 42.70l | 0.38 | 47.25d | 1.64 | 16.28h | 0.16 | 16.76g | 0.08 | |||||||||||||||||||||||||||||||||
| ICCV5308 | Veg | 17.00 | 0.81 | 28.33 | 0.34 | 54.55 | 0.48 | 63.04 | 0.39 | 64.81 | 0.42 | 68.00 | 0.16 | 35.00 | 2.36 | 52.10 | 0.42 | 25.35 | 0.60 | 33.02 | 0.60 | ||||||||||||||||||||||||||||||||
| Flw | 20.67 | 0.69 | 29.33 | 0.26 | 57.38 | 0.64 | 60.00 | 1.24 | 60.91m | 0.92 | 67.66f | 0.57 | 39.40p | 0.09 | 47.50d | 1.01 | 15.82e | 0.11 | 16.19g | 0.17 | |||||||||||||||||||||||||||||||||
| ICCV5313 | Veg | 26.67 | 0.47 | 30.33 | 0.34 | 75.31 | 0.67 | 77.13 | 0.14 | 65.28 | 0.48 | 71.49 | 0.21 | 50.75 | 0.19 | 52.30 | 0.99 | 26.84 | 0.27 | 31.28 | 0.11 | ||||||||||||||||||||||||||||||||
| Flw | 30.00 | 0.45 | 30.67 | 0.26 | 72.41 | 0.86 | 73.91 | 1.01 | 61.12m | 1.10 | 73.46d | 0.51 | 51.40q | 0.31 | 54.55e | 0.39 | 18.52f | 0.18 | 18.70h | 0.19 | |||||||||||||||||||||||||||||||||
| B | |||||||||||||||||||||||||||||||||||||||||||||||||||||
| Days to Flowering | Days to Maturity | SB | |||||||||||||||||||||||||||||||||||||||||||||||||||
| Drought | Control | Drought | Control | Drought | Control | ||||||||||||||||||||||||||||||||||||||||||||||||
| Mean | SE | Mean | SE | Mean | SE | Mean | SE | Mean | SE | Mean | SE | ||||||||||||||||||||||||||||||||||||||||||
| ICC1882 | Veg | 125.00a | 0.47 | 110.00a | 0.69 | ||||||||||||||||||||||||||||||||||||||||||||||||
| Flw | 92.67a | 0.13 | 128.00a | 0.22 | 0.67a | 0.13 | 1.67a | 0.13 | |||||||||||||||||||||||||||||||||||||||||||||
| ICC4958 | Veg | 110.00b | 0.47 | 109.00a | 0.79 | ||||||||||||||||||||||||||||||||||||||||||||||||
| Flw | 81.00b | 0.45 | 124.67b | 0.13 | 3.00b | 0.00 | 3.67b | 0.13 | |||||||||||||||||||||||||||||||||||||||||||||
| PUSA1103 | Veg | 109.00c | 0.79 | 107.00a | 0.72 | ||||||||||||||||||||||||||||||||||||||||||||||||
| Flw | 87.00c | 0.81 | 126.00c | 0.22 | 2.67c | 0.13 | 3.00c | 0.22 | |||||||||||||||||||||||||||||||||||||||||||||
| BGD72 | Veg | 111.00b | 0.56 | 110.00a | 0.59 | ||||||||||||||||||||||||||||||||||||||||||||||||
| Flw | 94.33a | 1.16 | 125.33d | 0.13 | 2.67c | 0.13 | 3.33c | 0.13 | |||||||||||||||||||||||||||||||||||||||||||||
| P-1003 | Veg | 111.33b | 0.59 | 106.66a | 0.47 | ||||||||||||||||||||||||||||||||||||||||||||||||
| Flw | 101.00e | 0.59 | 128.67a | 0.13 | 1.00d | 0.22 | 2.00d | 0.22 | |||||||||||||||||||||||||||||||||||||||||||||
| CSG8962 | Veg | 100.00d | 0.59 | 96.00b | 0.81 | ||||||||||||||||||||||||||||||||||||||||||||||||
| Flw | 84.00b | 0.81 | 125.67d | 0.13 | 2.33c | 0.13 | 2.67d | 0.13 | |||||||||||||||||||||||||||||||||||||||||||||
| C-235 | Veg | 73.00e | 0.22 | 76.00c | 0.45 | ||||||||||||||||||||||||||||||||||||||||||||||||
| Flw | 100.00d | 0.59 | 128.00a | 0.22 | 1.00d | 0.22 | 1.67a | 0.13 | |||||||||||||||||||||||||||||||||||||||||||||
| ICCV3310 | Veg | 44.00f | 0.59 | 79.00c | 0.72 | ||||||||||||||||||||||||||||||||||||||||||||||||
| Flw | 98.00d | 0.59 | 129.33e | 0.13 | 1.33d | 0.26 | 2.00d | 0.22 | |||||||||||||||||||||||||||||||||||||||||||||
| ICCV3311 | Veg | 45.00f | 0.59 | 79.00c | 0.56 | ||||||||||||||||||||||||||||||||||||||||||||||||
| Flw | 90.00a | 0.45 | 126.33c | 0.13 | 2.00c | 0.22 | 2.67d | 0.13 | |||||||||||||||||||||||||||||||||||||||||||||
| ICCV3403 | Veg | 59.00g | 0.69 | 79.00c | 1.24 | ||||||||||||||||||||||||||||||||||||||||||||||||
| Flw | 99.00d | 0.22 | 128.00a | 0.22 | 1.67d | 0.26 | 2.00d | 0.22 | |||||||||||||||||||||||||||||||||||||||||||||
| ICCV3404 | Veg | 62.00h | 1.03 | 76.00c | 0.22 | ||||||||||||||||||||||||||||||||||||||||||||||||
| Flw | 101.33e | 0.72 | 128.33a | 0.26 | 1.33d | 0.13 | 2.33d | 0.26 | |||||||||||||||||||||||||||||||||||||||||||||
| ICCV7301 | Veg | 64.00h | 0.56 | 88.00d | 0.69 | ||||||||||||||||||||||||||||||||||||||||||||||||
| Flw | 97.00d | 0.98 | 125.00d | 0.22 | 1.67d | 0.26 | 2.00d | 0.00 | |||||||||||||||||||||||||||||||||||||||||||||
| ICCV4303 | Veg | 49.00i | 0.34 | 79.00c | 0.22 | ||||||||||||||||||||||||||||||||||||||||||||||||
| Flw | 95.67d | 0.91 | 128.00a | 0.22 | 1.67d | 0.26 | 2.00d | 0.22 | |||||||||||||||||||||||||||||||||||||||||||||
| ICCV4310 | Veg | 46.33i | 0.52 | 71.00g | 0.72 | ||||||||||||||||||||||||||||||||||||||||||||||||
| Flw | 101.33e | 0.47 | 123.00e | 0.13 | 1.67d | 0.13 | 2.33d | 0.13 | |||||||||||||||||||||||||||||||||||||||||||||
| ICCV5312 | Veg | 46.50i | 0.56 | 75.00g | 0.34 | ||||||||||||||||||||||||||||||||||||||||||||||||
| Flw | 100.67e | 0.47 | 128.00a | 0.22 | 2.00c | 0.22 | 3.33c | 0.13 | |||||||||||||||||||||||||||||||||||||||||||||
| ICCV9312 | Veg | 52.00j | 0.47 | 73.00g | 0.47 | ||||||||||||||||||||||||||||||||||||||||||||||||
| Flw | 97.67d | 0.72 | 126.00c | 0.13 | 1.33d | 0.13 | 1.67a | 0.26 | |||||||||||||||||||||||||||||||||||||||||||||
| ICCV9313 | Veg | 49.00i | 0.34 | 82.00e | 0.34 | ||||||||||||||||||||||||||||||||||||||||||||||||
| Flw | 93.00a | 0.59 | 129.67e | 0.22 | 1.00d | 0.22 | 1.33a | 0.26 | |||||||||||||||||||||||||||||||||||||||||||||
| ICCV9314 | Veg | 47.00i | 0.59 | 80.00e | 0.34 | ||||||||||||||||||||||||||||||||||||||||||||||||
| Flw | 97.67d | 0.56 | 130.33f | 0.34 | 1.00d | 0.22 | 2.00d | 0.00 | |||||||||||||||||||||||||||||||||||||||||||||
| ICCV10313 | Veg | 48.00i | 0.34 | 78.00c | 0.56 | ||||||||||||||||||||||||||||||||||||||||||||||||
| Flw | 91.00a | 0.81 | 125.67d | 0.34 | 2.00c | 0.22 | 2.67d | 0.13 | |||||||||||||||||||||||||||||||||||||||||||||
| ICCV10 | Veg | 104.00d | 0.47 | 90.00d | 0.45 | ||||||||||||||||||||||||||||||||||||||||||||||||
| Flw | 91.00a | 0.39 | 126.33c | 0.13 | 2.67c | 0.13 | 3.00c | 0.00 | |||||||||||||||||||||||||||||||||||||||||||||
| ICCV2 | Veg | 43.00f | 0.45 | 73.00g | 0.81 | ||||||||||||||||||||||||||||||||||||||||||||||||
| Flw | 101.67e | 0.85 | 127.00f | 0.47 | 0.67a | 0.13 | 1.00a | 0.22 | |||||||||||||||||||||||||||||||||||||||||||||
| ICCV92337 | Veg | 74.00e | 0.34 | 71.00g | 0.45 | ||||||||||||||||||||||||||||||||||||||||||||||||
| Flw | 98.33d | 0.47 | 128.00a | 0.39 | 1.00d | 0.22 | 1.67a | 0.13 | |||||||||||||||||||||||||||||||||||||||||||||
| ICCV8310 | Veg | 43.00f | 0.22 | 71.00g | 0.94 | ||||||||||||||||||||||||||||||||||||||||||||||||
| Flw | 99.00d | 0.22 | 122.67g | 0.34 | 1.33d | 0.13 | 1.33a | 0.34 | |||||||||||||||||||||||||||||||||||||||||||||
| ICCV97309 | Veg | 68.00k | 0.34 | 64.00f | 0.56 | ||||||||||||||||||||||||||||||||||||||||||||||||
| Flw | 91.00a | 0.59 | 124.67b | 0.34 | 2.33c | 0.13 | 3.00c | 0.22 | |||||||||||||||||||||||||||||||||||||||||||||
| ICCV1309 | Veg | 42.33f | 0.56 | 74.00e | 0.79 | ||||||||||||||||||||||||||||||||||||||||||||||||
| Flw | 97.33d | 0.69 | 126.67c | 0.26 | 1.33d | 0.13 | 1.33d | 0.26 | |||||||||||||||||||||||||||||||||||||||||||||
| ICCV10304 | Veg | 46.00i | 0.81 | 75.00g | 0.34 | ||||||||||||||||||||||||||||||||||||||||||||||||
| Flw | 98.67d | 0.34 | 125.00d | 0.22 | 1.00d | 0.22 | 2.00d | 0.22 | |||||||||||||||||||||||||||||||||||||||||||||
| ICCV10307 | Veg | 44.00f | 0.81 | 71.00g | 0.72 | ||||||||||||||||||||||||||||||||||||||||||||||||
| Flw | 99.00d | 0.22 | 125.00d | 0.22 | 1.33d | 0.13 | 1.67d | 0.13 | |||||||||||||||||||||||||||||||||||||||||||||
| ICCV10306 | Veg | 41.00f | 0.56 | 73.00g | 0.34 | ||||||||||||||||||||||||||||||||||||||||||||||||
| Flw | 95.33d | 0.85 | 126.00c | 0.22 | 1.33d | 0.13 | 2.00d | 0.00 | |||||||||||||||||||||||||||||||||||||||||||||
| ICCV10316 | Veg | 58.00g | 0.67 | 81.00e | 0.45 | ||||||||||||||||||||||||||||||||||||||||||||||||
| Flw | 91.00a | 0.81 | 126.67c | 0.52 | 1.67d | 0.13 | 2.00d | 0.22 | |||||||||||||||||||||||||||||||||||||||||||||
| ICCV00109 | Veg | 75.50l | 0.22 | 91.00h | 0.85 | ||||||||||||||||||||||||||||||||||||||||||||||||
| Flw | 99.67d | 0.47 | 126.00c | 0.22 | 1.33d | 0.13 | 1.00a | 0.22 | |||||||||||||||||||||||||||||||||||||||||||||
| ICCV3103 | Veg | 102.00d | 0.79 | 92.00h | 0.34 | ||||||||||||||||||||||||||||||||||||||||||||||||
| Flw | 97.33d | 0.56 | 127.33f | 0.47 | 1.33d | 0.34 | 0.67e | 0.26 | |||||||||||||||||||||||||||||||||||||||||||||
| ICCV9307 | Veg | 51.00j | 0.13 | 79.00c | 0.47 | ||||||||||||||||||||||||||||||||||||||||||||||||
| Flw | 95.67d | 0.69 | 129.33e | 0.34 | 2.67c | 0.13 | 2.67d | 0.13 | |||||||||||||||||||||||||||||||||||||||||||||
| ICCV95423 | Veg | 107.00b | 0.56 | 93.00h | 0.56 | ||||||||||||||||||||||||||||||||||||||||||||||||
| Flw | 99.67d | 0.47 | 127.00f | 0.39 | 1.33d | 0.26 | 1.33a | 0.13 | |||||||||||||||||||||||||||||||||||||||||||||
| ICCV97404 | Veg | 107.00b | 0.47 | 64.00f | 0.45 | ||||||||||||||||||||||||||||||||||||||||||||||||
| Flw | 98.00d | 0.59 | 125.00d | 0.22 | 1.00d | 0.22 | 1.33a | 0.13 | |||||||||||||||||||||||||||||||||||||||||||||
| ICCV0301 | Veg | 43.00f | 0.91 | 70.00g | 0.56 | ||||||||||||||||||||||||||||||||||||||||||||||||
| Flw | 99.00d | 0.90 | 124.00b | 0.22 | 0.67a | 0.13 | 0.67e | 0.13 | |||||||||||||||||||||||||||||||||||||||||||||
| ICCV0302 | Veg | 43.00f | 0.81 | 75.00g | 0.72 | ||||||||||||||||||||||||||||||||||||||||||||||||
| Flw | 99.33d | 1.02 | 128.00a | 0.22 | 0.67a | 0.13 | 0.67e | 0.26 | |||||||||||||||||||||||||||||||||||||||||||||
| ICCV1301 | Veg | 46.00i | 0.47 | 70.00g | 0.45 | ||||||||||||||||||||||||||||||||||||||||||||||||
| Flw | 101.33e | 0.34 | 127.00 | 0.22 | 0.67a | 0.13 | 1.00a | 0.22 | |||||||||||||||||||||||||||||||||||||||||||||
| L-550 | Veg | 108.00b | 0.39 | 107.00a | 0.45 | ||||||||||||||||||||||||||||||||||||||||||||||||
| Flw | 85.33c | 0.56 | 127.33 | 0.34 | 1.00d | 0.22 | 1.33a | 0.26 | |||||||||||||||||||||||||||||||||||||||||||||
| ICCV5308 | Veg | 41.00b | 0.72 | 71.00g | 0.47 | ||||||||||||||||||||||||||||||||||||||||||||||||
| Flw | 101.00e | 0.59 | 127.00 | 0.22 | 0.67a | 0.13 | 1.33a | 0.13 | |||||||||||||||||||||||||||||||||||||||||||||
| ICCV5313 | Veg | 45.00i | 0.22 | 68.00g | 0.59 | ||||||||||||||||||||||||||||||||||||||||||||||||
| Flw | 88.33c | 0.34 | 128.00 | 0.39 | 1.67d | 0.13 | 2.00d | 0.22 | |||||||||||||||||||||||||||||||||||||||||||||
| C | |||||||||||||||||||||||||||||||||||||||||||||||||||||
| Yield Traits | |||||||||||||||||||||||||||||||||||||||||||||||||||||
| Irrigated Conditions | Drought Stressed Conditions | ||||||||||||||||||||||||||||||||||||||||||||||||||||
| Biomass (gms) | 100 SW (gms) | FPP | SPP | PY (gms) | Biomass (gms) | 100 SW (gms) | FPP | SPP | PY (gms) | ||||||||||||||||||||||||||||||||||||||||||||
| Genotypes | Avg | SE | Avg | SE | Avg | SE | Avg | SE | Avg | SE | Avg | SE | Avg | SE | Avg | SE | Avg | SE | Avg | SE | |||||||||||||||||||||||||||||||||
| ICC1882 | 689.48a | 0.55 | 17.65a | 0.53 | 26.00a | 0.00 | 1.32a | 0.00 | 216.77 | 0.12 | 612.99a | 1.51 | 14.91 | 0.04 | 23.66a | 0.00 | 1.05a | 0.00 | 164.73a | 0.16 | |||||||||||||||||||||||||||||||||
| ICC4958 | 730.66b | 0.54 | 28.72b | 0.53 | 25.66a | 0.00 | 1.17a | 0.00 | 185.23 | 0.12 | 672.13a | 1.51 | 25.18 | 0.04 | 22.36a | 0.00 | 1.12a | 0.00 | 177.40a | 0.16 | |||||||||||||||||||||||||||||||||
| Pusa1103 | 518.03c | 0.55 | 21.97c | 0.53 | 28.33b | 0.00 | 0.88b | 0.00 | 248.27 | 0.12 | 426.82b | 1.54 | 17.87 | 0.04 | 25.33b | 0.00 | 0.81b | 0.00 | 226.97b | 0.17 | |||||||||||||||||||||||||||||||||
| BGD72 | 588.55d | 0.57 | 16.39d | 0.52 | 31.00c | 0.00 | 1.00a | 0.00 | 461.43 | 0.12 | 591.53c | 1.57 | 14.13 | 0.04 | 24.66b | 0.00 | 0.87b | 0.00 | 401.43c | 0.15 | |||||||||||||||||||||||||||||||||
| Pusa1003 | 420.63d | 0.58 | 16.58d | 0.51 | 18.33d | 0.01 | 0.35c | 0.00 | 144.73 | 0.12 | 120.83d | 1.61 | 13.63 | 0.04 | 13.00c | 0.01 | 0.28c | 0.00 | 62.50d | 0.15 | |||||||||||||||||||||||||||||||||
| CSG8962 | 694.78a | 0.60 | 11.19e | 0.51 | 34.33e | 0.00 | 0.97d | 0.00 | 241.40 | 0.13 | 374.27e | 1.66 | 10.53 | 0.04d | 31.00d | 0.01 | 0.78d | 0.00 | 214.30b | 0.15 | |||||||||||||||||||||||||||||||||
| C235 | 320.87a | 0.62 | 14.22f | 0.51 | 35.67e | 0.00 | 0.40c | 0.00 | 143.70 | 0.13 | 108.67d | 0.53 | 10.80 | 0.04 | 28.66e | 0.00 | 0.35e | 0.00 | 47.60d | 0.15 | |||||||||||||||||||||||||||||||||
| ICCV3310 | 463.10d | 0.63 | 33.17g | 0.49 | 22.66f | 0.00 | 0.34c | 0.00 | 120.59 | 0.13 | 56.43f | 0.54 | 28.00 | 0.04 | 18.66f | 0.00 | 0.31e | 0.00 | 45.84d | 0.15 | |||||||||||||||||||||||||||||||||
| ICCV3311 | 520.14c | 0.64 | 30.59h | 0.45 | 32.00g | 0.00 | 0.16e | 0.00 | 114.52 | 0.13 | 155.40d | 0.55 | 22.90 | 0.04 | 27.00g | 0.00 | 0.13f | 0.00 | 95.87d | 0.16 | |||||||||||||||||||||||||||||||||
| ICCV3403 | 472.29d | 0.66 | 30.94h | 0.45 | 23.33h | 0.00 | 0.18e | 0.00 | 145.80 | 0.13 | 53.67f | 0.56 | 25.04 | 0.04 | 16.66h | 0.00 | 0.17f | 0.00 | 116.74a | 0.16 | |||||||||||||||||||||||||||||||||
| ICCV3404 | 463.07d | 0.68 | 38.71i | 0.45 | 39.33i | 0.00 | 0.16e | 0.00 | 168.25 | 0.14 | 121.30d | 0.57 | 30.46 | 0.04 | 32.33d | 0.00 | 0.14f | 0.00 | 120.72a | 0.16 | |||||||||||||||||||||||||||||||||
| ICCV7301 | 363.88e | 0.70 | 37.30j | 0.45 | 19.00j | 0.00 | 0.27f | 0.00 | 155.70 | 0.14 | 121.30d | 0.59 | 24.55 | 0.04 | 14.00d | 0.00 | 0.14f | 0.00 | 74.65d | 0.16 | |||||||||||||||||||||||||||||||||
| ICCV4303 | 539.35c | 0.72 | 35.96k | 0.44 | 24.00k | 0.00 | 0.38c | 0.00 | 130.05 | 0.14 | 40.53f | 0.61 | 30.96 | 0.04 | 14.00d | 0.00 | 0.32e | 0.00 | 78.26d | 0.16 | |||||||||||||||||||||||||||||||||
| ICCV4310 | 284.78f | 0.73 | 33.61g | 0.44 | 32.33g | 0.00 | 0.37c | 0.00 | 128.42 | 0.14 | 101.30d | 0.62 | 25.85 | 0.04 | 22.00a | 0.01 | 0.34e | 0.00 | 58.03d | 0.17 | |||||||||||||||||||||||||||||||||
| ICCV5312 | 467.56d | 0.74 | 35.72k | 0.44 | 32.00g | 0.00 | 0.18e | 0.00 | 50.43 | 0.14 | 73.73f | 0.63 | 30.16 | 0.05 | 28.00e | 0.00 | 0.20f | 0.00 | 41.73d | 0.17 | |||||||||||||||||||||||||||||||||
| ICCV9312 | 380.00e | 0.75 | 37.29j | 0.44 | 19.66j | 0.01 | 0.36c | 0.00 | 125.41 | 0.15 | 227.37g | 0.64 | 30.66 | 0.05 | 15.33d | 0.01 | 0.27c | 0.00 | 63.81d | 0.17 | |||||||||||||||||||||||||||||||||
| ICCV9313 | 461.07d | 0.76 | 39.24l | 0.43 | 37.33l | 0.00 | 0.24f | 0.00 | 71.61 | 0.15 | 304.43e | 0.66 | 31.91 | 0.05 | 43.00h | 0.00 | 0.22c | 0.00 | 61.90d | 0.17 | |||||||||||||||||||||||||||||||||
| ICCV9314 | 354.60e | 0.78 | 36.45m | 0.41 | 62.33m | 0.00 | 0.22f | 0.00 | 183.34 | 0.15 | 122.63d | 0.69 | 30.45 | 0.05 | 56.33i | 0.00 | 0.18f | 0.00 | 168.85d | 0.17 | |||||||||||||||||||||||||||||||||
| ICCV10313 | 699.37a | 0.80 | 37.56j | 0.41 | 37.00l | 0.00 | 0.23f | 0.00 | 365.70 | 0.15 | 368.67e | 0.72 | 31.96 | 0.05 | 30.33d | 0.00 | 0.21c | 0.00 | 253.41b | 0.18 | |||||||||||||||||||||||||||||||||
| ICCV10 | 361.40e | 0.82 | 19.61n | 0.40 | 64.33n | 0.00 | 0.35c | 0.00 | 161.90 | 0.16 | 212.07g | 0.72 | 16.15 | 0.05 | 55.50j | 0.01 | 0.30e | 0.00 | 134.77a | 0.18 | |||||||||||||||||||||||||||||||||
| ICCV2 | 703.19b | 0.86 | 21.92c | 0.36 | 49.83o | 0.00 | 0.35c | 0.00 | 167.59 | 0.17 | 311.50e | 0.76 | 17.53 | 0.05 | 44.33h | 0.01 | 0.34e | 0.00 | 132.14a | 0.18 | |||||||||||||||||||||||||||||||||
| ICCV92337 | 422.85d | 0.89 | 30.93h | 0.36 | 47.33p | 0.00 | 0.19e | 0.00 | 85.28 | 0.18 | 164.93d | 0.80 | 25.87 | 0.05 | 42.5h | 0.01 | 0.17f | 0.00 | 75.99d | 0.19 | |||||||||||||||||||||||||||||||||
| ICCV8310 | 356.75e | 0.94 | 30.22h | 0.36 | 60.33q | 0.00 | 0.27f | 0.00 | 88.54 | 0.18 | 268.10g | 0.81 | 22.99 | 0.05 | 59.16k | 0.00 | 0.24c | 0.00 | 51.87d | 0.19 | |||||||||||||||||||||||||||||||||
| ICCV97309 | 687.49a | 0.97 | 24.66o | 0.36 | 34.00l | 0.00 | 0.27f | 0.00 | 146.44 | 0.19 | 310.37e | 0.73 | 20.25 | 0.06 | 30.66d | 0.00 | 0.23c | 0.00 | 136.99a | 0.20 | |||||||||||||||||||||||||||||||||
| ICCV1309 | 854.00f | 1.02 | 30.97h | 0.32 | 29.66b | 0.00 | 0.32c | 0.00 | 150.36 | 0.20 | 79.37f | 0.75 | 28.17 | 0.06 | 22.66a | 0.00 | 0.29c | 0.00 | 73.76d | 0.21 | |||||||||||||||||||||||||||||||||
| ICCV10304 | 382.70e | 1.01 | 22.68p | 0.30 | 26.00a | 0.00 | 0.29f | 0.00 | 78.86 | 0.21 | 173.07d | 0.77 | 17.51 | 0.06 | 22.00a | 0.01 | 0.24c | 0.00 | 66.93d | 0.22 | |||||||||||||||||||||||||||||||||
| ICCV10307 | 456.63d | 0.94 | 35.24k | 0.30 | 77.33r | 0.00 | 0.21f | 0.00 | 81.10 | 0.18 | 304.83e | 0.81 | 30.43 | 0.06 | 59.00k | 0.01 | 0.17f | 0.00 | 62.54d | 0.23 | |||||||||||||||||||||||||||||||||
| ICCV10306 | 398.42e | 1.01 | 35.53k | 0.28 | 21.00f | 0.00 | 0.36c | 0.00 | 104.67 | 0.18 | 153.27d | 0.86 | 28.87 | 0.07 | 20.33l | 0.00 | 0.34e | 0.00 | 75.00d | 0.24 | |||||||||||||||||||||||||||||||||
| ICCV10316 | 447.18d | 1.05 | 41.76q | 0.28 | 37.33l | 0.00 | 0.16e | 0.00 | 138.47 | 0.19 | 410.40b | 0.89 | 34.46 | 0.07 | 31.33d | 0.00 | 0.12f | 0.00 | 74.83d | 0.26 | |||||||||||||||||||||||||||||||||
| ICCV00109 | 474.56d | 1.07 | 20.87r | 0.28 | 18.66j | 0.00 | 0.33c | 0.00 | 153.94 | 0.19 | 282.10g | 0.94 | 17.55 | 0.07 | 17.33f | 0.00 | 0.29c | 0.00 | 54.35d | 0.28 | |||||||||||||||||||||||||||||||||
| ICCV3103 | 311.67e | 1.17 | 25.43s | 0.28 | 35.33e | 0.00 | 0.32c | 0.00 | 106.88 | 0.18 | 198.43d | 1.02 | 19.16 | 0.08 | 33.33d | 0.00 | 0.28c | 0.00 | 59.96d | 0.27 | |||||||||||||||||||||||||||||||||
| ICCV9307 | 408.30d | 1.25 | 38.95t | 0.27 | 25.66a | 0.00 | 0.16e | 0.00 | 117.61 | 0.18 | 165.93d | 1.09 | 33.84 | 0.08 | 16.00m | 0.00 | 0.14f | 0.00 | 54.51d | 0.26 | |||||||||||||||||||||||||||||||||
| ICCV95423 | 391.07e | 1.34 | 27.37u | 0.27 | 21.67f | 0.00 | 0.44g | 0.00 | 417.28 | 0.19 | 212.27g | 1.16 | 23.14 | 0.08 | 23.00a | 0.00 | 0.41g | 0.00 | 156.54a | 0.29 | |||||||||||||||||||||||||||||||||
| ICCV97404 | 655.73a | 1.34 | 25.46s | 0.27 | 35.66e | 0.01 | 0.62h | 0.00 | 237.00 | 0.22 | 320.30e | 1.30 | 18.73 | 0.09 | 37.33n | 0.00 | 0.52h | 0.00 | 159.55a | 0.33 | |||||||||||||||||||||||||||||||||
| ICCV0301 | 568.00c | 1.13 | 17.96a | 0.27 | 31.33g | 0.00 | 0.31c | 0.00 | 120.93 | 0.18 | 130.57d | 1.48 | 13.22 | 0.11 | 24.67o | 0.00 | 0.27c | 0.00 | 49.01d | 0.38 | |||||||||||||||||||||||||||||||||
| ICCV0302 | 413.11d | 0.88 | 31.17v | 0.25 | 38.00s | 0.00 | 0.26f | 0.00 | 121.03 | 0.21 | 141.63d | 1.75 | 24.67 | 0.11 | 35.00p | 0.00 | 0.24c | 0.00 | 58.29d | 0.37 | |||||||||||||||||||||||||||||||||
| ICCV1301 | 349.85e | 1.05 | 26.54w | 0.20 | 46.00t | 0.00 | 0.19e | 0.00 | 123.51 | 0.16 | 205.27g | 2.09 | 21.13 | 0.06 | 43.33h | 0.00 | 0.19f | 0.00 | 119.07a | 0.44 | |||||||||||||||||||||||||||||||||
| L550 | 695.48a | 0.95 | 17.73a | 0.20 | 50.33u | 0.00 | 1.31a | 0.00 | 162.17 | 0.19 | 619.32a | 2.66 | 15.91 | 0.07 | 46.16q | 0.00 | 1.19a | 0.01 | 73.99d | 0.28 | |||||||||||||||||||||||||||||||||
| ICCV5308 | 135.88g | 1.30 | 37.67j | 0.20 | 40.00i | 0.00 | 0.44g | 0.00 | 275.79 | 0.23 | 73.60f | 1.67 | 29.98 | 0.09 | 34.67d | 0.00 | 0.42g | 0.00 | 246.78b | 0.23 | |||||||||||||||||||||||||||||||||
| ICCV5313 | 416.07d | 1.53 | 33.72g | 0.02 | 40.00i | 0.00 | 0.35c | 0.00 | 191.71 | 0.30 | 90.67f | 2.86 | 29.76 | 0.06 | 37.33n | 0.00 | 0.32e | 0.00 | 115.41a | 0.37 | |||||||||||||||||||||||||||||||||
| Traits | Vegetative | Reproductive | ||||
|---|---|---|---|---|---|---|
| Control | Stress | % Decrease | Control | Stress | % Decrease | |
| Plant height (cm) | 30.48 | 26.79 | 12.10 | 32.56 | 29.55 | 9.23 |
| Membrane stability index | 64.98 | 61.66 | 5.12 | 65.31 | 62.03 | 5.02 |
| Relative water content | 66.82 | 46.78 | 29.99 | 65.82 | 62.21 | 5.48 |
| Chlorophyll index (SPAD units) | 53.38 | 46.99 | 11.97 | 50.01 | 45.36 | 9.30 |
| Protein content | 29.98 | 26.55 | 11.44 | 17.36 | 16.19 | 6.72 |
| Days to flowering (DF) | 70.25 | 65.33 | 7.00 | |||
| Days to maturity (DM) | 119.21 | 103.99 | 12.87 | |||
| Biomass | 46.38 | 32.91 | 29.04 | |||
| 100 seed weight | 28.74 | 25.29 | 12.00 | |||
| Filled pods per plant (FPP) | 35 | 30 | 14.28 | |||
| Seeds per plant (SPP) | 1.08 | 1.03 | 4.34 | |||
| Plant Yield (gms) | 16.55 | 11.05 | 33.23 | |||
Publisher’s Note: MDPI stays neutral with regard to jurisdictional claims in published maps and institutional affiliations. |
© 2022 by the authors. Licensee MDPI, Basel, Switzerland. This article is an open access article distributed under the terms and conditions of the Creative Commons Attribution (CC BY) license (https://creativecommons.org/licenses/by/4.0/).
Share and Cite
Sachdeva, S.; Bharadwaj, C.; Patil, B.S.; Pal, M.; Roorkiwal, M.; Varshney, R.K. Agronomic Performance of Chickpea Affected by Drought Stress at Different Growth Stages. Agronomy 2022, 12, 995. https://0-doi-org.brum.beds.ac.uk/10.3390/agronomy12050995
Sachdeva S, Bharadwaj C, Patil BS, Pal M, Roorkiwal M, Varshney RK. Agronomic Performance of Chickpea Affected by Drought Stress at Different Growth Stages. Agronomy. 2022; 12(5):995. https://0-doi-org.brum.beds.ac.uk/10.3390/agronomy12050995
Chicago/Turabian StyleSachdeva, Supriya, Chellapilla Bharadwaj, Basavanagouda Siddanagouda Patil, Madan Pal, Manish Roorkiwal, and Rajeev K. Varshney. 2022. "Agronomic Performance of Chickpea Affected by Drought Stress at Different Growth Stages" Agronomy 12, no. 5: 995. https://0-doi-org.brum.beds.ac.uk/10.3390/agronomy12050995