Article

Delayed Sowing Date Improves Rice Cooking and Taste Quality by Regulating the Quantity and Quality of Grains Located on Secondary Branches

1
College of Agronomy, Nanjing Agricultural University, Nanjing 210014, China
2
Key Laboratory of Crop Physiology Ecology and Production Management, Ministry of Agriculture, Nanjing 210014, China
3
Jiangsu Collaborative Innovation Center for Modern Crop Production, Nanjing 210014, China
4
Institute of Food Crops, Jiangsu Academy of Agricultural Sciences, Nanjing 210014, China
5
School of Life Science and Food Engineering, Huaiyin Institute of Technology, Huai’an 223003, China
6
National Engineering and Technology Center for Information Agriculture, Nanjing 210014, China
*
Author to whom correspondence should be addressed.
Submission received: 16 April 2022 / Revised: 26 May 2022 / Accepted: 27 May 2022 / Published: 30 May 2022
(This article belongs to the Special Issue Crop Yield and Quality Response to Cultivation Practices)

Abstract

:
Grains located on different positions of the panicle differed in grain weight and quality performance, however, the comprehensive effect of sowing dates on physiological and quantitative characteristics of grains located on different positions still remains unclear. In this study, a field experiment was conducted with two japonica rice cultivars, Nanjing 9108 and Ningjing 7, under 3 sowing dates (S1, 30th April; S2, 30th May; S3, 30th June). Delayed sowing treatments increased before-heading mean temperature (Tmean), day temperature (Tday), night temperature (Tnight) and mean solar radiation (Smean) for 0.94 °C, 0.99 °C, 1.23 °C, and 1.04 MJ, respectively, while decreased growth duration (GD) for 13.4 days, with 30 days delaying sowing date. Elevated before heading thermal resources and shortened GD contributed to enlarged panicle size via enhancing number of grains on secondary branches (SG) and led to higher ratio of SG per unit area (SG%). Meanwhile, delayed sowing decreased after heading Tmean, Tday, Tnight and Smean by 0.84 °C, 1.23 °C, 1.13 °C, and 2.12 MJ, respectively, with 30 days delaying sowing, and further enhanced rice stickiness (ST), peak viscosity (PKV) and breakdown (BD), but suppressed hardness (HD), amylose content (AC), cold pasting viscosity (CPV), hot pasting viscosity (HPV) and setback (SB) of SG, whilst grains on primary branches (PG) di no significant differences. Elevated taste and cooking quality of SG under delayed sowing was regulated by slower grain filling rate, which is largely regulated by AGPase and GBSS. Compared to PG, SG has better physiochemical, texture properties and RVA profiles due to its slower starch biosynthesis. The above results suggested that physiological (starch biosynthesis of SG) and quantitative parameters (amount of SG) of the rice population should be referred simultaneously to improve rice cooking and taste quality.

1. Introduction

Rice (Oryza sativa L.), one of the global staple crops, has made a great contribution to the development of China’s national economy. Nowadays, it is important to enhance rice cooking and taste quality (CTQ) to meet the increasing demand from market. Rice quality is directly determined by grain filling of rice spikelets, which is largely regulated by changing environments, like temperature, light and water. Adverse reproductive stage environments remarkably decrease rice quality by affecting starch biosynthesis process. Elevated filling stage temperature shortens the filling duration, causes imbalance in sources-sink dynamics, and leads to higher chalkiness, which plays as a key factor in rice appearance, processing and taste quality.
Adjusting sowing date is one of the most useful cultivation strategies to regulate rice yield and quality via altering filling stage thermal resources, including temperature and solar radiation. Our previous work demonstrated that delayed sowing date treatment led to lower starch biosynthesis in inferior grains hence lowered the grain yield to resulting in inferior grains with lower grain yield [1]. Similarly, Wang et al., 2021 reported that sowing date treatments largely changed grain filling temperature and regulated enzyme activities in two rice varieties, which further led to alteration in quality [2]. Ding et al., 2020 and Deng et al., 2015 suggested that delayed sowing improves the milling, cooking and texture quality of rice via decreasing reproductive stage air temperature [3,4]. Zhou et al., 2021 reported that grain yield of good eating rice decreased with delayed sowing dates from May 10th till June 21st due to the reduction in effective accumulative temperature [5].
Rice starch is the major basis of rice endosperm and has two main components: amylose and amylopectin. The content of amylose and amylopectin largely determine rice physiochemical and texture properties [6]. Rice starch biosynthesis is mainly dependent on several key enzymes, such as ADP-glucose pyrophosphorylase (AGPase), soluble starch synthases (SSS), granule-bound starch synthases (GBSS), and starch-branch enzymes (SBE) [7,8,9]. The major function of AGPase regulates starch synthesis and grain weight. GBSS and SSS mainly responsible for the biosynthesis of amylose and amylopectin, respectively. SBE catalyzes the formation of alpha-1,6-glycoside bond. The activities of these enzymes are closely related to starch physiochemical properties and cooking and taste quality [2,10]. Many studies demonstrated that amylose and amylopectin biosynthesis were sensitive to different environments [11,12].
Similar to grain yield formation, the grain quality is also co-regulated by starch biosynthesis of grains in different positions [13]. Zhu et al., 2020 reported that grains in different positions of the panicle showed distinguished eating quality, starch physiochemical properties and fine structure [14]. Our preceding work demonstrated that delayed sowing dates decreased grain filling by down regulating enzyme activity of grains on lower secondary branches of the panicle (SG), rather than grains located on upper primary branches (PG) [1]. However, limited studies have been conducted on the quality changes of grains in different positions of the panicle. Therefore, these cannot comprehensively decipher the influences of environments on grain quality. Research on physiological and quantitative changes of grains in different positions is needed to accurately evaluate the effects of delayed sowing dates on the cooking and taste quality of rice. Based on the uneven quality variation of SG and PG, cooking and taste quality of the population could be regulated by the amount of SG and PG per unit area.
Therefore, in order to elucidate the physiological basis of physiochemical properties alteration and quantitative variation of SG and PG as well as their co-regulative effect on rice populational quality, a field experiment with two japonica rice varieties and 3 different sowing dates was conducted at Danyang city. The main objective of this study was to: (1) evaluate the influence of sowing dates on the quality formation and starch biosynthesis of SG and PG; (2) assess the co-regulative effect of physiological alteration and quantitative variation of SG and PG on population quality.

2. Materials and Methods

2.1. Experimental Sites

A two-year field experiments was conducted in 2019 and 2020 in the subtropical environment of Danyang City, Jiangsu Province, China (32°0′ N, 119°70′ E, 51 m altitude). The field was flooded after the four-leaf stage, and a floodwater depth of 3–5 cm was maintained until a week before maturity when the field was drained. Weeds, pests, and diseases were intensively controlled to avoid yield loss. The climate data regarding daily radiation and air temperature were measured at a meteorological station located within 3 km of the experimental site. The daily solar radiation and temperature were measured by a silicon pyranometer (LI-200, LI−COR Inc., Lincoln, NE, USA) and a temperature/RH probe (HMP45C, Vaisala Inc., Helsinki, Finland), respectively. The soil properties of the topsoil layer (0–20 cm) before transplanting were measured in both years. One kg soil contains 1.21 g total N, 0.47 g total P, 1.96 g total K, 6.8 mg NH4+, 0.9 mg NO3, 12.8 mg Olsens-P and 119.4 mg NH4OAc-K, and PH = 6.3.

2.2. Experimental Design

The experiments were randomized in a complete block design with three replications. The plot size was 7 m in width and 9 m in length. Two conventional japonica varieties, Nanjing 9108 (N9108) and Ningjing 7 (N7), were sown at three dates: April 30th (S1), May 30th (S2) and June 30th (S3). The entire experimental field was applied the same amount of 400 kg P ha−1 (Calcium superphosphate) + 79.5 kg K ha−1 at transplanting and 79.5 kg K ha−1 at panicle initiation stage (Potassium chloride) + 150 kg N ha−1 as carbamide at transplanting. Seedings were sowed on 30th April (S1), 30th May (S2) and 30th June (S3) and machine-transplanted on 20th May, 20th June, and 20th July. Machine transplantation was performed using a rice transplanter (PZ640, Iseki Agricultural Machinery Co., Ltd., Tokyo, Japan) in June 2019 and 2020 with a hill spacing of 14 cm × 30 cm.

2.3. Observations and Measurements

2.3.1. Development Stage

The dates of sowing, transplanting, heading, and maturity was recorded for determining growth duration. Heading was the date when 80% of the stems in a plot started anthesis. Maturity was the date when 95% of grains turned yellow in color.

2.3.2. Grains Numbers in Different Positions

Ten continuous plants were chosen for detection of tillering dynamics. Every tiller was tagged by a cotton thread in a different color as long as the tillering emergence. The tiller differed as to the main stem, primary tiller, secondary tiller, and tertiary tiller as described in the previous study [15]. The main stem was tagged as red color cotton thread, the primary tiller was tagged as white color, the secondary tiller was tagged as blue color, and the tertiary tiller was tagged as black color. Tiller emergence date were recorded to evaluate tiller dynamics. All grains harvested at maturity separately to calculate the spikelet number and yield-related traits in different positions. In each treatment, grains were threshed into three groups: SG, PG, and TG (all grains harvested at mature). Quality of SG and PG, as well as that of TG, were measured separately after harvesting.

2.3.3. Grain Filling Characteristics

We selected 400 panicles that headed on the same day in each treatment, which were tagged to give an accurate record of the flowering date and the position of the spikelets. Grains located in primary branches that flowered on the first two days of anthesis and grains located in secondary branches that flowered on the last two day were separated from the panicles for further enzymatic activities and filling dynamics measurements. Thirty tagged panicles from each plot were sampled at every 5 days from 5 DAA till 25 DAA, then sampled at every 7 days from 25 DAA till 53 DAA. The sampled panicles were divided into three groups (10 panicles each) as three replicates. The sampled grains were dried at 70 °C to constant weight, dehulled, and weighed for further measurements.

2.3.4. RVA

The pasting properties of rice flour and starch were measured using a Rapid Visco Analyzer (RVA) (Techmaster, Newport Scientific, Warriewood, Australia) according to the methods of Limpisut and Jindal, 2002 [16]. In detail, about three grams of flour were added into an aluminum can with 25 mL distilled water. For starch samples, 2.5 g starch was used for RVA analysis. The constant paddling speed was set at 160 rpm. The temperature was held at 50 °C for one min, then increased to 95 °C over 4 min, and held at 95 °C for 13 min. The temperature was then decreased to 50 °C over 4 min and held at 50 °C for 13 min. Various RVA parameters were measured including peak viscosity (PKV), hot paste viscosity (HPV), cool paste viscosity (CPV), breakdown viscosity (BDV), setback viscosity (SBV), peak time (Prime), and pasting temperature (PT).

2.3.5. Cooking Quality and Texture Properties

An STA1B rice sensory analyzer (SATAKE, Hiroshima, Japan) using the near-infrared reflectance technique was also used to evaluate the sensory properties of the cooked rice. Milled rice (30 g of each cultivar) was washed in a stainless-steel mesh container and then transferred into a 50 mL aluminum box containing 40 mL distilled water to be cooked in an electric rice cooker (Z06YA3-S2, SUPOR Ltd., Hangzhou, China) for 15–20 min. After 20 min of equilibrium, the sensory properties of the cooked rice were evaluated. Cooked rice texture properties were investigated according to the method of Zhang et al., (2016) by using an RHS1A Texture analyzer equipped with a 35 mm cylindrical probe attachment (RHS1A, STAKE Ltd., Tokyo, Japan) [17]. Polished rice of each sample was prepared and cooked under the same conditions in an aluminum box. About 1 g cooked rice was selected from the bottom, middle, and upper of the box and then placed on the center of the base plate. Each sample was repeated 3 times.

2.3.6. Starch Extraction and Amylose Content

Starch was extracted from polished rice following the method of Zhu et al. 2016 [18]. First, the protein was removed from the rice flour using alkaline protease. Homogenate was collected using a 200-mesh sieve, and 30 mL deionized water was added. The mixed liquor was centrifuged at 4000× g for 10 min to remove impurities. The centrifugal steps were repeated three to five times to ensure that impurities were completely removed. After this step, the starch was collected and dried at 30 °C for two days and then collected with a 200-mesh sieve. The purity of starch requires the nitrogen content in starch should no more than 1%. The starch iodine absorption spectrum was measured using a spectrophotometer (Ultrospec 6300 pro, Amersham Biosciences Ltd., Amersham, Buckinghamshire, UK). The amylose content was calculated using the method described by Man et al., 2012 [19].

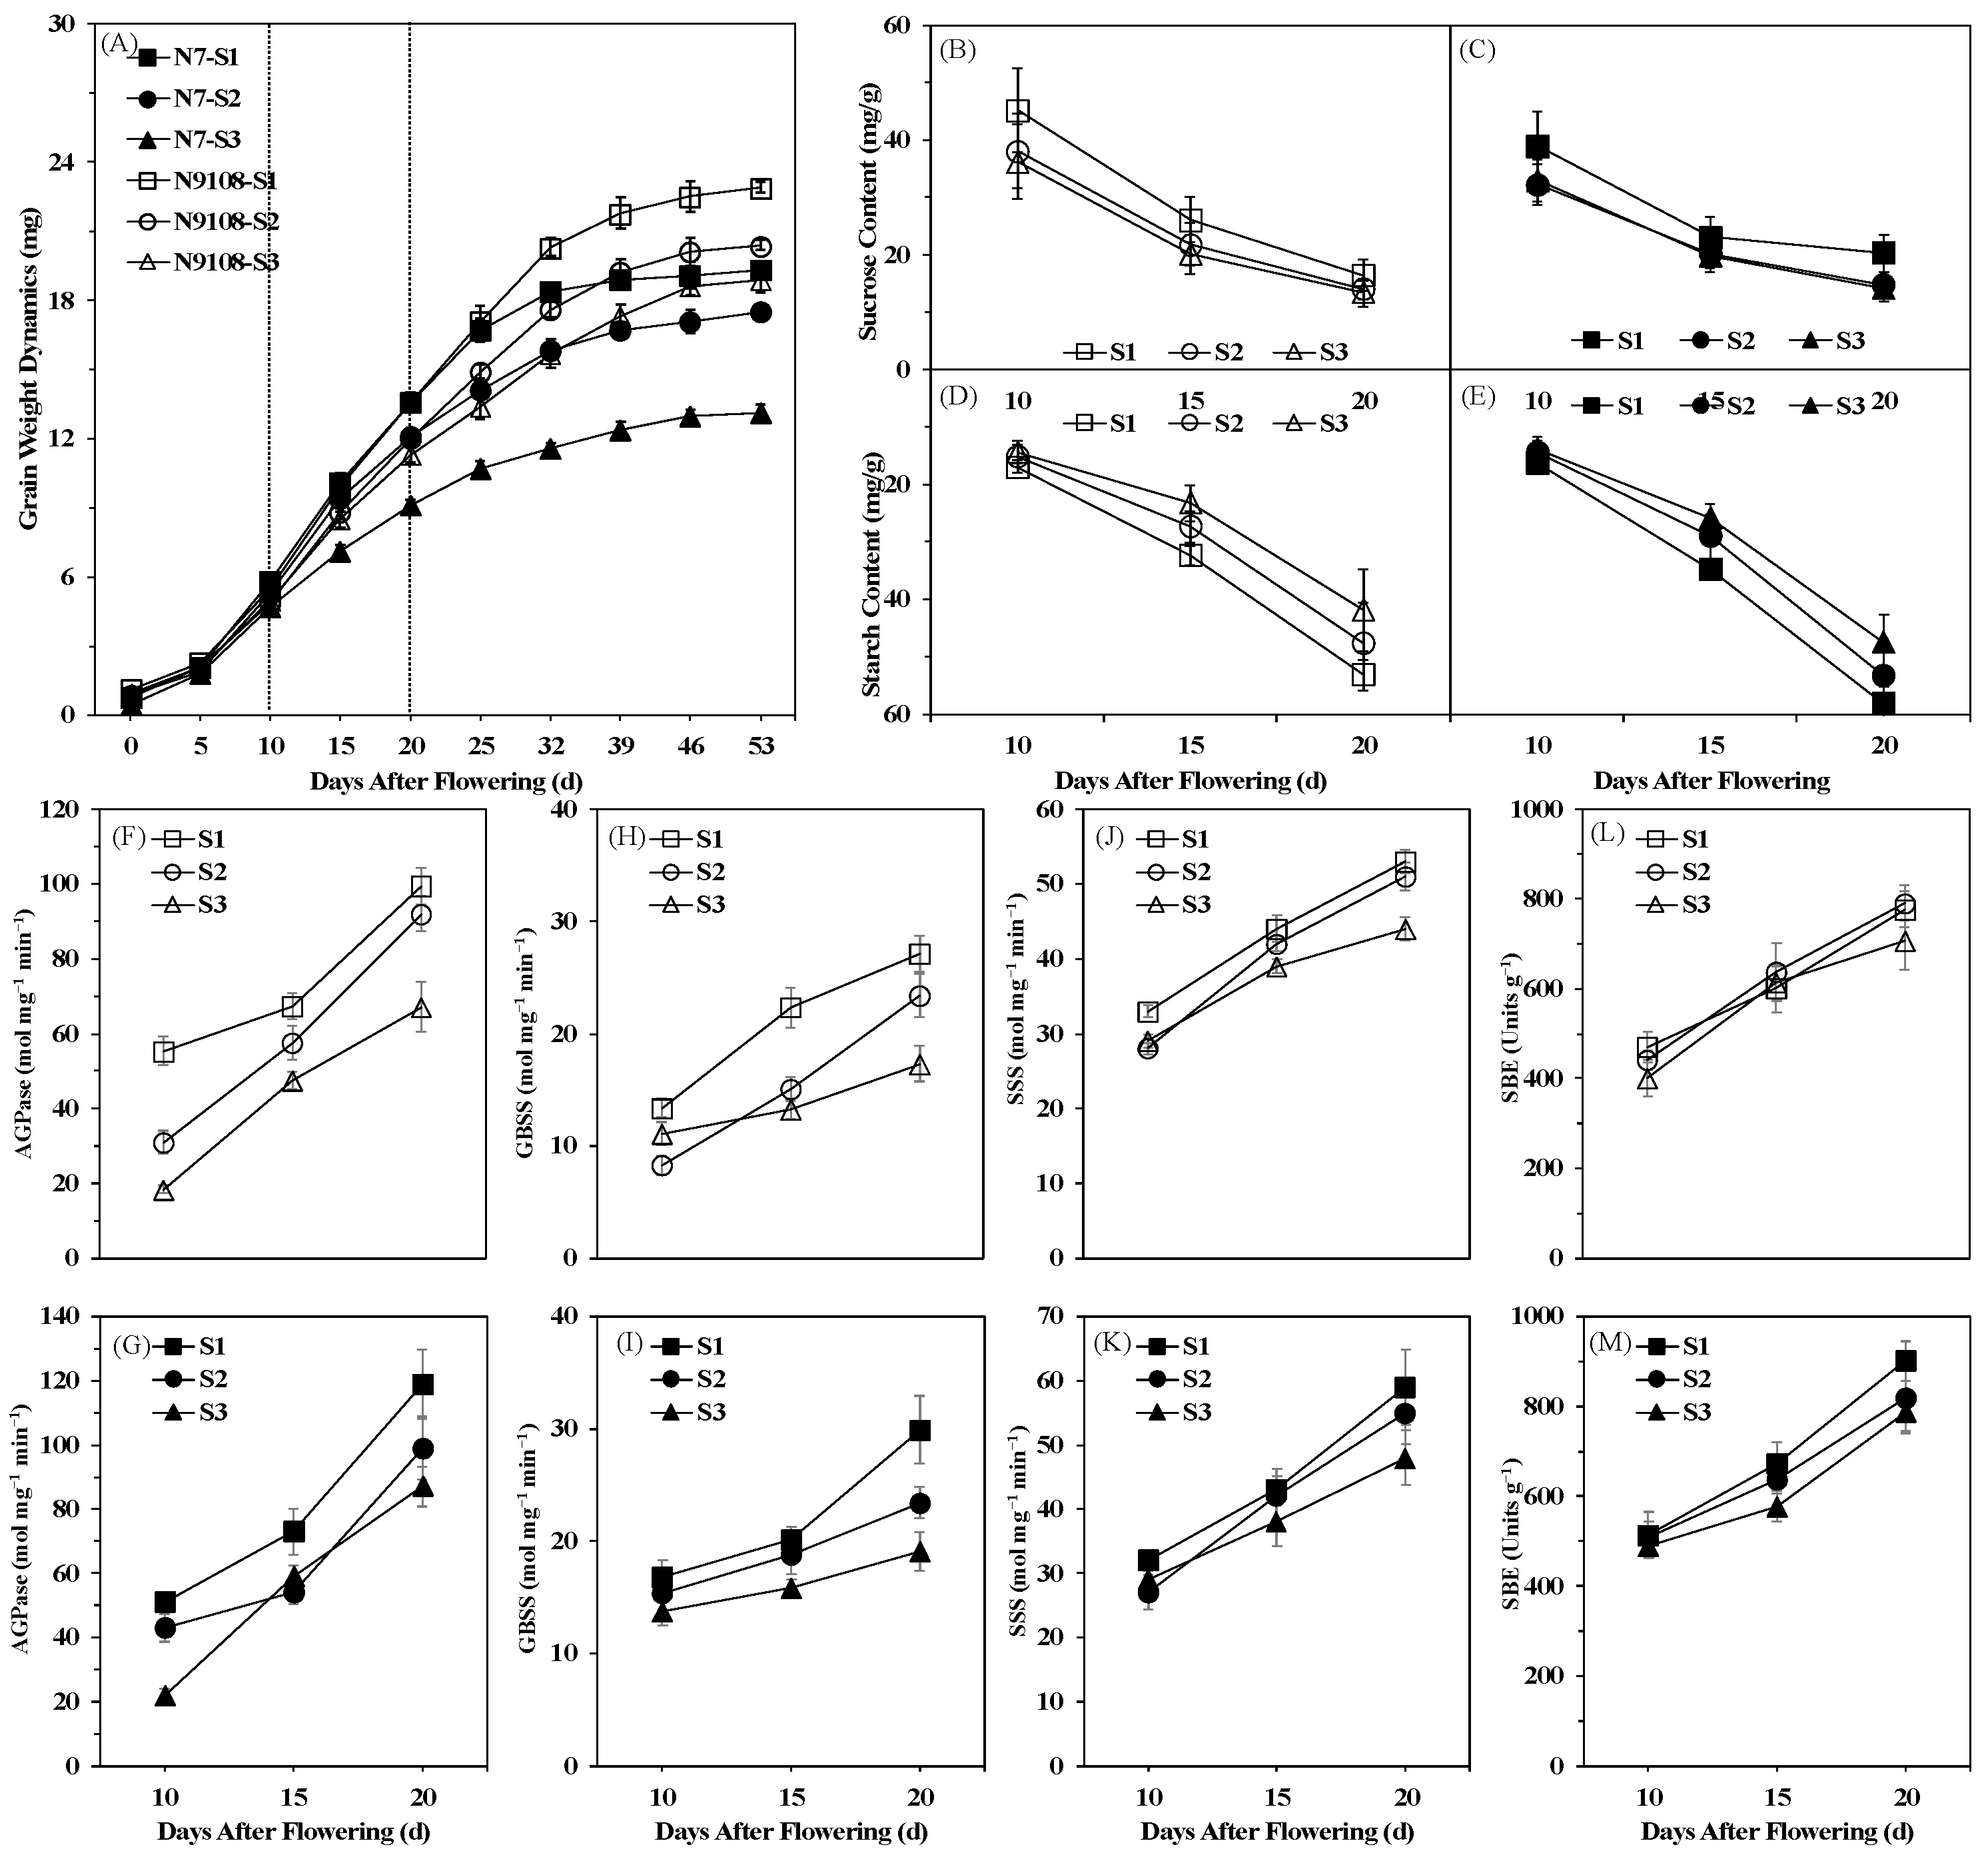
2.3.7. Enzyme Extraction and Assay

Enzyme extraction was performed with minor optimization following the procedure of Wang et al., 2021 [2]. Ten grains were homogenized by grinding at 4 °C with 5 mL extraction buffer (12.5% glycerol, 2 mmol/L EDTA, 100 mmol/L Tricine-NaOH8, 8 mmol/L MgCl2 and 2 mmol/L EDTA). After 10,000× g 4 °C centrifugation for 10 min, the supernatant was collected to determine enzyme activity. The activities of AGPase, GBSS and SSS were analyzed as described by [20] Yang et al. (2003) with minor changes. The analysis of SBE activities followed Nakamura et al., 1989 with minor changes, respectively [21].

2.4. Statistics Analyses

Analysis of variance was performed using SPSS version 20.0. (SPSS Statistics, SPSS Inc., Chicago, IL, USA), and the results are expressed as means (± SD) of three biological replicates. The treatment means were compared based on the least significant difference (LSD) at a 0.05 level of probability.

3. Results

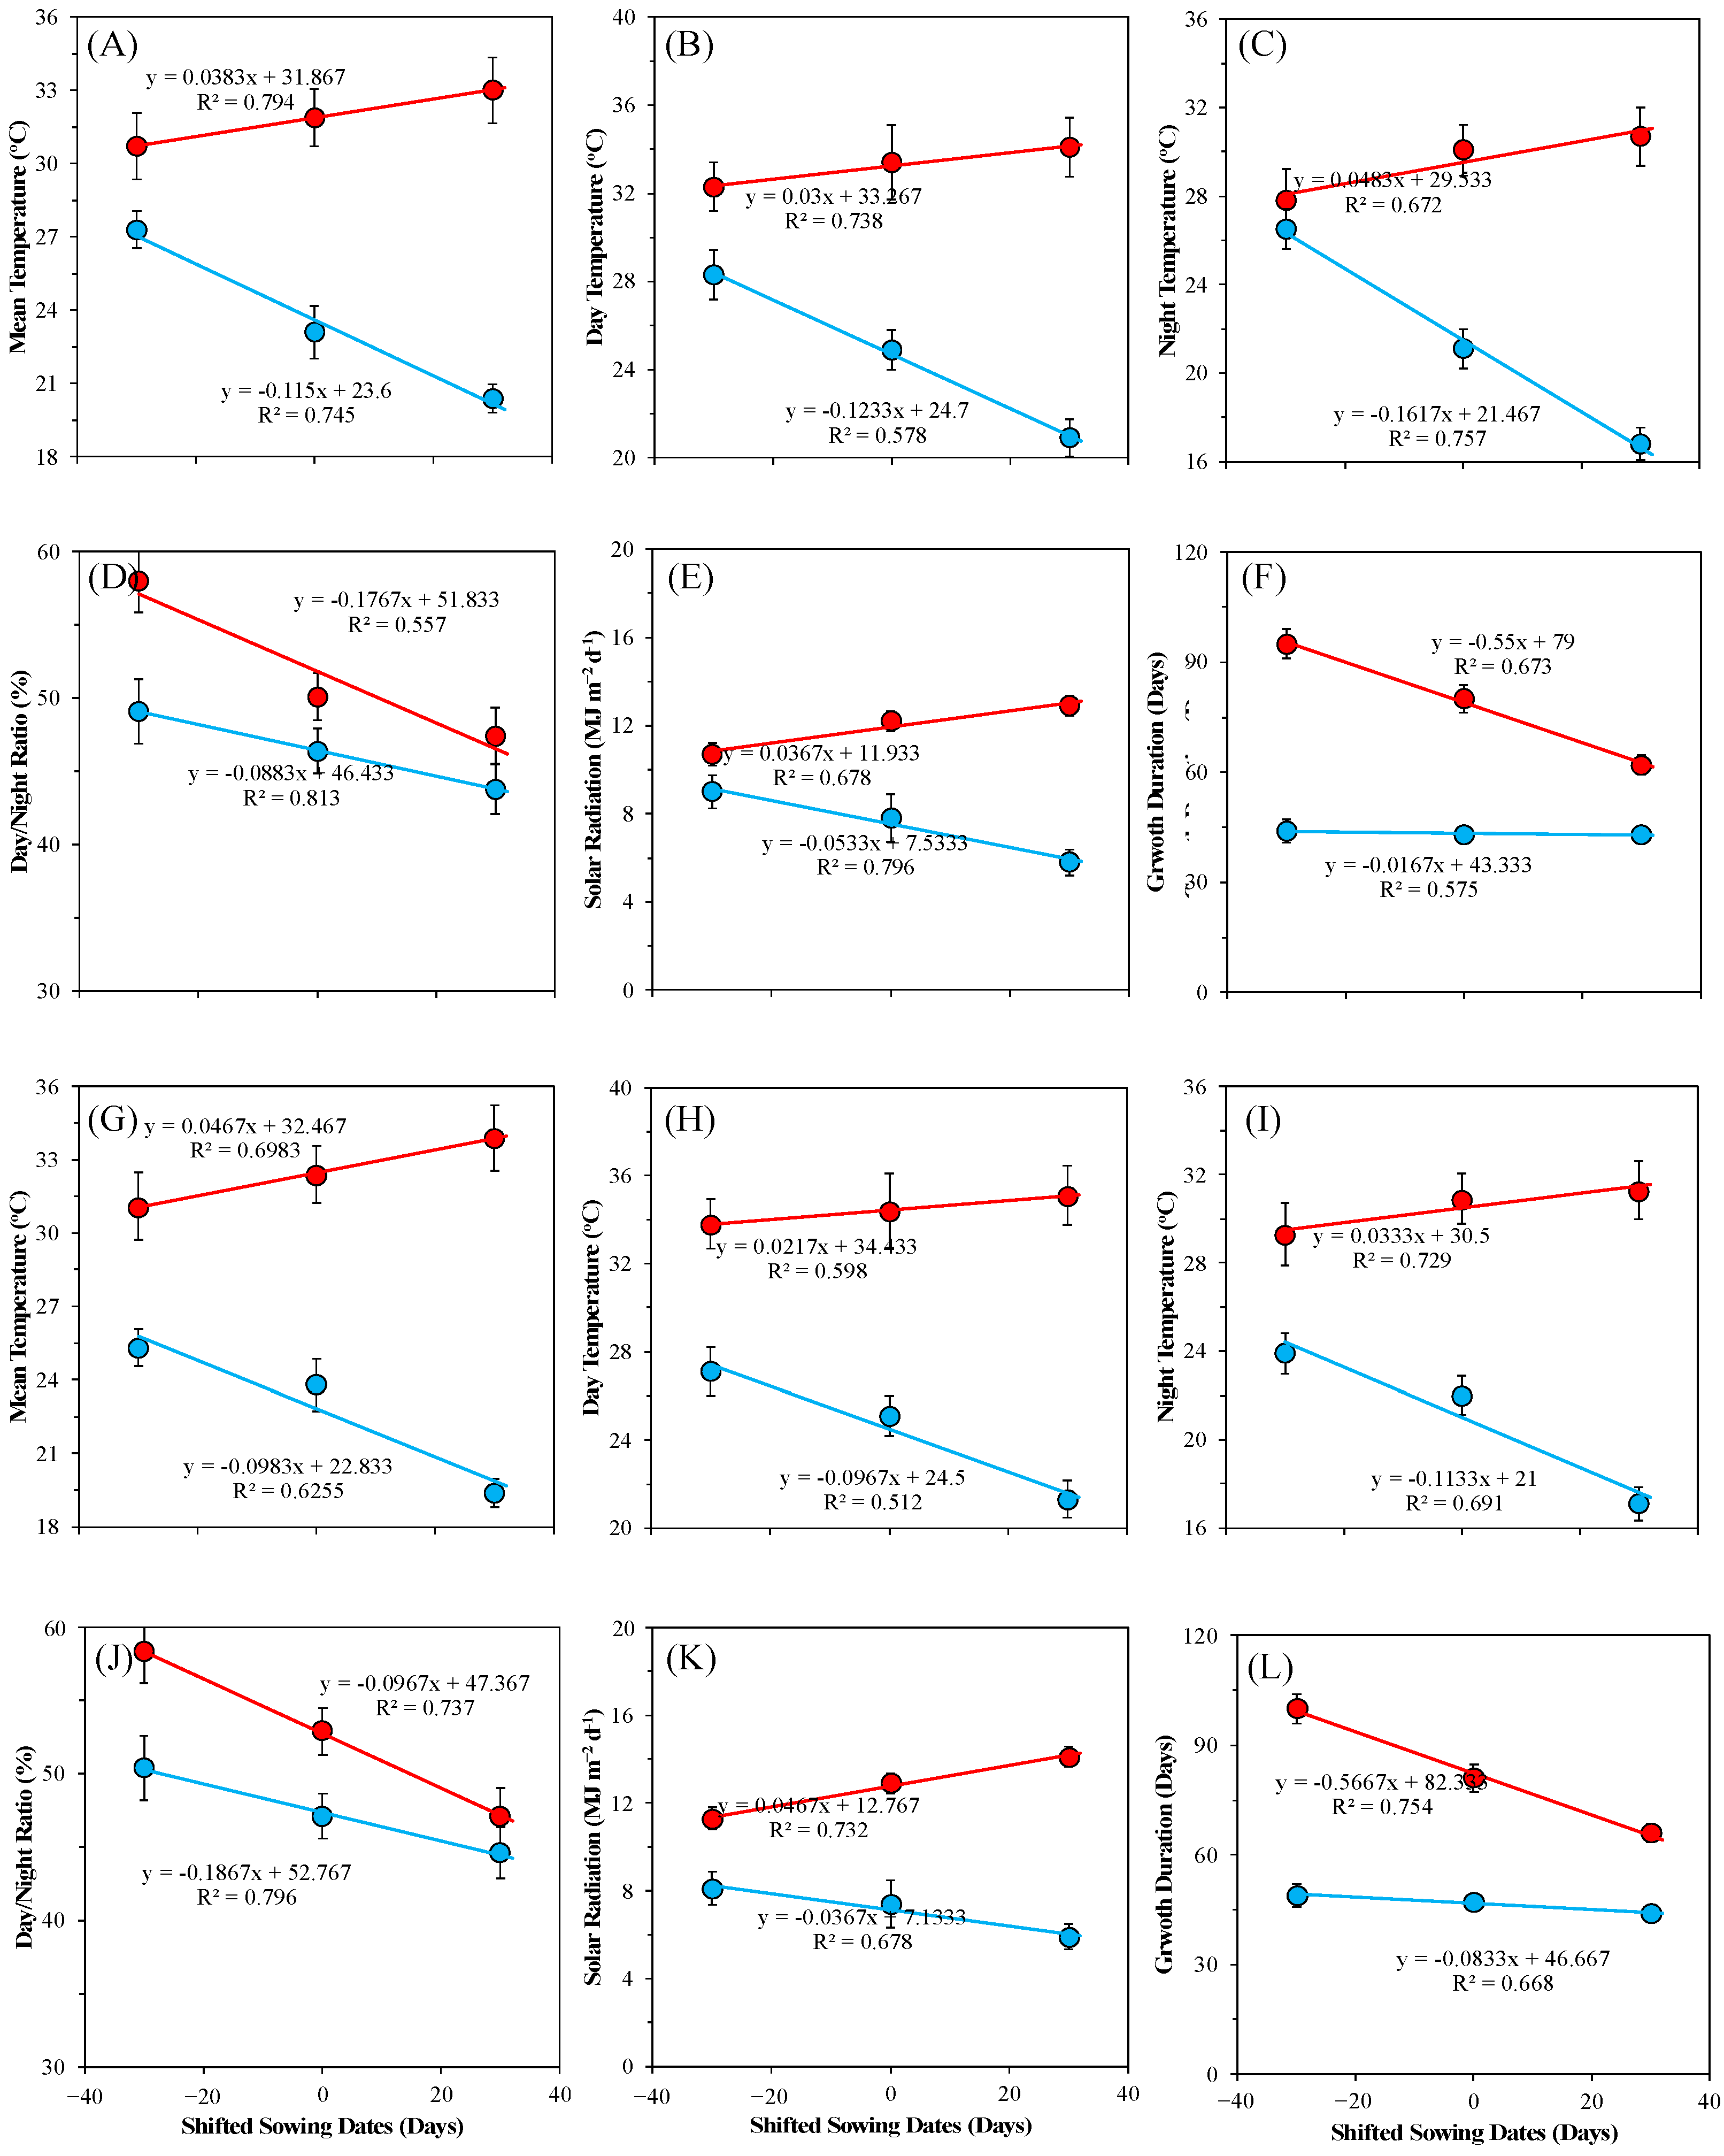
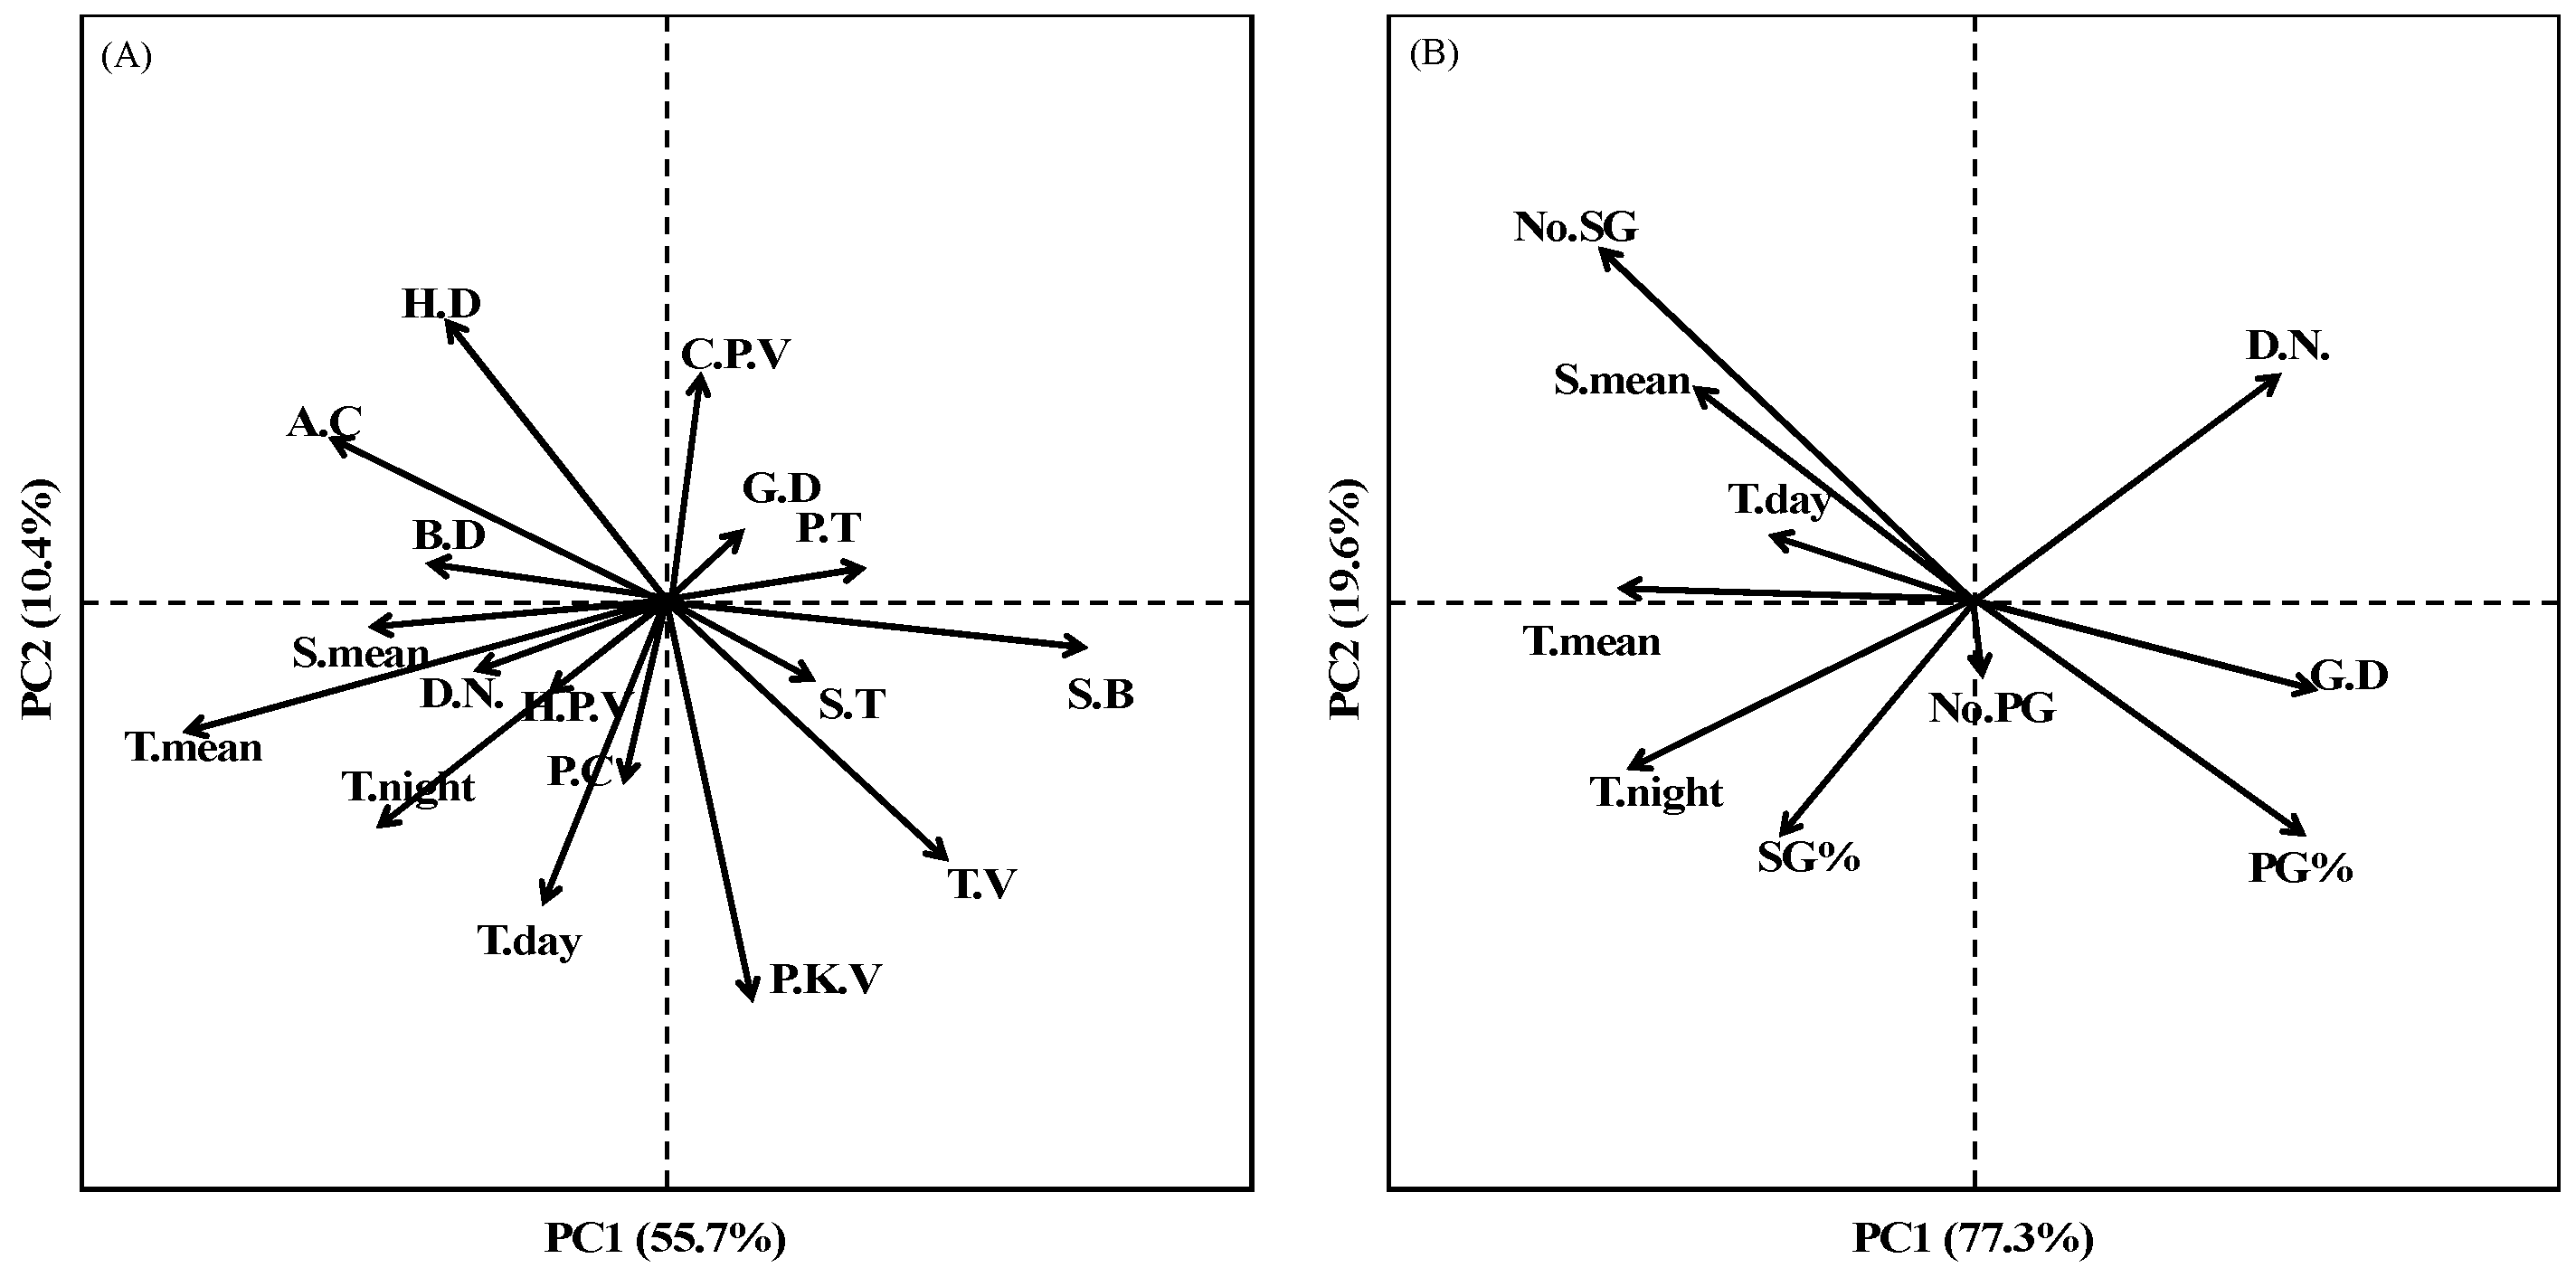
3.1. Effects of Sowing Dates Variation on Thermal Resources during Rice Growing Season

Compared to earliest sowing treatment (S1), the mean temperature (Tmean), day temperature (Tday), night temperature (Tnight) and solar radiation (Smean) markedly increased at before heading, in both varieties for both years, while Tmean, Tday, Tnight and Smean decreased after heading in delayed sowing treatments (Figure 1). Differently, the day/night ratio (D/N) decreased by delaying of sowing date both before- and after-heading stages. These changes contributed to a decrement and increment of before- and after-heading, respectively, growth duration (GD) in both varieties in both years. Compared to earliest sowing date treatment, postponing the sowing date 30 days resulted in a 0.94 °C, 0.99 °C, 1.23 °C, and 1.04 MJ mean increase before heading, and a 0.84 °C, 1.23 °C, 1.13 °C, and 2.12 MJ mean decrease after heading in the Tmean, Tday, Tnight and Smean values, respectively. Additionally, the D/N decreased 5.13% before heading and 2.94% after heading by postponing the sowing date 30 days. Due to rice thermal and light sensitive characteristic, the changes in thermal resources as well as light duration contributed to a decrease of 15.7 days in the before-heading GD value of both varieties by postponing 30 days sowing dates.

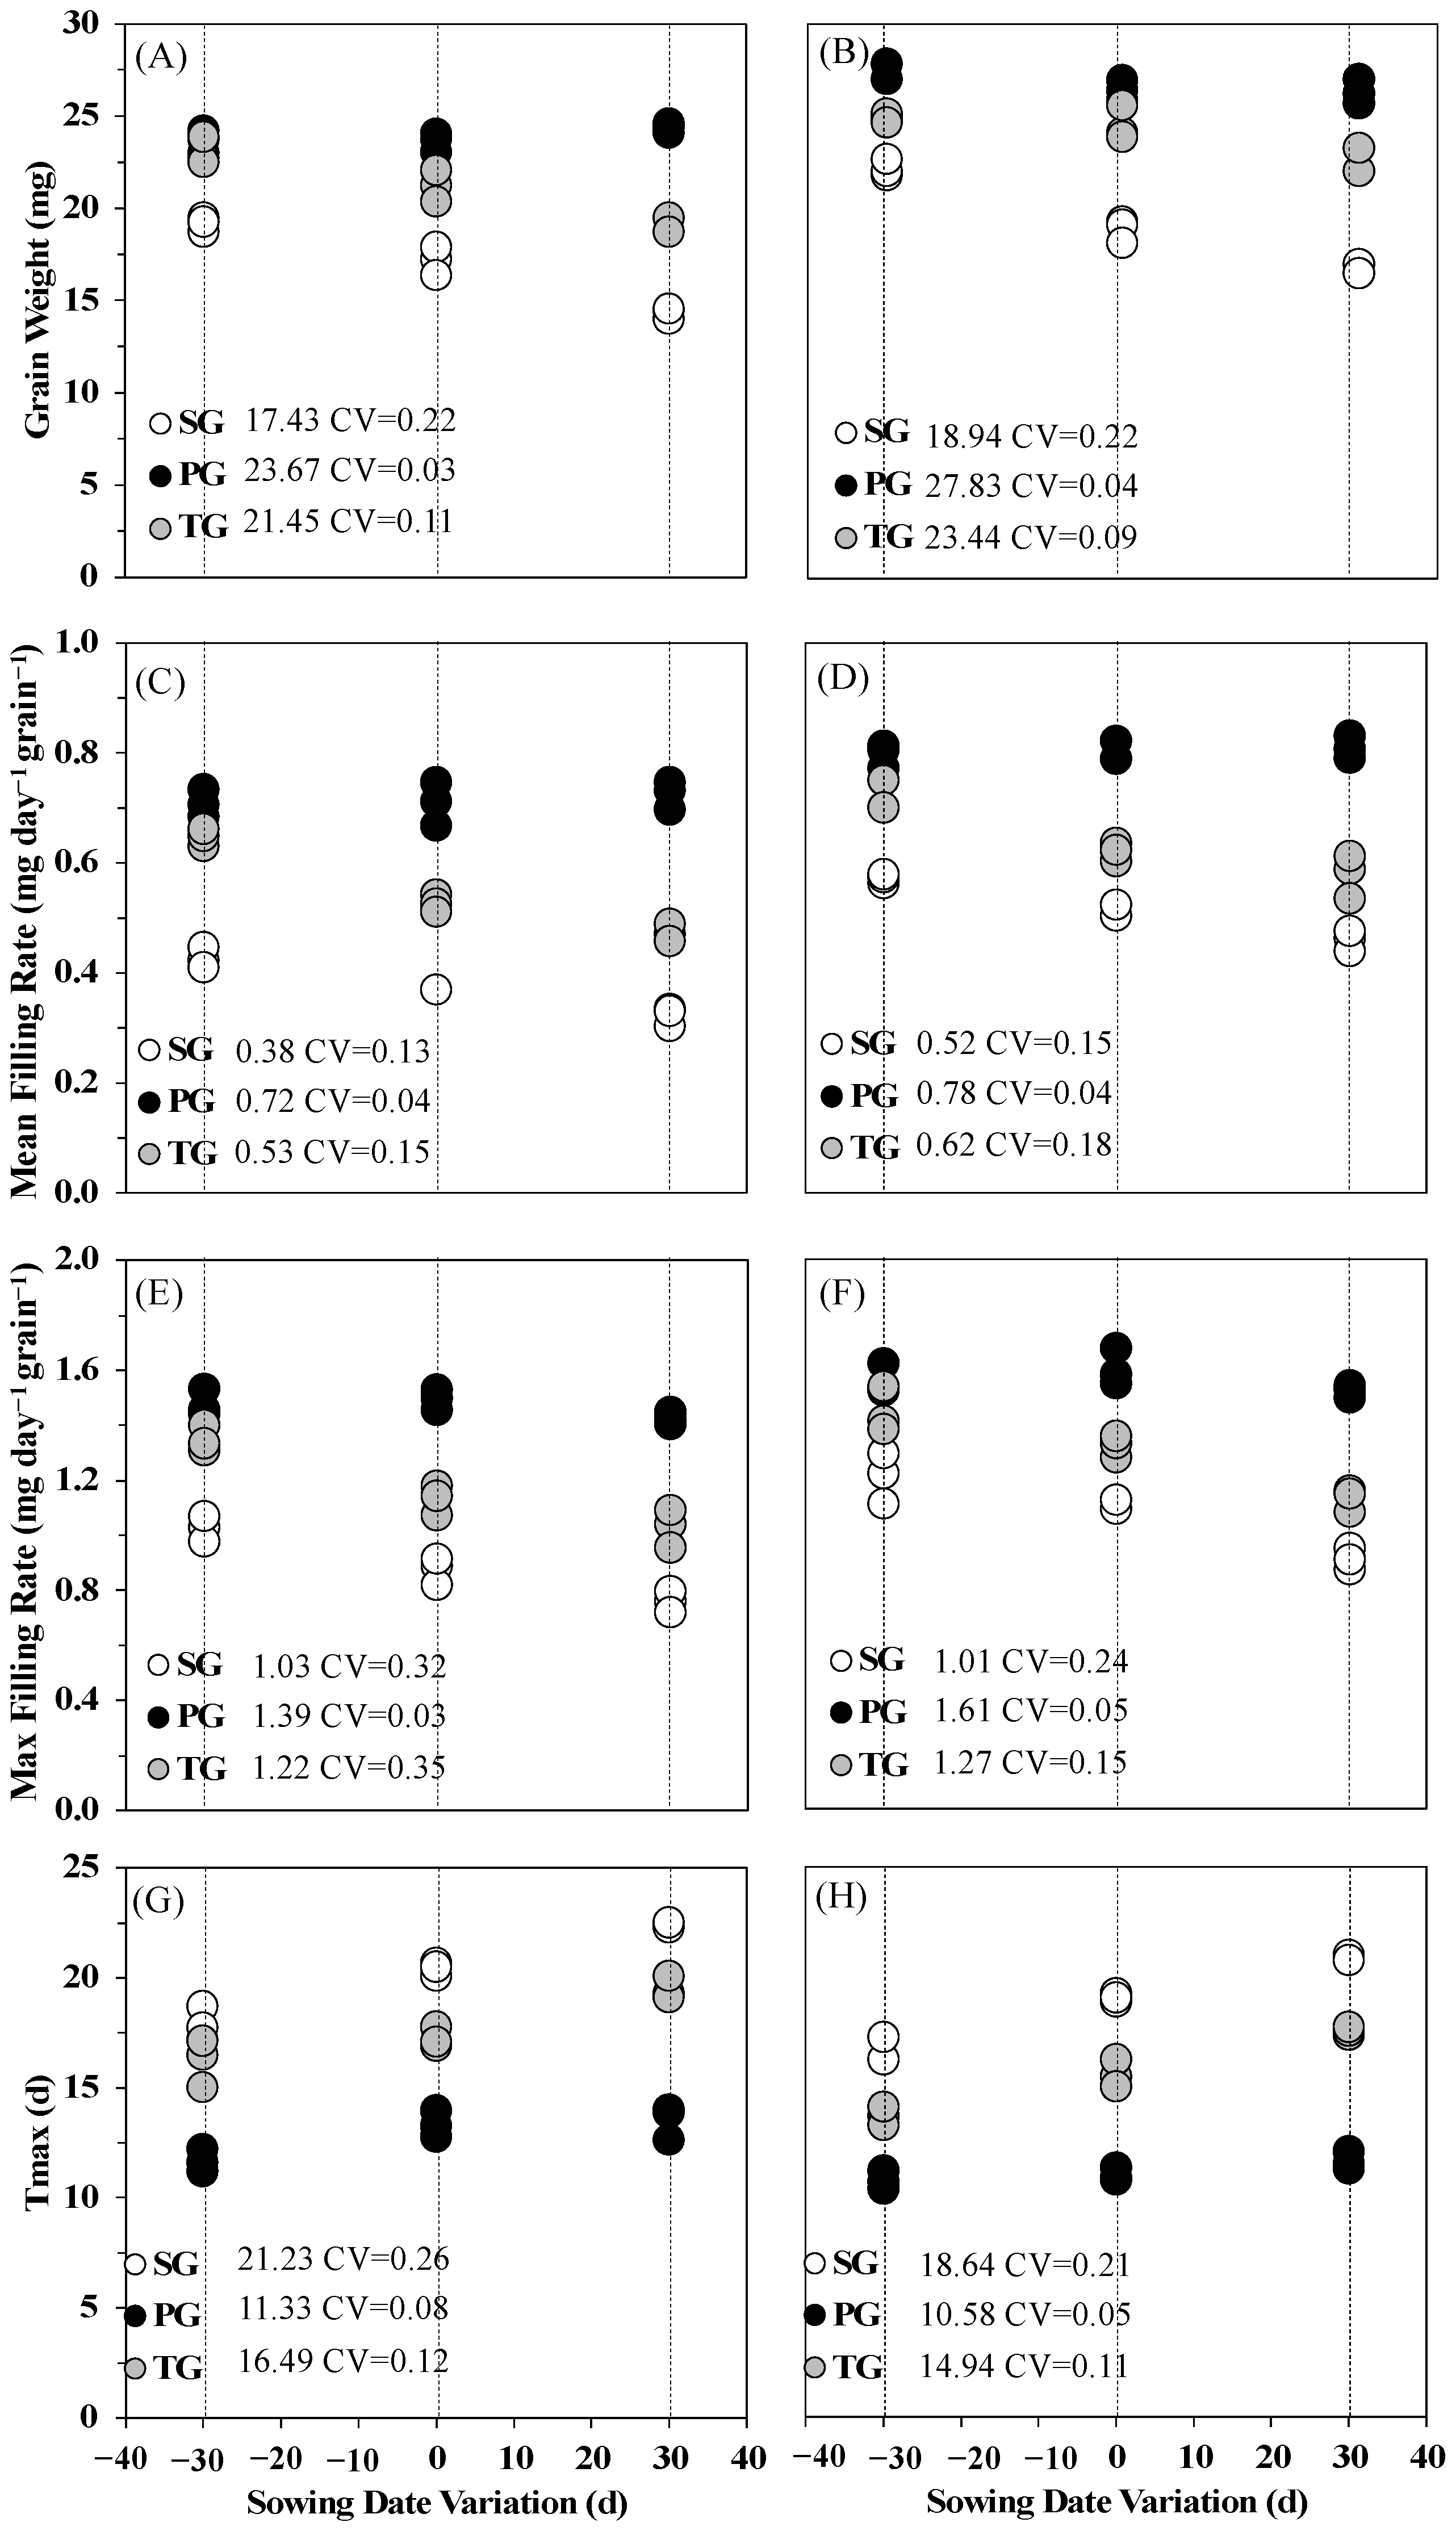
3.2. Effects of Sowing Date Variation on Rice Grain Filling

Grains located on different positions of panicle have different filling characteristics, max grain filling rate (GRmax) and mean grain filling rate (GRmean) of grains located in secondary branches (SG) were significantly lower than the grains located in primary branches (PG), whilst time to max filling rate (Tmax) and grain filling duration (D) of SG were higher in SG (Figure 2). In addition, the filling characteristics of SG and PG showed discrepant responsive patterns in different sowing dates. The grain filling of total grains per unit area was reduced by delayed sowing date treatments. There was no significant difference among GRmean, GRmax, Tmax and D of PG in different sowing dates in both varieties. However, in SG, the mean of Grmean and GRmax were markedly decreased by delayed sowing date treatments, while the mean of Tmax and D were increased by delayed sowing date treatments.
The soluble sugar content and starch content of the SG were both significantly reduced by delaying sowing date. To further decipher the responsive mechanism of grain filling level of SG under different sowing dates, we measured the activities of enzymes involved in the process of starch biosynthesis. The activity of AGPase and GBSS was lower in the late sowing treatment compared to the earliest sowing treatment of both varieties at three grain filling stages that we examined (Figure 3). Correlation analysis indicated that the variation of starch biosynthesis enzymes activities was closely related to rice cooking and taste quality (Table 1). The activities of SSS and SBE showed similar patterns, but with less reduction of activity to AGPase and GBSS in both varieties. These changes in SG grain filling characteristics were responsible for the grain filling variation of TG.

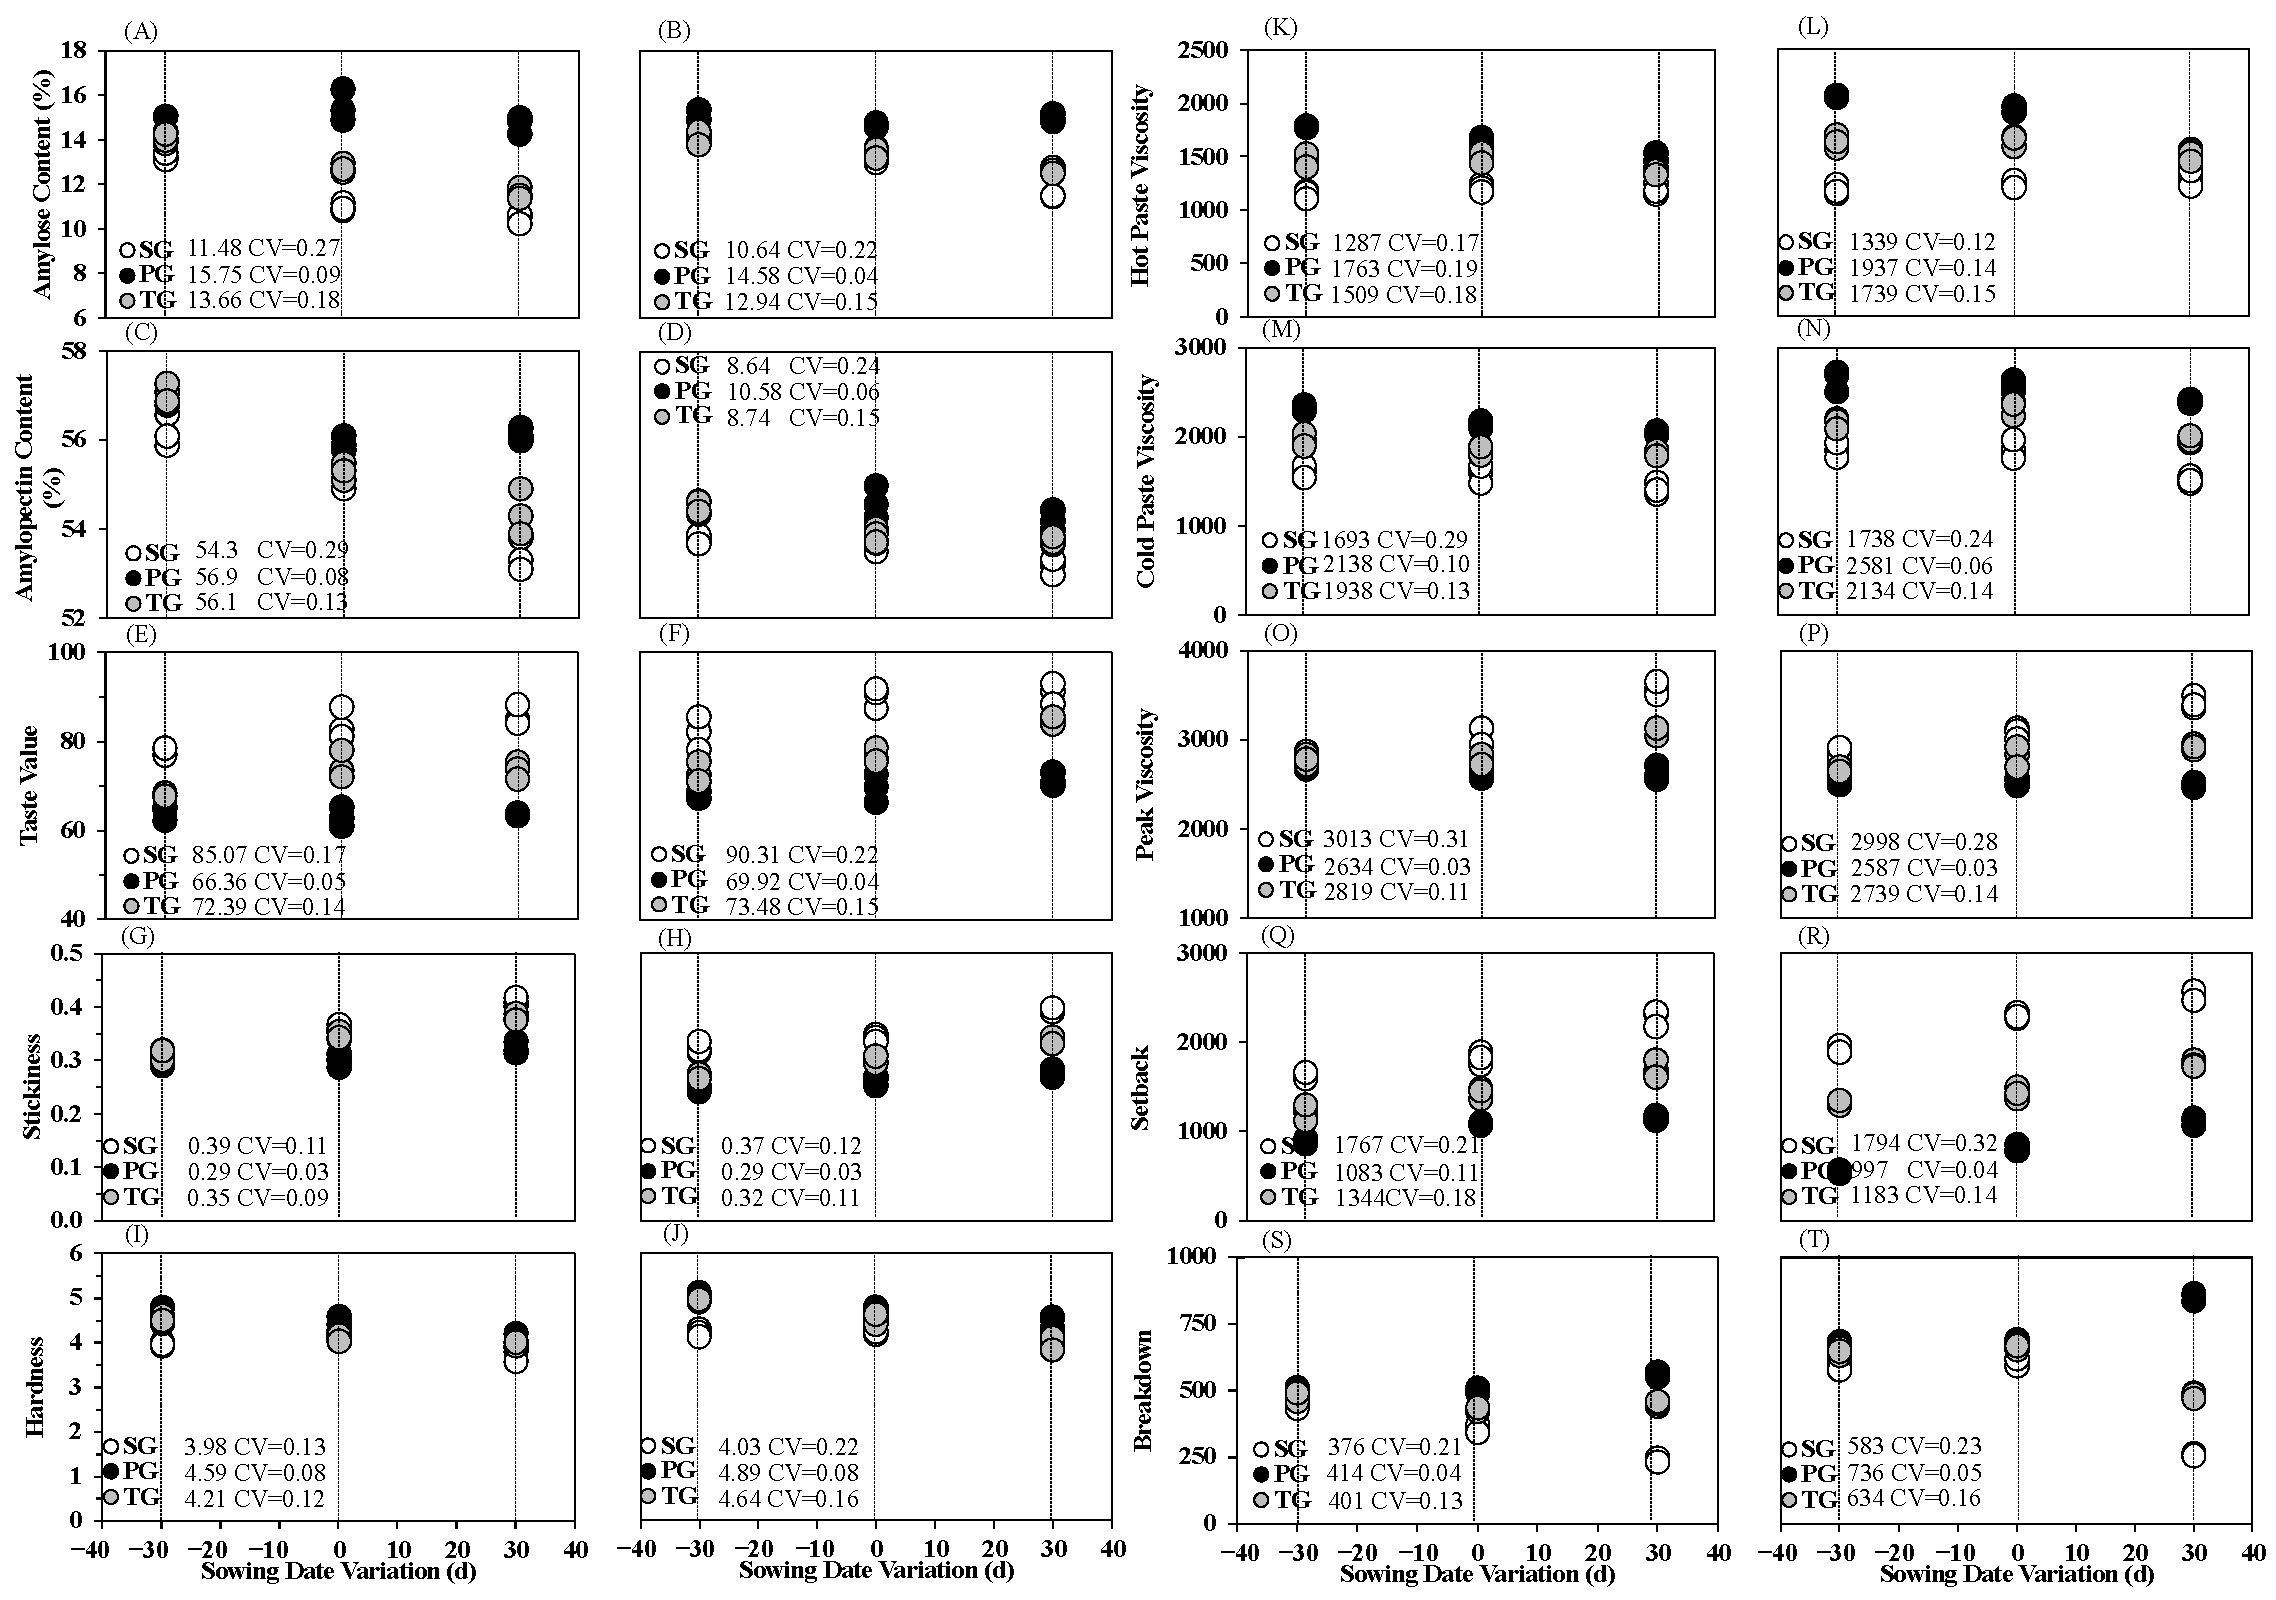
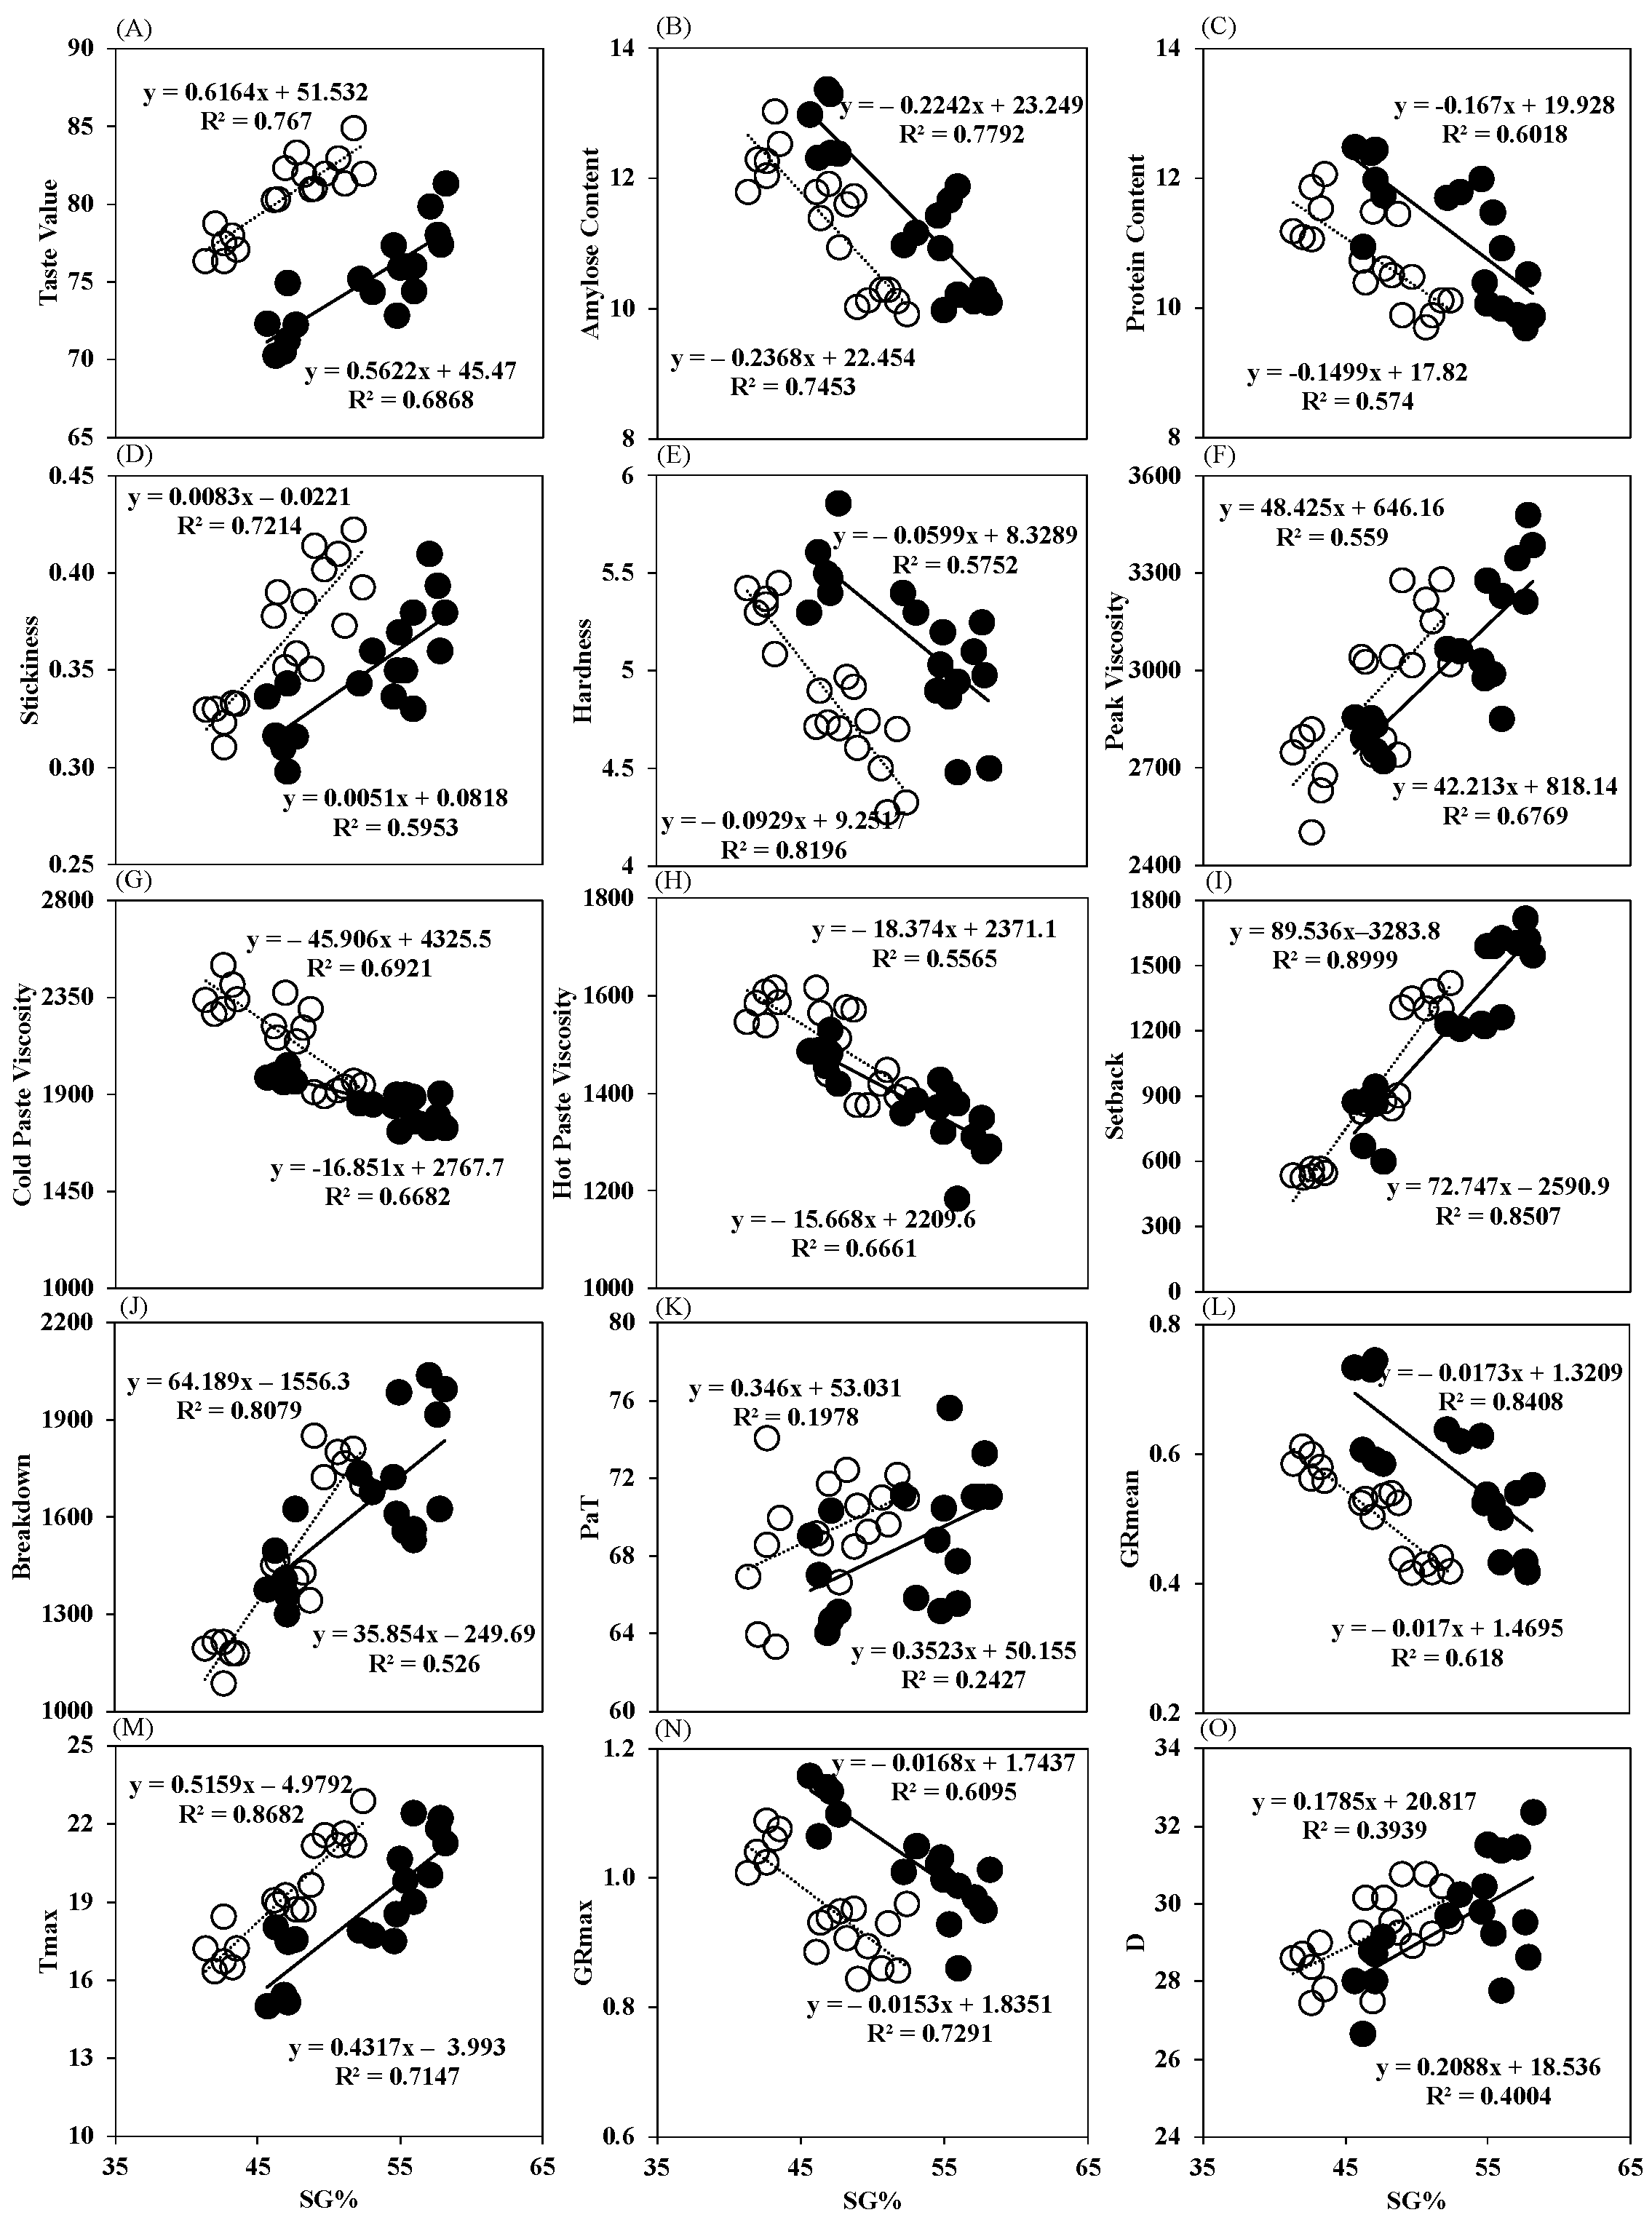
3.3. Effects of Sowing Date Variation on Rice Grain Cooking and Taste Quality

As a result of starch biosynthesis difference, there were significant differences in cooking and taste quality between SG and PG as well (Figure 4). Compared to PG, in SG, the amylose content (AC), and hardness (HD), were markedly lower in both varieties, while the stickiness (ST) was higher, amylopectin content (AMC) showed no significant differences. These changes contributed to a significant enhancement of taste value (TV) in both varieties. We further performed the relative viscosity analysis (RVA) of grains located on different positions of the panicle, compared to PG, the peak viscosity (PKV) and setback (SB) were significantly higher in SG, whilst the cold paste viscosity (CPV), hot paste viscosity (HPV) and breakdown (BD) were lower in SG (Figure 4). Similar to grain filling level, the taste quality responsive pattern was largely different between those of SG and PG. In SG, compared to early sowing treatment, the AC, HD, HPV and BD were significantly decreased by delayed sowing date treatments, whilst the ST, TV, PKV and SB markedly increased. However, no significant differences of cooking and quality characteristics was found in PG. The uneven quality variation of SG and PG contributed to elevation of cooking and taste quality variation of TG in delayed sowing treatments.

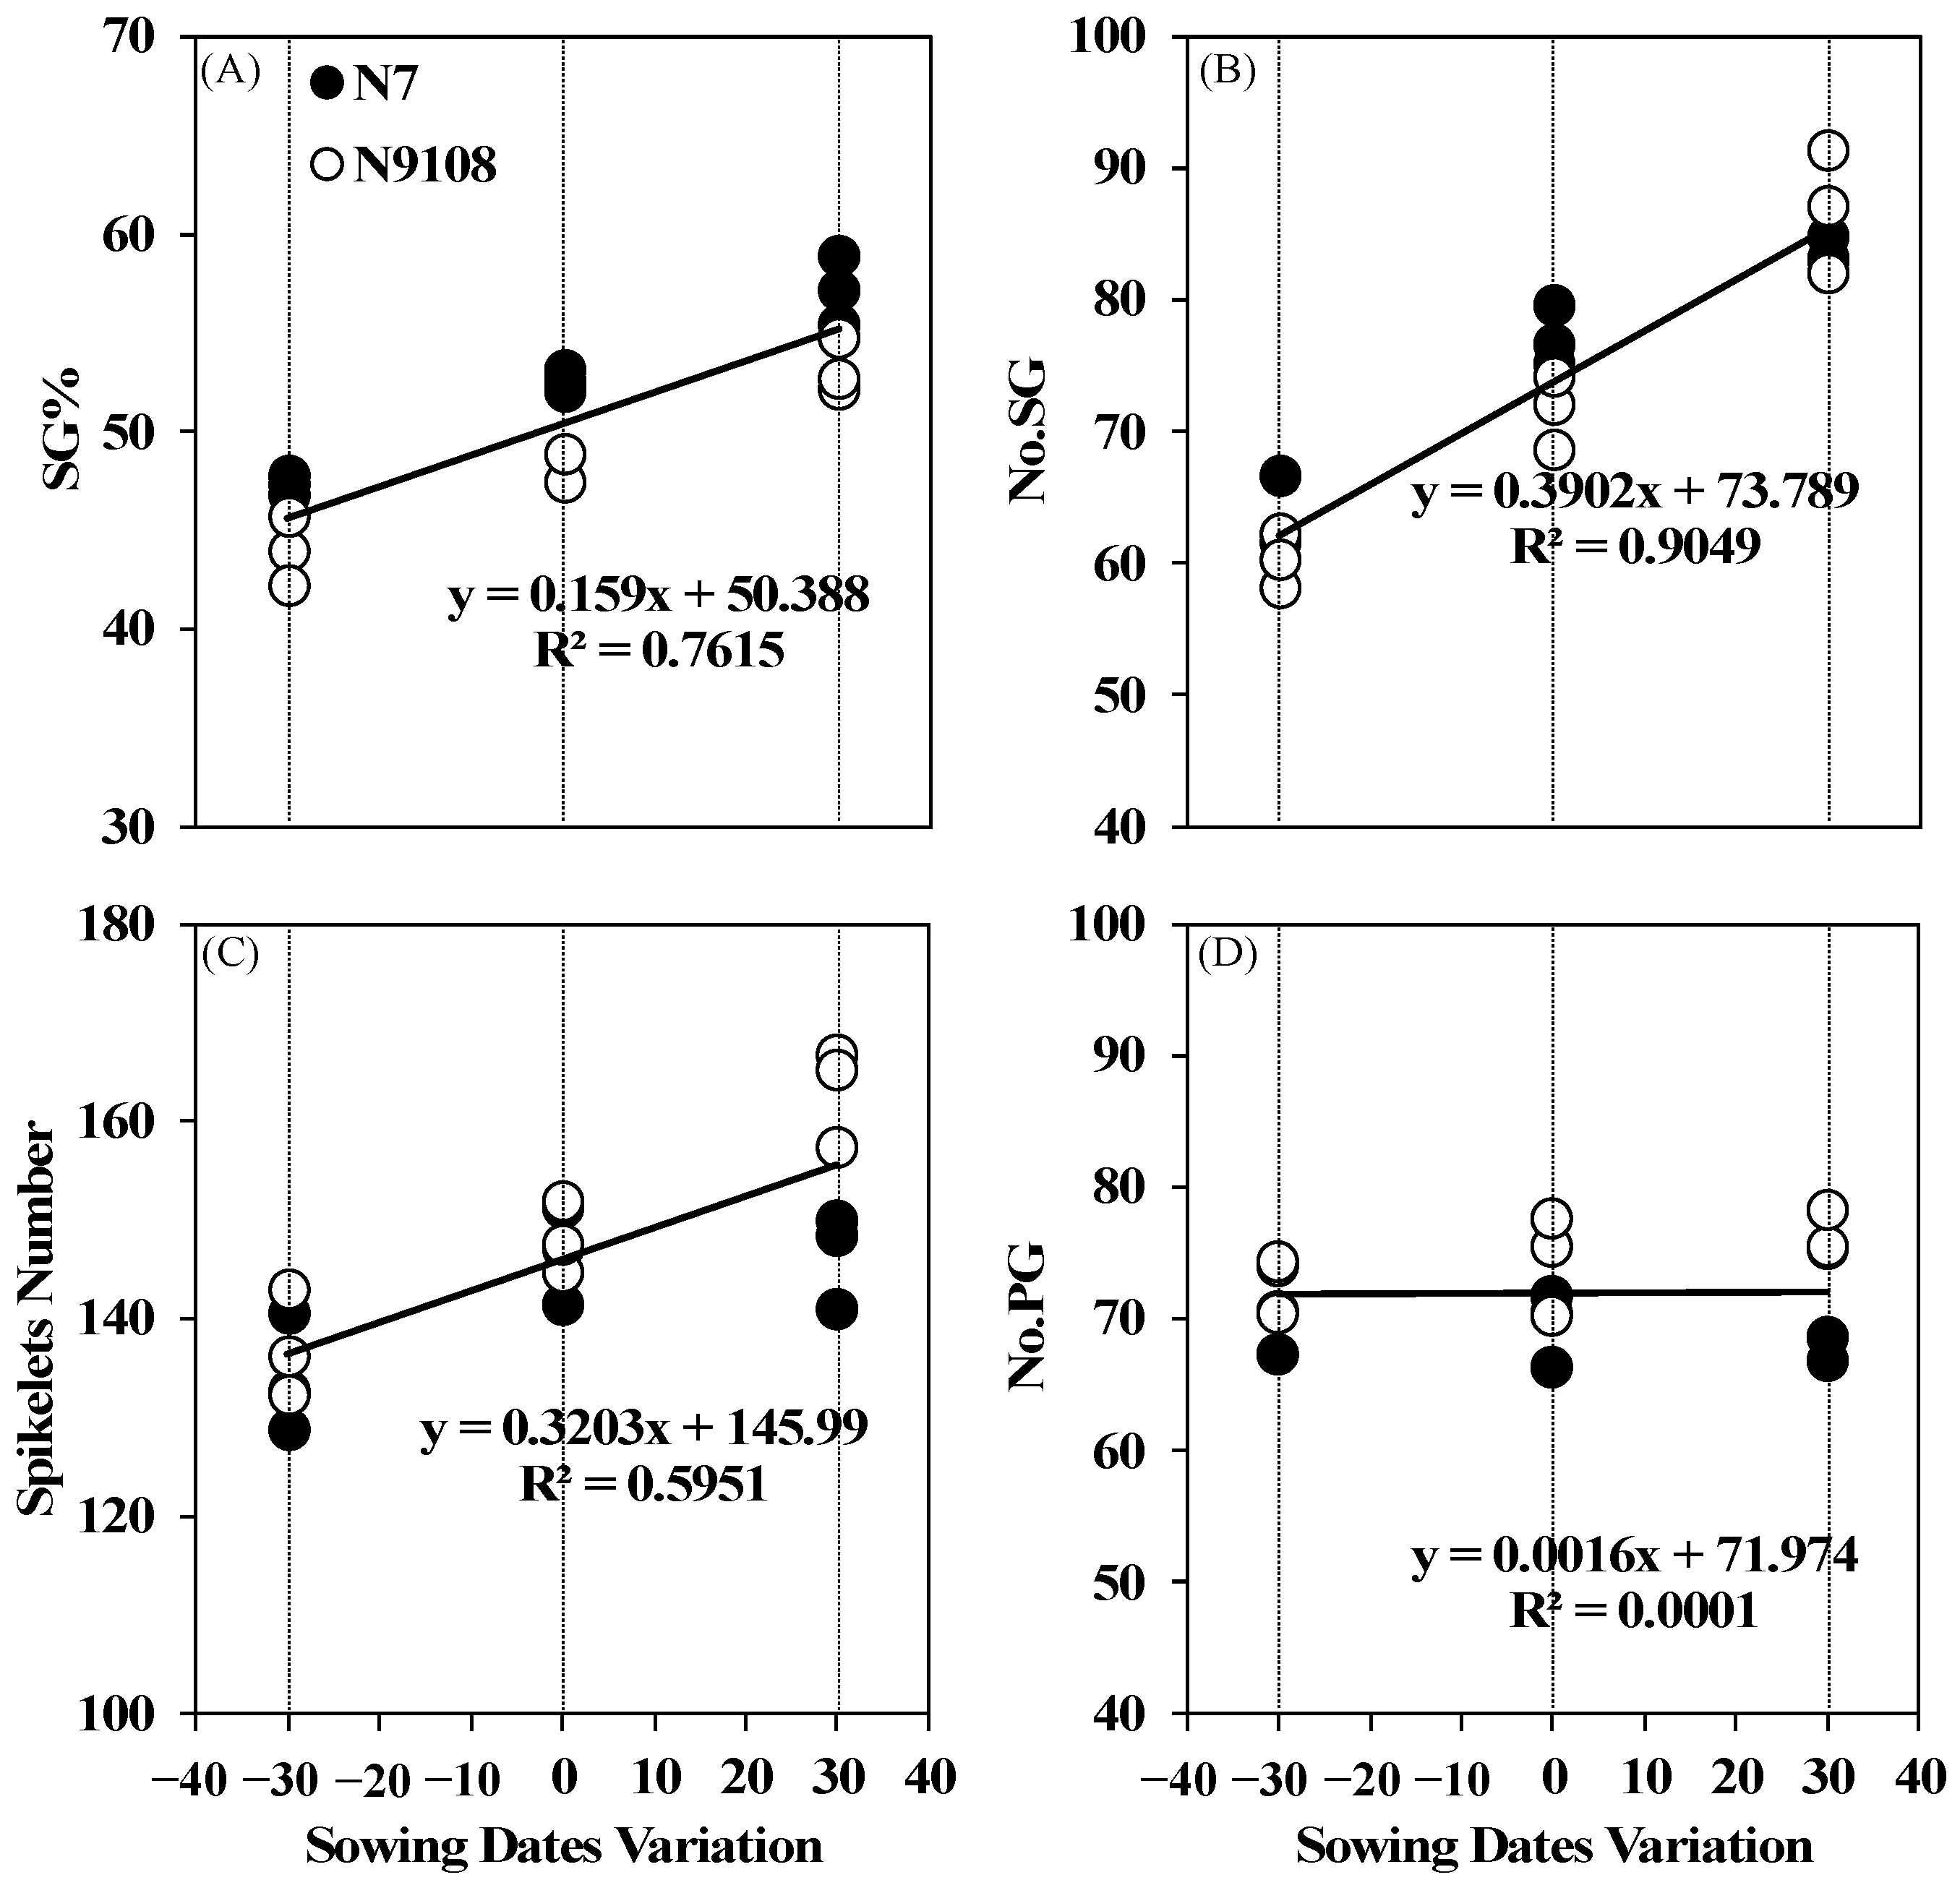
3.4. Effects of Sowing Date Variation on Rice Spikelets Branching Structure

Spikelet branching structure was largely regulated by sowing dates due to meteorological differences in before heading. Delayed sowing date shortened the before heading growth duration and suppressed the panicle emergence of higher tiller (secondary tiller or tertiary tiller) (Figure 1, Figure 5 and Figure S1, and Supplementary Table S1). Less panicle emergence of higher tiller led to larger panicle size at maturity. The main source of panicle size enlargement was an increment of SG number (No.SG) rather than that of PG (Figure 6). In addition, the increment of spikelets per panicle and No.SG contributed to higher ratio of grains located in secondary branches per unit area (SG%). Compared to S1 treatment, the SG% was elevated by 4.7% and 10.9% in S2 and S3 treatments, respectively, in both varieties. The above results raised a possibility that structural variation of grains located on different positions could also be responsible for quality variation of the whole population at maturity.

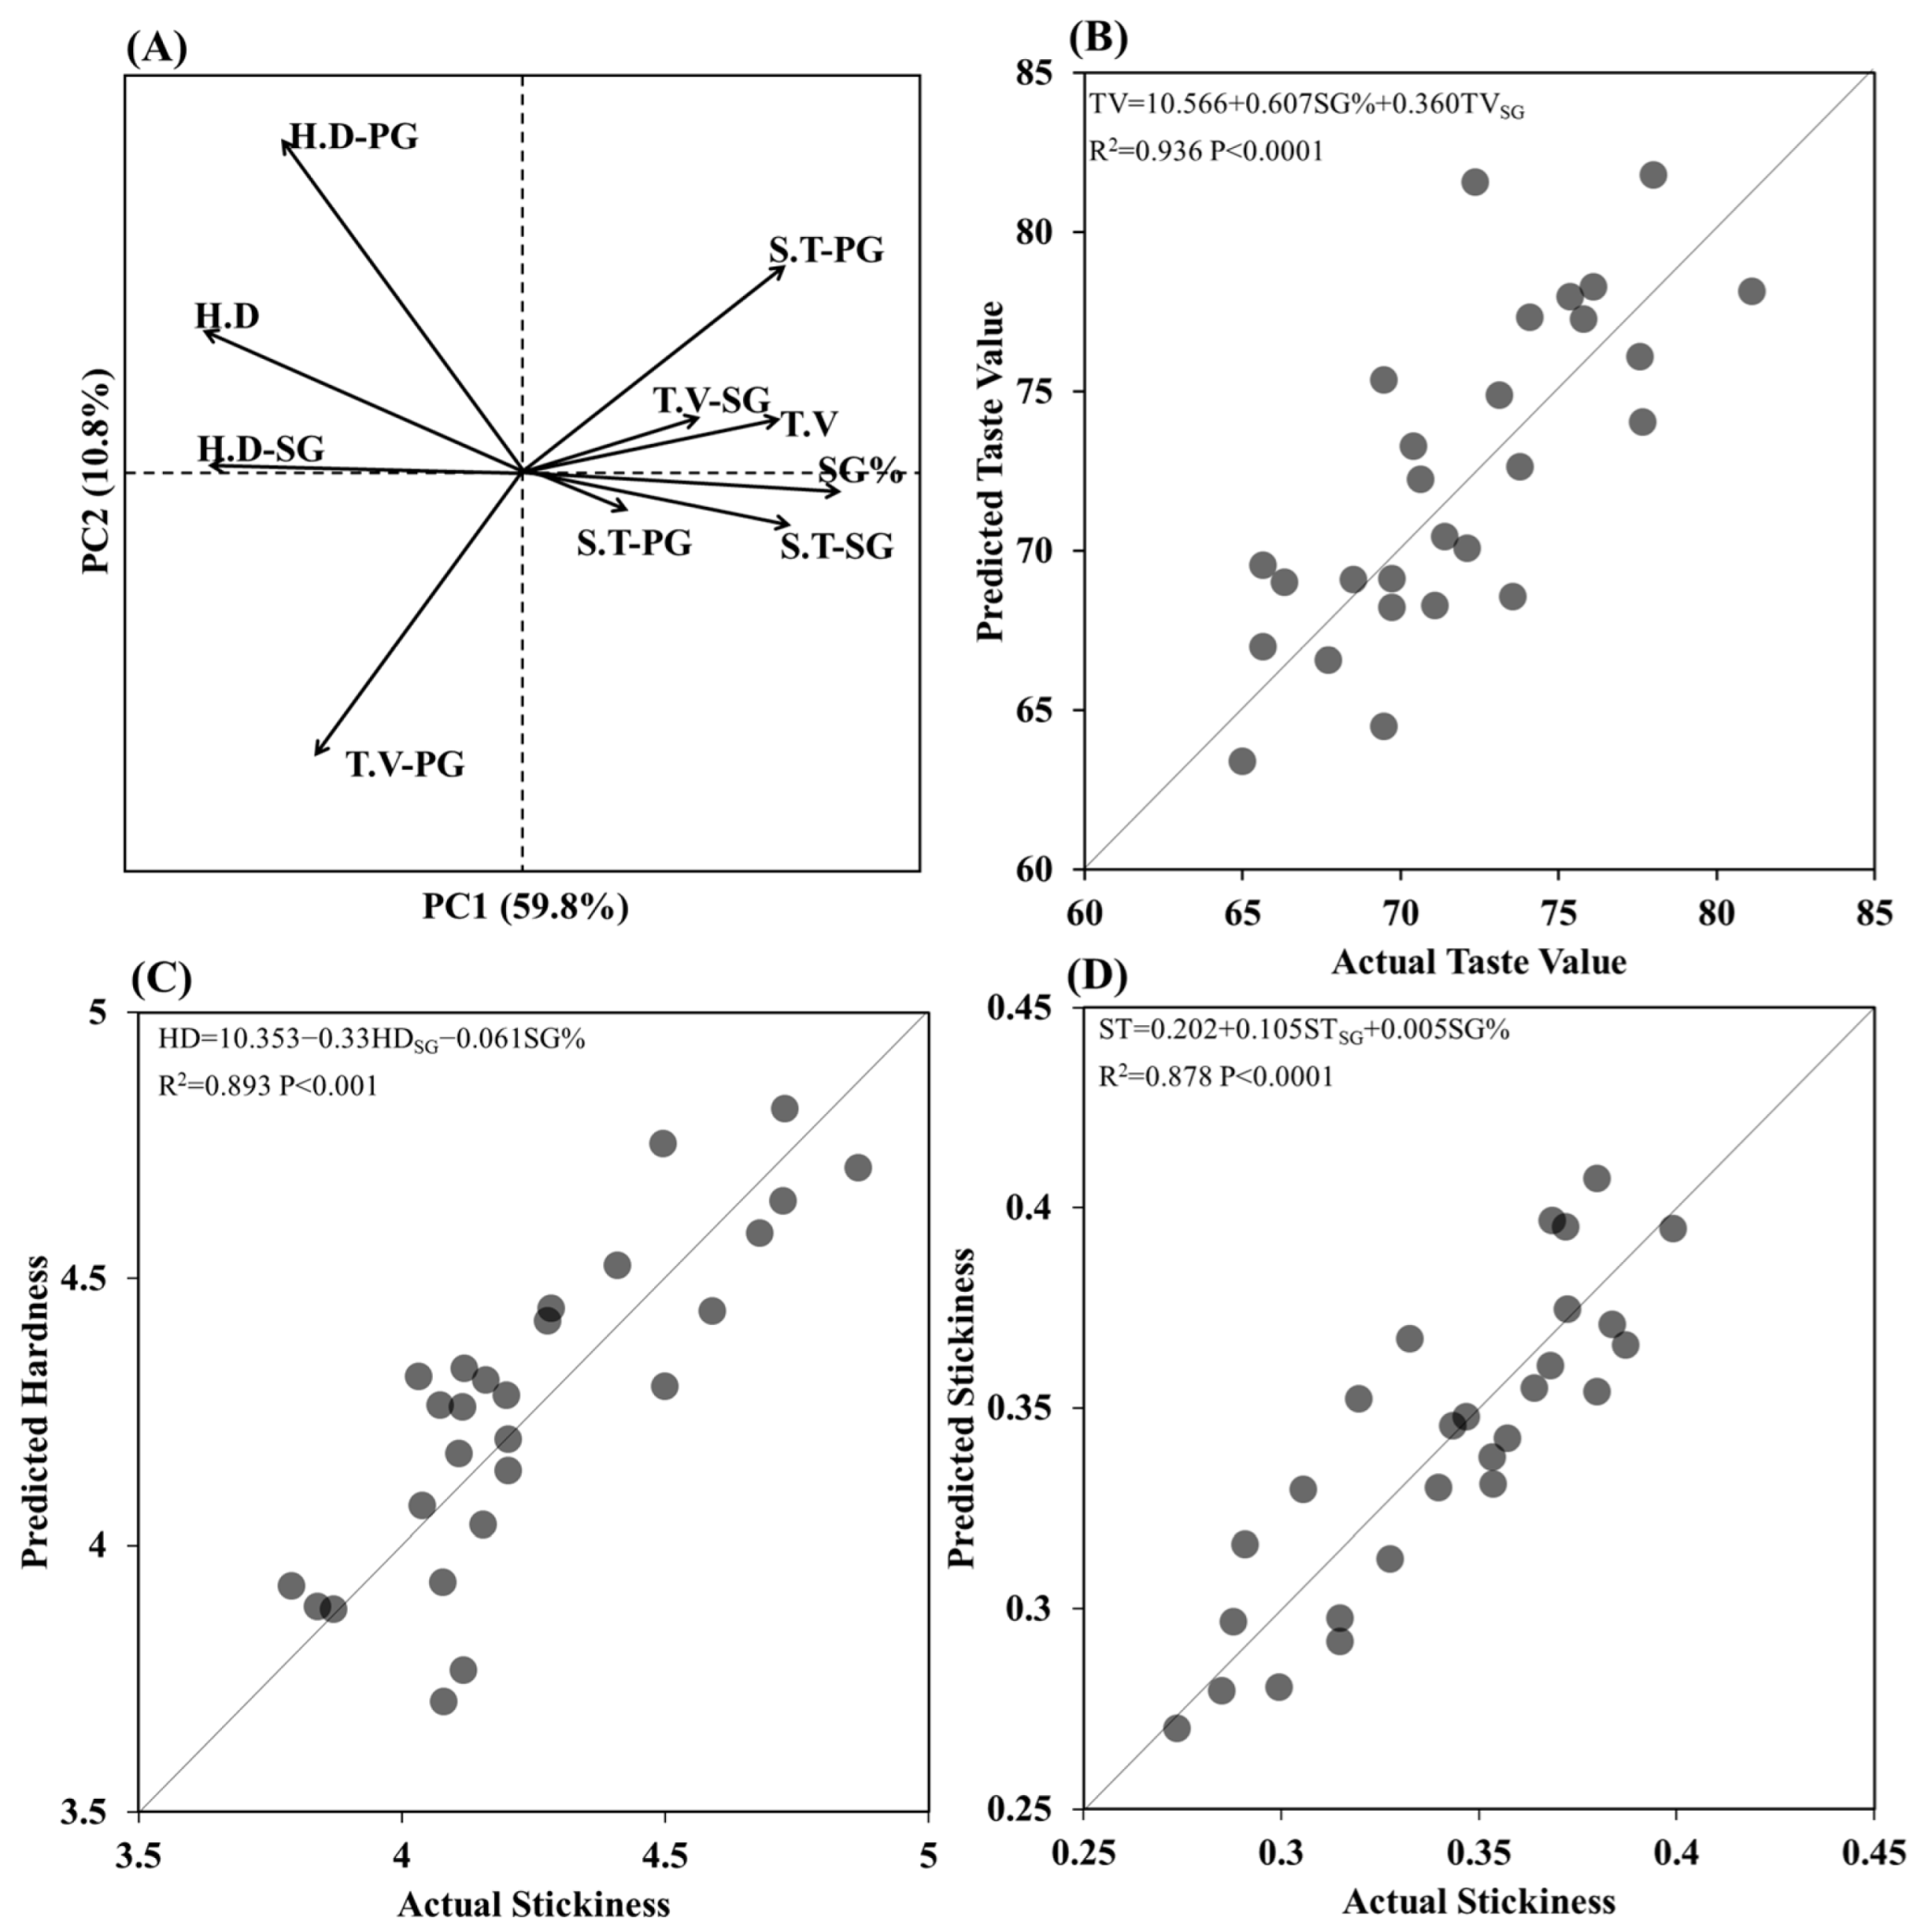
3.5. Correlation Analysis of Structural and Physiological Parameters of Grains Located on SG, PG and TG

The loading score of principal components analysis (PCA) suggested that Tmean, Tnight, Tday, Smean and D/N, respectively, of after flowering stage were positively related to SB, ST, TV and PKV of the population, however the AC, HD, and BD showed negative correlations (Figure 5A). The No.SG, No.S and SG% were positively related to Tmean, Tnight, Tday and Smean, respectively, of before flowering stage, while they were negatively related to D/N and GD, respectively (Figure 5). The AC, HD, CPV, HPV and BD of the population significantly decreased with SG%, whilst TV, ST, PKV and SB increased with SG (Figure 7). These results proved that the cooking and quality variation of the population could also be attributed to spikelets branching structure. The loading score of principal component analysis (PCA) suggested that TV, ST and HD of the population were closely related to SG%, ST, HD and TV of SG in both varieties (Figure 8). The result of stepwise regression analysis showed that TV of the population increased with SG% as well as taste value of SG in both varieties (Figure 8). The above results indicated that sowing date regulates the amount and quality of SG via altering before- and after-flowering stage meteorological parameters, respectively, which further leads to higher cooking and taste quality of japonica rice.

4. Discussion

In the lower and middle reaches of Yangtze River, farmers adjust rice sowing dates due to the target cultivation difference [4,22]. Deng et al., 2021 reported that early sowing date caused an elevation of filling stage temperature and deterioration of quality [23]. This negative effect will be aggravated in the coming decades due to global warming induced increasing frequency and intensity of high temperature stress [24]. Oppositely, delayed sowing date was proved to be related to better taste quality and physiochemical properties [2]. Adjusting sowing date is one of the effective cultivation strategies to manipulate the environmental factors during the growing season [22,25]. However, the effect of sowing date adjustment on thermal resources mainly depends on the experimental site, varieties and cultivation methods (manual or mechanically transplantation). Our results suggest that the delayed sowing date significantly decreased the Tmean, Tday, Tnight and Smean at after heading in lower and middle reaches of Yangtze River, which is essential for rice quality formation (Figure 1) [26]. As result of meteorological alteration, grain quality of both tested varieties was increased by delaying sowing, while both tested rice varieties matured safely and harvested normally (Figure 4 and Figure S3).
Grains located on different positions of the panicle showed differential grain quality since their uneven starch biosynthesis ability [2,14]. The starch biosynthesis of grains located in lower secondary branches (SG) was sensitive to abiotic or biotic stresses, whilst grains located in higher primary branches (PG) showed less or even no sensitivity [13,27] (Figure 3). Therefore, the underlying quality variation mechanism of grains located on different positions is of great importance. In this study, we evaluated the effect of adjusting sowing date and deciphered the grain quality responsive mechanism of SG and PG using starch biosynthesis, nutritional quality, taste quality and RVA characteristics of grains. The physiochemical properties of starch in SG of both varieties were largely altered by environmental factors at filling period, however, PG showed no significant differences in this study (Figure 4).
Our result suggests that total starch and amylose content are significantly reduced by delayed sowing via down-regulating the enzymes activities related to starch biosynthesis (GBSS, SSS, AGPase and SBE), whilst amylopectin biosynthesis was less regulated in this study (Figure 3). Similar to previous work, a lower total starch content is mainly caused by low efficiency of starch biosynthesis under low filling stage temperature [1]. The pattern of AGPase and GBSS activity was consistent with the total starch and amylose accumulation in different sowing date treatments (Table 1). This finding is similar to previous studies, which indicated that lower reproductive stage temperature enhanced rice quality through suppressing the starch biosynthesis enzymes activities [28,29]. Furthermore, SBE and SSS, which are responsible for modifying the branches of amylopectin and amylopectin biosynthesis, showed less difference in responding to different sowing dates. Xia et al., 2016 found that amylopectin content as well as SBE activity decreased together under low temperature [30]. In contrast, Jing et al., 2021 demonstrated SBE was not significantly regulated by 1.3 °C temperature reduction [31]. The contrasting results may be explained by temperature difference, filling stage temperature lower than a critical temperature may induced irreversible and negative effect on starch biosynthesis related enzymes.
Cooking and taste quality are usually tested based on artificial sensory taste, which is an effective way to reflect people’s preference of cooked rice. However, the result of artificial sensory taste depends on a tester’s preference, with strong subjectivity. Nowadays, the use of a texture analyzer (STA1B) and rapid viscosity analysis (RVA) could be effective for evaluating rice cooking and taste quality [14,32]. In the present study, the PKV and BD of SG significantly increased with lower after heading Tmean, Tday, Tnight and Smean, but SB, CPV, and HPV decreased at the same time, whereas the RVA profiles of PG showed no significant alterations (Figure 4). Statistical analysis indicated that PKV and BD are positively correlated with TV and ST, but negatively correlated with HD (Figure 5). This finding is consistent with previous work, Chen et al., 2021 reported that variation of RVA was largely explained by amylose content difference, higher PKV and BD contributed to higher taste value for 36 different rice varieties [33]. The correlation analysis indicated that lower after flowering thermal resources at delayed sowing contributed to elevated texture properties and optimized RVA profiles via grain filling alteration [34].
Most previous studies mainly discussed the correlations between rice taste value and environmental factors at after-flowering stage since starch biosynthesis is the major regulator of quality formation. However, a recent study demonstrated that temperature before heading also regulated grain quality to some extent [23]. In the present study, delayed sowing date not only altered the after flowering thermal resources, but also elevated Tmean, Tday, Tnight and Smean, meanwhile reduced D/N at before heading, and contributed shortened GD (Figure 1). The PCA results showed that environmental changes under delayed sowing date treatment enhanced the spikelets number per panicle (No.S) by enhancing the number of SG per panicle (No.SG), while number of PG per panicle (No.PG) remained stable (Figure 5 and Figure 6). The branching structure variation under delayed sowing dates contributed to higher ratio of SG per unit area (SG%) and could be explained by tillering dynamics. Panicle emergence ratio of higher tiller (secondary tiller or tertiary tiller), with less No.S and No.SG, was largely decreased by shortened before heading GD under delaying sowing and led to higher SG% (Supplementary Figure S1). This result is consistent to previous work, Xu et al., (2018) reported that spikelets number was enhanced by shortening growth duration [35].
In this study, the quality difference between SG and PG as well as their amount determine the grain quality of the total population together (Figure 8). Consistent to previous works, SG showed higher PKV, BD, ST and TV as well as lower SB, CPV and HPV compared to PG (Figure 4) [14]. Previous work demonstrated that grains in lower secondary branches not only had low amylose content and flour gel consistency but also could be affected by agronomic techniques, whereas grains in upper primary branches did not respond to management treatments [36,37]. This present study indicated that starch biosynthesis, physiochemical, texture and thermal properties of SG could be significantly regulated by sowing date treatments, whereas PG did not respond to management treatments (Figure 3 and Figure 4). However, limited studies have focused on the synergistic effect of spikelets structure and differential grain quality distribution among the spikelets on rice quality. Based on the quality difference among different grains (Figure 4), it could be hypothesized that qulitative and quantitative variation of grains located on different positions both plays regulative roles in populational quality formation under varying environments. Correlation analysis indicated that quality variation of the whole population could also be attributed to the fact that delayed sowing dates increased the SG% (Figure 6). Stepwise-regression analysis predicted that rice population containing more SG is predicted to be with higher TV, ST and lower HD. Due to the correlation between SG% and panicle size, it could be summarized that achieving larger panicle size in the field not only enlarges yield potential, but also could enhance rice cooking and taste quality via enhancing number of better-quality grains per unit area.

5. Conclusions

Delayed sowing treatment mainly regulated the amount and quality of SG via altering the before- and after-flowering stage meteorological parameters, respectively. Alteration of quality (regulated by starch biosynthesis) and amount (regulated by tillering dynamics) of grains in different positions both contributed to lower AC, HD, CPV, HPV and SB but higher PKV, BD, ST and TV as the whole population. Statistical analysis suggested that higher SG% and panicle size is necessary in the field to improve the quality of mechanically transplanted rice. Collectively, the present study provides evidence that branching structure variation could be considered as a descriptive trait for rice population quality performance under different environments.

Supplementary Materials

The following supporting information can be downloaded at: https://0-www-mdpi-com.brum.beds.ac.uk/article/10.3390/agronomy12061316/s1, Figure S1: Tiller dynamics in different positions of N7 and N9108; Figure S2: Grain yield of N7 and N9108 under different sowing dates; Figure S3: Grain yield of N7 and N9108 under different sowing dates in 2019 and 2020; Table S1: Branching structure of panicles in different tiller positions under different sowing dates.

Author Contributions

Conceptualization, G.L. and C.X.; methodology, G.L., C.X. and B.L.; investigation, B.L., F.Y. (Fei Yang), L.L., C.D. and Z.J.; writing—original draft preparation, B.L., Y.Z., F.Y. (Feiyu Yan) and C.X., writing—review and editing, Z.J. and C.X.; project administration, Z.L., Y.D., W.L. and G.L. C.X. and B.L. have contributed equally to the article. All authors have read and agreed to the published version of the manuscript.

Funding

This work was funded by the National Key Research and Development Program of China (2018YFD0300803, 2017YFD0300100, and 2017YFD0301204), Key Research and Development Program of Jiangsu Province (BE2017369), and the Jiangsu Agriculture Science and Technology Innovation Fund [CX(18)1002].

Institutional Review Board Statement

Not applicable.

Informed Consent Statement

Not applicable.

Data Availability Statement

Not applicable.

Conflicts of Interest

The authors declare no conflict of interest.

References

  1. Xu, C.; Yang, F.; Tang, X.; Lu, B.; Li, Z.; Liu, Z.; Ding, Y.; Ding, C.; Li, G. Super Rice With High Sink Activities Has Superior Adaptability to Low Filling Stage Temperature. Front. Plant Sci. 2021, 12, 729021. [Google Scholar] [CrossRef] [PubMed]
  2. Wang, W.; Cui, W.; Xu, K.; Gao, H.; Zhang, H. Effects of Early- and Late-Sowing on Starch Accumulation and Associated Enzyme Activities During Grain Filling Stage in Rice. Rice Sci. 2021, 28, 191–199. [Google Scholar]
  3. Deng, N.; Ling, X.; Sun, Y.; Zhang, C.; Fahad, S.; Peng, S.; Cui, K.; Nie, L.; Huang, J. Influence of temperature and solar radiation on grain yield and quality in irrigated rice system. Eur. J. Agron. 2015, 64, 37–46. [Google Scholar] [CrossRef]
  4. Ding, Y.; Wang, W.; Zhuang, Q.; Luo, Y. Adaptation of paddy rice in China to climate change: The effects of shifting sowing date on yield and irrigation water requirement. Agric. Water Manag. 2019, 228, 105890. [Google Scholar] [CrossRef]
  5. Zhou, N.B.; Zhang, J.; Fang, S.L.; Wei, H.Y.; Zhang, H.C. Effects of temperature and solar radiation on yield of good eating-quality rice in the lower reaches of the Huai River Basin, China. Sci. Agric. Sin. 2021, 20, 1762–1774. [Google Scholar] [CrossRef]
  6. Pan, T.; Zhao, L.; Lin, L.; Wang, J.; Liu, Q.; Wei, C. Changes in kernel morphology and starch properties of high-amylose brown rice during the cooking process. Food Hydrocoll. 2017, 66, 227–236. [Google Scholar] [CrossRef]
  7. Nishi, A.; Nakamura, Y.; Tanaka, N.; Satoh, H. Biochemical and Genetic Analysis of the Effects ofAmylose-Extender Mutation in Rice Endosperm. Plant Physiol. 2001, 127, 459–472. [Google Scholar] [CrossRef]
  8. Kato, T.; Shinmura, D.; Taniguchi, A. Activities of Enzymes for Sucrose-Starch Conversion in Developing Endosperm of Rice and Their Association with Grain Filling in Extra-Heavy Panicle Types. Plant Prod. Sci. 2007, 10, 442–450. [Google Scholar] [CrossRef]
  9. Satoh, H.; Nishi, A.; Yamashita, K.; Takemoto, Y.; Tanaka, Y.; Hosaka, Y.; Sakurai, A.; Fujita, N.; Nakamura, Y. Starch-branching enzyme I-deficient mutation specifically affects the structure and properties of starch in rice endosperm. Plant Physiol. 2003, 133, 1111–1121. [Google Scholar] [CrossRef] [Green Version]
  10. Bu-Hong, Z.; Wen-Jie, Z.; Zhi-Qin, W.; Qin-Sen, Z.; Jian-Chang, Y. Changes in Activities of the Key Enzymes Related to Starch Synthesis in Rice Grains During Grain Filling and Their Relationships with the Filling Rate and Cooking Quality. Sci. Agric. Sin. 2005, 4, 26–33. [Google Scholar]
  11. Siddik, M.A.; Zhang, J.; Chen, J.; Qian, H.; Jiang, Y.; Raheem, A.K.; Deng, A.; Song, Z.; Zheng, C.; Zhang, W. Responses of indica rice yield and quality to extreme high and low temperatures during the reproductive period. Eur. J. Agron. 2019, 106, 30–38. [Google Scholar] [CrossRef]
  12. Sreenivasulu, N.; Butardo, V.M., Jr.; Misra, G.; Cuevas, R.P.; Anacleto, R.; Kavi Kishor, P.B. Designing climate-resilient rice with ideal grain quality suited for high-temperature stress. J. Exp. Bot. 2015, 66, 1737–1748. [Google Scholar] [CrossRef] [PubMed] [Green Version]
  13. Yang, J.; Zhang, J. Grain-filling problem in ‘super’ rice. J. Exp. Bot. 2010, 61, 1–5. [Google Scholar] [CrossRef] [PubMed] [Green Version]
  14. Zhu, D.; Fang, C.; Qian, Z.; Guo, B.; Huo, Z. Differences in starch structure, physicochemical properties and texture characteristics in superior and inferior grains of rice varieties with different amylose contents. Food Hydrocoll. 2021, 110, 106170. [Google Scholar] [CrossRef]
  15. Ling, Q.; Zhang, H. Discussion about Rice High Yield Population and Optimization. Sci. Agric. Sin. 1993, 26, 11. (In Chinese) [Google Scholar]
  16. Limpisut, P.; Jindal, V.K. Comparison of Rice Flour Pasting Properties using Brabender Viscoamylograph and Rapid Visco Analyser for Evaluating Cooked Rice Texture. Starch-Stärke 2002, 54, 350–357. [Google Scholar] [CrossRef]
  17. Zhang, C.; Zhou, L.; Zhu, Z.; Lu, H.; Zhou, X.; Qian, Y.; Li, Q.; Lu, Y.; Gu, M.; Liu, Q. Characterization of Grain Quality and Starch Fine Structure of Two Japonica Rice (Oryza Sativa) Cultivars with Good Sensory Properties at Different Temperatures during the Filling Stage. J. Agric. Food Chem. 2016, 64, 4048–4057. [Google Scholar] [CrossRef]
  18. Zhu, D.; Zhang, H.; Guo, B.; Xu, K.; Dai, Q.; Wei, C.; Wei, H.; Gao, H.; Hu, Y.; Cui, P. Effect of Nitrogen Management on the Structure and Physicochemical Properties of Rice Starch. J. Agric. Food Chem. 2016, 64, 8019–8025. [Google Scholar] [CrossRef]
  19. Man, J.; Yang, Y.; Zhang, C.; Zhou, X.; Wei, C. Structural Changes of High-Amylose Rice Starch Residues following in Vitro and in Vivo Digestion. J. Agric. Food Chem. 2012, 60, 9332–9341. [Google Scholar] [CrossRef]
  20. Yang, J.; Zhang, J.; Wang, Z.; Zhu, Q.; Liu, L. Activities of enzymes involved in sucrose-to-starch metabolism in rice grains subjected to water stress during filling. Field Crops Res. 2003, 81, 69–81. [Google Scholar] [CrossRef]
  21. Nakamura, Y.; Yuki, K.; Park, S.Y.; Ohya, T. Carbohydrate Metabolism in the Developing Endosperm of Rice Grains. Plant Cell Physiol. 1989, 30, 833–839. [Google Scholar] [CrossRef]
  22. Waongo, M.; Laux, P.; Kunstmann, H. Adaptation to climate change: The impacts of optimized planting dates on attainable maize yields under rainfed conditions in Burkina Faso. Agric. For. Meteorol. 2015, 205, 23–39. [Google Scholar] [CrossRef] [Green Version]
  23. Deng, F.; Zhang, C.; He, L.; Liao, S.; Li, Q.; Li, B.; Zhu, S.; Gao, Y.; Tao, Y.; Zhou, W. Delayed sowing date improves the quality of mechanically transplanted rice by optimizing temperature conditions during growth season. Field Crops Res. 2022, 281, 108493. [Google Scholar] [CrossRef]
  24. Balwinder-Singh; Humphreys, E.; Sudhir-Yadav; Gaydon, D.S. Options for increasing the productivity of the rice–wheat system of north-west India while reducing groundwater depletion. Part 1. Rice variety duration, sowing date and inclusion of mungbean. Field Crops Res. 2015, 173, 68–80. [Google Scholar] [CrossRef] [Green Version]
  25. Rurinda, J.; Wijk, M.; Mapfumo, P.; Descheemaeker, K.; Supit, I.; Giller, K. Climate change and maize yield in southern Africa: What can farm management do? Glob. Chang. Biol. 2016, 21, 4588–4601. [Google Scholar] [CrossRef]
  26. Shi, W.; Yin, X.; Struik, P.C.; Solis, C.; Xie, F.; Schmidt, R.C.; Huang, M.; Zou, Y.; Ye, C.; Jagadish, S.V.K. High day- and night-time temperatures affect grain growth dynamics in contrasting rice genotypes. J. Exp. Bot. 2017, 18, 5233–5245. [Google Scholar] [CrossRef] [Green Version]
  27. Wang, G.Q.; Li, H.X.; Feng, L.; Chen, M.X.; Meng, S.; Ye, N.H.; Zhang, J. Transcriptomic analysis of grain filling in rice inferior grains under moderate soil drying. J. Exp. Bot. 2019, 70, 1597–1611. [Google Scholar] [CrossRef] [Green Version]
  28. Dong, M.H.; Chen, P.F.; Qiao, Z.Y.; Xiang-Zhou, W.U.; Zhao, B.H.; Jiang, Y.Y.; Yang, J.C. Quality Response of Grains in Different Spikelet Positions to Temperature Stress During Grain Filling of Rice. Acta Agron. Sin. 2011, 37, 506–513. [Google Scholar] [CrossRef]
  29. Xfa, B.; Yl, A.; Yun, Z.A.; Jw, A.; Jie, Z.A.; Xs, A.; Yp, A.; Xb, A.; Cza, B.; Dza, B. Characterization of physicochemical qualities and starch structures of two indica rice varieties tolerant to high temperature during grain filling. J. Cereal Sci. 2022, 93, 102966. [Google Scholar]
  30. Xia, N.; Zhao, H.W.; Yan-Chao, L.V.; Zhao, Z.D.; Zou, D.T.; Liu, H.L.; Wang, J.G.; Jia, Y. Effect of Cold-water Stress at Grain-filling Stage on Starch Accumulation and Related Enzyme Activities in Grains of japonica Rice in Cold-region. Chin. J. Rice Sci. 2016, 30, 62–74. [Google Scholar]
  31. Jing, L.; Chen, C.; Lu, Q.; Wang, Y.; Yang, L. How do elevated atmosphere CO2 and temperature alter the physiochemical properties of starch granules and rice taste? Sci. Total Environ. 2020, 766, 142592. [Google Scholar] [CrossRef] [PubMed]
  32. Cza, B.; Wh, B.; Yan, L.B.; Yong, Y.B.; Zc, B.; Ql, B.; Xf, B.; Jl, C.; Qla, B. A comparative evaluation of the effect of SSI and Wx allelic variation on rice grain quality and starch physicochemical properties. Food Chem. 2022, 371, 131205. [Google Scholar]
  33. Chen, H.; Chen, D.; He, L.; Wang, T.; Ren, W. Correlation of taste values with chemical compositions and Rapid Visco Analyser profiles of 36 indica rice (Oryza sativa L.) varieties. Food Chem. 2021, 349, 129176. [Google Scholar] [CrossRef] [PubMed]
  34. Zhang, J.; Zhang, Y.Y.; Song, N.Y.; Chen, Q.L.; Zhao, Q.Z. Response of grain-filling rate and grain quality of mid-season indica rice to nitrogen application. J. Integr. Agric. 2021, 20, 1465–1473. [Google Scholar] [CrossRef]
  35. Le, X.; Zhan, X.; Yu, T.; Nie, L.; Huang, J.; Cui, K.; Fei, W.; Yong, L.; Peng, S. Yield performance of direct-seeded, double-season rice using varieties with short growth durations in central China. Field Crops Res. 2018, 227, 49–55. [Google Scholar]
  36. Cai, Y.X.; Zhu, Q.S.; Wei, X.U.; Wang, W.; Yang, J.C.; Zhang, Z.J.; Lang, Y.Z. Effects of Water Stress on the Main Characters of Superior and Inferior Grains Quality and the Properties of RVA Profile during Grain-filling Stage. Acta Agron. Sin. 2004, 30, 241–247. [Google Scholar]
  37. Chen, P.; Gu, J.; Han, L.; Qiao, Z.; Wang, J.; Zhu, Y.; Dong, M. Effects of returning wheat straw to farmland and irrigation pattern on grain setting traits and quality of super rice. Chin. J. Eco-Agric. 2014, 22, 543–550. [Google Scholar]
Figure 1. Environmental parameters and growth duration for different sowing dates before heading and after heading in 2019 (AF) and 2020 (GL). Note: Red dots in the plot indicated environmental parameters at before heading, blue dots in the plots indicated environmental parameters at after heading.
Agronomy 12 01316 g001
Figure 2. Grain filling characteristics of grains located on different positions and sowing dates of N7 (A,C,E,G) and N9108 (B,D,F,H). Note: White dots represents grains located on secondary branches (SG); Black dots represents grains located on primary branches (PG); Grey dots represents total grains (TG). CV represents covariance of 3 biological replicates. N7 and N9108 represents Nanjing 7 and Nanjing 9108, respectively.
Agronomy 12 01316 g002
Figure 3. Grain filling dynamics and starch biosynthesis activity dynamics of grains located on different positions and sowing dates of japonica rice varieties. (A) Grain filling dynamics; (B,C): sucrose content dynamics; (D,E): starch content dynamics; (F,G): AGPase activity; (H,I): GBSS activity; (J,K): SSS activity; (L,M): SBE activity. Note: Black dots represented N7 and white dots indicated N9108. Note: AGPase represents ADP-glucose pyrophosphorylase; SSS represents soluble starch synthase; GBSS represents granules bound starch synthase; SBE represents starch branching enzyme.
Agronomy 12 01316 g003
Figure 4. Cooking and taste quality parameters and RVA characteristics of grains located on different positions and sowing dates of N7 (AJ) and N9108 (KT). Note: White dots represents grains located on secondary branches (SG); Black dots represents grains located on primary branches (PG); Grey dots represents total grains (TG). CV represents covariance of 3 biological replicates. N7 and N9108 represents Nanjing 7 and Nanjing 9108, respectively.
Agronomy 12 01316 g004
Figure 5. Principal components analysis among after and before heading environmental factors with quality formation related characteristics (A) and branching structure (B), respectively. Note: H.D represents hardness of rice; S.T represents stickiness of rice; T.V represents taste value of rice; A.C represents amylose content of rice; A.M represents amylopectin content of rice; P.K.V represents peak viscosity of rice; C.P.V represents cold paste viscosity of rice; H.P.V represents hot paste viscosity of rice; S.B represents setback of rice; B.D represents breakdown of rice; P.T represents pasting temperature of rice; S.mean represents average solar radiation of rice; T.mean represents average temperature of rice; T.night represents night temperature of rice; T.day represents day temperature of rice; D.N represents ratio of day and night duration of rice; G.D represents growth duration of rice; No.S represents spikelets number per panicle of rice; No.SG represents number of grains located in secondary branches of rice; No.PG represents number of grains located in primary branches of rice; SG% represents ratio of grains located in secondary branches of rice; PG% represents ratio of grains located in secondary branches of rice.
Agronomy 12 01316 g005
Figure 6. Spikelets structure of N7 and N9108 in different sowing date treatments. (A): Ratio of grains in secondary branches per unit area (SG%); (B): Number of grains in secondary branches per panicle; (C): Spikelets number panicle; (D): Number of grains in primary branches per panicle.
Agronomy 12 01316 g006
Figure 7. Relationship between physiochemical properties, texture properties, RVA profiles and filling characteristics with ratio of grains located in secondary branches (SG%). (AE): Cooking and taste quality; (FK): RVA parameters; (LO): grain filling parameters. Note: Black dots represented the performance of N7 and white dots represented the performance of N9108.
Agronomy 12 01316 g007
Figure 8. PCA analysis among taste value characteristics of grains located on different position (A) and of the population and the Stepwise regression analysis of taste value (B), hardness (C) and stickiness (D). Note: H.D represents hardness of rice; H.D-PG represents hardness of grains located in primary branches (PG); H.D-SG represents hardness of grains located in secondary branches (SG); S.T represents hardness of rice; S.T-PG represents hardness of PG; S.T-SG represents hardness of SG; T.V represents hardness of rice; T.V-PG represents hardness of PG; T.V-SG represents hardness of SG; SG% represents ratio of SG per unit area.
Agronomy 12 01316 g008
Table 1. Correlation analysis among grain quality, filling characteristics and enzyme activities.
(a) Correlations between Filling Characteristics and Taste Quality Parameters
Taste Quality CharacteristicsGRmeanGrmaxTmaxD
AC0.881 **0.790 **−0.782 *−0.782 *
PC0.9020.879 *−0.834−0.678 *
ST−0.906 **−0.900 *0.851 **0.617 **
HD0.787 **0.823 *−0.740 *−0.604 *
TV−0.961 **−0.859 *0.847 *0.745 **
PKV−0.917 **−0.838 **0.866 **0.571 *
HPV−0.498 *−0.5910.3030.466 *
BD0.719 *0.670 *−0.752 *−0.343
CPV−0.916 *−0.836 **0.835 **0.577 *
SB0.946 **0.820 *−0.880 *−0.705 *
PT−0.072−0.1440.246−0.135
(b) Correlations between Filling Characteristics and Enzyme Activities
Starch Related EnzymesDays After FloweringGRmeanGRmaxTmaxD
AGPase50.962 **0.842 *−0.885 *−0.763 *
100.939 *0.837 **−0.884 **−0.653 *
150.886 **0.851 *−0.880 **−0.554
SSS50.3560.202−0.216−0.539
100.901 **0.763 **−0.777**−0.803 **
150.937 *0.878 *−0.918 **−0.624 *
GBSS50.631 *0.483−0.522 **−0.789 *
100.5010.518−0.568 *−0.238
150.720 **0.609 *−0.694 *−0.409
SBE50.874 **0.868 *−0.828 *−0.671 **
10−0.175−0.149 *0.0050.306
150.293 **0.379 *−0.327−0.021
Note: H.D represents hardness of rice; S.T represents stickiness of rice; T.V represents taste value of rice; A.C represents amylose content of rice; A.M represents amylopectin content of rice; P.K.V represents peak viscosity of rice; C.P.V represents cold paste viscosity of rice; H.P.V represents hot paste viscosity of rice; S.B represents setback of rice; B.D represents breakdown of rice; P.T represents pasting temperature of rice; GRmean represents mean grain filling rate; GRmax represents max grain filling rate; Tmax represents time to max filling rate; D represents grain filling duration. AGPase represents ADP-glucose pyrophosphorylase; SSS represents soluble starch synthase; GBSS represents granules bound starch synthase; SBE represents starch branching enzyme. ** and * represented significance at 0.01 and 0.05 probability level, respectively.
Publisher’s Note: MDPI stays neutral with regard to jurisdictional claims in published maps and institutional affiliations.

