Article

Genotype Variations in Water Use Efficiency Correspond with Photosynthetic Traits in Tempranillo Grapevine Clones

1
Group on Plant Biology Under Mediterranean Conditions, Department of Biology, INAGEA (INIA-UIB), Carretera de Valldemossa Km 7.5, 07122 Palma de Mallorca, Spain
2
Centro de Estudios Avanzados en Fruticultura (CEAF), Camino Las Parcelas 882, Km 105 Ruta 5 Sur, Sector Los Choapinos, Rengo 2940000, Chile
*
Author to whom correspondence should be addressed.
Submission received: 14 July 2022 / Revised: 31 July 2022 / Accepted: 8 August 2022 / Published: 9 August 2022
(This article belongs to the Special Issue Current Progress in Improving Water Use Efficiency of Vineyards)

Abstract

:
Mediterranean viticulture is highly dependent on soil water availability. Moreover, global warming is likely to increase average temperatures and the frequency of heat waves, thus leading to greater water scarcity. To cope with this situation, much research focused on the selection of genotypes with higher water use efficiency (WUE). Several previous studies indicated that WUE varies between genotypes of the Tempranillo cultivar with some showing interesting improvement in the leaf WUE. Here, we assessed the associations between the leaf WUE and physiological parameters in six selected Tempranillo clones. The plants were cultivated in pots and two water conditions were applied sequentially: a well-watered period followed by a moderate water stress and recovery phase. Growth parameters and intrinsic WUE were monitored during both periods. Pressure–volume and AN/Ci curves were measured after the plants were re-watered. At the end of the season, biomass accumulation and total irrigation water were used to calculate whole plant WUE (WUEWP). AN/Ci curves revealed significant differences in several photosynthetic parameters, including mesophyll conductance (gm), maximum velocity of carboxylation (Vcmax) and leaf respiration (R). Clones RJ51 and 1048 both exhibited high WUE, but presented distinct physiological traits: RJ51 had the highest gm, while genotype 1048, had the lowest R. This study confirms that physiological traits generally explain the intracultivar diversity in WUE observed in previous studies.

1. Introduction

Global warming represents a threat to Mediterranean viticulture due to the expected scarcity of water in the region [1]. Substitution of current cultivars with those more adapted to drought is one of several strategies proposed as adaptions to climate change [2,3,4]. Grapevine cultivars exhibit an invaluable source of genetic variability, with more than 1500 registered cultivars [5]. However, winemakers and consumers frequently prefer the same reputed cultivars and are hesitant to replace their favorite varieties. Moreover, in most viticulture areas, various protection authorities prevent the substitution of traditional cultivars with others. In this context, exploitation of the genetic diversity of specific cultivars could provide one strategy to improve the sustainability of viticulture and fulfil market demands [6,7].
Water use efficiency (WUE) refers to the ratio of biomass accumulated based on water use and, at the leaf level, is defined by the ratio of carbon fixation to water lost through transpiration. WUE is widely used to evaluate the drought tolerance of various cultivars or clones of the same species, between species [8,9], cultivars of the same crop [10,11,12] and clones of specific cultivars [13,14,15,16,17,18,19]. WUE is traditionally assessed at two scales: whole plant WUE (WUEwp) considers the total gain in plant biomass divided by water wasted and intrinsic WUE, whereas WUEi is determined at the leaf scale as the net carbon gain (AN) per unit of stomatal conductance (gs). However, although some positive correlations were reported [20], there is frequently a poor correspondence between the two WUE values [21,22]. Several factors were proposed to explain the discrepancies between leaf and plant WUE, including various unmeasured water or carbon losses, such as night respiration and transpiration, canopy light interception, carbon loss from the roots and carbon allocation changes [20,23,24,25].
After intensive study of the variation in WUE among grapevine cultivars [2,10,26,27], our group evaluated the genetic diversity in WUE within the widespread Spanish Tempranillo cultivar [16]. Tempranillo is one of the most reputed cultivars in Spain and has a wide geographical distribution, with over 50 commercial clonal lines available to winemakers [7]. We initially focused on evaluation of WUEi in different clonal collections in situ under field conditions [17]. Subsequently, a selection of 23 contrasting clones was evaluated under controlled conditions to enable a more environmentally controlled evaluation [19], and the clones with the highest and lowest leaf WUE were identified. Moreover, these cultivars exhibited significant variations in production—in terms of biomass or growth parameters—and photosynthetic performance under well-watered conditions and moderate water stress. Based on this work, six clones with varied performances under different water regimes were selected for further study.
We hypothesize that the differences in leaf WUE between Tempranillo clones could be related to variation in hydraulic traits or physiological photosynthetic parameters [28,29]. Osmotic potential, cell wall elasticity or cell capacitance were described as key parameters that control stomatal opening [30,31]. On the other hand, parameters such as mesophyll conductance (gm), maximal carboxylation rate (VCmax) and maximal electron transport rate (J) can explain differences in carbon fixation at the same stomatal conductance [27,32]. Previous studies also suggested that gm represents a target to potentially improve WUEi [28,32], even though the complex, labor-intensive measurement process limits the use of this parameter as a screening tool for large-scale selection programs [33].
Thus, the main objective of the present work was to identify the physiological basis of the differences in WUE performance between the six previously selected Tempranillo clones. Specifically, we assessed the correlations between hydraulic traits determined using P–V curves and photosynthetic traits determined using AN/Ci curves with the biomass accumulated and field measurements of gas exchange.

2. Materials and Methods

2.1. Plant Material and Experimental Conditions

This study assessed six clones of the Tempranillo cultivar (326, 1048, 1052, RJ43, RJ51 and RJ78), which were selected as they had the highest or lowest WUE and values for related characteristics in a previous evaluation of a high-diversity collection of clones [19].
The experiment was carried out in 2018 at the UIB experimental field. Two-year-old plants grafted onto 110-R rootstock (five replicates per genotype) were grown outdoor in 20-L pots filled with organic substrate and perlite mixture (4:1). A geotextile irrigation blanket was used to minimize direct soil evaporation. The vines were pruned to two shoots and one bunch per shoot. During the early growth stage, the plants were irrigated at field capacity and fertilized once a week with Hoagland nutrient solution diluted in distilled water to 25%. The irrigation system consisted of two drippers per plant with a flow rate of 0.5 L h−1 to avoid overflow.
The climate is typical of the Mediterranean area, with hot and dry summers. Meteorological data were collected using a weather station situated in the same experimental field (Meteo3000, Geonica, Madrid, Spain). The mean temperature during spring ranged between 20 and 25 °C. Mean reference evapotranspiration (ETo) during the treatment period ranged from 4 to 5 mm day−1 with a maximum of 5.8 mm day−1.

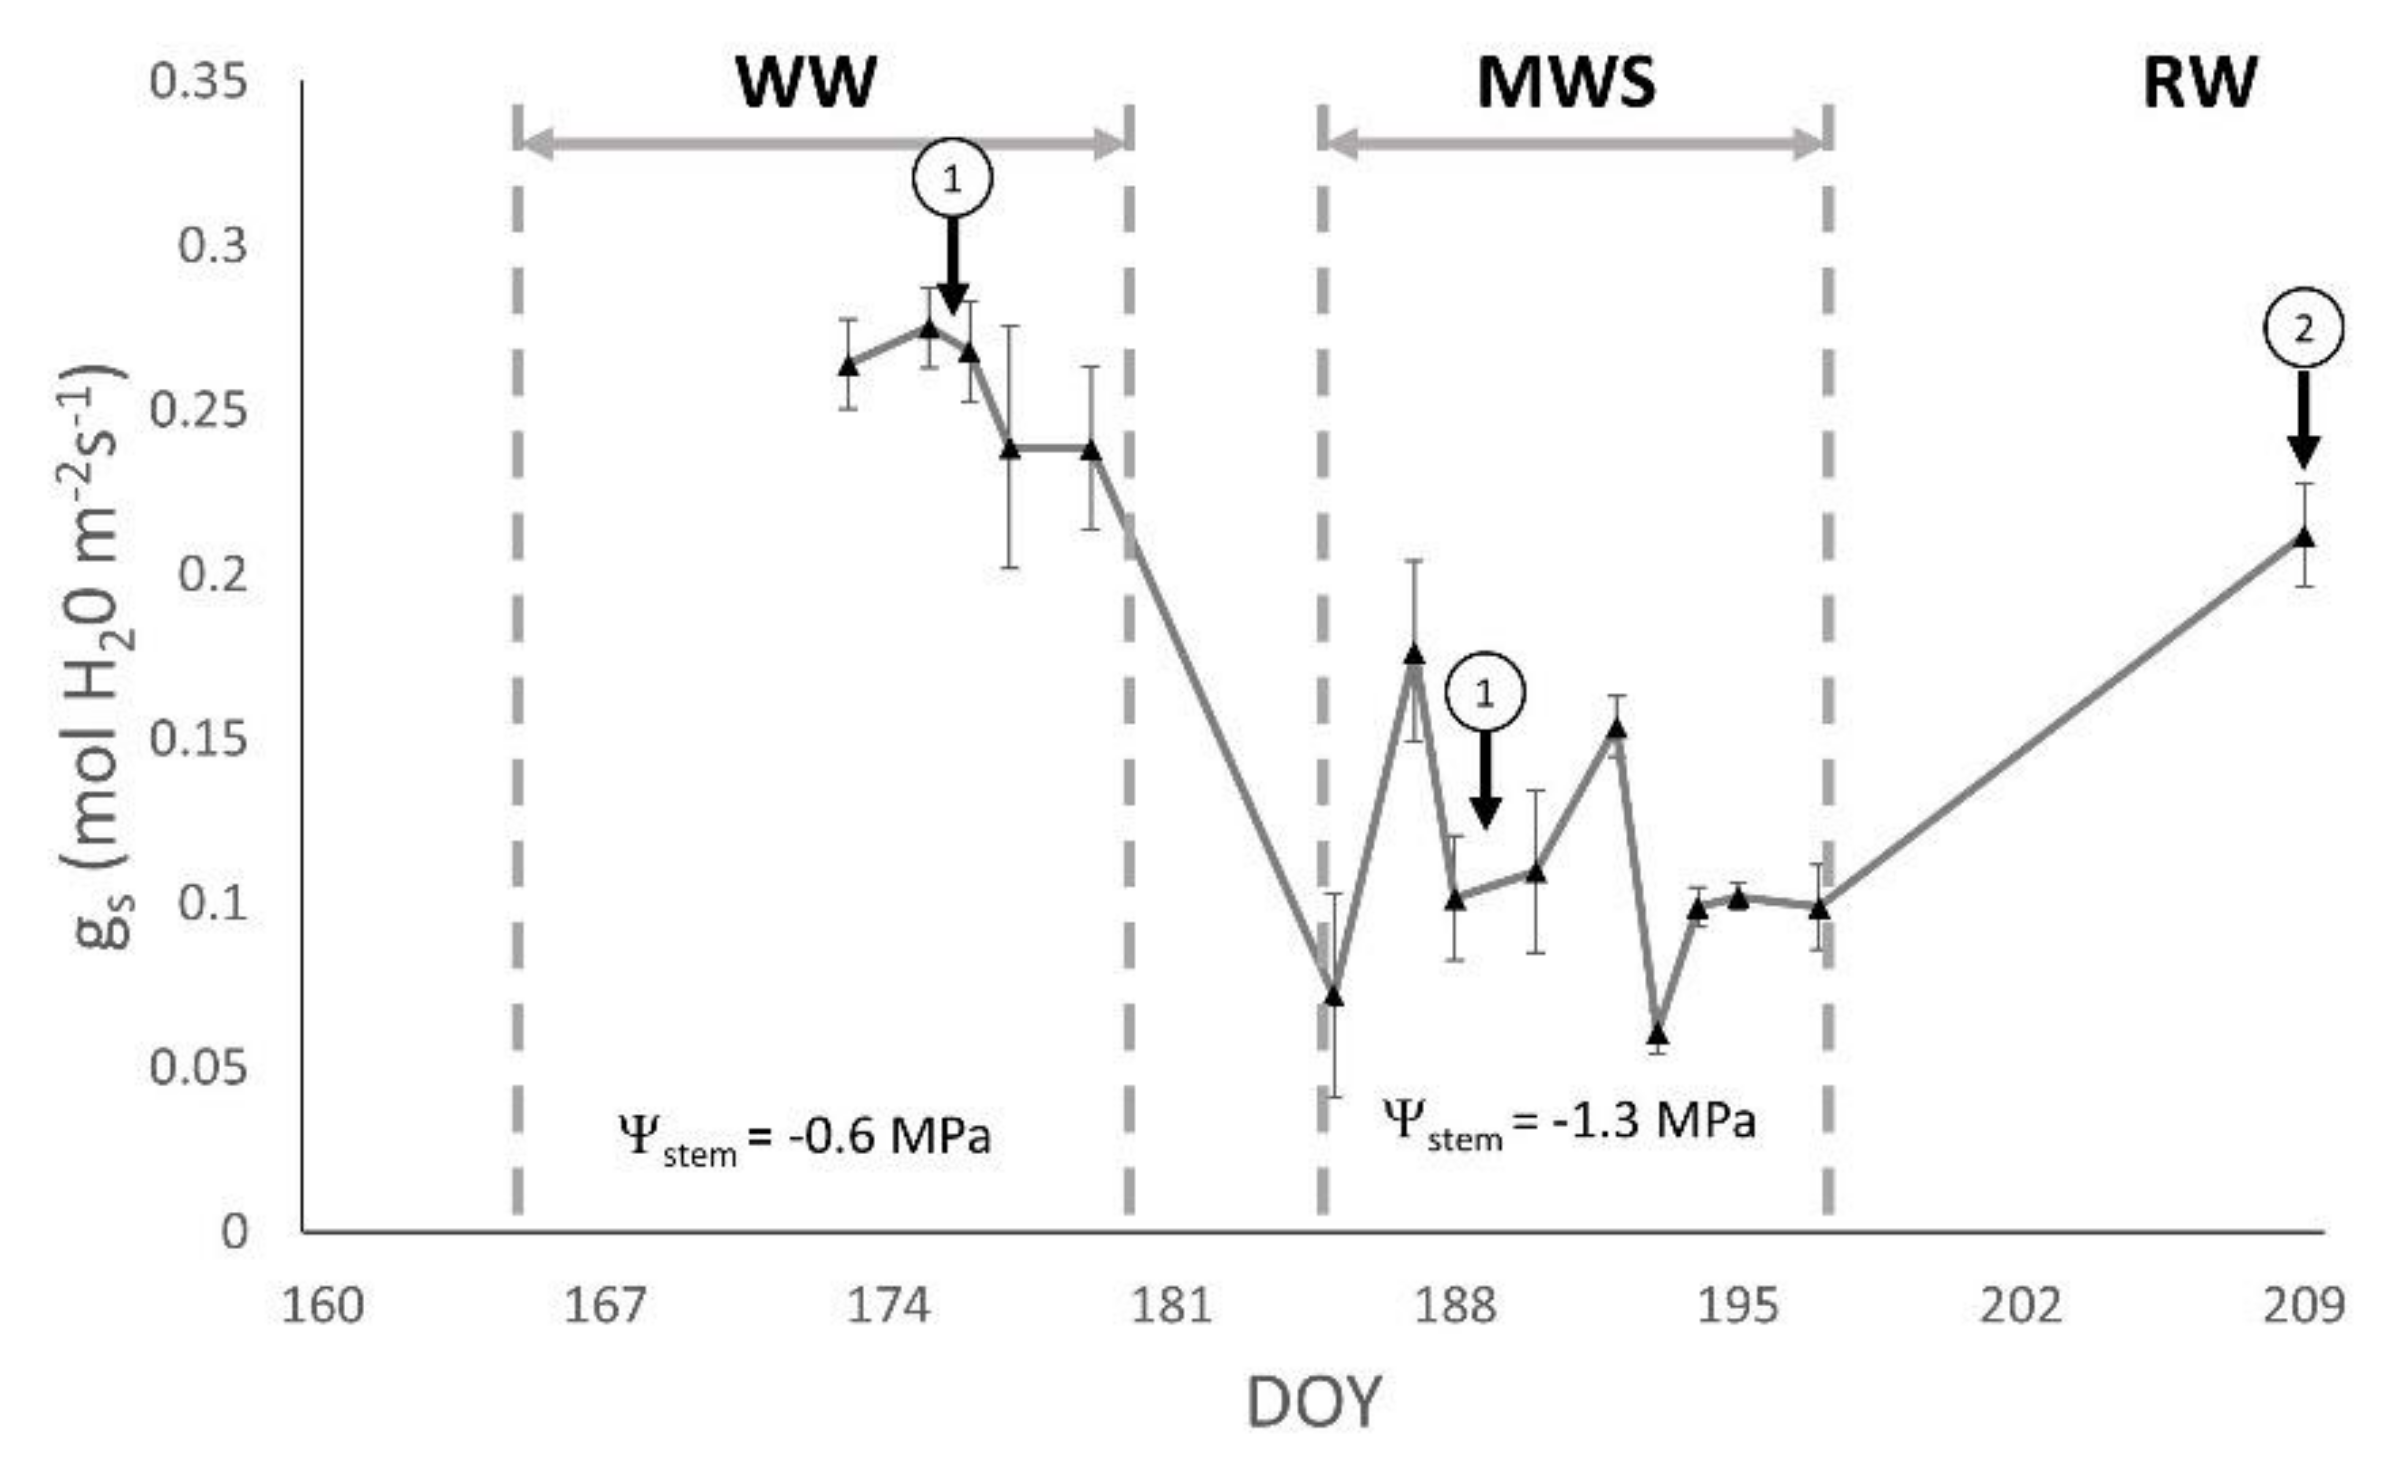
2.2. Experimental Design and Irrigation Treatments

Figure 1 shows the timeline of the experiment. Plants were grown in 20 L pots filled with a perlite/peat soil (1:4) and maintained in well-watered conditions. When plants reached 1.5 m stem length (at DOY—Day of the year—165), the monitoring of plant growth parameters started (see below). At DOY 173, the monitoring of stomatal conductance (gs) started to ensure that plants were under optimal conditions. This was performed by instantaneous gas exchange measurements (see below), every 2–3 days, on a representative subset of plants (n = 10–12). The physiological characterization of all clones was performed on DOY 175 (see “1” in Figure 1) to set the “Control” treatment, when plants are under optimal conditions. This characterization includes instantaneous gas exchange and stem water potential. The irrigation was stopped at DOY 180 for five consecutive days. Stomatal conductance was then measured on a subset of plants and irrigation was restarted to maintain a near-constant plant water status (around 60% of the full irrigation regime), under moderate water stress (MWS) for 10 days. At DOY 188, all clones were characterized again, but under MWS. Plants were then rehydrated to full irrigation at DOY 197, for twelve days. The last measurements (see “2”, in Figure 1) were performed at DOY 209 and included pressure–volume and A/Ci curves.

2.3. Measurements

2.3.1. Plant Water Status

Plant water status was monitored and measured using a Scholander pressure chamber (Soilmoisture Equipment Corp., Santa Barbara, CA, USA) once for each replicate water treatment in the same leaf for which gas exchange measurements were taken. To reduce the leaf-to-leaf variability in one single plant, the stem water potential was considered more appropriate than the leaf water potential. The readings were taken between 13:00 and 14:00 h (local time) on one healthy, sun-exposed, mature leaf per plant; the leaves were bagged using a plastic sheet and covered with aluminum foil at least one hour before measurement to prevent direct transpiration.

2.3.2. Plant Growth, Leaf Mass Area and Biomass

Plant leaf number was determined for all plants of each genotype at the beginning and end of each treatment period. Leaf mass per area (LMA) was calculated as the ratio between the dry weight and leaf area of leaf disks extracted from five leaf samples per genotype and treatment, using the same leaves on which the water potential and gas exchange parameters were measured. At the end of the experiment, the total above dry biomass was measured for each plant, and stem, leaves and bunches were weighed separately. The total plant leaf area was estimated by dividing the total leaf biomass by the LMA at the end of the experiment. To estimate the plant leaf area during each treatment period, the individual leaf area at the end of the experiment (plant leaf weight divided by number of leaves and multiplied by LMA) was calculated for each replicate, obtaining an average surface per leaf. We then multiplied this value by the number of leaves at the start and the end of each experimental period.

2.3.3. Pressure–Volume Curves

Pressure–volume (P–V) curves were plotted following the procedures described by Sack and Pasquet-Kok [34]. The leaves for which gas exchange were previously measured were collected for each genotype, weighed and rehydrated in distilled water for 12 h at 4 °C, and then gradually dried in a well-ventilated room at 25 °C. During the drying process, the leaves were weighed and water potential was measured using a pressure chamber (Model 1000; PMS Instrument Company, Albany, NY, USA) until a complete P–V curve with at least ten points was established. No ‘plateau effect’ was observed for any sample. Leaf area was determined at the start of the dehydration process and dry mass was determined after at least 72 h at 70 °C. The full turgor and turgor loss points were established by considering the highest R2 of a linear fit for the linear portion of the −1/Ψ vs. 1–RWC relationship (RWC: Relative water content). The following parameters were obtained from the P–V curves: osmotic potential at turgor loss point (πo), capacitance at turgor loss point (CTLP), leaf area specific capacitance (C* FT, symplasmic water fraction (sf) and bulk modulus of elasticity (ε; calculated from the total relative water content). The modulus of elasticity (ε) and relative capacitance at full turgor (Cft) were calculated using standardized major axes (SMA) [35].

2.3.4. Leaf Gas Exchange Measurements

Instantaneous leaf net photosynthesis (AN) and stomatal conductance (gs) were measured on fully sun-exposed mature leaves (one per plant, n = 5) every 2–3 days between 10:00 and 13:00 h (local time) using an infrared open gas exchange analyzer system (Li-6400xt, Li-cor Inc., Lincoln, NE, USA). The CO2 concentration inside the chamber was 400 μmol CO2 mol−1 air with an air flow of 500 μmol (air) min−1. The chamber has an area of 6 cm2 exposed to environmental light radiation, with the photosynthetic active radiation fraction (PAR) always above 1500 mol photons m−2s−1. Intrinsic water use efficiency (WUEi) was calculated as the ratio of AN and gs.
To determine the AN/Ci curves, the gas analyzer was equipped with a 2 cm2 leaf fluorometer chamber Li-6400-40 (Li-cor Inc.). Determinations were conducted on fully developed apical leaves at the end of the experiment period. The same procedure was followed for each plant: first, a stabilization period until a steady state of stomatal conductance was reached (typically ~20–30 min) under ambient conditions (CO2 concentration of 400 µmol mol−1, PAR of 1500 µmol photons m−2 s−1, 25 °C). After stabilization, the AN/Ci curve was generated by changing the concentration of CO2 entering the leaf chamber in the following steps: 400, 300, 200, 150, 100, 50, 400, 400, 500, 600, 800, 1000, 1200 and 1500 µmol CO2 mol air−1, with typically 2–3 min between each step. Each AN/Ci curve was corrected for leaks by following the protocol described by Flexas et al. [36]. All AN/Ci curve-derived parameters were calculated as described by Bellasio et al. [37]. Leaf respiration (R) was measured below the AN/Ci curves and after covering the plants with opaque plastic for 2 h, using the same chamber and conditions.

2.4. Statistical Analysis

All statistical analyses were performed using [38]. The Tukey test was performed using the HSD function of ‘car’ package [39] to establish the significance of the differences; p-values lower than 0.05 were considered significant.

3. Results

3.1. Plant Water Status

Midday stem water potential (Ψstem) was assessed to ensure that the water treatments were established (Table 1). Average Ψstem across all six clones was −0.64 MPa during the well-watered (WW) period and −1.29 MPa under moderate water stress (MWS; p < 0.001). We also observed the effect of the irrigation on the stomatal conductance (gs), with gs systematically over 0.2 mol under WW and under 0.15 under MWS (Figure 1, Table 1). In MWS, clones RJ51 and 1048 presented the lowest values (0.07–0.08 mol H2O m−2 s−1) and genotype 326, the highest (0.11 mol H2O m−2 s−1).

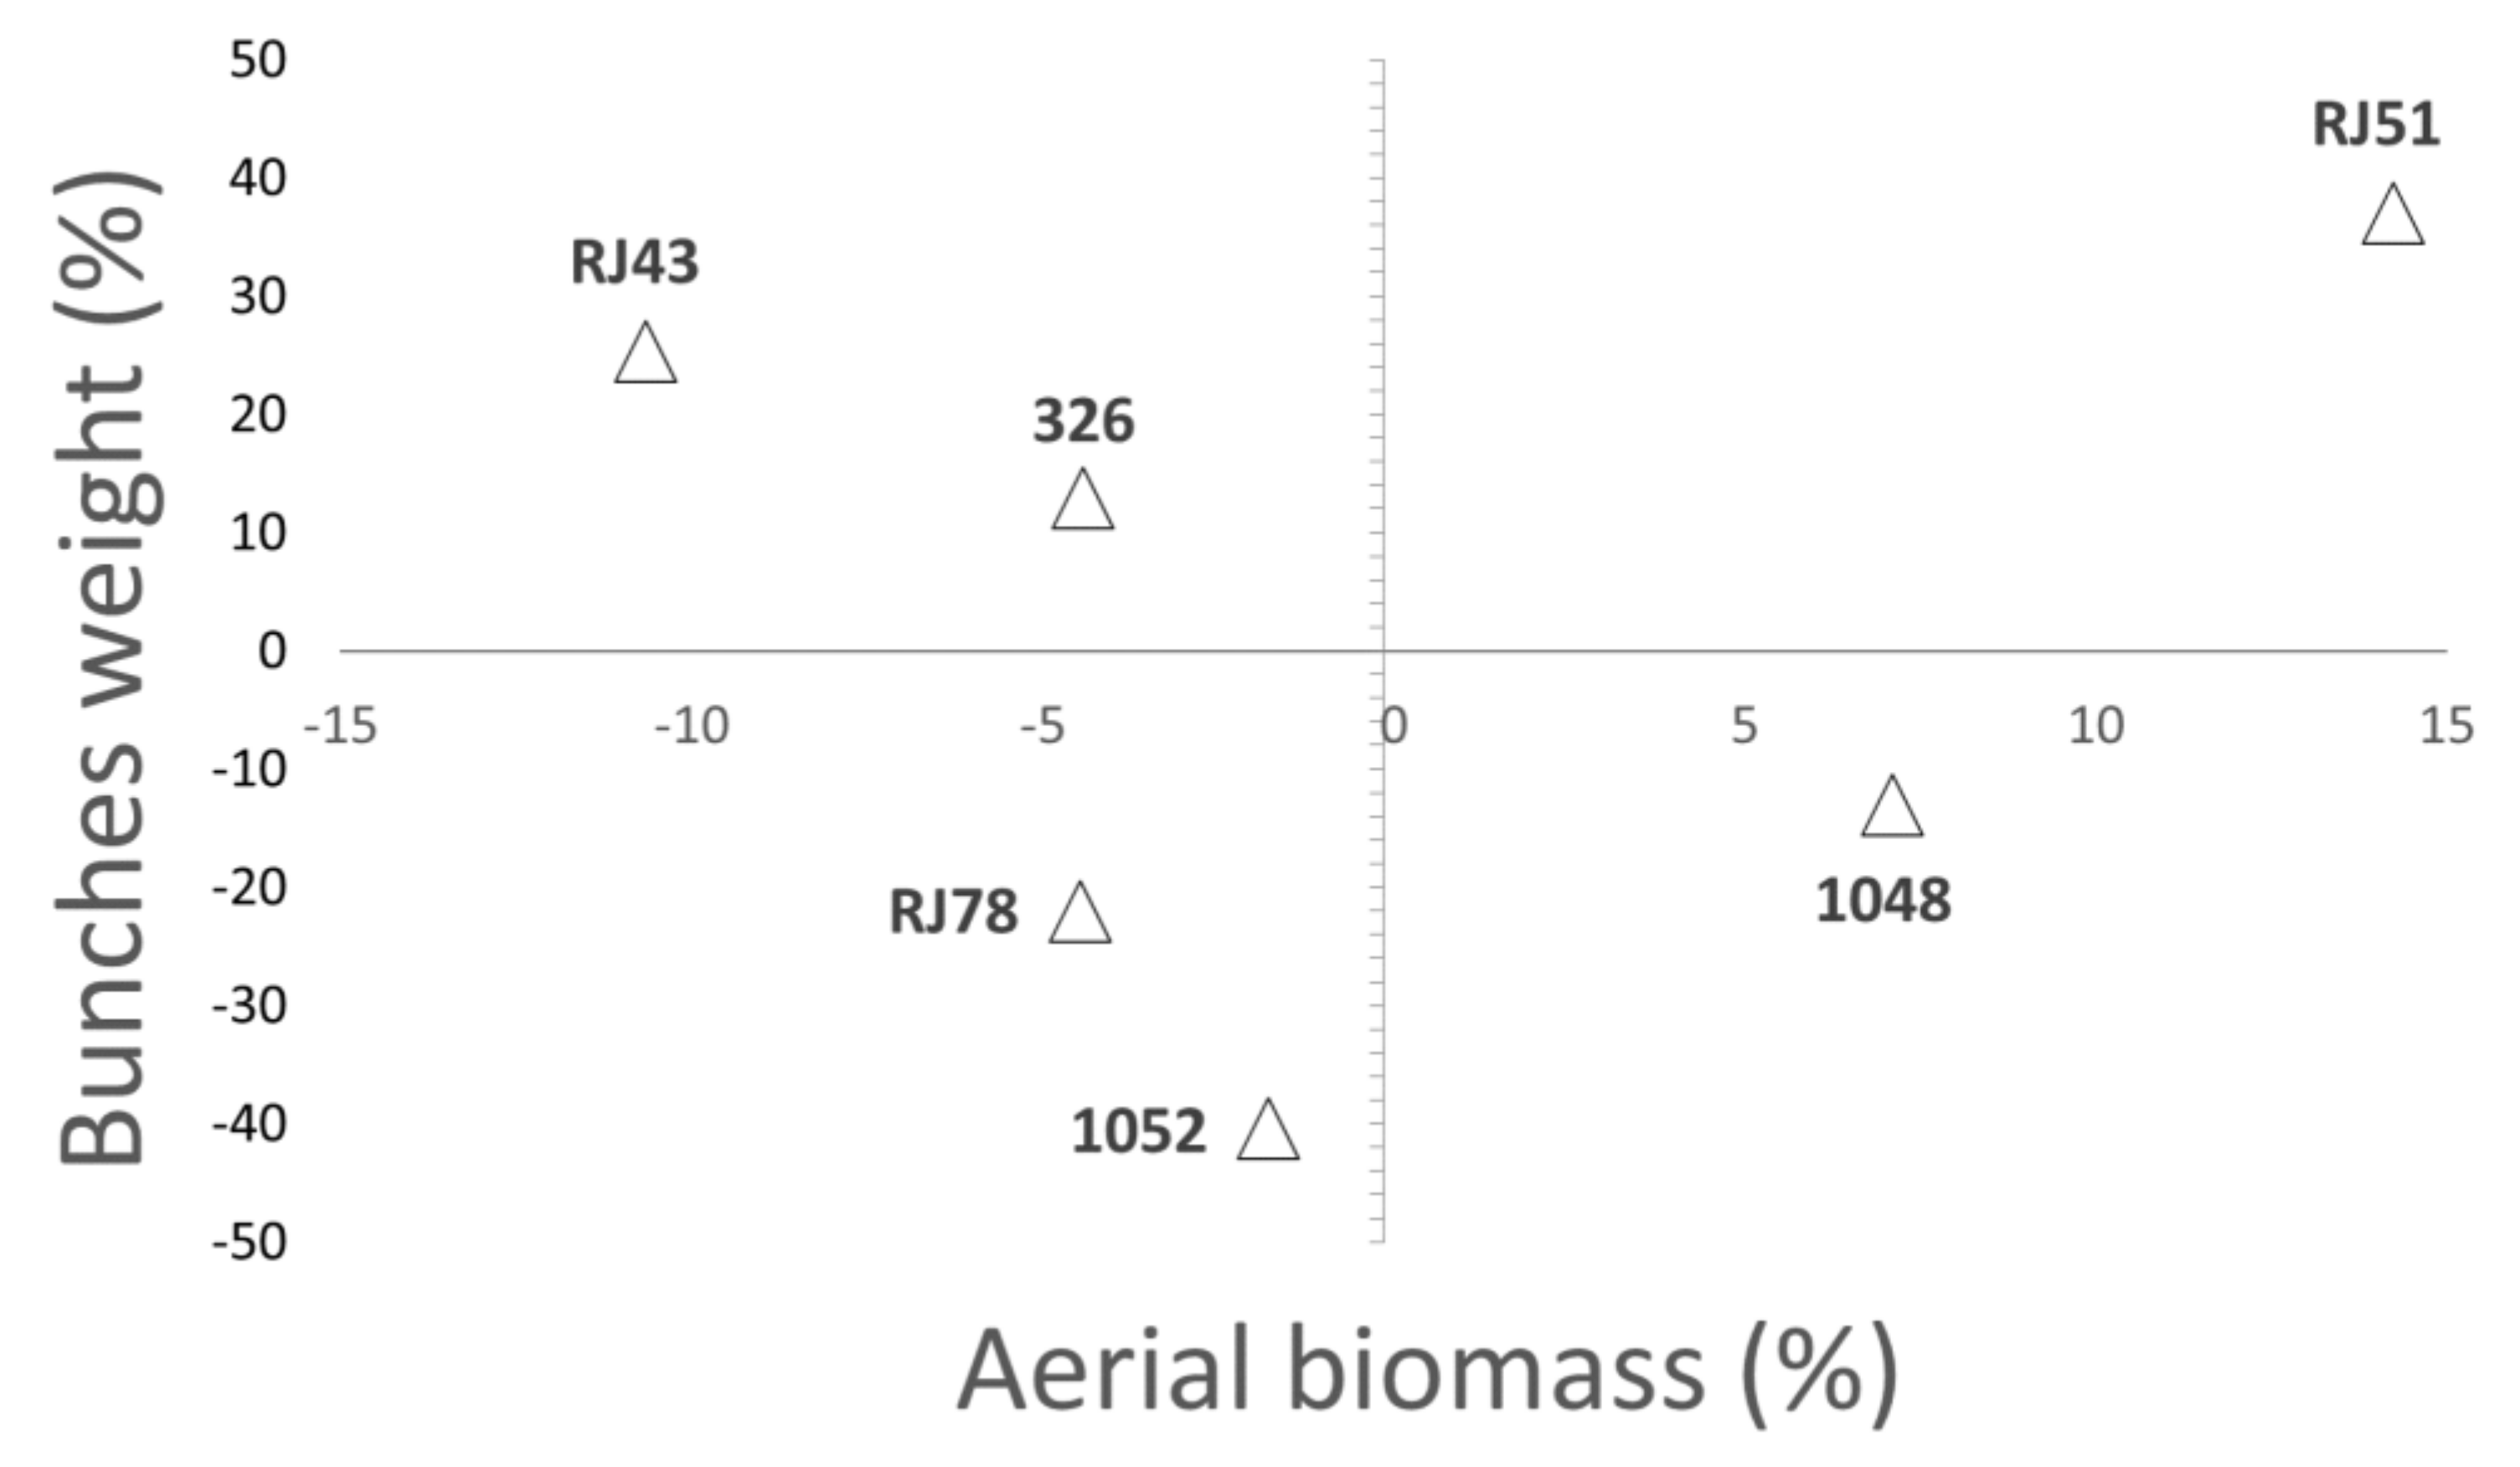
3.2. Plant Growth and Final Biomass

Plant growth parameters were calculated during each consecutive period of WW and MWS irrigation. Leaf expansion rate (LER) was almost twice as high during the WW period than the MWS period (29 cm2 day−1 vs. 15 cm2 day−1, respectively; p > 0.001). During the WW period, genotype 1052 exhibited the highest growth rate (37 cm2 day−1) and genotype 326 exhibited the lowest growth rate (24 cm2 day−1; Table 2). The variation in LER between clones was smaller during MWS; genotype RJ43 had the highest growth rate and genotype 326 had the lowest growth rate (19.5 and 11.5 cm2 day−1, respectively). The average reduction in LER due to the change in water regime from WW to MWS was around 50%, with the smallest reduction observed for genotype RJ43 (28%). Moreover, LMA ranged from 77 to 89 g m−2 under WW conditions. MWS increased the LMA by an average of 30%. Genotype 1052 exhibited the highest LMA during MWS and genotype RJ43, the lowest (104 and 86 g m−2, respectively; Table 2).
Total aerial biomass was measured at the end of the season, considering the stem and leaf weight (aerial biomass), and grape production separately. The average dry weights for all clones were 73 g for the aerial biomass (leaf + stem) and 35 g for the grape bunches. Clones RJ51 and 1048 produced the highest aerial biomass and genotype RJ43, the lowest (+15% and −10% of the average value, respectively; Figure 2). The weight of the grape bunches varied highly between clones, with a difference of 235% between the most and least productive clones. Genotype RJ51 and genotype 1052 exhibited the highest and lowest total biomass production (+30% and −40% of the average value, respectively).

3.3. Hydraulic Traits

Pressure–volume curves were obtained for the rehydrated plants at the end of the experiment. The parameters derived from the P–V curves are shown in Table 3. Osmotic potential at full turgor (πo) ranged from −1.44 MPa in clones 1048 and 1052 to −1.14 MPa in genotype RJ78. Similar variability was observed for the turgor loss point ΨTLP, which ranged from −2.0 MPa for genotype 326 to −1.6 MPa for genotype RJ78. The elasticity modulus (ε) also varied significantly between plants of the same genotype, with the genotype average varying from 15 MPa for clones 326, 1052 and RJ51 to 11 MPa for clones RJ43 and RJ78. Capacitance at full turgor (C*FT) was highest for genotype RJ78 (0.63 mol m−2 MPa−1) and lowest for genotype 326 (0.45 mol m−2 MPa−1). Capacitance at the turgor loss point ranged from 0.08 to 0.12 MPa−1 across the six clones, with clones RJ51 and 1052 exhibiting the highest values. The symplasmic pathway (sf) was estimated to represent about 30–40% of total leaf water for all six clones; clones 326 and RJ78 exhibited the lowest sf values and clones 1048 and 1052, the highest (0.3 and 0.4, respectively).

3.4. Photosynthetic Traits

The net photosynthetic response to variation in ambient CO2 (AN/Ci curves) was measured for all six clones at the end of the season, after rewatering. The parameters derived from the curve-fitting method are presented in Table 4. The maximum photosynthetic rate (Amax) varied slightly between clones, ranging from 42 (1052) to 33.1 µmol CO2 m−2s−1 (RJ43), although these differences were not statistically significant (p > 0.05). However, the maximum carboxylation velocity of Rubisco (Vcmax) varied significantly between clones (p < 0.05) and ranged from 115 μmol CO2 m−2 s−1 (genotype 326) to 72 µmol CO2 m−2 s−1 (genotype RJ51). The maximal electron transport rate (Jmax) exhibited a similar range of variation (p = 0.08). Genotype RJ51 exhibited the highest mesophyll conductance (gm) and clones RJ43, RJ78 and 1048, the lowest (p = 0.01). Leaf respiration (R) also varied significantly between clones (p = 0.03); genotype 1048 had the lowest R value (0.2 µmol CO2 m−2 s−1) and RJ78, the highest (0.6 µmol CO2 m−2 s−1).

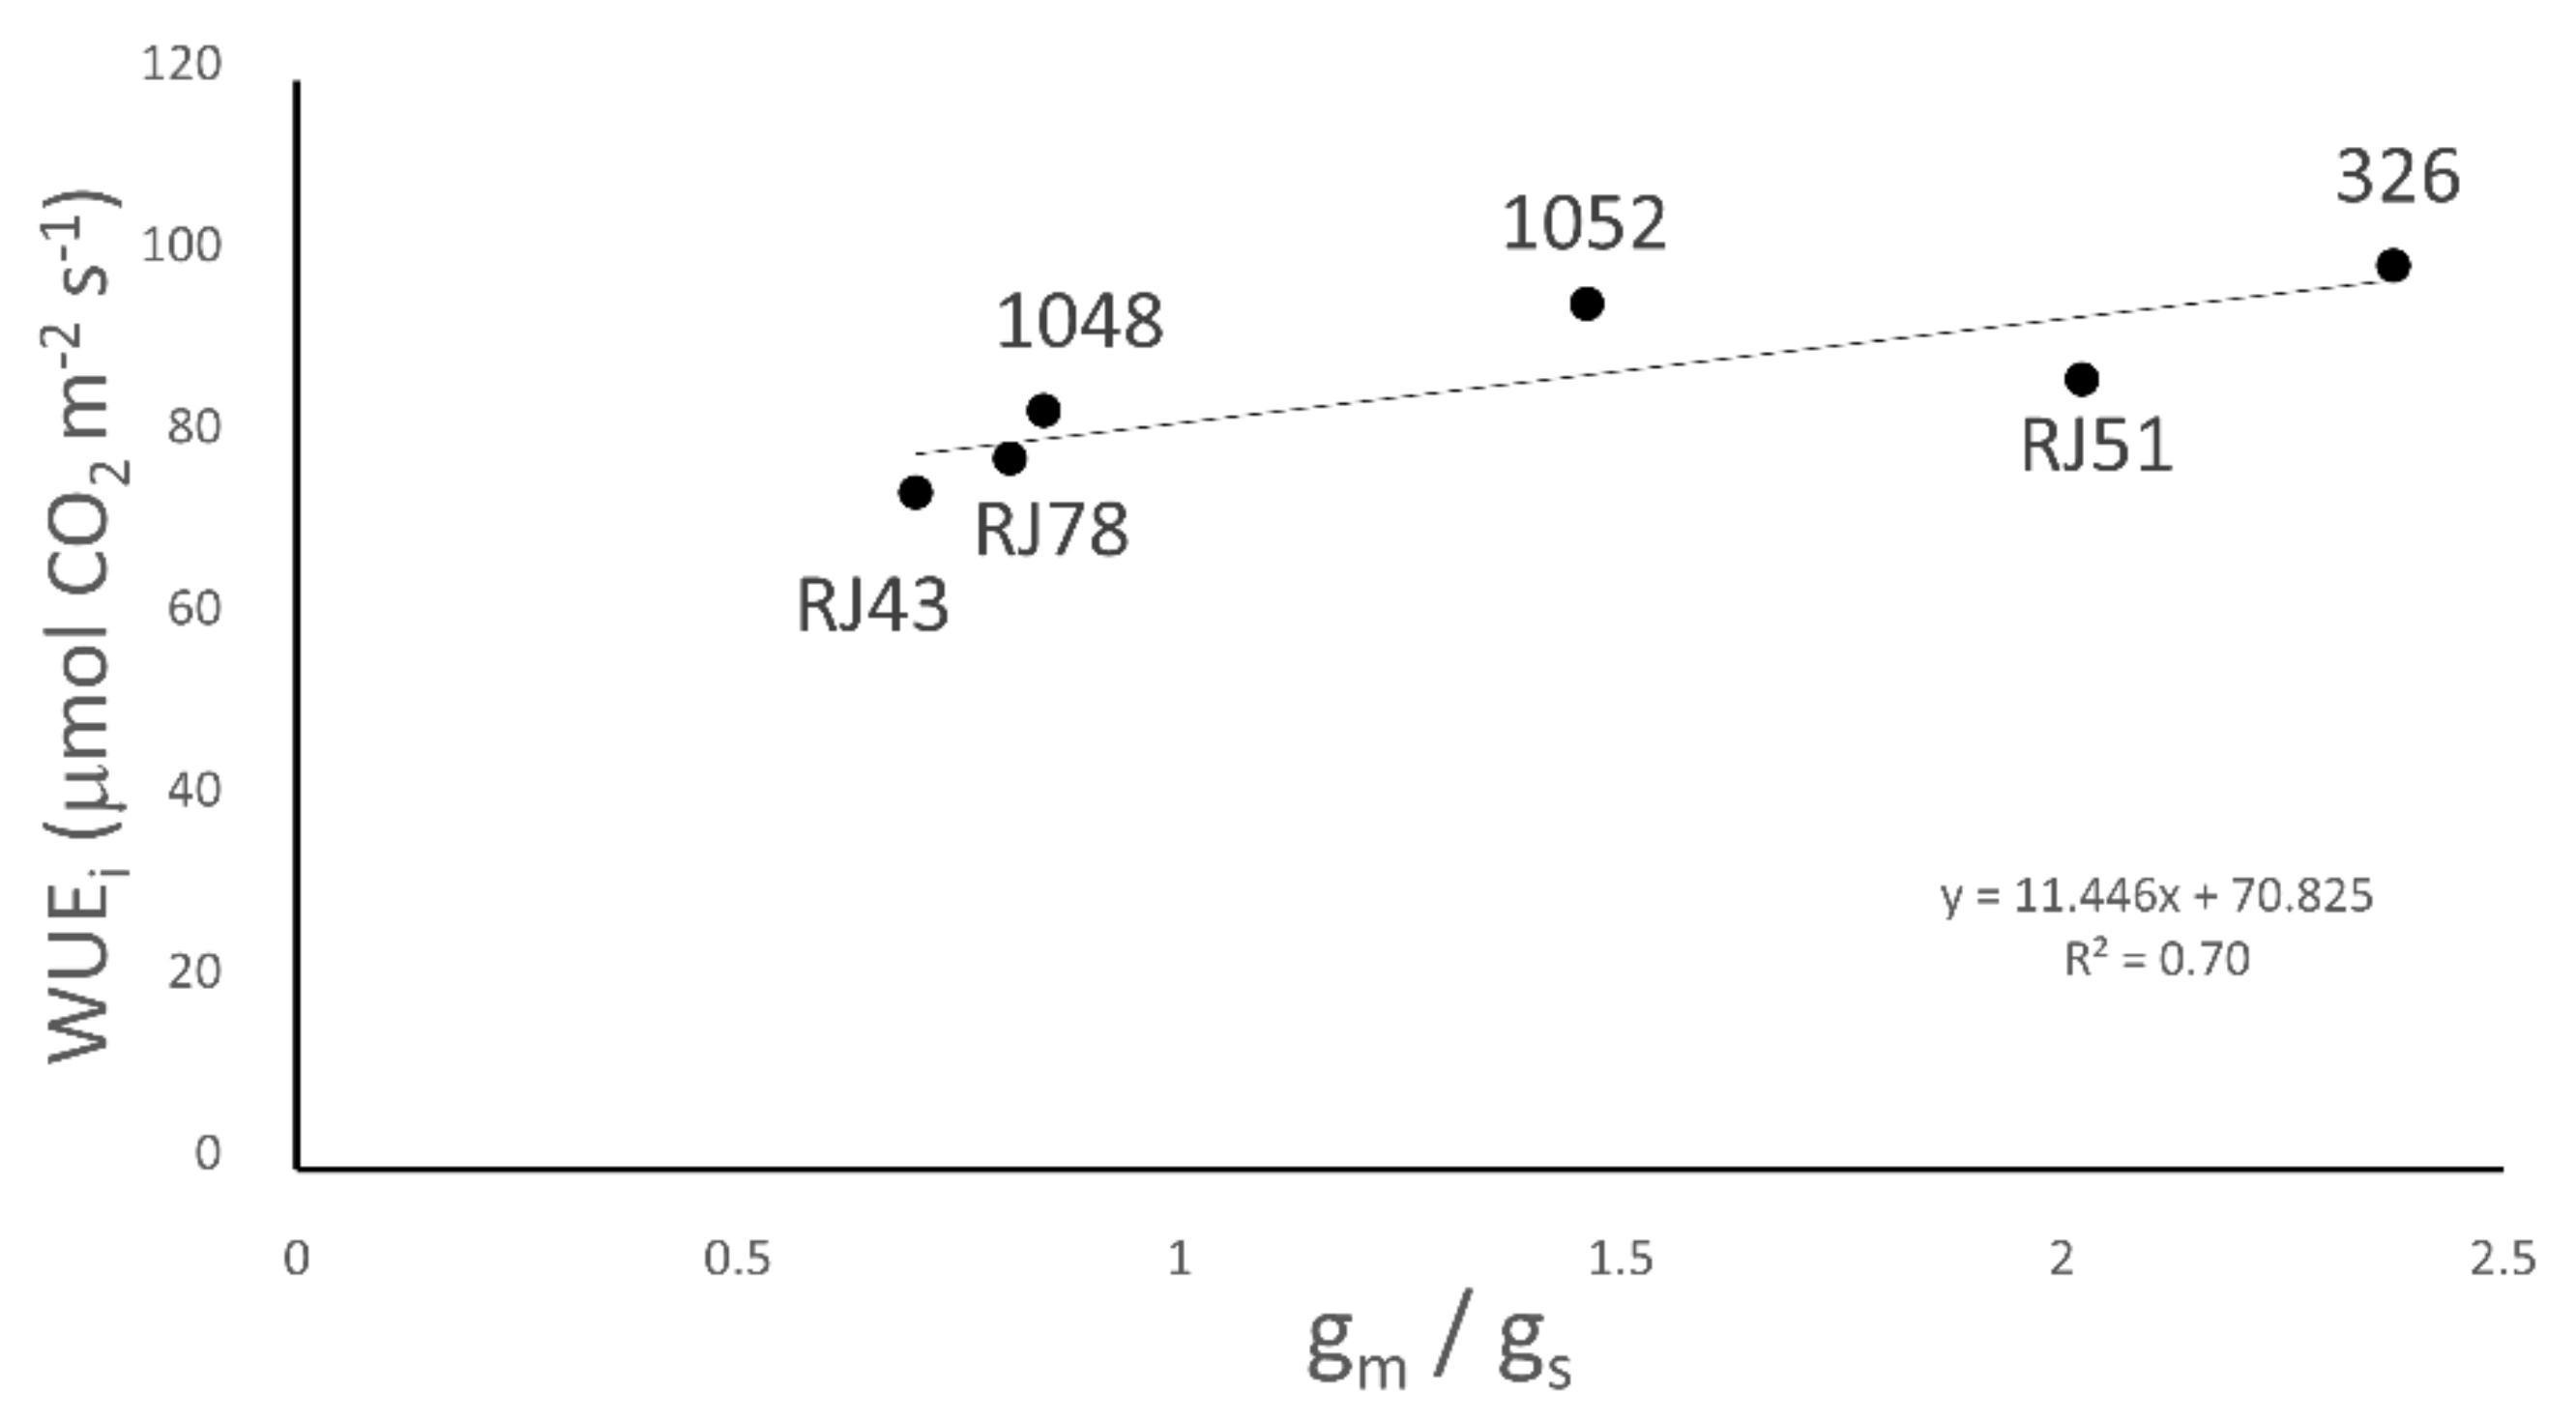
3.5. Water Use Efficiency

Genotypic variability in WUE was assessed at the leaf gas exchange level (WUEi) and whole plant level (WUEWP; Table 5). Average WUEi under WW conditions was around 55 µmol CO2 mol H2O−1 and ranged from 51 µmol CO2 mol H2O−1 for genotypes RJ78 and 326 to 59 µmol CO2 mol H2O−1 for genotype RJ51. Higher variability was observed during the MWS period (p < 0.005), with a maximal value of 100 µmol CO2 mol H2O−1 in genotype 1048 and the lowest value of 80 µmol CO2 mol H2O−1 in clones 326 and 1052. At the whole plant level, the average WUEWP was 0.65 g dry weight L−1. Clones RJ51 and 1052 exhibited the highest and lowest WUEWP (0.79 and 0.55 g dry weight L−1, respectively). WUEWP presented high variability between the six clones; however, high plant-to-plant variability reduced the significance of the differences between clones.

4. Discussion

This study assessed intra-cultivar variability in biomass growth and production, water relations and leaf physiology in six clones of the Tempranillo cultivar under consecutive well-watered and moderate water stress irrigation regimes. In agreement with our previous studies [17,19], the RJ51 and 1048 clones exhibited the highest WUEi, whereas clones 326 and 1052 showed the lowest WUEi during MWS.

4.1. Plant Water Status, Biomass and Growth Traits

The plant biomass and growth values obtained during the WW period were similar to previous experiments [23,40,41]. The significant reduction in water availability imposed during the experiment induced various responses in individual traits across the six clones. As expected, the growth traits were negatively affected by drought. Moreover, LER and ΨSTEM were related indicating the lack of control to water stress in some clones, such as RJ43. However, within each treatment, no significant differences in leaf traits were observed between clones. As reported in previous experiments, the absence of significant differences in growth parameters may be related to the limitations of pot experiments. Pots limit the growth of the roots, which could potentially reduce the differences between clones [42,43]. However, significant differences in biomass production were observed between the clones at the end of the experiment, with RJ51 being the most productive and genotype 1052, the least. In fact, genotype RJ51 had the highest grape and aerial biomass production values. This may be explained by the fact that slight differences in the growth rate may be undetectable over the short-term (day scale); however, accumulation of small differences over the growing season could result in significant differences in plant biomass at the end of the experiment. Moreover, while genotype 1052 had one of the highest LER values under well-watered conditions, it had a moderate LMA and leaf and stem biomass, and the lowest bunch biomass. In contrast, genotype RJ51 showed a moderate LMA and higher bunches and aerial biomass. The LMA is strongly associated with high-irradiance and arid environments, allowing plants to survive by reducing cuticular transpiration [44]. In this experiment, the lowest water availability induced increases in leaf mass area in all clones, as previously reported by Bota et al. [10].

4.2. Hydraulic Traits

Hydraulic traits were similar among all clones, with no significant differences observed. The parameters derived from the P–V curves for each genotype were like previously reported values for grapevines [45,46,47]. For example, the elasticity modulus (ε) ranged between 10.93 MPa and 15.1 MPa in our study. These values are slightly superior to those found in Alsina et al. [48], that were around 10.5 MPa. On the other hand, Martorell et al. [29], also working with Tempranillo cv, found values in the same range as in this study. They observed an important year effect with about 20% variation in two consecutive years. RJ51 exhibited the highest ε (15.11 MPa); this parameter is apparently related to drought tolerance [49,50]. Even though RJ51 had the highest biomass and ε, there is no clear link between these parameters. Moreover, some clones (1052 and 326) with high ε values had low biomass production.

4.3. Genotype Variability in Photosynthetic Traits

AN/Ci response curves provide key information on photosynthetic capability associated with CO2 diffusion pathways and the biochemical function of Rubisco that may help to understand the differences between clones.
Interestingly, a clear positive correlation was observed between the gm/gs ratio and WUEi (R2 = 0.7, p < 0.05; Figure 3), as previously reported for grapevine cultivars [8]. This relationship was obtained using the first points (400 ppm CO2) of the AN/Ci curves. It is important to note that while gs ranged from 0.130 to 0.165 mol H2O m−2 s−1 between clones, gm exhibited huge significant variation (0.100 to 0.300 mol H2O m−2 s−1) so that under similar water availability conditions, the gm variations seem to be a constitutive character for each genotype. The importance of gm in leaf photosynthesis is widely supported, since it represents the capacity for CO2 diffusion inside the leaf [32,51] and thus affects CO2 availability at the site of fixation in the chloroplast. On this basis, gm was previously suggested as a key parameter to improve WUEi, since increasing gm would improve CO2 fixation without greater water loss [52]. Moreover, clones 1048 and RJ51 seem to have the higher stomatal control, allowing water saving and improving their WUEi under water stress.
Genotype RJ51 showed a significantly higher gm and presented one of the highest WUEi responses over the entire range of gs [19]. In contrast, genotype RJ78 presented the lowest gm and one of the lowest WUEi values. These results further indicate, as previously suggested [27,53], the existence of interesting genetic variability in gm among Tempranillo clones, as well as a possible link between WUEi and gm. Nevertheless, measurement of gm is extremely labour-intensive, which limits the value of this parameter as a selection criterion to identify higher WUE clones. The present study is the first report showing a relationship between WUEi and gm in grapevines. Some leaf morphological characteristics may potentially represent surrogate markers of gm. Thus, it would be interesting to explore these characteristics, such as cell wall thickness or chloroplast distribution [54,55] in future selection programs to enhance WUE. However, cell wall composition seems to vary highly over the short term and several key cell wall components were related to changes in gm, such as cellulose and some pectins [56,57]. Other authors reported large differences in gm between clones of the same species (Quercus ilex) [58] and demonstrated gm was the main limiting factor for leaf CO2 fixation.
Vcmax is related to the CO2 fixation velocity via Rubisco and is commonly linked to J, since a higher CO2 fixation velocity implies a greater need to reduce power flux from tylacoids [59,60]. Clones RJ78 and 326 presented the highest Vcmax and J values, but low WUEi under both water treatments. A high Vcmax is typically linked to high gs, which would lead to increased water loss; therefore, WUE could be maintained or even reduced. However, these two clones, especially 326, exhibited the lowest biomass production and growth during the experiment.
Leaf respiration is another important parameter that varied significantly between clones. Respiration rates typically reflect the metabolic cost of developing new plant organs, nutrient uptake and maintenance of the roots and plant [61]. A large part of the CO2 fixed by photosynthesis is invested in those processes, which limits the C available for growth. It can be assumed that a lower respiration cost will improve the plant carbon balance and lead to higher plant biomass production [23,25]. This is the case under unconstrained conditions for other biotic or abiotic stresses, such as salt or nutrient deficiency [62]. Genotype 1048 presented the lowest R and had the most efficient leaf water use and produced higher aerial biomass under MWS. In contrast, genotype RJ78 had the highest R, but poor WUE at both the leaf and whole plant level. Thus, leaf respiration could potentially represent a key parameter for selection programs and offers the advantage of being easier to determine than entire AN/Ci curves.

5. Conclusions

A previous study identified that RJ51 and 1048 clones exhibit more efficient water use than other clones of the Tempranillo cultivar. Thus, we investigated the physiological basis of these differences in WUEi. Both the RJ51 and 1048 clones accumulated more biomass and presented higher WUEi under both the well-watered and moderate stress irrigation regimens, even though the differences were not significant statistically. Hydraulic traits derived from P–V curves were not significantly associated with the differences in WUEi. However, the differences in mesophyll conductance and leaf respiration were statistically significant, indicating that these clones exhibit improved WUEi via different physiological pathways. Genotype RJ51 had the highest gm, which would lead to a higher rate of photosynthesis at similar gs, whereas genotype 1048 had the lowest respiration rate, which would confer lower carbon expenses for similar carbon gains. Future research should examine whether these differences occur under field conditions and investigate if similar genetic variability exists within other grapevine clones. Furthermore, the grape composition is another key trait to evaluate the usefulness of each clone, especially in a long trial study in field conditions.

Author Contributions

I.T., J.M.E. and H.M. conceived and planned the study. I.T., I.O. and C.D. grew plants and helped take measurements. I.T. performed all the statistical analyses and wrote the body of the manuscript under the supervision of J.M.E. and H.M. All authors have read and agreed to the published version of the manuscript.

Funding

This work was performed with financial support from the Spanish Ministry of Science and Technology (FEDER/Ministerio de Ciencia, Innovación y Universidades–Agencia Estatal de Investigación/_AGL2017-83738-C3-1-R AGL2014-54201-C4-1-R) and a pre-doctoral fellowship, BES-2015-073331.

Institutional Review Board Statement

Not applicable.

Informed Consent Statement

Not applicable.

Data Availability Statement

The data presented in this study are available on request from the corresponding author.

Acknowledgments

The authors would like to thank Miquel Truyols and collaborators at the UIB Experimental Field (UIB Grant 15/2015) for their support in our experiments. We also wish to thank the collaboration of the Instituto de las Ciencias de la Vid y el Vino (ICVV) and Viveros Provedo S.A who provided us with the plant material. Finally, we wish to thank Andrea Devlin for her English corrections.

Conflicts of Interest

The authors declare no conflict of interest.

References

  1. Van Leeuwen, C.; Destrac-Irvine, A.; Dubernet, M.; Duchêne, E.; Gowdy, M.; Marguerit, E.; Piere, P.; Parker, A.; de Rességuier, L.; Ollat, N. An update on the impact of climate change in viticulture and potential adaptations. Agronomy 2019, 9, 514. [Google Scholar] [CrossRef]
  2. Medrano, H.; Tomás, M.; Martorell, S.; Escalona, J.M.; Pou, A.; Fuentes, S.; Flexas, J.; Bota, J. Improving water use efficiency of vineyards in semi-arid regions. A review. Agron. Sustain. Dev. 2015, 35, 499–517. [Google Scholar] [CrossRef]
  3. Duchêne, E. How can grapevine genetics contribute to the adaptation to climate change? Oeno One 2016, 50, 113–124. [Google Scholar] [CrossRef]
  4. Delrot, S.; Grimplet, J.; Carbonell-Bejerano, P.; Schwandner, A.; Bert, P.F.; Bavaresco, L.; Dalla, L.; Di Gaspero, G.; Duchêne, E.; Hausman, L.; et al. Genetic and Genomic Approaches for Adaptation of Grapevine to Climate Change. In Genomic Designing of Climate-Smart Fruit Crops; Springer International Publishing: Berlin/Heidelberg, Germany, 2020; pp. 157–270. [Google Scholar]
  5. Galet, P. Dictionnaire Encyclopédique des Cépages (Encyclopaedic Dictionary of Grape Varieties); Hachette: Paris, France, 2000. [Google Scholar]
  6. Carbonell-Bejerano, P.; Royo, C.; Mauri, N.; Ibáñez, J.; Martínez-Zapater, J.M. Somatic Variation and Cultivar Innovaion in Grapevine. In Advances in Grape and Wine Biotechnology, 1st ed.; Morata, A., Loira, I., Eds.; Intechopen: London, UK, 2016; p. 8. [Google Scholar]
  7. Ibáñez, J.; Carreño, J.; Yuste, J.; Martínez-Zapater, J.M. Grapevine breeding and clonal selection programmes in Spain. In AG Reynolds; Grapevine Breeding Programs for the Wine Industry; Woodhead Publishing: Oxford, UK, 2015; pp. 183–209. [Google Scholar]
  8. Martin-Benito, D.; Anchukaitis, K.; Evans, M.; del Río, M.; Beeckman, H.; Cañellas, I. Effects of Drought on Xylem Anatomy and Water-Use Efficiency of Two Co-Occurring Pine Species. Forests 2017, 8, 332. [Google Scholar] [CrossRef]
  9. Gonzalez de Andres, E.; Camarero, J.J.; Blanco, J.A.; Imbert, J.B.; Lo, Y.H.; Sangüesa-Barreda, G.; Castillo, F.J. Tree-to-tree competition in mixed European beech–Scots pine forests has different impacts on growth and water-use efficiency depending on site conditions. J. Ecol. 2018, 106, 59–75. [Google Scholar] [CrossRef]
  10. Bota, J.; Tomas, M.; Flexas, J.; Medrano, H.; Escalona, J.M. Differences among grapevine cultivars in their stomatal behavior and water use efficiency under progressive water stress. Agric. Water Manag. 2016, 164, 91–99. [Google Scholar] [CrossRef]
  11. Pazzagli, P.T.; Weiner, J.; Liu, F. Effects of CO2 elevation and irrigation regimes on leaf gas exchange, plant water relations, and water use efficiency of two tomato cultivars. Agric. Water Manag. 2016, 169, 26–33. [Google Scholar] [CrossRef]
  12. Meena, R.P.; Karnam, V.; Tripathi, S.C.; Jha, A.; Sharma, R.K.; Singh, G.P. Irrigation management strategies in wheat for efficient water use in the regions of depleting water resources. Agric. Water Manag. 2019, 214, 38–46. [Google Scholar] [CrossRef]
  13. Fracasso, A.; Trindade, L.M.; Amaducci, S. Drought stress tolerance strategies revealed by RNA-seq in two sorghum genotypes with contrasting WUE. BMC Plant Biol. 2016, 16, 115. [Google Scholar] [CrossRef]
  14. Clifton-Brown, J.C.; Lewandowski, I. Water use efficiency and biomass partitioning of three different Miscanthus genotypes with limited and unlimited water supply. Ann. Bot. 2000, 86, 191–200. [Google Scholar] [CrossRef]
  15. Hubbard, R.M.; Carneiro, R.L.; Campoe, O.; Alvares, C.A.; Figura, M.A.; Moreira, G.G. Contrasting water use of two Eucalyptus clones across a precipitation and temperature gradient in Brazil. For. Ecol. Manag. 2020, 475, 118407. [Google Scholar] [CrossRef]
  16. Tortosa, I.; Escalona, J.; Bota, J.; Tomas, M.; Hernandez, E.; Escudero, E.; Medrano, H. Exploring the genetic variability in water use efficiency: Evaluation of inter and intra cultivar genetic diversity in grapevines. Plant Sci. 2016, 251, 35–43. [Google Scholar] [CrossRef] [PubMed]
  17. Tortosa, I.; Douthe, C.; Pou, A.; Balda, P.; Hernandez-Montes, E.; Toro, G.; Escalona, J.M.; Medrano, H. Variability in water use efficiency of grapevine Tempranillo clones and stability over years at field conditions. Agronomy 2019, 9, 701. [Google Scholar] [CrossRef]
  18. Tortosa, I.; Escalona, J.M.; Douthe, C.; Pou, A.; Garcia-Escudero, E.; Toro, G.; Medrano, H. The intra-cultivar variability on water use efficiency at different water status as a target selection in grapevine: Influence of ambient and genotype. Agric. Water Manag. 2019, 223, 105648. [Google Scholar] [CrossRef]
  19. Tortosa, I.; Escalona, J.M.; Toro, G.; Douthe, C.; Medrano, H. Clonal behaviour in response to soil water availability in Tempranillo Grapevine cv: From plant growth to water use efficiency. Agronomy 2020, 10, 862. [Google Scholar] [CrossRef]
  20. Medrano, H.; Tomás, M.; Martorell, S.; Flexas, J.; Hernández, E.; Rosselló, J.; Pou, A.; Escalona, J.-M.; Bota, J. From leaf to whole-plant water use efficiency (WUE) in complex canopies: Limitations of leaf WUE as a selection target. Crop. J. 2015, 3, 220–228. [Google Scholar] [CrossRef]
  21. Yi, K.; Maxwell, J.T.; Wenzel, M.K.; Roman, D.T.; Sauer, P.E.; Phillips, R.P.; Novick, K.A. Linking variation in intrinsic water-use efficiency to isohydricity: A comparison at multiple spatiotemporal scales. New Phytol. 2019, 221, 195–208. [Google Scholar] [CrossRef]
  22. Kretzler, B.; Rodrigues, C.; Karady, M.; Carmo-Silva, E.; Dodd, I.C. Maintenance of Photosynthesis as Leaves Age Improves Whole Plant Water Use Efficiency in an Australian Wheat Cultivar. Agronomy 2020, 10, 1102. [Google Scholar] [CrossRef]
  23. Tomás, M.; Medrano, H.; Escalona, J.M.; Martorell, S.; Pou, A.; Ribas-Carbó, M.; Flexas, J. Variability of water use efficiency in grapevines. Environ. Exp. Bot. 2014, 103, 148–157. [Google Scholar] [CrossRef]
  24. Hartmann, H.; Trumbore, S. Understanding the roles of nonstructural carbohydrates in forest trees–from what we can measure to what we want to know. New Phytol. 2016, 211, 386–403.24. [Google Scholar] [CrossRef]
  25. Hernández-Montes, E.; Escalona, J.M.; Tomás, M.; Martorell, S.; Bota, J.; Tortosa, I.; Medrano, H. Carbon balance in grapevines (Vitis vinifera L.): Effect of environment, cultivar and phenology on carbon gain, losses and allocation. Aust. J. Grape Wine Res. 2022. Online Version of Record before inclusion in an issue. [Google Scholar] [CrossRef]
  26. Tomás, M.; Medrano, H.; Pou, A.; Escalona, J.M.; Martorell, S.; Ribas-Carbó, M.; Flexas, J. Water-use efficiency in grapevine cultivars grown under controlled conditions: Effects of water stress at the leaf and whole-plant level. Aust. J. Grape Wine Res. 2012, 18, 164–172. [Google Scholar] [CrossRef]
  27. Tomás, M.; Medrano, H.; Brugnoli, E.; Escalona, J.M.; Martorell, S.; Pou, A.; Ribas-Carbo, M.; Flexas, J. Variability of mesophyll conductance in grapevine cultivars under water stress conditions in relation to leaf anatomy and water use efficiency. Aust. J. Grape Wine Res. 2014, 20, 272–280. [Google Scholar] [CrossRef]
  28. Flexas, J.; Galmés, J.; Gallé, A.; Gulias, J.; Pou, A.; Ribas, M.; Tomàs, M.; Medrano, H. Improving water use efficiency in grapevines: Potential physiological targets for biotechnological improvement. Aust. J. Grape Wine Res. 2010, 16, 106–121. [Google Scholar] [CrossRef]
  29. Martorell, S.; Diaz-Espejo, A.; Tomas, M.; Pou, A.; El Aou-Ouad, H.; Escalona, J.M.; Vadell, J.; Ribas-Carbo, M.; Flexas, J.; Medrano, H. Differences in water-use-efficiency between two Vitis vinifera cultivars (Grenache and Tempranillo) explained by the combined response of stomata to hydraulic and chemical signals during water stress. Agric. Water Manag. 2015, 156, 1–9. [Google Scholar] [CrossRef]
  30. Buckley, T.N. How do stomata respond to water status? New Phytol. 2019, 224, 21–36. [Google Scholar] [CrossRef]
  31. Gambetta, G.A.; Herrera, J.C.; Dayer, S.; Feng, Q.; Hochberg, U.; Castellarin, S.D. The physiology of drought stress in grapevine: Towards an integrative definition of drought tolerance. J. Exp. Bot. 2020, 71, 4658–4676. [Google Scholar] [CrossRef] [PubMed]
  32. Flexas, J.; Díaz-Espejo, A.; Conesa, M.A.; Coopman, R.E.; Douthe, C.; Gago, J.; Gallé, A.; Galmés, J.; Medrano, H.; Ribas-Carbo, M.; et al. Mesophyll conductance to CO2 and Rubisco as targets for improving intrinsic water use efficiency in C3 plants. Plant Cell Environ. 2016, 39, 965–982. [Google Scholar] [CrossRef]
  33. Nadal, M.; Flexas, J. Mesophyll conductance to CO2 diffusion: Effects of drought and opportunities for improvement. In Water Scarcity and Sustainable Agriculture in Semiarid Environment; García-Tejero, I.F., Durán-Zuazo, V.H., Eds.; Elsevier: Amsterdam, The Netherlands, 2018; pp. 404–438. [Google Scholar]
  34. Sack, L.; Pasquet-Kok, J. “Leaf Pressure-Volume Curve Parameters.” Prometheus Wiki Website. Available online: http://prometheuswiki.publish.csiro.au/tikiindex.php (accessed on 20 August 2019).
  35. Sack, L.; Cowanm, P.D.; Jaikumar, N.; Holbrook, N.M. The ‘hydrology’ of leaves: Co-ordination of structure and function in temperate woody species. Plant Cell Environ. 2003, 26, 1343–1356. [Google Scholar] [CrossRef]
  36. Flexas, J.; Díaz-Espejo, A.; Berry, J.A.; Cifre, J.; Galmés, J.; Kaldenhoff, R.; Medrano, H.; Ribas-Carbó, M. Analysis of leakage in IRGA’s leaf chambers of open gas exchange systems: Quantification and its effects in photosynthesis parameterization. J. Exp. Bot. 2007, 58, 1533–1543. [Google Scholar] [CrossRef]
  37. Bellasio, C.; Beerling, D.J.; Griffiths, H. Deriving C4 photosynthetic parameters from combined gas exchange and chlorophyll fluorescence using an Excel tool: Theory and practice. Plant Cell Environ. 2016, 39, 1164–1179. [Google Scholar] [CrossRef] [PubMed]
  38. R Core Team. R: A Language and Environment for Statistical Computing; R Foundation for Statistical Computing: Vienna, Austria, 2013; Available online: http://www.R-project.org/ (accessed on 20 August 2019)ISBN 3-900051-07-0.
  39. Fox, J.; Weisberg, S. Multivariate linear models. In R. An R Companion to Applied Regression; Sage Publications: Los Angeles, CA, USA,; Thousand Oaks, CA, USA, 2011. [Google Scholar]
  40. El Aou-ouad, H.; Pou, A.; Tomas, M.; Montero, R.; Ribas-Carbo, M.; Medrano, H.; Bota, J. Combined effect of virus infection and water stress on water flow and water economy in grapevines. Physiol. Plant. 2017, 160, 171–184. [Google Scholar] [CrossRef] [PubMed]
  41. Buesa, I.; Mirás-Avalos, J.M.; Intrigliolo, D.S. Row orientation effects on potted-vines performance and water-use efficiency. Agric. For. Meteorol. 2020, 294, 108–148. [Google Scholar] [CrossRef]
  42. Poorter, H.; Bühler, J.; van Dusschoten, D.; Climent, J.; Postma, J.A. Pot size matters: A meta-analysis of rooting volume on plant growth. Funct. Plant Biol. 2012, 39, 839–850. [Google Scholar] [CrossRef] [PubMed]
  43. McNickle, G.G. Interpreting plant root responses to nutrients, neighbours and pot volume depends on researchers’ assumptions. Funct. Ecol. 2020, 34, 2199–2209. [Google Scholar] [CrossRef]
  44. Poorter, H.; Niinemets, U.; Poorter, L.; Wright, I.J.; Villar, R. Causes and consequences of variation in leaf mass per area (LMA): A meta-analysis. New Phytol. 2009, 182, 565–588. [Google Scholar] [CrossRef]
  45. Hochberg, U.; Rockwell, F.E.; Holbrook, N.M.; Cochard, H. Iso/anisohydry: A plant–environment interaction rather than a simple hydraulic trait. Trends Plant Sci. 2018, 23, 112–120. [Google Scholar] [CrossRef]
  46. Villalobos-González, L.; Muñoz-Araya, M.; Franck, N.; Pastenes, C. Controversies in the midday water potential regulation and stomatal behauvior might result by the environment, genotype and/or roostock: Evidence from Carménère and Syrah grapevine varieties. Front. Plant Sci. 2019, 10, 1522. [Google Scholar] [CrossRef]
  47. Dayer, S.; Herrera, J.C.; Zhanwu, D.; Burlett, R.; Lamarque, L.J.; Delzon, S.; Bortolami, G.; Cochard, H.; Gambetta, G. The sequence and thresholds of leaf hydraulic traits underlying grapevine varietal differences in drought tolerance. J. Exp. Bot. 2020, 71, 4333–4344. [Google Scholar] [CrossRef]
  48. Alsina, M.M.; Herralde, F.D.; Aranda, X.; Savé, R.; Biel, C. Water relations and vulnerability to embolism are not related: Experiments with eight grapevine cultivars. Vitis 2007, 46, 1–6. [Google Scholar]
  49. Niinemets, Ü. Global-scale climatic controls of leaf dry mass per area, density, and thickness in trees and shrubs. Ecology 2001, 82, 453–469. [Google Scholar] [CrossRef]
  50. Bartlett, M.K.; Scoffoni, C.; Sack, L. The Determinants of Leaf Turgor Loss Point and Prediction of Drought Tolerance of Species and Biomes: A Global Meta-Analysis: Drivers of Plant Drought Tolerance. Ecol. Lett. 2012, 15, 393–405. [Google Scholar] [CrossRef] [PubMed]
  51. Gago, J.; Daloso, D.M.; Carriquí, M.; Nadal, M.; Morales, M.; Araújo, W.L.; Flexas, J. The photosynthesis game is in the” inter-play”: Mechanisms underlying CO2 diffusion in leaves. Environ. Exp. Bot 2020, 178, 104174. [Google Scholar] [CrossRef]
  52. Flexas, J.; Miquel, R.C.; Antonio, D.E.; Jeroni, G.; Hipolito, M. Mesophyll conductance to CO2: Current knowledge and future prospects. Plant Cell Environ. 2008, 31, 602–621. [Google Scholar] [CrossRef] [PubMed]
  53. Flexas, J.; Barón, M.; Bota, J.; Ducruet, J.M.; Gallé, A.; Galmés, J.; Jiménez, M.; Pou, A.; Ribas-Carbó, M.; Sajnani, C.; et al. Photosynthesis limitations during water stress acclimation and recovery in the drought–adapted Vitis hybrid Richter–110 (V. berlandierixV. rupestris). J. Exp. Bot. 2009, 60, 2361–2377. [Google Scholar] [CrossRef]
  54. Evans, J.R.; Kaldenhoff, R.; Genty, B.; Terashima, I. Resistances along the CO2 diffusion pathway inside leaves. J. Exp. Bot. 2009, 60, 2235–2248. [Google Scholar] [CrossRef]
  55. Han, J.; Lei, Z.; Flexas, J.; Zhang, Y.; Carriqui, M.; Zhang, W.; Zhang, Y. Mesophyll conductance in cotton bracts: Anatomically determined internal CO2 diffusion constraints on photosynthesis. J. Exp. Bot. 2018, 69, 5433–5443. [Google Scholar] [CrossRef]
  56. Clemente-Moreno, M.J.; Gago, J.; Daz-Vivancos, P.; Bernal, A.; Miedes, E.; Bresta, P.; Liakopoulos, G.; Fernie, A.R.; Hernández, J.A.; Flexas, J. The apoplastic antioxidant system and altered cell wall dynamics influence mesophyll conductance and the rate of photosynthesis. Plant J. 2019, 99, 1031–1046. [Google Scholar] [CrossRef]
  57. Roig-Oliver, M.; Nadal, M.; Clemente-Moreno, M.J.; Bota, J.; Flexas, J. Cell wall components regulate photosynthesis and leaf water relations of Vitis vinifera cv. Grenache acclimated to contrasting environmental conditions. J. Plant Physiol. 2020, 244, 153084. [Google Scholar] [CrossRef]
  58. Peguero-Pina, J.J.; Sisó, S.; Flexas, J.; Galmés, J.; Niinemets, Ü.; Sancho-Knapik, D.; Gil-Pelegrín, E. Coordinated modifications in mesophyll conductance, photosynthetic potentials and leaf nitrogen contribute to explain the large variation in foliage net assimilation rates across Quercus ilex provenances. Tree Physiol. 2017, 37, 1084–1094. [Google Scholar] [CrossRef]
  59. Mediavilla, S.; Santiago, H.; Escudero, A. Stomatal and mesophyll limitations to photosynthesis in one evergreen and one deciduous Mediterranean oak species. Photosynthetica 2002, 40, 553–559. [Google Scholar] [CrossRef]
  60. Walker, A.P.; Beckerman, A.P.; Gu, L.; Kattge, J.; Cernusak, L.A.; Domingues, T.F.; Scales, J.C.; Wohlfahrt, G.; Wullschleger, S.D.; Woodward, F.I. The Relationship of Leaf Photosynthetic Traits—Vcmax and Jmax—to Leaf Nitrogen, Leaf Phosphorus, and Specific Leaf Area: A Meta-Analysis and Modeling Study. Ecol. Evol. 2014, 4, 3218–3235. [Google Scholar] [CrossRef] [PubMed]
  61. Cannell, M.G.R.; Thornley, J.H.M. Modeling the components of plant respiration: Some guiding principles. Ann. Bot. 2000, 85, 45–54. [Google Scholar] [CrossRef]
  62. Del-Saz, N.F.; Romero-Munar, A.; Alonso, D.; Aroca, R.; Baraza, E.; Flexas, J.; Ribas-Carbo, M. Respiratory ATP cost and benefit of arbuscular mycorrhizal symbiosis with Nicotiana tabacum at different growth stages and under salinity. J. Plant Physiol. 2017, 218, 243–248. [Google Scholar] [CrossRef] [PubMed]
Figure 1. Variation of average stomatal conductance (gs) along the measurement periods. The treatments are indicated by uppercase; WW: Wellwatered period, MWS: Moderate water stress period, RW: Rewatering period. The measurements were taken on the indicated day. Numbers indicate the measurements done at each moment, 1. Stem water potential and gas exchange measurements, 2. A/ Ci and P-V curves.
Agronomy 12 01874 g001
Figure 2. Representation of bunches and aerial biomass (leaves and stem) of the different clones, expressed as deviation in respect to their average. Aerial biomass (x-axes) and bunches weight (y-axes). Positive/negative values indicate the particular genotype position.
Agronomy 12 01874 g002
Figure 3. Relationship between the intrinsic WUE (WUEi) and the mesophyll and stomatal conductance ratio (gm/gs).
Agronomy 12 01874 g003
Table 1. Stomatal conductance (gs) and midday stem water potential (Ψstem) at two irrigation treatments. Lower case letters indicate differences between means (Tukeys tests, p < 0.05).
gs (mol H2O m−2 s−1)Ψstem (MPa)
GenotypeWWMWSWWMWS
3260.292 ± 0.0400.111 ± 0.013 a−0.60 ± 0.21−1.39 ± 0.15
10480.258 ± 0.0170.071 ± 0.005 b−0.74 ± 0.06−1.37 ± 0.24
10520.241 ± 0.0340.116 ± 0.013 ab−0.59 ± 0.19−1.15 ± 0.20
RJ430.232 ± 0.0240.092 ± 0.009 ab−0.62 ± 0.23−1.12 ± 0.24
RJ510.262 ± 0.0290.081 ± 0.009 b−0.72 ± 0.15−1.36 ± 0.18
RJ780.307 ± 0.0430.101 ± 0.011 ab−0.61 ± 0.19−1.39 ± 0.15
p-value0.500.050.640.12
Table 2. Leaf expansion rate (LER) and leaf mass area (LMA) in each irrigation treatment.
Leaf Expansion Rate (LER)Leaf Mass Area (LMA)
GenotypeWW
(cm2 day−1)
MWS
(cm2 day−1)
Reduction
%
WW
(g m−2)
MWS
(g m−2)
Increment (%)
32624.0 ± 6.111.2 ± 3.653 ± 2088.9 ± 3.6100.1 ± 2.213 ± 4
104830.0 ± 6.217.3 ± 5.242 ± 1180.2 ± 3.492.6 ± 5.916 ± 8
105236.6 ± 8.015.1 ± 1.859 ± 2081.5 ± 4.0104.2 ± 8.634 ± 14
RJ4327.1 ± 2.819.5 ± 3.728 ± 776.8 ± 2.285.6 ± 3.215 ± 5
RJ5131.7 ± 5.412.5 ± 3.260 ± 1583.1 ± 5.790.6 ± 5.811 ± 9
RJ7826.2 ± 3.813.7 ± 2.448 ± 1083.8 ± 5.292.1 ± 6.110 ± 5
p-value0.660.60.420.350.460.28
Table 3. Average turgor weight divided by dry weight (TW/DW), osmotic potential at full turgor and at turgor loss point (πof and πTLP), elasticity modulus (ε) and symplastic pathway (sf) values for each genotype.
GenotypeTW/DWΠo
(MPa)
ΨTLP
(MPa)
ε
(MPa)
sf
3262.78 ± 0.18−1.39 ± 0.13−2.04 ± 0.1914.87 ± 1.220.31 ± 0.02
10482.89 ± 0.10−1.44 ± 0.09−1.99 ± 0.1113.57 ± 2.410.41 ± 0.04
10522.85 ± 0.02−1.44 ± 0.18−1.94 ± 0.1615.04 ± 4.480.41 ± 0.03
RJ432.86 ± 0.05−1.19 ± 0.14−1.76 ± 0.1110.93 ± 1.100.34 ± 0.05
RJ512.71 ± 0.12−1.30 ± 0.16−1.76 ± 0.1215.11 ± 3.020.37 ± 0.05
RJ782.99 ± 0.09−1.14 ± 0.03−1.64 ± 0.0111.91 ± 1.520.30 ± 0.02
p-value0.510.450.200.700.22
Table 4. Average photosynthetic traits derived from AN/Ci curves for each genotype; maximal photosynthesis (Amax), maximal carboxylation velocity (Vcmax), maximal electron transport rate (J), mesophyll conductance (gm) and leaf respiration (R). Lower case letters indicate differences between means (Tukeys tests, p<0.05).
GenotypeAmaxVcmaxJmaxgmR
(µmol CO2 m−2 s−1)(µmol CO2 m−2 s−1)(µmol CO2 m−2 s−1)(mol H2O m−2 s−1)(µmol CO2 m−2 s−1)
32634.2 ± 3.0114.5 ± 5.9 a120.0 ± 10.40.180 ± 0.064 ab1.00 ± 0.08 bc
104838.2 ± 4.276.7 ± 7.8 b92.0 ± 11.10.127 ± 0.013 b0.56 ± 0.04 c
105241.7 ± 2.280.1 ± 10.0 ab90.9 ± 13.20.187 ± 0.051 ab1.00 ± 0.07 bc
RJ4333.1 ± 3.879.6 ± 5.8 b108.4 ± 8.90.095 ± 0.016 b1.10 ± 0.05 ab
RJ5134.5 ± 4.672.4 ± 1.6 b85.7 ± 1.30.332 ± 0.082 a0.92 ± 0.06 bc
RJ7835.5 ± 4.2101.2 ± 10.7 ab111.1 ± 6.60.104 ± 0.011 b1.36 ± 0.07 a
p-value0.570.0460.0880.0130.031
Table 5. Leaf (WUEi) and whole plant water use efficiency of each genotype. Lower case letters indicate differences between means (Tukeys tests, p<0.05).
WUEi
(µmol CO2 mol H2O−1)
Whole Plant
(g Dry Weight L−1)
GenotypeWWMWS
32651.4 ± 5.480.2 ± 4.1 bc0.65 ± 0.10
104855.0 ± 2.398.4 ± 3.1 a0.65 ± 0.07
105252.4 ± 5.280.5 ± 4.7c0.55 ± 0.06
RJ4359.1 ± 3.681.7 ± 3.8 bc0.65 ± 0.08
RJ5154.7 ± 3.894.9 ± 3.4 ab0.79 ± 0.09
RJ7850.6 ± 6.584.3 ± 4.9 bc0.57 ± 0.10
p-value0.560.0030.44
Range8 (15%)20 (23%)0.24 (37%)
Publisher’s Note: MDPI stays neutral with regard to jurisdictional claims in published maps and institutional affiliations.

