Article

The Molecular Composition of Humic Acids in Permafrost Peats in the European Arctic as Paleorecord of the Environmental Conditions of the Holocene

1
Institute of Biology, Komi Science Center, Ural Branch, Russian Academy of Sciences, 167982 Syktyvkar, Russia
2
Department of Applied Ecology, Faculty of Biology, Saint Petersburg State University, 199178 St. Petersburg, Russia
*
Authors to whom correspondence should be addressed.
Submission received: 24 May 2022 / Revised: 4 August 2022 / Accepted: 25 August 2022 / Published: 28 August 2022

Abstract

:
The purpose of our research is focused on examination of the transformation regularities of molecular composition of humic acids (HAs) in the hummocky frozen peatlands of the European Arctic as a marker of climatic changes in the Holocene, and assessment of the stabilization of soil organic matter under the conditions of modern climatic warming. Histosols located in the two subzones of the European Arctic served as the research subjects. This territory is actively used for reindeer breeding, which is a vital agricultural branch in the Far North of the Russian Federation. The data obtained reveal the main trends in the formation of HAs from Arctic peatlands under different environmental conditions. Modern peat sediments (top layers) in the middle and late Holocene period formed out of bryophyte residues and contained HAs with long-chain carbohydrate and paraffin structures in their composition. These structures enlarged the dynamic radii of HA molecules, and, thus, caused high average molecular weight values. The more favorable climatic conditions of the early Holocene (the Atlantic optimum) defined the botanical composition of peat, which was dominated by tree and sedge communities with high contents of lignin components and, as a consequence, a larger share of aromatic fragments, characterized by thermo-biodynamic resistance in HAs of horizons in the lower and central profile parts. The molecules of HAs are an archive of paleoclimatic records. The Subboreal and Subatlantic climatic conditions determined the specifics of vegetation precursors and, as a result, the molecular structure of HAs in seasonally thawed layers, with a predominance of long-chain aliphatic fragments. The conversion of HAs from Histosols led to an increase in the proportion of carbon in branched and short-chain paraffinic structures with their subsequent cyclization and aromatization. The results of this process are most clearly manifested in layers formed during the Holocene I and II climatic optima. Higher biologically active temperatures of the seasonally thawed layer of soils at bare spots (without vegetation) determined the accumulation of thermodynamically more stable HA molecules with a high content of aromatic fragments. This contributed to both the stabilization of the SOM and the conservation of peatlands in general.

1. Introduction

Northern polar wetland and tundra areas have significant amounts of carbon stored in their soil organic matter (SOM) [1]. A large-scale permafrost degradation in the cryolithozone resulted in the entrainment of thawed organic materials into the carbon cycle [2]. This was further promoted by accompanying geomorphological processes, such as thermokarst and erosion, resulting in the exposure of deep levels of organic sequences [3]. The areas under study are relevant for evaluation of SOM stability in European Arctic cryogenic soils, because soil warming and permafrost thaw can lead to elevated rates of carbon respiration from high latitude peat soils [4].
Stability and biodegradability parameters are the key characteristics of SOM which should be taken into account for precise assessment of modern and future carbon stock and organic matter quality dynamics. The stabilization rate is related to the humification degree, as more advanced stages in the humification process imply a depletion of the labile molecules, as well as an increase in the aromaticity, which provides for higher stability of SOM [5]. Humic acids (HAs) are considered to be integral components of soil organic matter, and perform a multitude of crucial functions in the environment [6,7]. The HAs of peat are of key importance in the context of the ongoing process of climate change [8,9,10]. The complexity of molecular assembly inherent in HAs is reflected through their physical and chemical properties and creates opportunities for a broad range of interactions with inorganic and organic components, and living organisms [11,12,13,14]. The wide variability of HA molecular composition, associated with their evolution under various environmental conditions, determines the instrumental challenges in their identification and the analytical detection of their molecular assembly macrostructures. Over the last years, the scientific community has been actively discussing the basic concepts of the molecular organization of HAs. The content of functional groups and molecular fragments depends on the botanical composition of the peat and the degree of alteration that occurs to the organic residue during decomposition. The ratio of aromatic to aliphatic components is related to the type of peat material and content of oxygen-containing carboxylic and phenolic groups [10,15,16].
These days, studies using up-to-date physical and chemical methods for HA structure and polydispersity analysis in mineral soils have been published [17,18,19,20]. However, studies of HAs in European Arctic peat bogs are rare and lack systematicity. It is important to note that peat deposits are specific natural soil-like organic or organo-mineral formations where the character of humic compounds is studied the least. Revealing the regularities of their chemical and biochemical transformations can be obtained by comparing the molecular structure of peat layers [21,22].
Consequently, the aim of our research is focused on examination of transformation regularities of molecular composition of humic acids in the hummocky frozen peatlands of the European Arctic as a marker of climatic changes in the Holocene, and assessment of the stabilization of SOM under the conditions of modern climatic warming.

2. Field Sampling

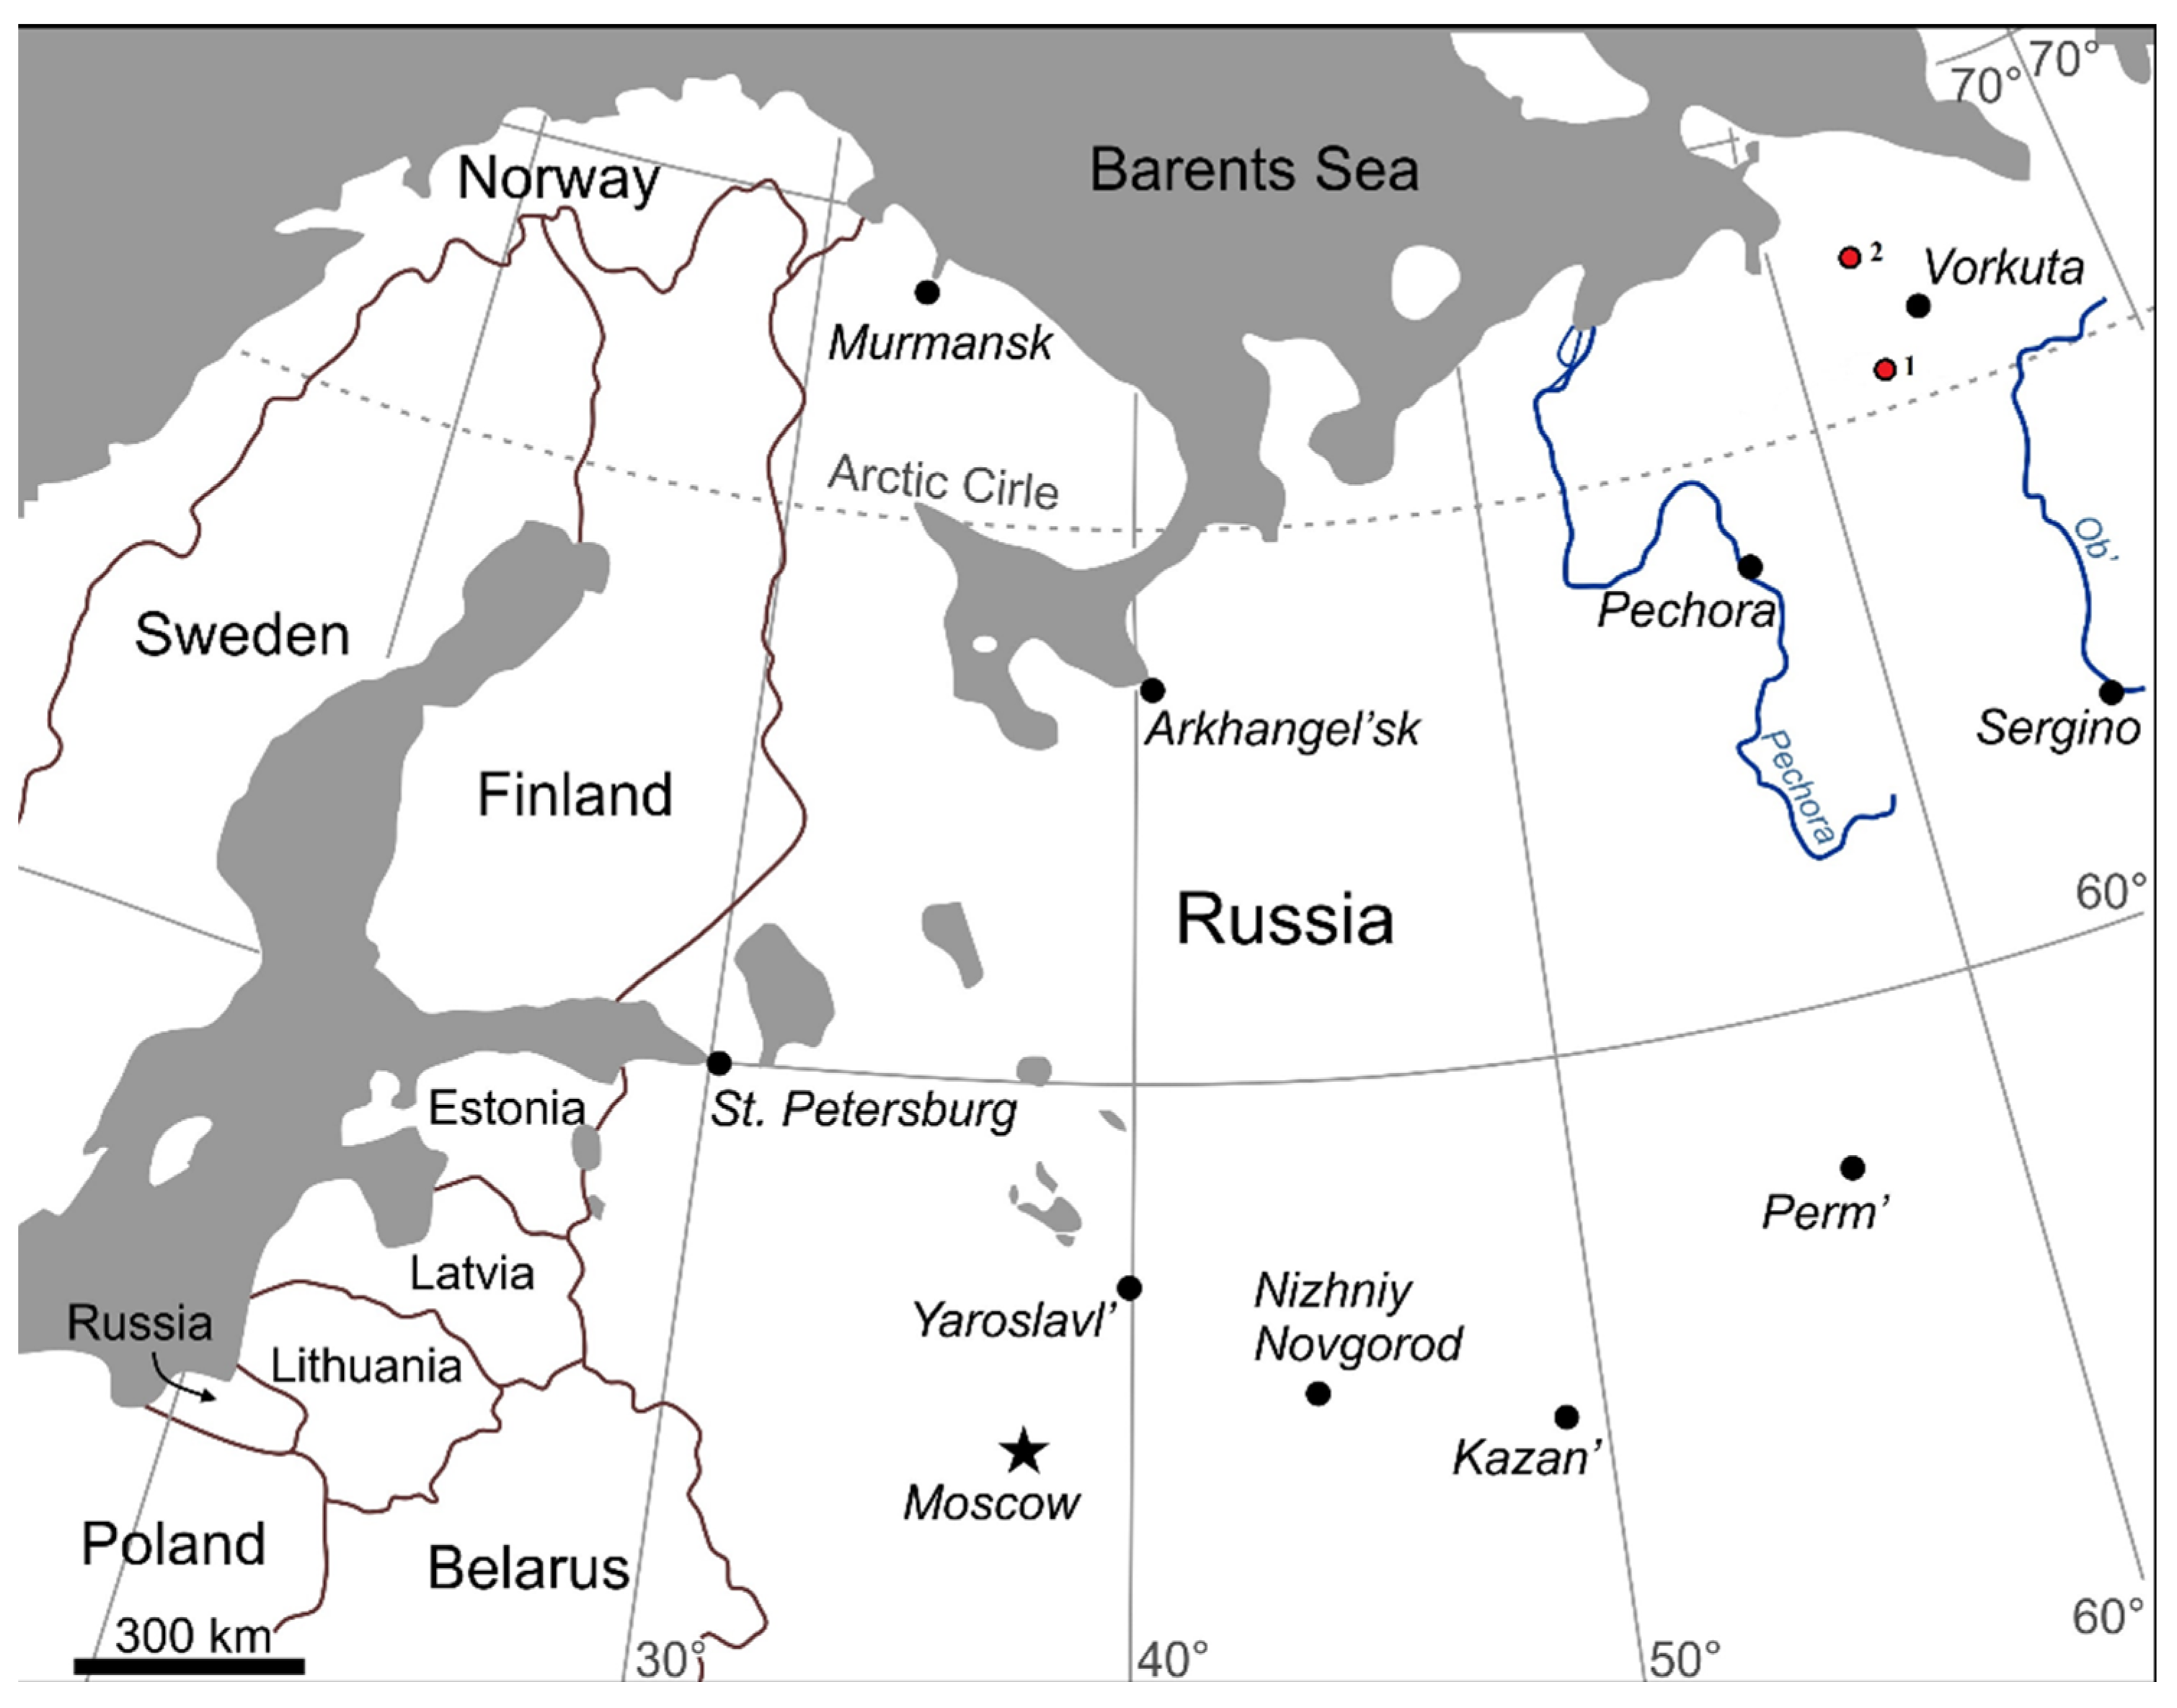
2.1. Geographical Setting

The peatlands investigated (Figure 1) are in the forest–tundra subzone (the basin of the Usa River, a part of the Pechora River basin, Vorkuta district, Komi Republic, Russia, Plots 1-1, 1-2, 67°3′27″ N, 62°56′44″ E) and ecoton north tundra—south tundra (the basin of the Korotaikha River, Nenets Autonomous Okrug, Russia, Plots 2-1, 2-2, 68°2′09″ N, 62°43′45″ E). Plots 1-1 and 1-2 are located on the same hillock, 5 m apart. The areas of Plots 1-1 and 1-2 are low sloping morainic plains in the western piedmont of the Ural Mountains, covered by silty loams less than 10 m in depth. The landscape of Plots 2-1 and 2-2 is a flat water-logged lacustrine-alluvial valley with absolute height of 30 to 100 m asl characterized by weak ruggedness of relief and wide distribution of water-logged massifs. Plot 2-1 is located 4 m from Plot 2-2. The climate is cold, subarctic and moderately continental. The annual mean air temperature is −4.0 °C, the average sum of positive temperature values varies from 1150 to 1380 °C, and the annual precipitation is ca. 550–600 mm. The evaporative power of the territory is 250 mm [23].

2.2. Sampling Sites

The two permafrost peat soils, namely, Hemic Folic Cryic Histosol (peat with vegetated plots, Plot 1-1, Plot 2-1) and Hemic Folic Cryic Histosol (Turbic) (peat with bare spots, Plot 1-2, Plot 2-2) [24] were studied as peat plateau–thermokarst complexes. Peat cores were taken in layers up to a depth of 200 cm for Plots 1-1 and 1-2, up to 265 cm for Plot 2-1 and up to 230 cm for Plot 2-2. Samples from the seasonally thawed layer (STL) of peat soils were sampled from open pits by means of fixed-volume samples into the ground with 10-cm increments. Samples from the permafrost layer (PL) of peat soils were cored using steel pipes that were drilled into the ground in 10- or 20-cm increments, and intact frozen cores were retrieved between the drillings. The permafrost in this region is extensive [23]. The upper boundary of permafrost lies at a depth of 33–40 cm. All sites are characterized by a well-defined microrelief mainly preconditioned by cryogenic processes. About 60% of the massif is represented by uplands or hummocks 0.8–1.5 m high, while the rest of the area consists of swampy hollows, swales, inundated depressions and secondary lakes. The vegetation cover is characterized by poly-dominant fruticose, moss and lichen communities. The ground cover is dominated by green (Polytrichum strictum, Pleurozium schreberi and Dicranum elongatum, etc.) and sphagnum mosses (Sphagnum fuscum, S. compactum, etc.), and the common lichen species are Flavocetraria nivalis, Cladonia. The layer of herb and fruticose is dominated by Ledum palustre, Empetrum hermaphroditum, Vaccínium uliginosum and Rubus chamaemorus, and sometimes Betula nana. Hemic Folic Cryic Histosol (Turbic) is formed at areas deprived of vegetation cover. The total area of altered bare spots is about 10% of the total areas of peatland polypedons. The lack of vegetation cover is due to cryogenic processes, deflation and grazing of reindeer herds in some areas in the southern tundra.

3. Methods

3.1. Soil Analysis

Air-dried peat soil samples were homogenized and sieved through a 2 mm sieve. Total organic carbon (TOC) content was determined using an element analyzer EA-1110 (Carlo-Erba, Cornaredo, Italy) in the Chromatography Common Use Center (Institute of Biology, Syktyvkar, Russia) and pH in water suspensions was determined using a pH-meter Hanna HI 8519 (Hanna Instruments, Vöhringen, Germany). Peat ash content was determined gravimetrically when heated at 800 °C for at least 5 h to a constant sample weight.

3.2. Radiocarbon Dating

14C dates of the peat layers were measured in the Common Use Center, “Laboratory of Radiocarbon Dating and Electron Microscopy”, of the Institute of Geography of the Russian Academy of Sciences (lab code IGAN). Radiocarbon activity was measured on an ultra-low-background liquid scintillation alpha/beta spectrometer Quantulus 1220 (PerkinElmer, Turku, Finland). Calibration was performed using CALIB Rev7.1.0 radiocarbon calibration program. The error of the dating method did not exceed 70–80 years for each date [25,26,27]. The paleogeographic scale of the Holocene was considered following the Blytt-Sernander sequence, with modified Holocene chronological standard for the tundra and forest zones of Northern Eurasia [28].

3.3. Botanical Composition and Degree of Peat Decomposition

The botanical compositions and degree of decomposition (R) of the raw peats were determined in the Peatlands Ecosystems Laboratory of the Institute of Biology of Karelia Scientific Center of the Russian Academy of Sciences. Plant macrofossils were analyzed after deflocculating samples with a known volume (5–20 cm3) of 5% KOH solution and sieving (150-μm mesh) to remove fine detritus. The remains were identified under a stereo binocular (25–40× magnification), based on reference literature. Sphagnum species were identified by their leaf morphology under microscope (100–400× magnification). Determination of the degree of peat decomposition was performed by a microscopic method according to the interstate standard GOST 10650-2013 [29]. The essence of the method was to determine the relative area occupied by the structureless part when examining a thin liquefied layer of peat on a glass slide through a microscope (55–140× magnification). The area occupied by the structureless part was expressed as a percentage and was taken as an indicator of the degree of decomposition.

3.4. Extraction of HAs

The powders of HAs were extracted from the air-dried peat samples by double-extractions with 0.1 mol/dm3 NaOH according to the IHSS recommendations [30]. The HAs were desalinated by dialysis, and were dried by heating at 35 °C in the forced convection laboratory oven.

3.5. UV-Vis Spectroscopic Analyses of HAs

A4650.01% and A6650.01% were determined by dissolving 10 mg of HAs in 100 cm3 of 0.1 mol/dm3 NaOH and A2700.001% and A4650.001% by diluting these solutions 10 times and quantifying using UV spectrophotometer (UV-1700; Shimadzu, Japan) at λ = 270, 465 and 665 nm with a 1-cm thickness layer. The following variables were used: ΔlogK = log(A4000.01%/A6000.01%), E4/E6 = A4650.01%/A6650.01%.

3.6. Elemental Analyses of HAs

HAs were characterized for their elemental composition (C, N and H) using an EA-1110 analyzer. Water content was measured by the gravimetric method, while ash content was evaluated on the base of ignition loss. Data were corrected for water and ash content. Oxygen content was calculated by difference, taking into account the ash content.

3.7. The 13C NMR Measurements of HAs

The 13C NMR measurements were carried out using a Bruker Avance III WB 400 NMR spectrometer (100.64 MHz for 13C) in the resource center, “Magnetic-Resonance Studies”, of the Science Park of the St. Petersburg State University. Solid-phase samples were placed in a 4-mm zirconium oxide rotor and spun at a frequency of 12.5 kHz at the magic angle. The cross-polarization sequence of excitation pulses was used for the registration of 13C spectra (CP/MAS). The contact time was 2 m, the delay time was 2 s, and the number of scans was 8000. Chemical shifts were referenced against tetramethylsilane. Relative contributions of the various carbon groups were determined by integration of the signal intensity in their respective chemical shift regions. Data were processed using MestReNova® v. 14.2.0 (Mestrelab Research S.L., A Coruña, Spain).
The region from 0 to 47 ppm was assigned to alkyl carbon (alkyl). The signals of methoxy groups were assigned to the region of 47 to 60 ppm (O-CH3). In this area of the spectra, α-carbon atoms of amins showed an evident reflex. The signals from 60 to 108 ppm were related to CH2O groups from the carbohydrate fragments and C-NH2 groups from the amino acid fragments (O,N-alkyl). In the region of 108–144 ppm, unsubstituted or alkyl-substituted aromatic carbon atoms (C,H-arom) were expressed, while in the region of 144–164 ppm, their analogs, containing groups -OH, -NH2, and -OCH3 (O,N-arom), were expressed. In the range of 164–183 ppm fixed atoms of carboxyl fragments and carbonyl-amides occurred [31]. The atoms of quinone fragments and the carbonyl groups of ketones and aldehydes provided weak signals in the ranges of 183–190 and 190–204 ppm, respectively [32].

3.8. Size-Exclusion Chromatography Analyses of HAs

The quantitative analysis of molecular-mass distribution of HA preparations was performed on an AKTAbasic 10 UPS chromatographic system (Amersam Biosiences, Uppsala, Sweden) with a SuperdexTM 200 10/300 GL column. Analysis parameters were the following: the aliquot volume of the HA solution—0.10 cm3, the elution rate—0.5 cm3/min, and the light filter wavelength of UV-detector—254 nm. Blue Dextran 2000 (GE Helthcare, Amersham, UK) was used to determine the column void volume. Tris-HCl buffer with pH = 8.2 was used as eluent. The buffer contained sodium dodecyl sulfate (0.1%) to prevent the specific adsorption of humic substances on the gel, sodium azide (0.02%), as an antibacterial substance, and sodium chloride (0.05 mol/dm3), to maintain a constant ionic strength and to remove the electrostatic attraction of individual particles leading to the gel sticking. For the calibration of the size-exclusion chromatography (SEC) system, gel filtration calibration kits (GE Healthcare, UK) were used, containing the following: low molecular weight proteins (aprotinin 6.5 kDa, ribonuclease 13.7 kDa, carbonic anhydrase 29 kDa, ovalbumin 44 kDa, conalbumin 75 kDa), and high molecular weight proteins (aldolase 158 kDa, ferritin 440 kDa, thyroglobulin 669 kDa). To process the chromatographic data and calculate the median molecular weight (Mr) of the HA fractions, the original Unicorn 5.10 program was used.
To calculate polydispersity ratio (Mw/Mn) two types of medium molecular weights were used in the study, namely, number average (Mn) and weight average (Mw) [33]:
M n = n i M i n i
where ni—number of i molecules with molecular weight Mi.
M w = n i M i 2 n i M i

3.9. Statistical Analyses

Bivariate correlation analyses were conducted using the Pearson product-moment correlation coefficient (r), and its statistical significance was assessed via the Neyman-Pearson (NP) approach (normal distribution). Technically, the observed value of the coefficient (based on n pairs) was compared against the critical value (rcr) for a two-tailed test and significance level (α) of 0.05. Principal component analysis (PCA), using Statistica v. 12.1 (Dell, Round Rock, TX, USA), was performed to determine the correlations between physical and chemical parameters of HAs. The number of the factors extracted from the variables was determined by a Kaiser’s rule. With this criterion, the first two principal components with an eigenvalue greater than two were retained [34]. All statistical estimations were performed with the predetermined significance level of p ≤ 0.05.

4. Results and Discussion

4.1. Basic Properties of Peat Soils

Data on the composition and physical and chemical properties of peat soils and HAs (Table 1) showed that the lowest pH (3.4–3.8) values were typical of topsoil oligotrophic material and indicated strong acidity. At the upper boundary of permafrost formations there was an increase of pH to 4.6, which then rose to 5.7 in the lower eutrophic part of the profile for all the plots under study. Peat from Plot 2-1 and Plot 2-2 had ash content (2.6–10.3%) and high carbon content (42.6–52.5%) along the whole profile. The lower parts of Plot 1-1 and Plot 1-2 profiles were composed of peat and alluvial deposits characterized by high ash content and low carbon composition (Table 1).
The radiocarbon dating findings showed that the initial stage of peat accumulation in the area under analysis dated back to the Early Atlantic period of the Holocene epoch (AT1)—7160 ± 80 yr BP (IGAN 4646) (Plot 1-1, Plot 1-2) and 7870 ± 80 yr BP (IGAN 6244) (Plot 2-1, Plot 2-2). At that period, peat deposits were formed by eutrophic vegetation communities, such as sedge and grasses like Carex, Equisetum, Menyanthes, hypnum and sphagnum mosses, and tree species like Pinus sylvestris, Betula sp., Picea. The estimated values of the linear rate of peat accumulation (Table 1) and peat botanical composition data in the study area [35,36] were indicative of the following major stages of organic matter humification: 7900–7400 yr BP—the Holocene I climatic optimum (AT-1), 5700–5200 yr BP—the Holocene II climatic optimum (AT-3), 4700 yr BP—cooling of the Early Subboreal (SB-1), 1800–1350 yr BP—warming of the Middle Subatlantic (SA-2), around 500–160 yr BP—Little Ice Age (SA-3), 70 yr BP—contemporary climate warming (SA-3). After a period of 4700–3700 yr BP the vegetation cover was dominated by mesotrophic representatives (Betula nana, Eriophorum), and, later, after 1350 yr BP oligotrophic communities (bryidae, lichens and subshrubs) (Table 1).

4.2. Elemental Composition and Optical Properties of HAs

The x(H):x(C) ratio of HA characterizes the degrees of condensation and maturity, and is related to climatic parameters of its formation period [37,38,39]. There is a clear distinction of HAs extracted from the STL of oligotrophic and mesoeutrophic peat characterized by the highest values of x(H):x(C) (0.99–1.19), and more condensed HAs from permafrost eutrophic peat (0.76–1.06), built in favorable climatic conditions of the Atlantic period of the Holocene (Table 1). With regards to this indicator, HAs of the upper horizons from peats with bare spots (Plots 1-2, 2-2) were represented by more condensed structures than HAs of peats with vegetated plots (Plots 1-1, 2-1), as they were heated and insolated more intensively in the climatic summer period [36]. Decreased x(O):x(C) ratio in HAs along the profile in all plots under study was indicative of reducing conditions of peat formation. Similar regularities in the profile distribution of x(H):x(C) and x(O):x(C) in HAs were obtained for ombrotrophic bogs from Switzerland [16]. Proceeding from the above, it follows that the humification process in peatlands was accompanied by degradation processes, such as dehydrogenation (reduction of x(H):x(C) ratio), and decarboxylation (reduction of x(O):x(C) ratio).
The UV-Vis spectroscopy method makes it possible to conduct qualitative assessment of HA humification degree with estimated coefficients ΔlogK and E4/E6 [16,40]. Maxima of absorption of key aromatic structures in HA (lignin, phenol fragments, aromatic amino acids) were observed in the wavelength range of 260–280 nm, while in the 400–465 nm region a change in the HA absorption curve was obvious [41,42]. E270, E465 coefficients indicated a gradual increase in molecular complexity of HAs from permafrost layers as compared to HAs of STL of the peatlands under study. A significant negative correlation of the E270 (r = −0.52, n = 42, rcr = 0.30) and E465 (r = −0.69) with the x(H):x(C) was observed.
ΔlogK, x(H):x(C) and x(O):x(C) decreased in buried horizons (Table 1), reflecting the highest degree of humification and reduction of oxygen-containing HA molecular fragments of older strata. The lowest values of these indicators corresponded to lower organo-mineral horizons developed on mineral soils at the start of the water-logging process. Similar results were obtained for cryosolic peat soils of the Arctic [40]. E4/E6 decreased in buried horizons, which was indirectly indicative of reduced size of HA molecules [38,43]. The E4/E6 ratio was inversely related to the degree of condensation of the aromatic network in HAs so that a low ratio would reflect a high degree of aromatic condensation and the presence of relatively low proportions of aliphatic fragments [8].

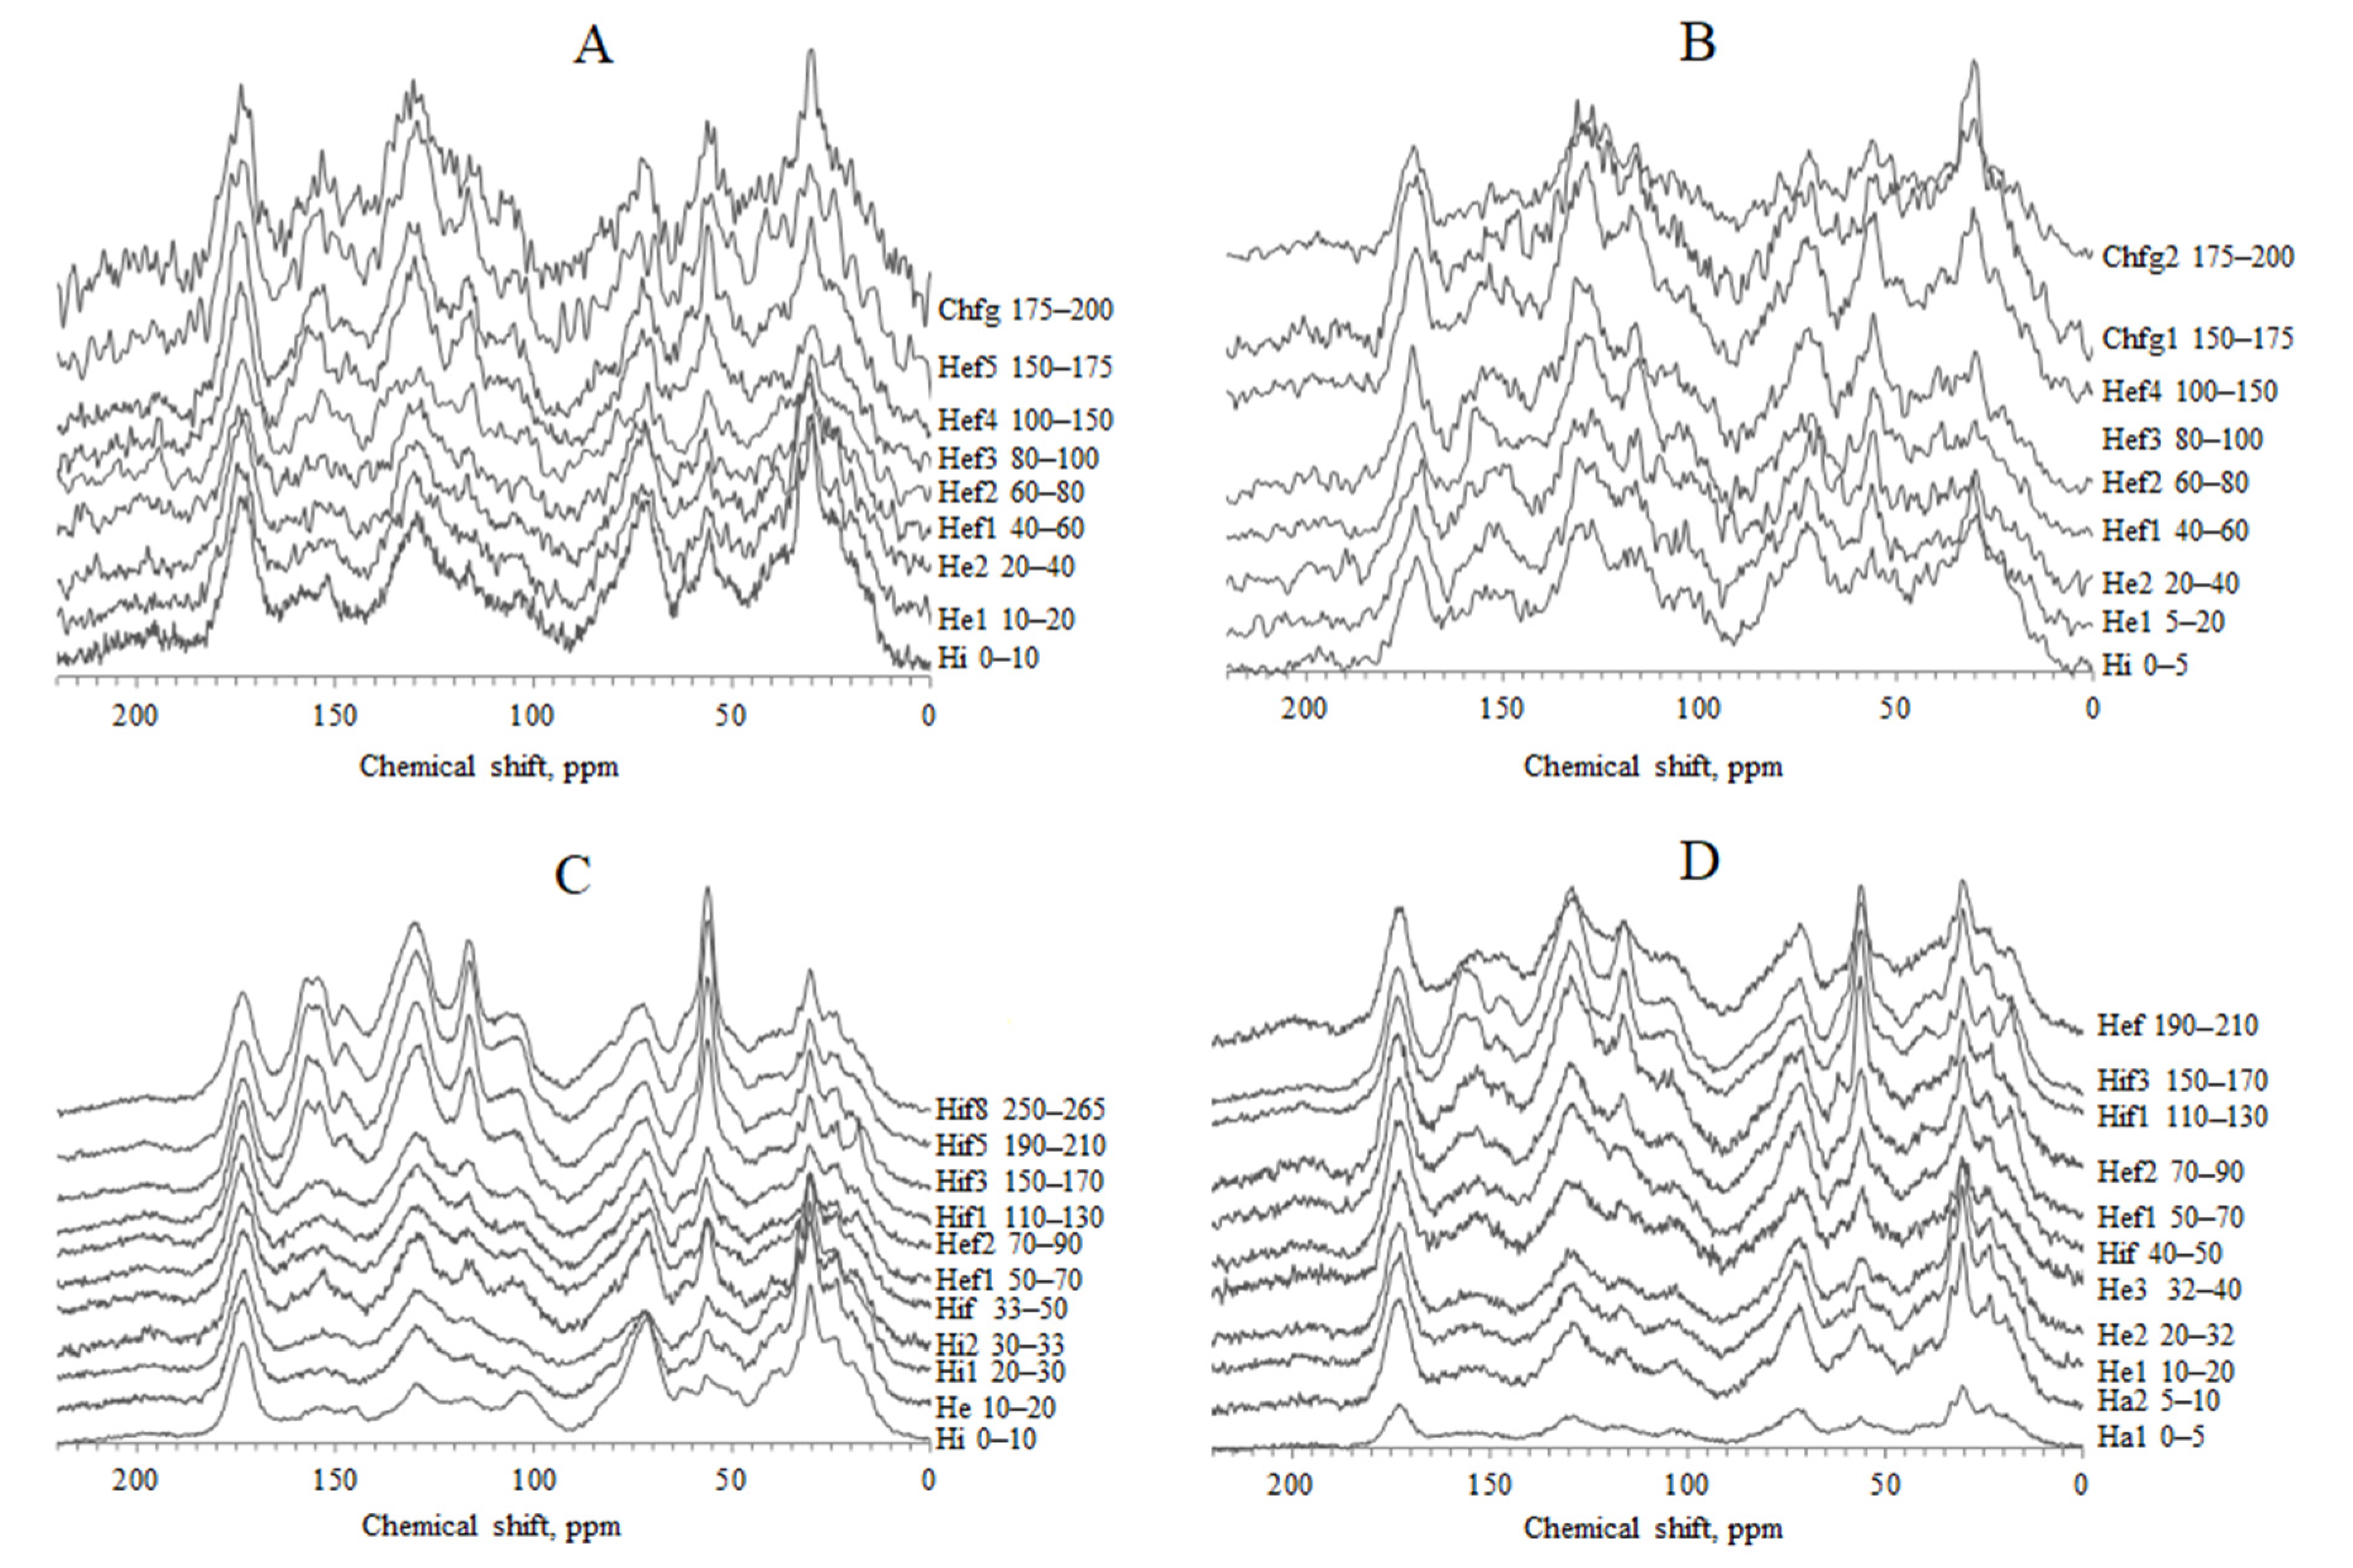
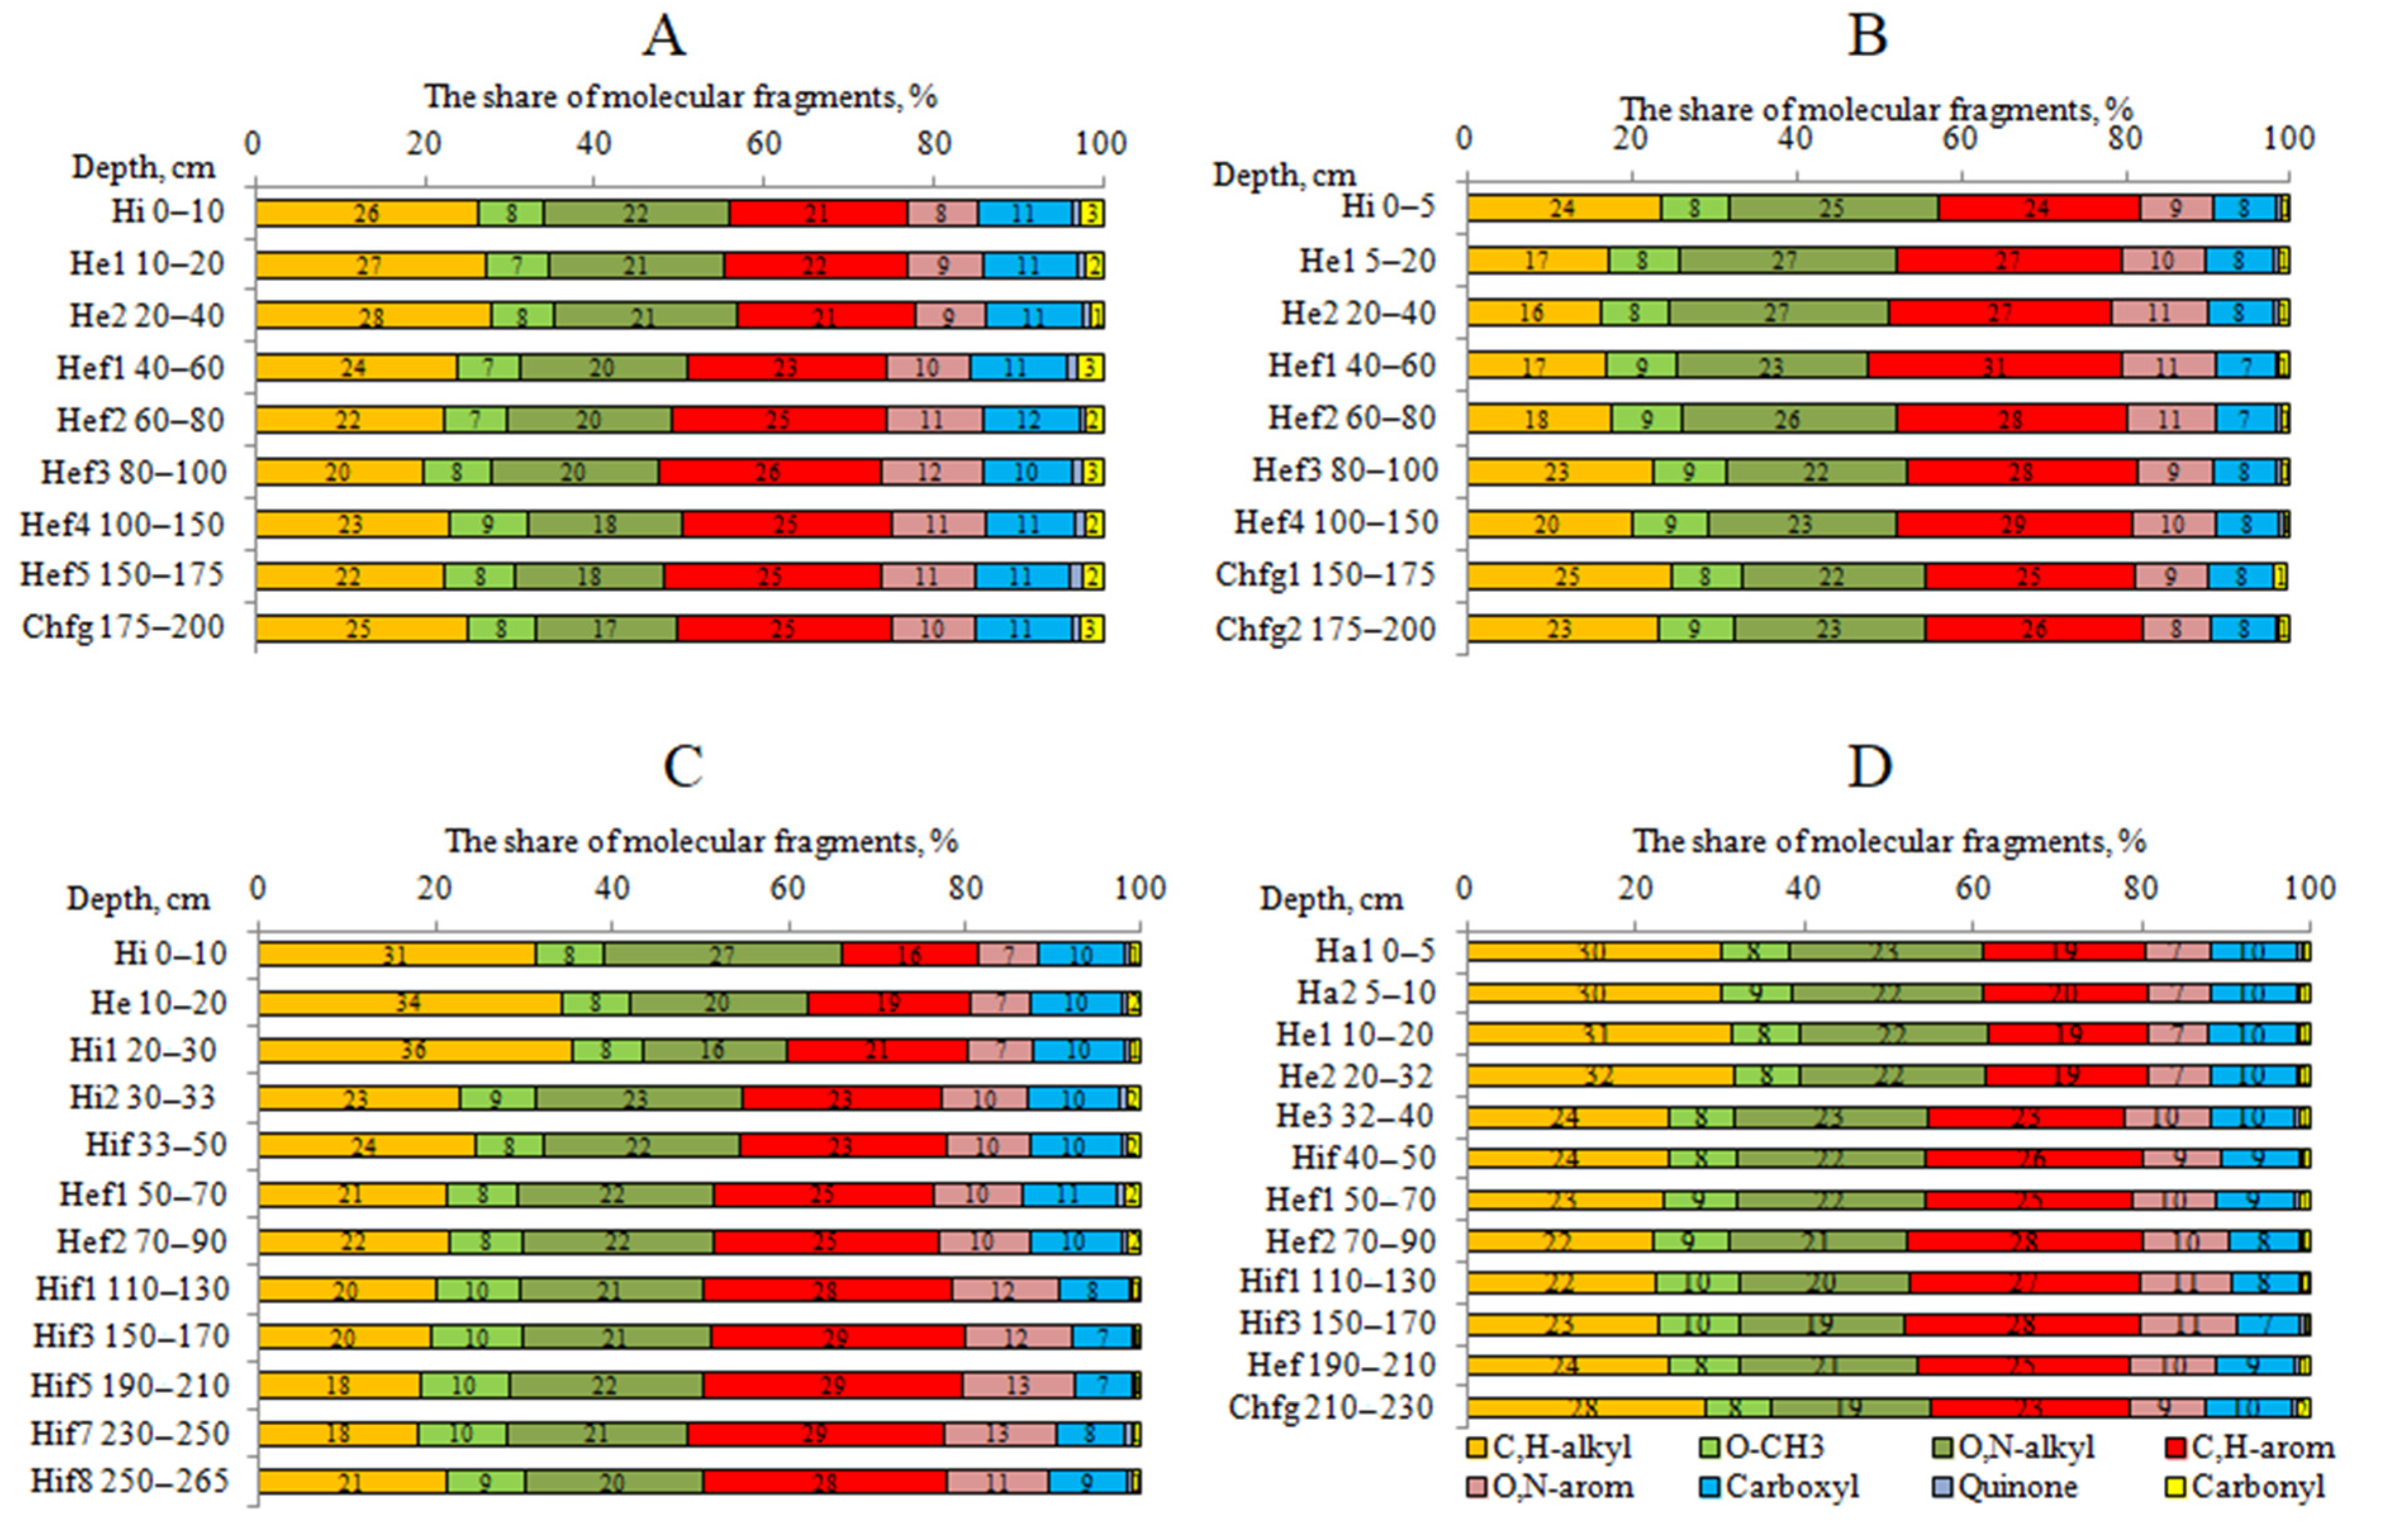
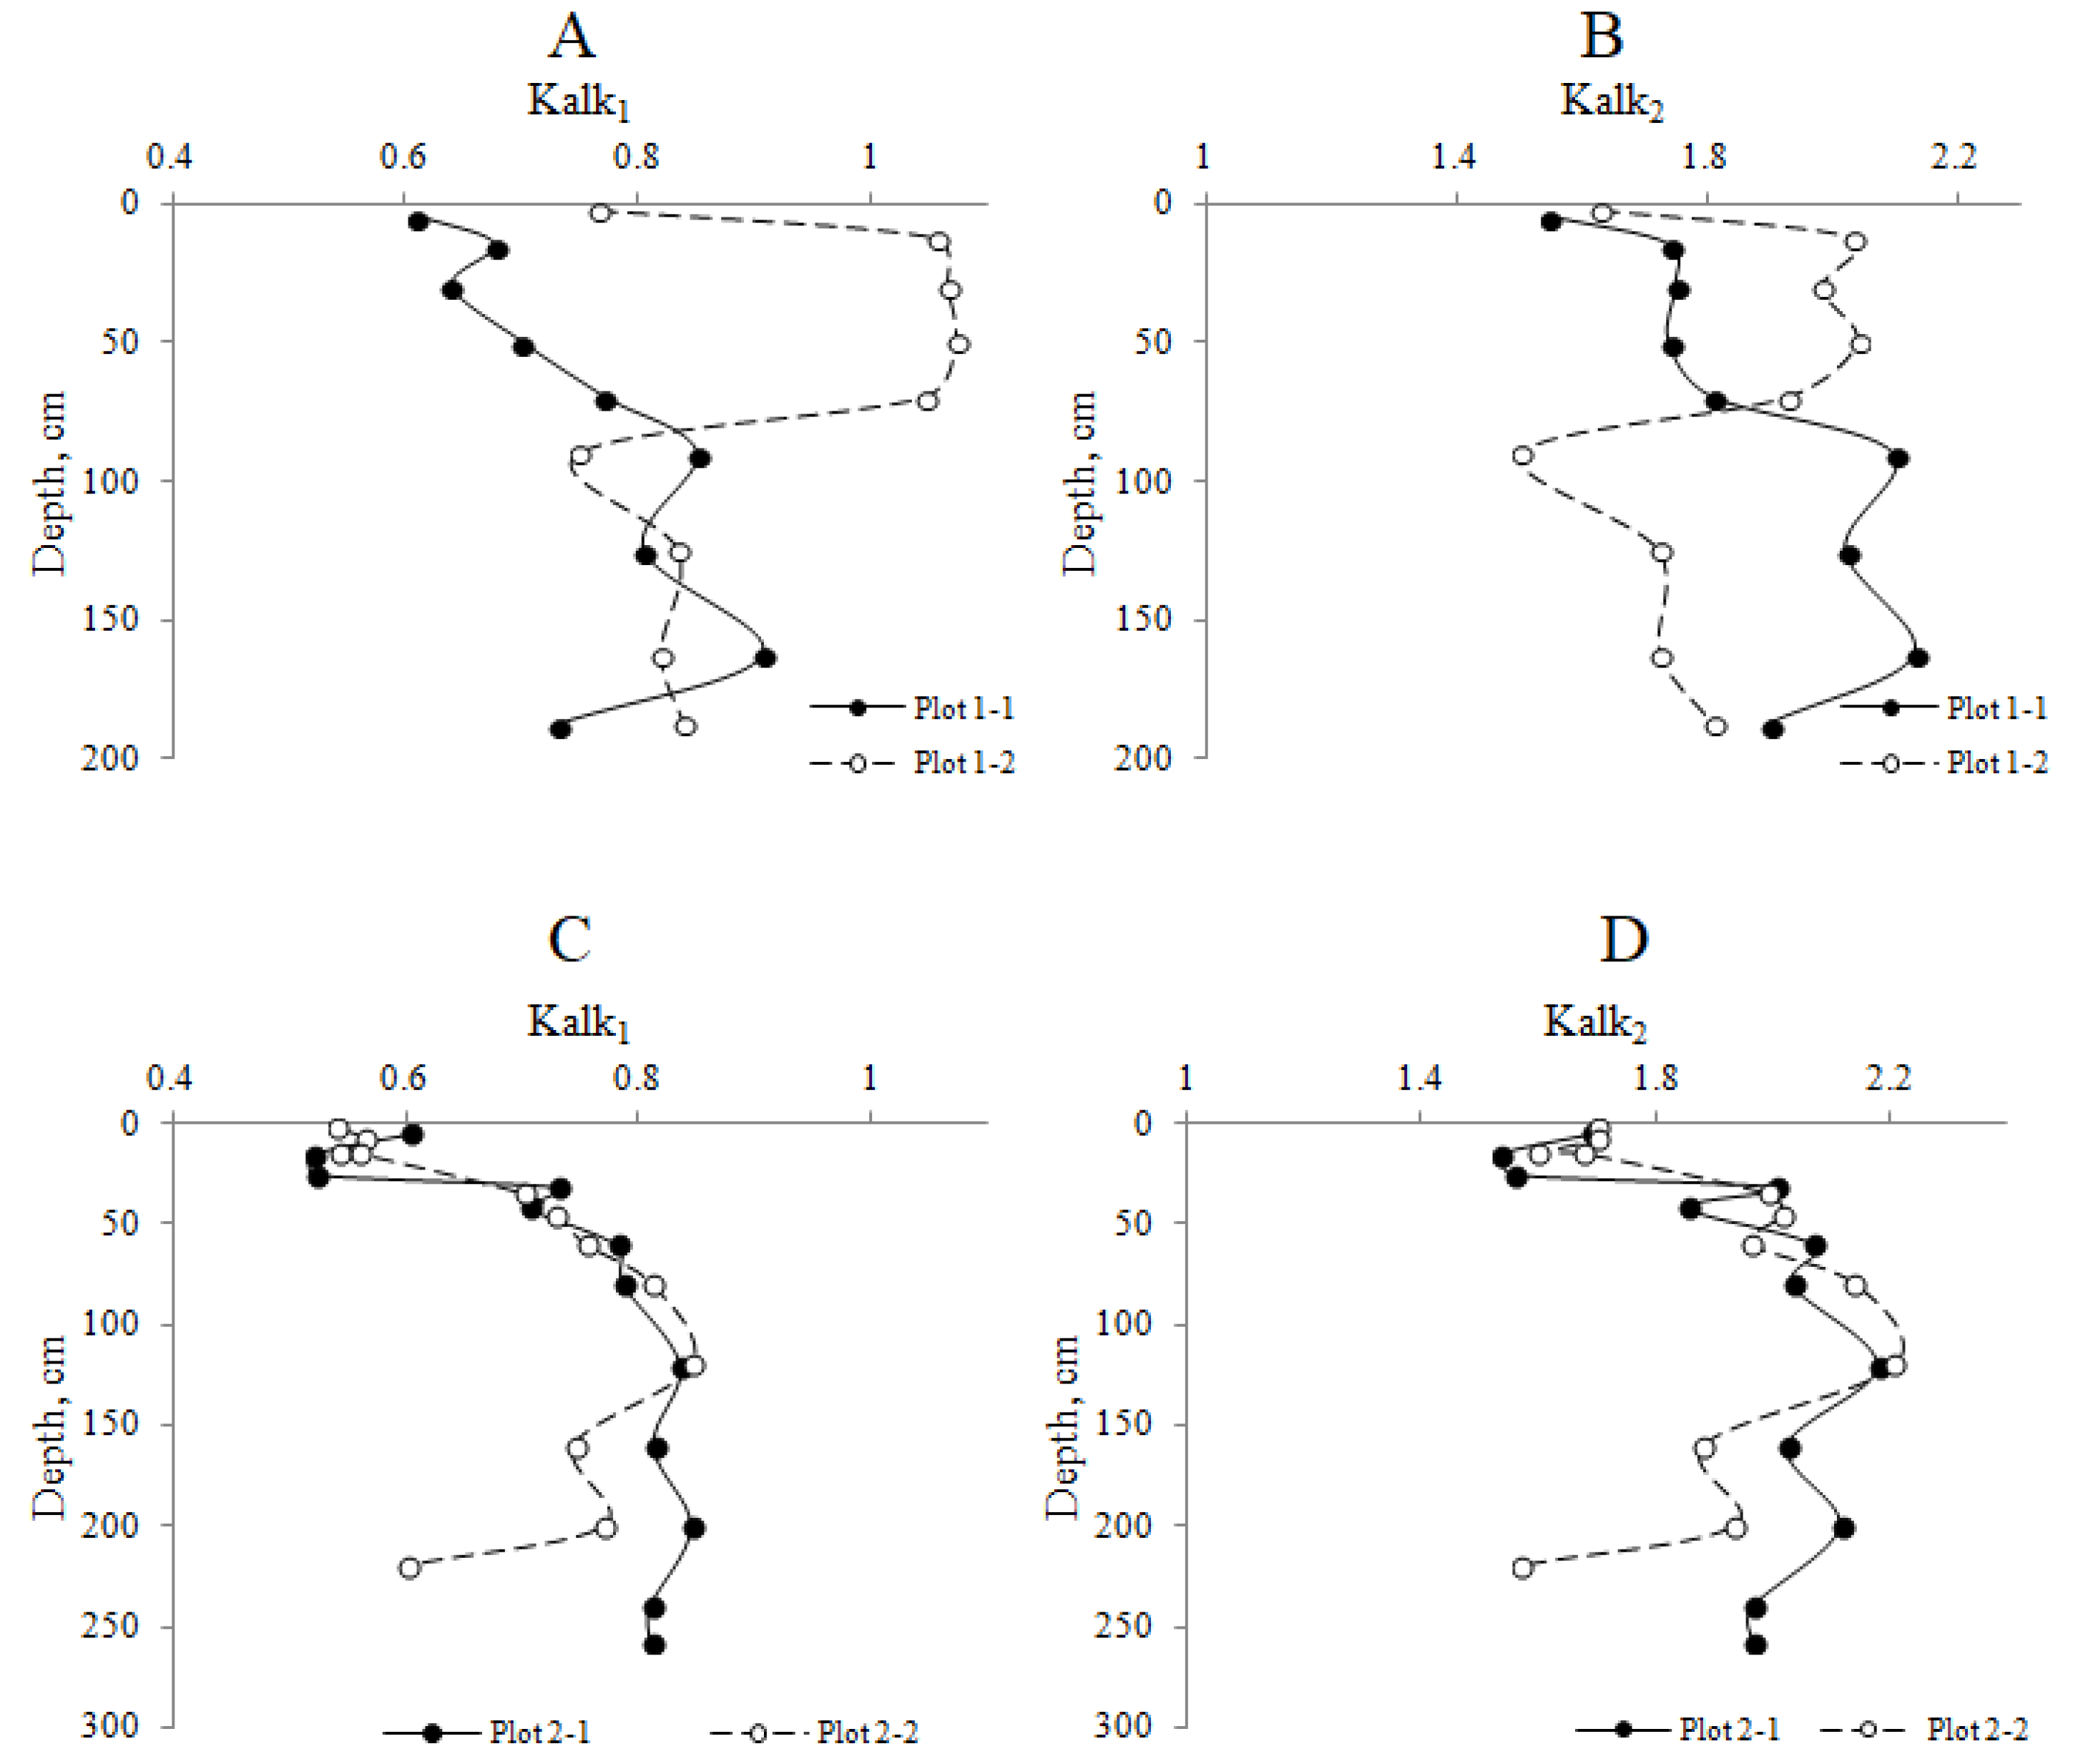
4.3. The 13C NMR Data of HAs

All obtained 13C NMR spectra of humic substances featured broad bands stemming from multiple signal overlapping (Figure 2).
The results of 13C-NMR-spectroscopy analysis of functional groups and molecular fragments are given in Figure 3.
These data revealed that the sum of C,H-alkyl and O,N-alkyl turned out to be the dominant components in HAs from all peat samples. The predominance of aliphatic fragments in the structure of HAs from ombrotrophic peat bogs was earlier noted [8,10,44].
The evaluation of the contents of HA functional groups and molecular fragments, as indicated by 13C-NMR spectroscopy data, spoke of the difference of their molecular composition in seasonally thawed and permafrost peat layers. In general, the profile change in HA composition was characterized by an increased share of aromatic fragments and metoxy groups and a decrease in the relative fraction of paraffin and carbohydrate fragments for all peat soils under study (Figure 3).
The content of aromatic fragments, as well as their ratio to the proportion of aliphatic fragments in HA, most objectively reflected the degree of humification and climatic parameters of the period of their formation [10,39]. Top layers of peats were formed in the Subatlantic period (SA-1, SA-2) (Table 1) under the most severe climatic conditions [28,45]. An intensive increase in the proportion of aromatic fragments in HAs was observed in STL with depth (Figure 3). The peat layers of the lower part of the STL for Plot 1-1 (20–40 cm) and Plot 2-1 (20–30 cm) were dated 3480 ± 70 yr BP (IGAN 4641) and 3680 ± 70 yr BP (IGAN 6236) and referred to the Middle Subboreal period (SB-2) (Table 1). The data of palynological studies diagnosed a short-term warming for the study area during this period [45]. More favourable climatic conditions of the early Holocene (the Atlantic optimum) defined the botanical composition of peat dominated by tree and sedge communities (Table 1) with a high content of lignin components and, as a consequence, a larger share of aromatic fragments characterized by thermobiodynamic resistance in HAs of horizons in lower and central profile parts. The accumulation of aromatic fragments in the structure of HAs from the lower, older layers of peat could also be due to the fact that the easily decomposed fragments (e.g., carbohydrate and paraffin) were more quickly consumed by microorganisms [46].
The analysis of the molecular composition of HAs from the upper peat horizons in the zonal series of soils reflected the current climatic features of the area [37,39]. HAs from top layers of hummocky bogs in the forest–tundra subzone (Plots 1-1 and 1-2) had a greater contribution of aromatic fragments (up to 33%) and a smaller contribution of unoxidized aliphatic structures (up to 24%) in the molecule assembly (Figure 3) than HAs from peatlands from the northern tundra—southern tundra ecoton (26 and 31%, respectively) (Plots 2-1 and 2-2). This was due both to the change in the botanical composition of peat and the degree of its decomposition, and to the climatic conditions of its formation (Table 1).
A high share of unoxidized aliphatic fragments (0–47 ppm) in HA molecules in the STL was likely to be associated with a low degree of peat decomposition and domination of bryophytes within the vegetation material, with low lignin component content [15,47,48]. The detailed study of this region of the spectra indicated that high signal intensity was shown by lines from unbranched aliphatic fragments. In this region the following ranges were distinguished: 0–26 ppm (alkyl1)—mainly referring to carbon atoms of terminal methyl groups, 26–36 ppm (alkyl2)—mainly referring to methylene groups of long alkyl chains, 36–47 ppm (alkyl3)—mainly referring to methine and methylene groups of branched alkyl chains [49]. We proposed a branching index for alkyl structures Kalk1 = alkyl3/alkyl2 and an index to characterize the length of paraffin chains Kalk2 = (alkyl1 + alkyl3)/alkyl2. HAs of the soils from the two subzones under study (Plots 1-1, 2-1 and 2-2) demonstrated an increased input of branched paraffin structures into the overall molecular composition when going down along the stratified profile (Figure 4). Both coefficients reached their maxima at 80–100 cm and 150–175 cm deep in the Plot 1-1, and at 70–120 and 190–260 cm in the Plots 2-1, and 2-2. Following carbon dating results (Table 1) peat formation in these layers (Plots 1-1, 2-1, 2-2) dated back to the Holocene II climatic optimum (approximately 5200–5700 yr BP), characterized by the highest values of biologically active temperatures [36]. At a depth from 190 to 260 cm for Plots 2-1 and 2-2, HA formation occurred during the Holocene I climatic optimum (around 7400–7900 yr BP), which was also related to a high degree of paraffin fragment branching. Higher input of long-chain structures from lower horizons for HAs from Plot 2-2 was conditioned by increased total content of paraffin components and was likely to be associated with the vegetation composition.
For the soils of the forest–tundra subzone (Plot 1-1), developed in the period between I and II climatic optima (around 5700–7100 yr BP), a reduction of Kalk1 and Kalk2 ratios for HA was observed in the depth range 100–175 cm. It is important to note that there was a significant increase of the Kalk1 and Kalk2 coefficients in the HA composition in the seasonally thawed layer of Plot 1-2, especially at the depth of 20–60 cm, which had peat with the highest degree of decomposition and HAs with the highest aromaticity level. Higher biologically active temperatures of the seasonally thawed layer of soils at bare spots [36] determined the intensity of transformation of HA molecular fragments.
Significant negative correlation between the content of aromatic and unoxidized aliphatic fragments in HAs (r = −0.88, n = 42, rcr = 0.30) was observed. Furthermore, a reliable positive correlation between the content of aromatic fragments with branching index Kalk1 (r = 0.82, n = 42, rcr = 0.30) and with an index Kalk2 (r = 0.70) was established in HAs. This indicated the potential for HA paraffin chains to transform into conjugation systems.
The abundance of labile carbohydrate fragments in HA structure is associated with the weak bioactivity and reductive conditions of peatlands. The proportion of these fragments tended to decrease downwards within the STL in all studied plots, which was associated with preferential biological degradation of carbohydrates [8]. In the conserved state in PL, carbohydrate fragments of HAs demonstrated very slow transformation. Similar regularities were observed in non-permafrost oligotrophic peat soils of Latvia [10].
Anaerobic conditions of humification in peatlands determine the low content of carboxyl groups in HAs (6.6–11.5%), which is significantly lower than in HAs of mineral tundra soils [50]. Carboxyl groups are distributed in HA profile without any particular pattern. As a rule, their content was minimal in the central section of the profile, which was indicative of intense reductive conditions and abundance of water in these horizons in the peat accumulation period.
The study of profile distribution of molecular parameters of HAs enabled estimation of major humification trends in hummocky peatlands. In Holocene I and II climatic optima, long-chain aliphatic structures of HAs underwent vigorous transformation into branched short-chain fragments with subsequent ring formation to aromatic structures, which was clearly demonstrated in HA parameters in central and lower parts of the peat soil profile. The Subboreal and Subatlantic climatic conditions determined specifics of vegetation precursors and, as a result, molecular structure of HAs in seasonally thawed layers.

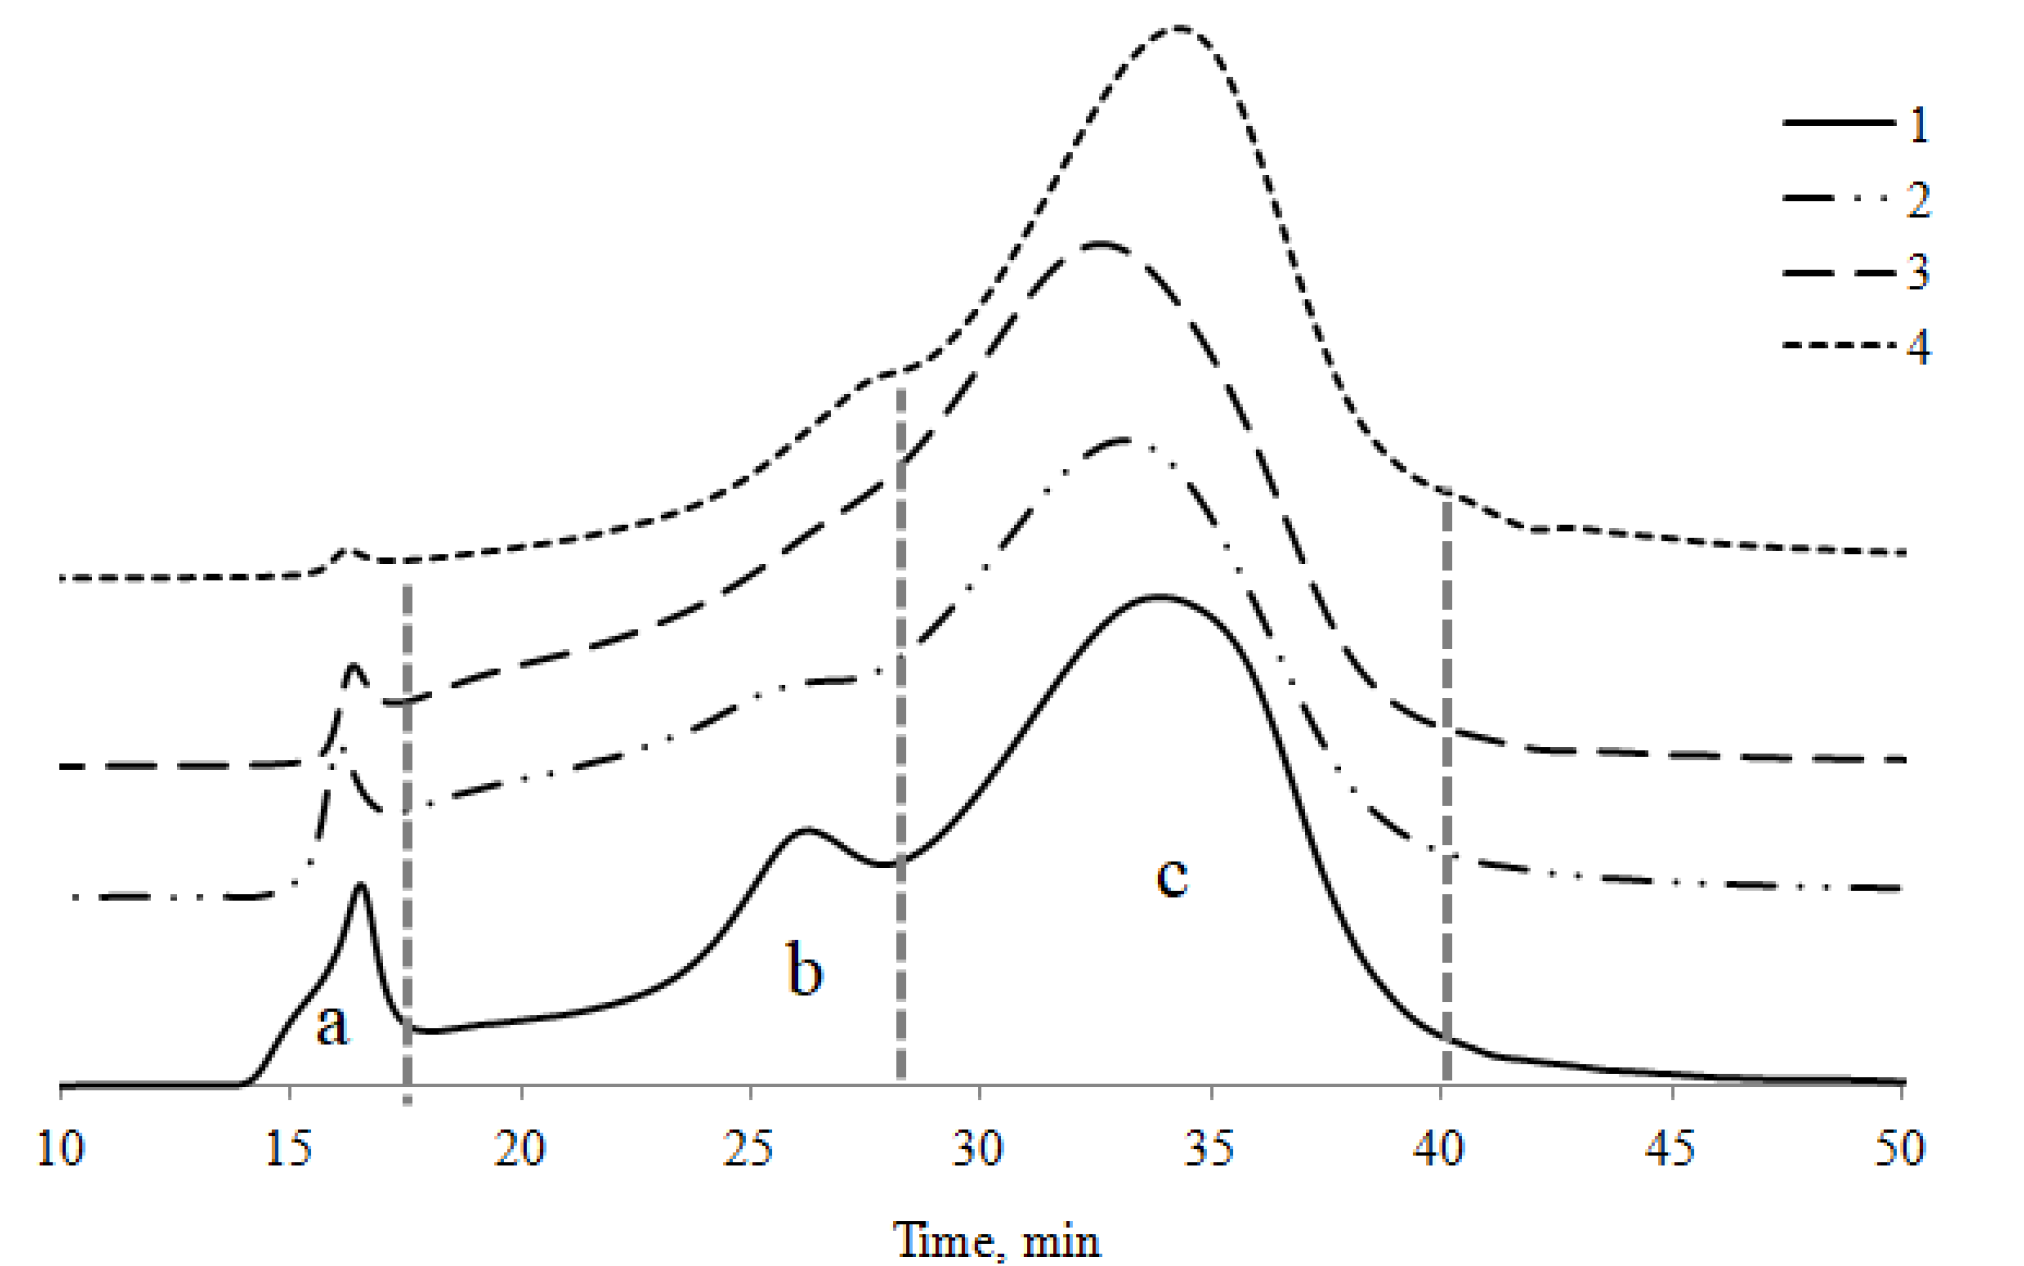
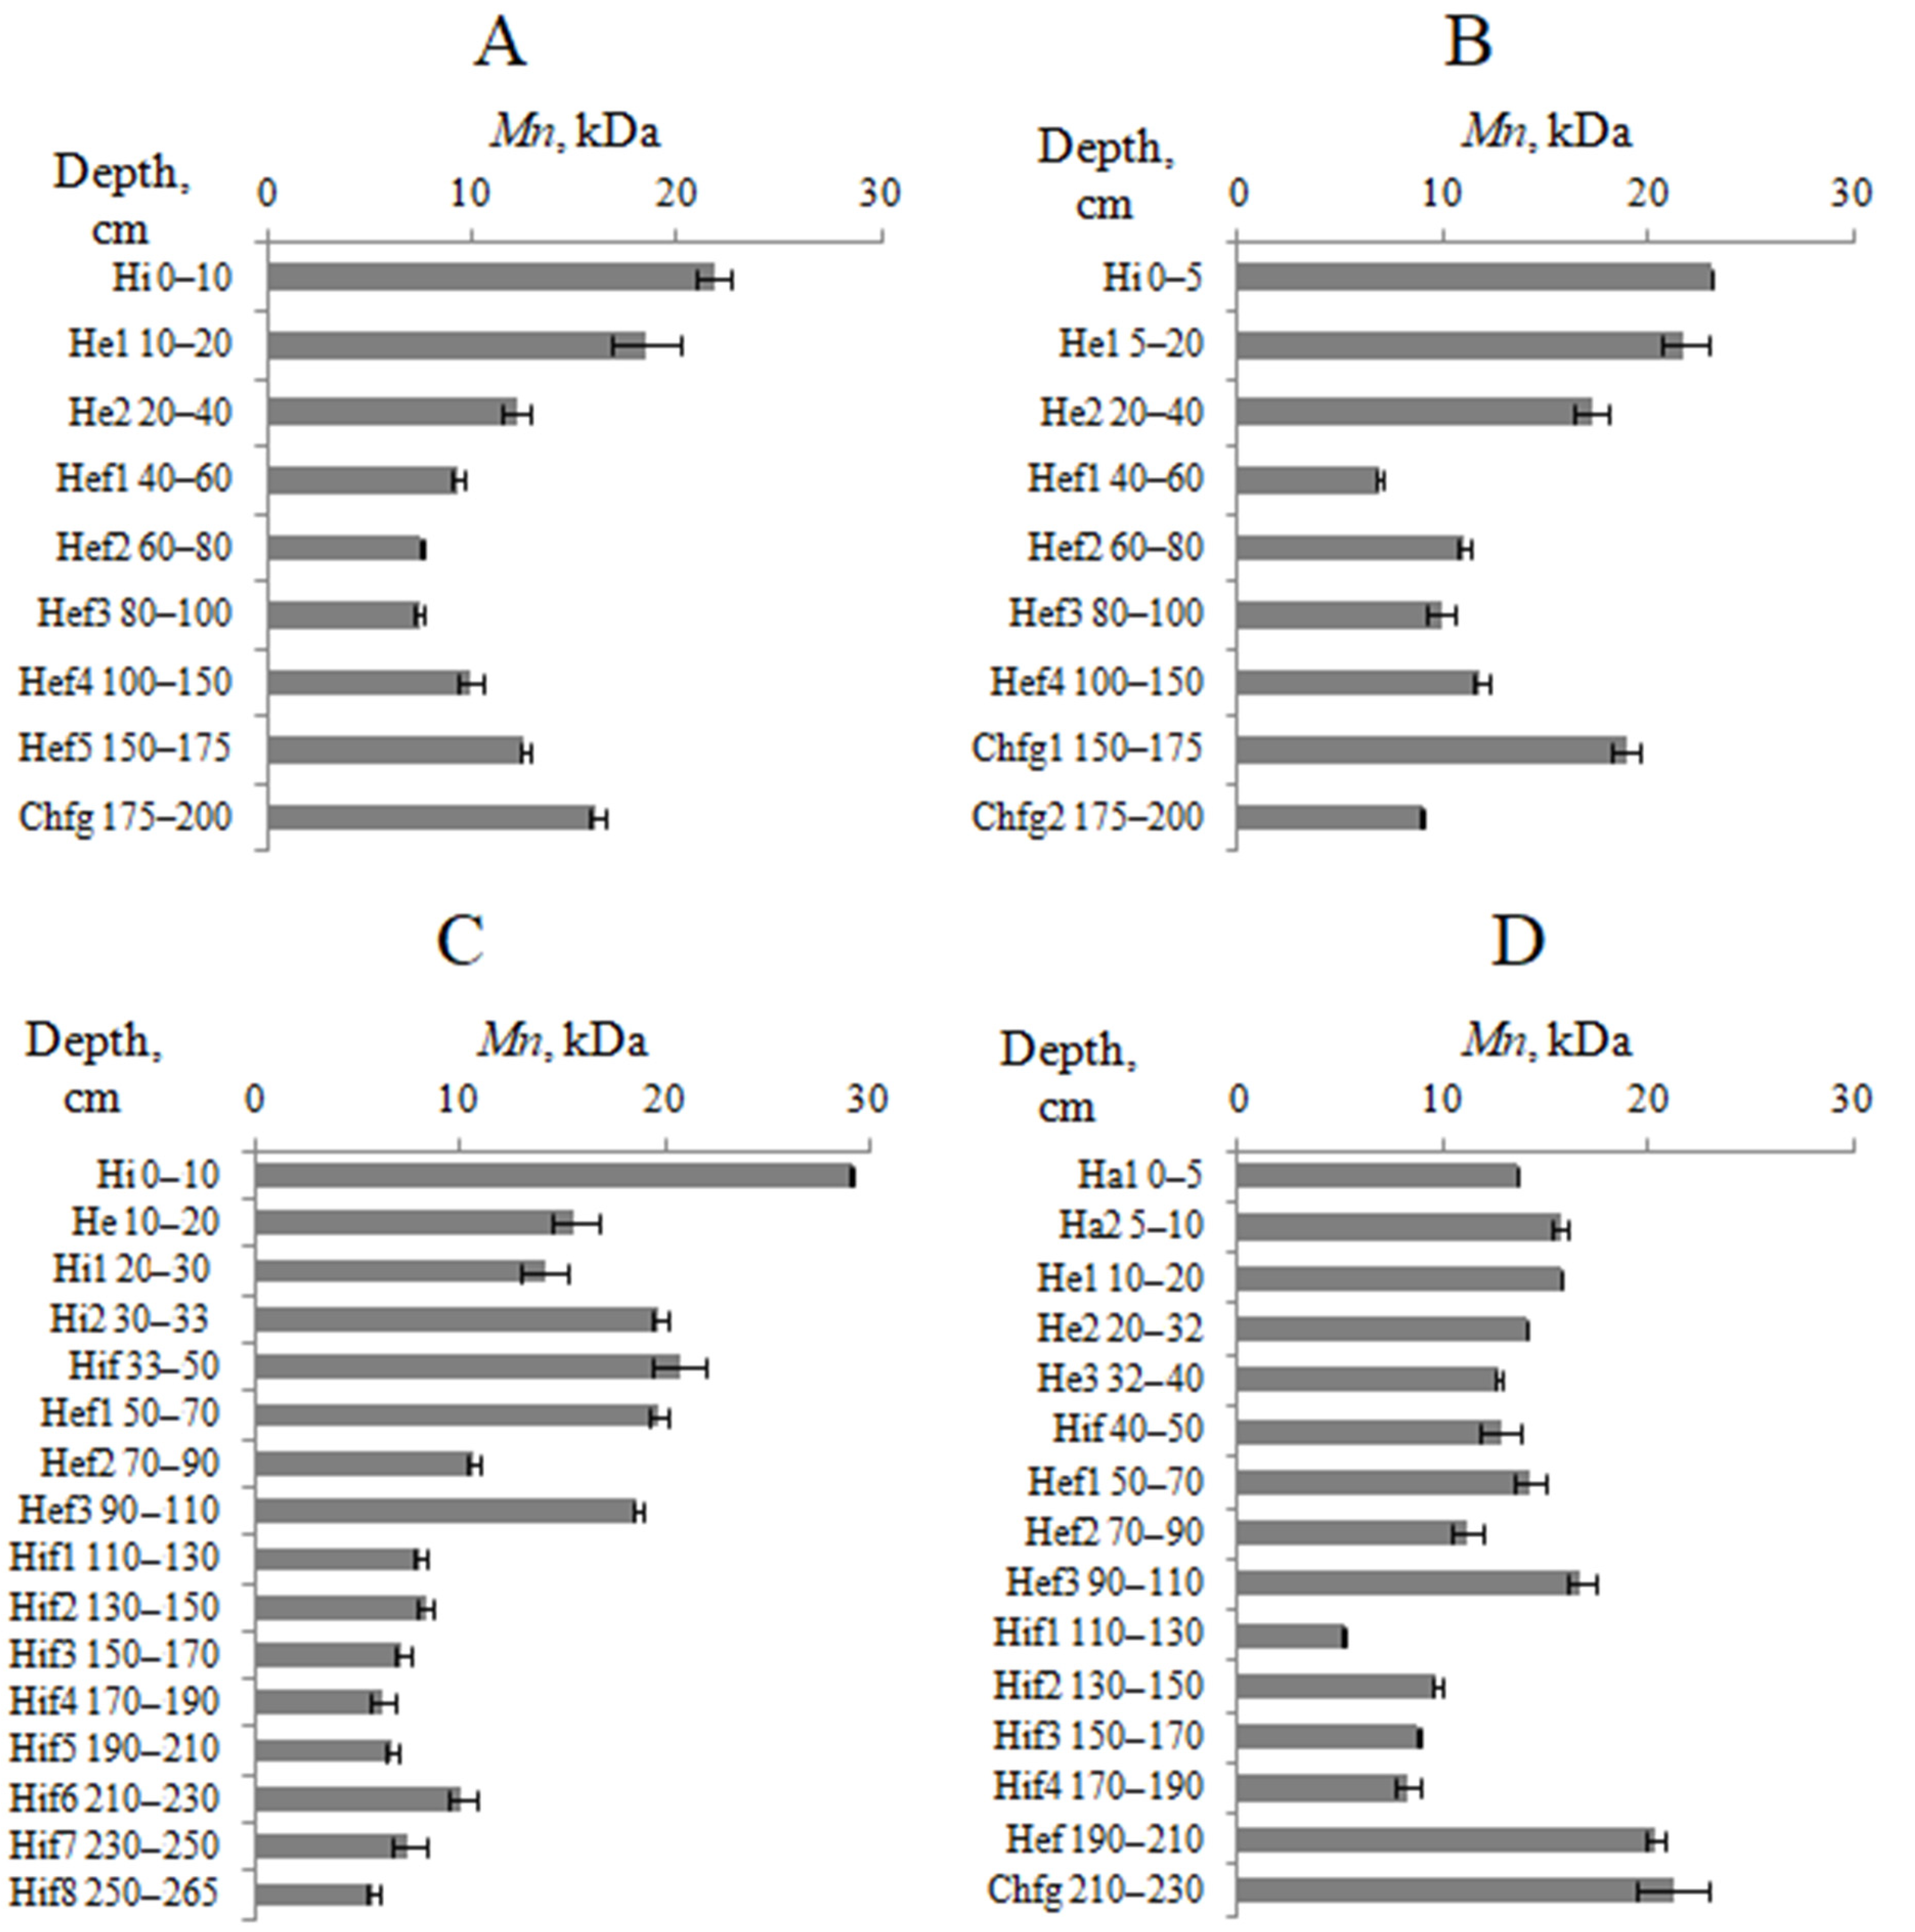
4.4. Molecular Weight Distribution of HAs

As a result of hummocky permafrost peat HA gel chromatography, three extreme values were observed, corresponding to three HA fractions: high molecular weight (HMF) (Figure 5, region a), medium molecular weight (MMF) (Figure 5, region b) and low molecular weight (LMF) (Figure 5, region c).
HAs from Eutric Albic Stagnic Histic Retisol (Loamic) were selected as a standard [51], since they demonstrated clear distribution of chromatographic peaks into the three fractions. This made it possible to unify the procedure for separation of high, medium, and low molecular weight fractions and to conduct comparative analysis of the HA preparations under study.
It was shown in the works [33,52] that in the shape of the chromatogram curves the position of one or more maxima depends on both fractional composition of HAs and their genesis. The regions in the chromatograms belonging to different fractions had different areas, which indicated the variation in their relative content in the samples under study. The curves of molecular weight distribution of the fractions had one pronounced maximum in the low molecular weight region. The share of low molecular weight HA fractions of the studied peatlands dominated (45.7–82.6%) and it was statistically significantly higher than fractions of medium (11.0–32.9%) and high (0.8–6.2%) molecular weight fractions (Table 2). The presence of the following three fractions had a significant variation in the median values of molecular masses and indicated the polydispersity of the studied HAs: high molecular weight 271–468 kDa, medium molecular weight 15.3–23.9 kDa, low molecular weight 1.0–2.0 kDa.
The values of the number-average molecular weights of the studied HA preparations obtained were comparable with the reference source data [53] and had a significant variation (6.9–29.1 kDa) among the profiles. Significant difference in the profile distribution of these indicators for the four plots was observed. The distribution of the number-average molecular weights of the HAs from two Plots, 1-1 and 1-2, of the forest–tundra subzone was bimodal by character, with maximum values displayed in the upper and lower parts of the profile (Figure 6A,B). The largest number-average molecular weights of HAs (21.8–23.1 kDa) referred to the upper horizons of the STL, due to the larger contribution of high and medium molecular weight fractions (Table 2). These peat layers (1310 ± 70 yr BP, IGAN 4647; 1450 ± 70 yr BP, IGAN 4640) were formed in the Middle Subatlantic period (SA-2) (Table 1) under the least favorable climatic conditions [28,35,36]. The lowest level of transformation of the structure and size of HA molecules, compared to HAs from PL, was associated with it.
The analysis of molecular weight distribution of HAs from permafrost formations was characterized by reduced Mn of HAs of forest–tundra subzone soils (6.9–13.3 kDa), mainly due to a decreased share of high molecular weight fraction from 3.8% in STL to 0.8% in PL (Table 2). Its change at the permafrost boundary was especially intense.
The minimum number-average molecular weight of HAs (6.9 kDa) was at the boundary HAs, with a higher degree of molecular aromaticity and a smaller share of unoxidized aliphatic fragments corresponding to these horizons (Figure 3B). Moreover, this might be related to a change in the botanical composition of peat of the permafrost soils of bare peat spots (40–60 cm), which might be associated with the highest degree of peat decomposition dating to the Holocene II climatic optimum (5270 ± 80 yr BP; IGAN 4649).
It is important to note that from the depth of 100 cm (Plots 1-1 and 1-2) a gradual increase in the ash content of soil samples was observed, from 40 to 90% in the lower part of the profile. According to the data [42], ash elements can lead to neutralization and weak polymerization of HA molecules. The increase in number-average HA molecular weight in the permafrost was likely to be caused by coagulation of HAs on the mineral matrix of peat deposits with the formation of high molecular weight HAs.
An increase in the degree of peat decomposition down the profile within the seasonally thawed layer (to the depth of 40–60 cm) (Table 1) and the associated extensive humification of organic material caused a systematic decline of Mn (Figure 6). This caused a decrease in the proportion of paraffin and carbohydrate fragments in the HAs of Plots 1-1 and 1-2. This statement was supported by a significant correlation of the x(H):x(C) ratio, according to elemental analysis, with the molar fraction of the high molecular weight fraction (r = 0.50, n = 18, rcr = 0.46). Similar patterns were obtained for the mineral soils of the tundra zone of Europe [51]. Lighter fractions possibly may have been recently formed, as well as being more susceptible to mobility in the soil profile and to degradation by microbial activity [54].
The analysis of the molecular weight distribution of HAs of hummocky bogs in the northern tundra—southern tundra ecoton zone revealed a decreasing trend for the number average molecular weight from 29.1 to 5.8 kDa along the soil profile for Plot 2-1 (Figure 6C) and Plot 2-2, except for the two lower horizons (Figure 6D). The maximum values of HA Mn (20.3–21.2 kDa) for Plot 2-2 of the lower horizons were explained by an increase in the content of paraffin fragments in the HAs and high ash content of the peat (Table 1). The lower Mn was caused by a decrease in the share of high and medium molecular fractions and an increase in the proportion of low molecular weight fraction down profiles (Table 2). Obviously, high molecular weight HA structures morphed into lower molecular weight structures in the peat matter humification process. The analysis of interconnection of HA molecular weight distribution with structural and functional parameters of HAs of Plots 2-1 and 2-2 showed that HAs from STL were represented by structures with a high content of long-chain paraffin (up to 35%) and polysaccharide fragments (up to 27%), which led to an increase of the Stokes radius of HA molecules (Figure 7). Higher peat decomposition degree down the profile, and more intensive associated humification of organic matter, caused gradual reduction of Mn. This brought about a decrease of the portion of paraffin (to 18%) and carbohydrate fragments (to 16%).

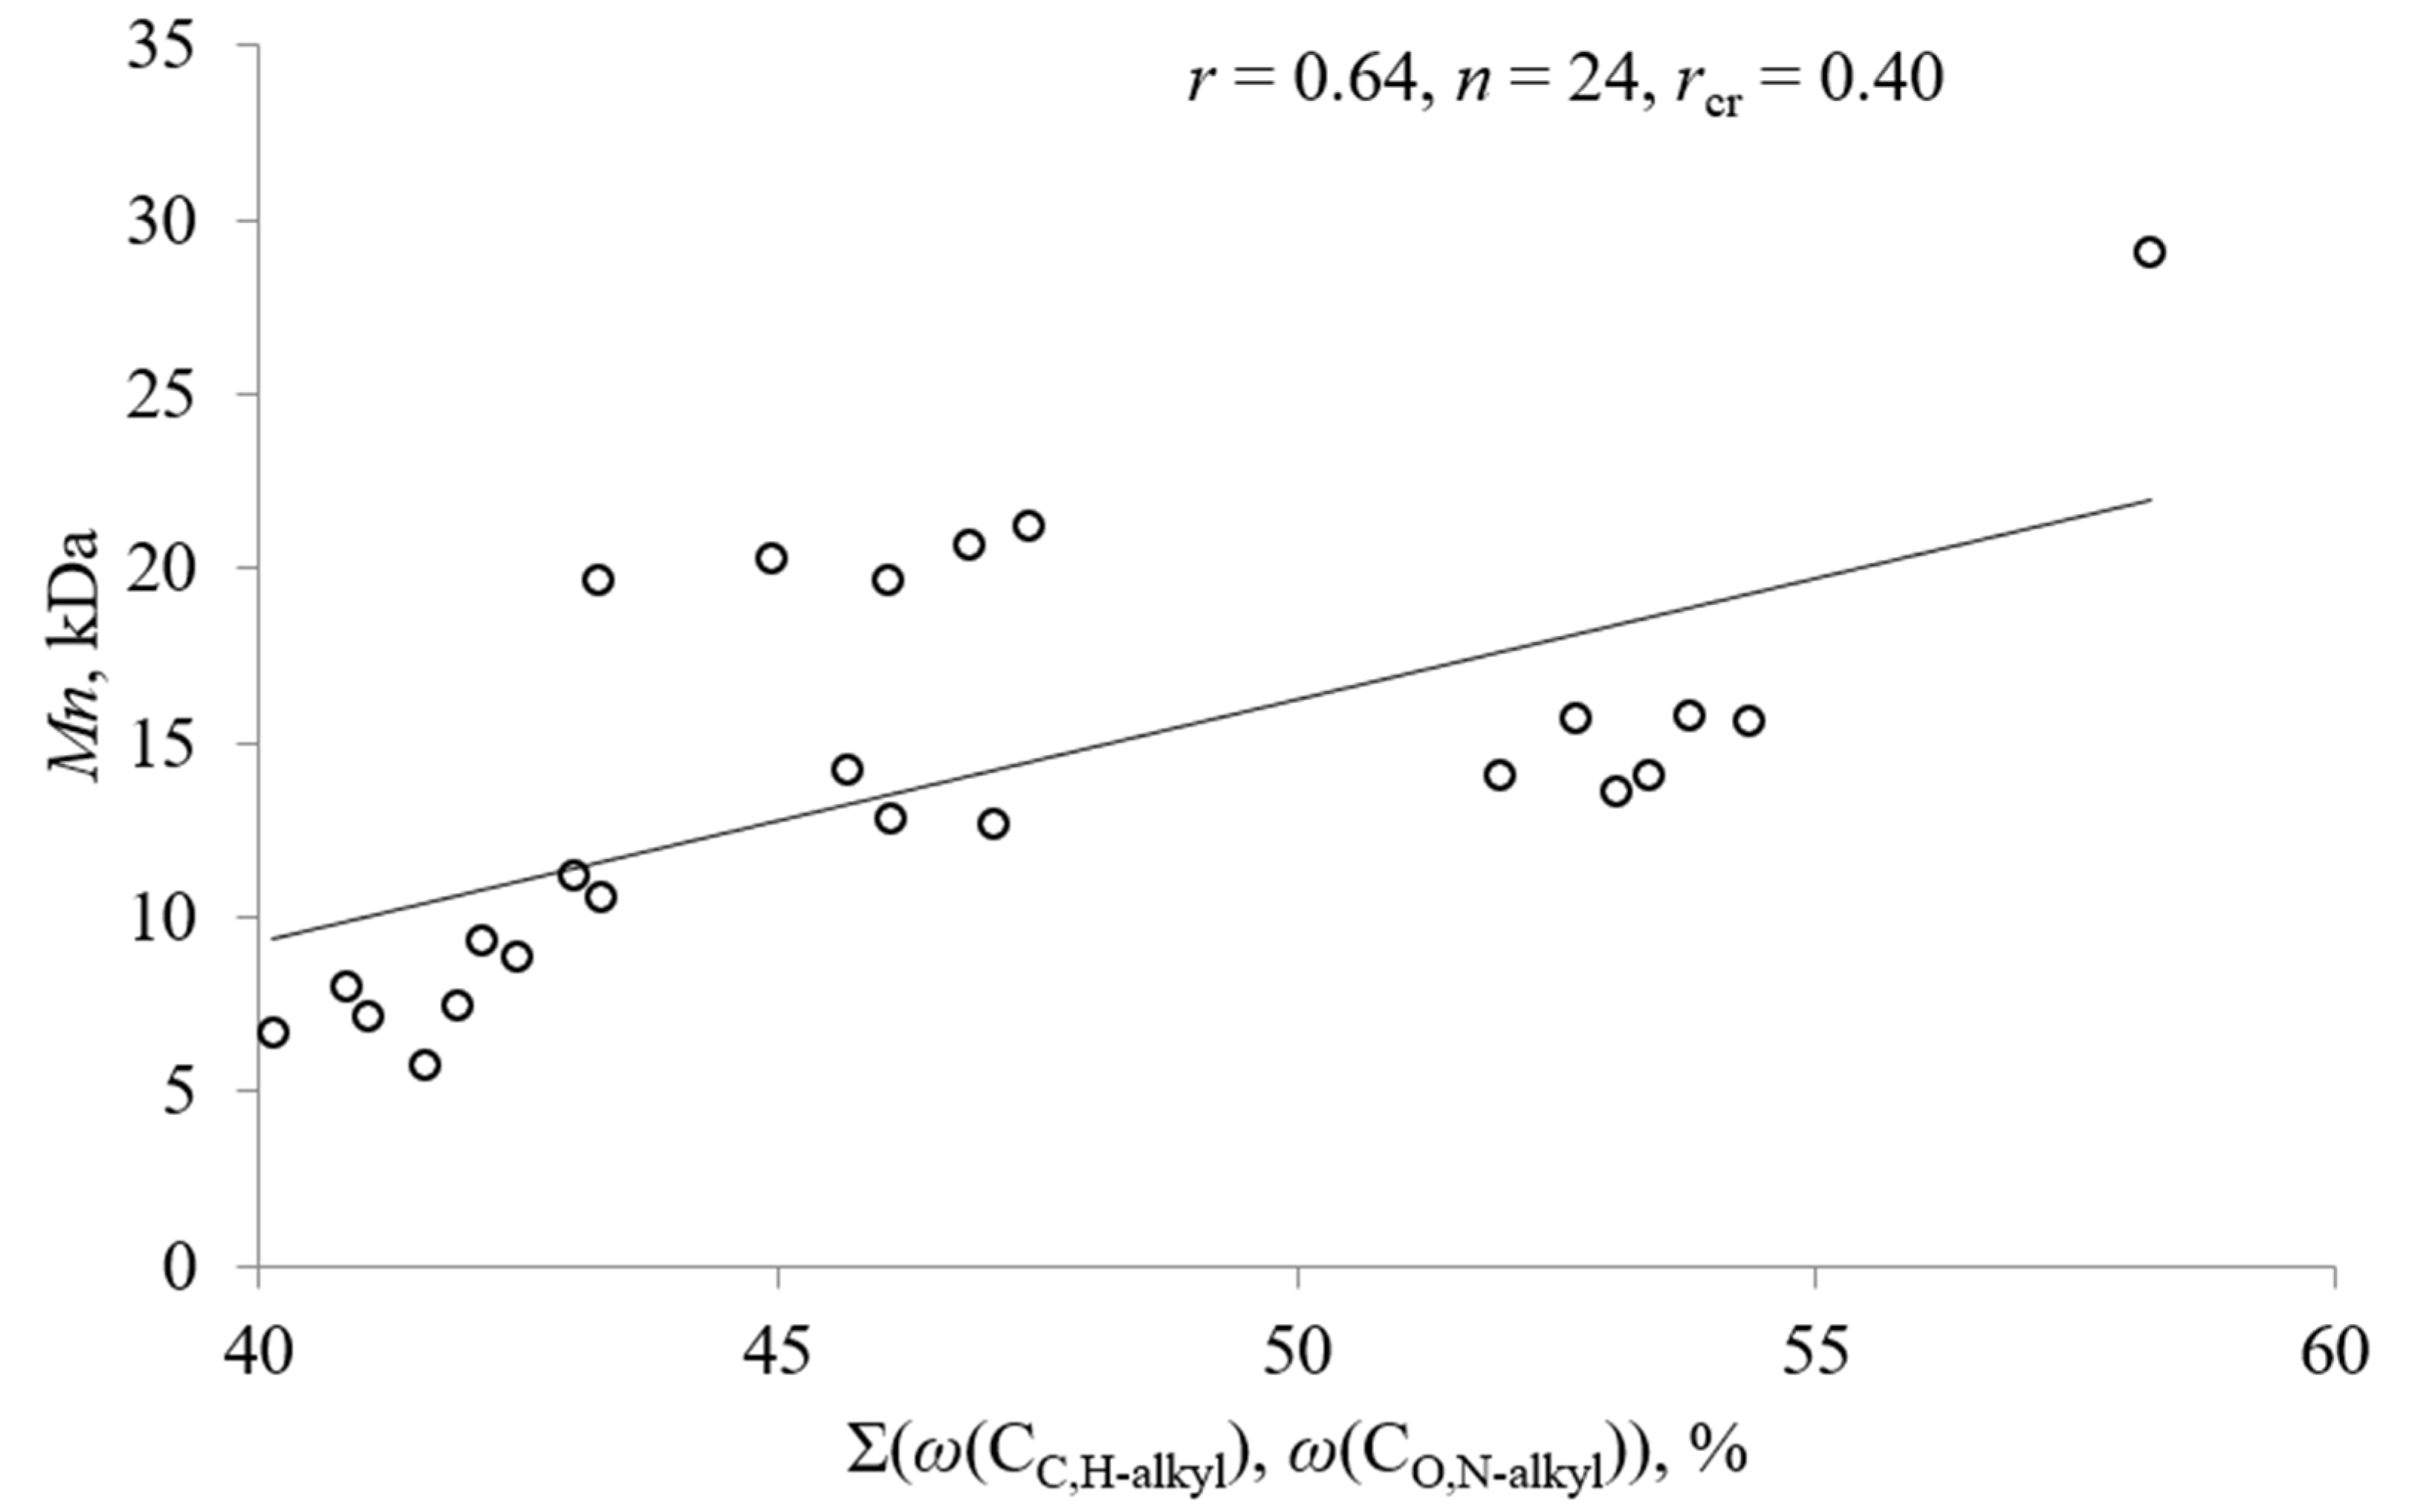
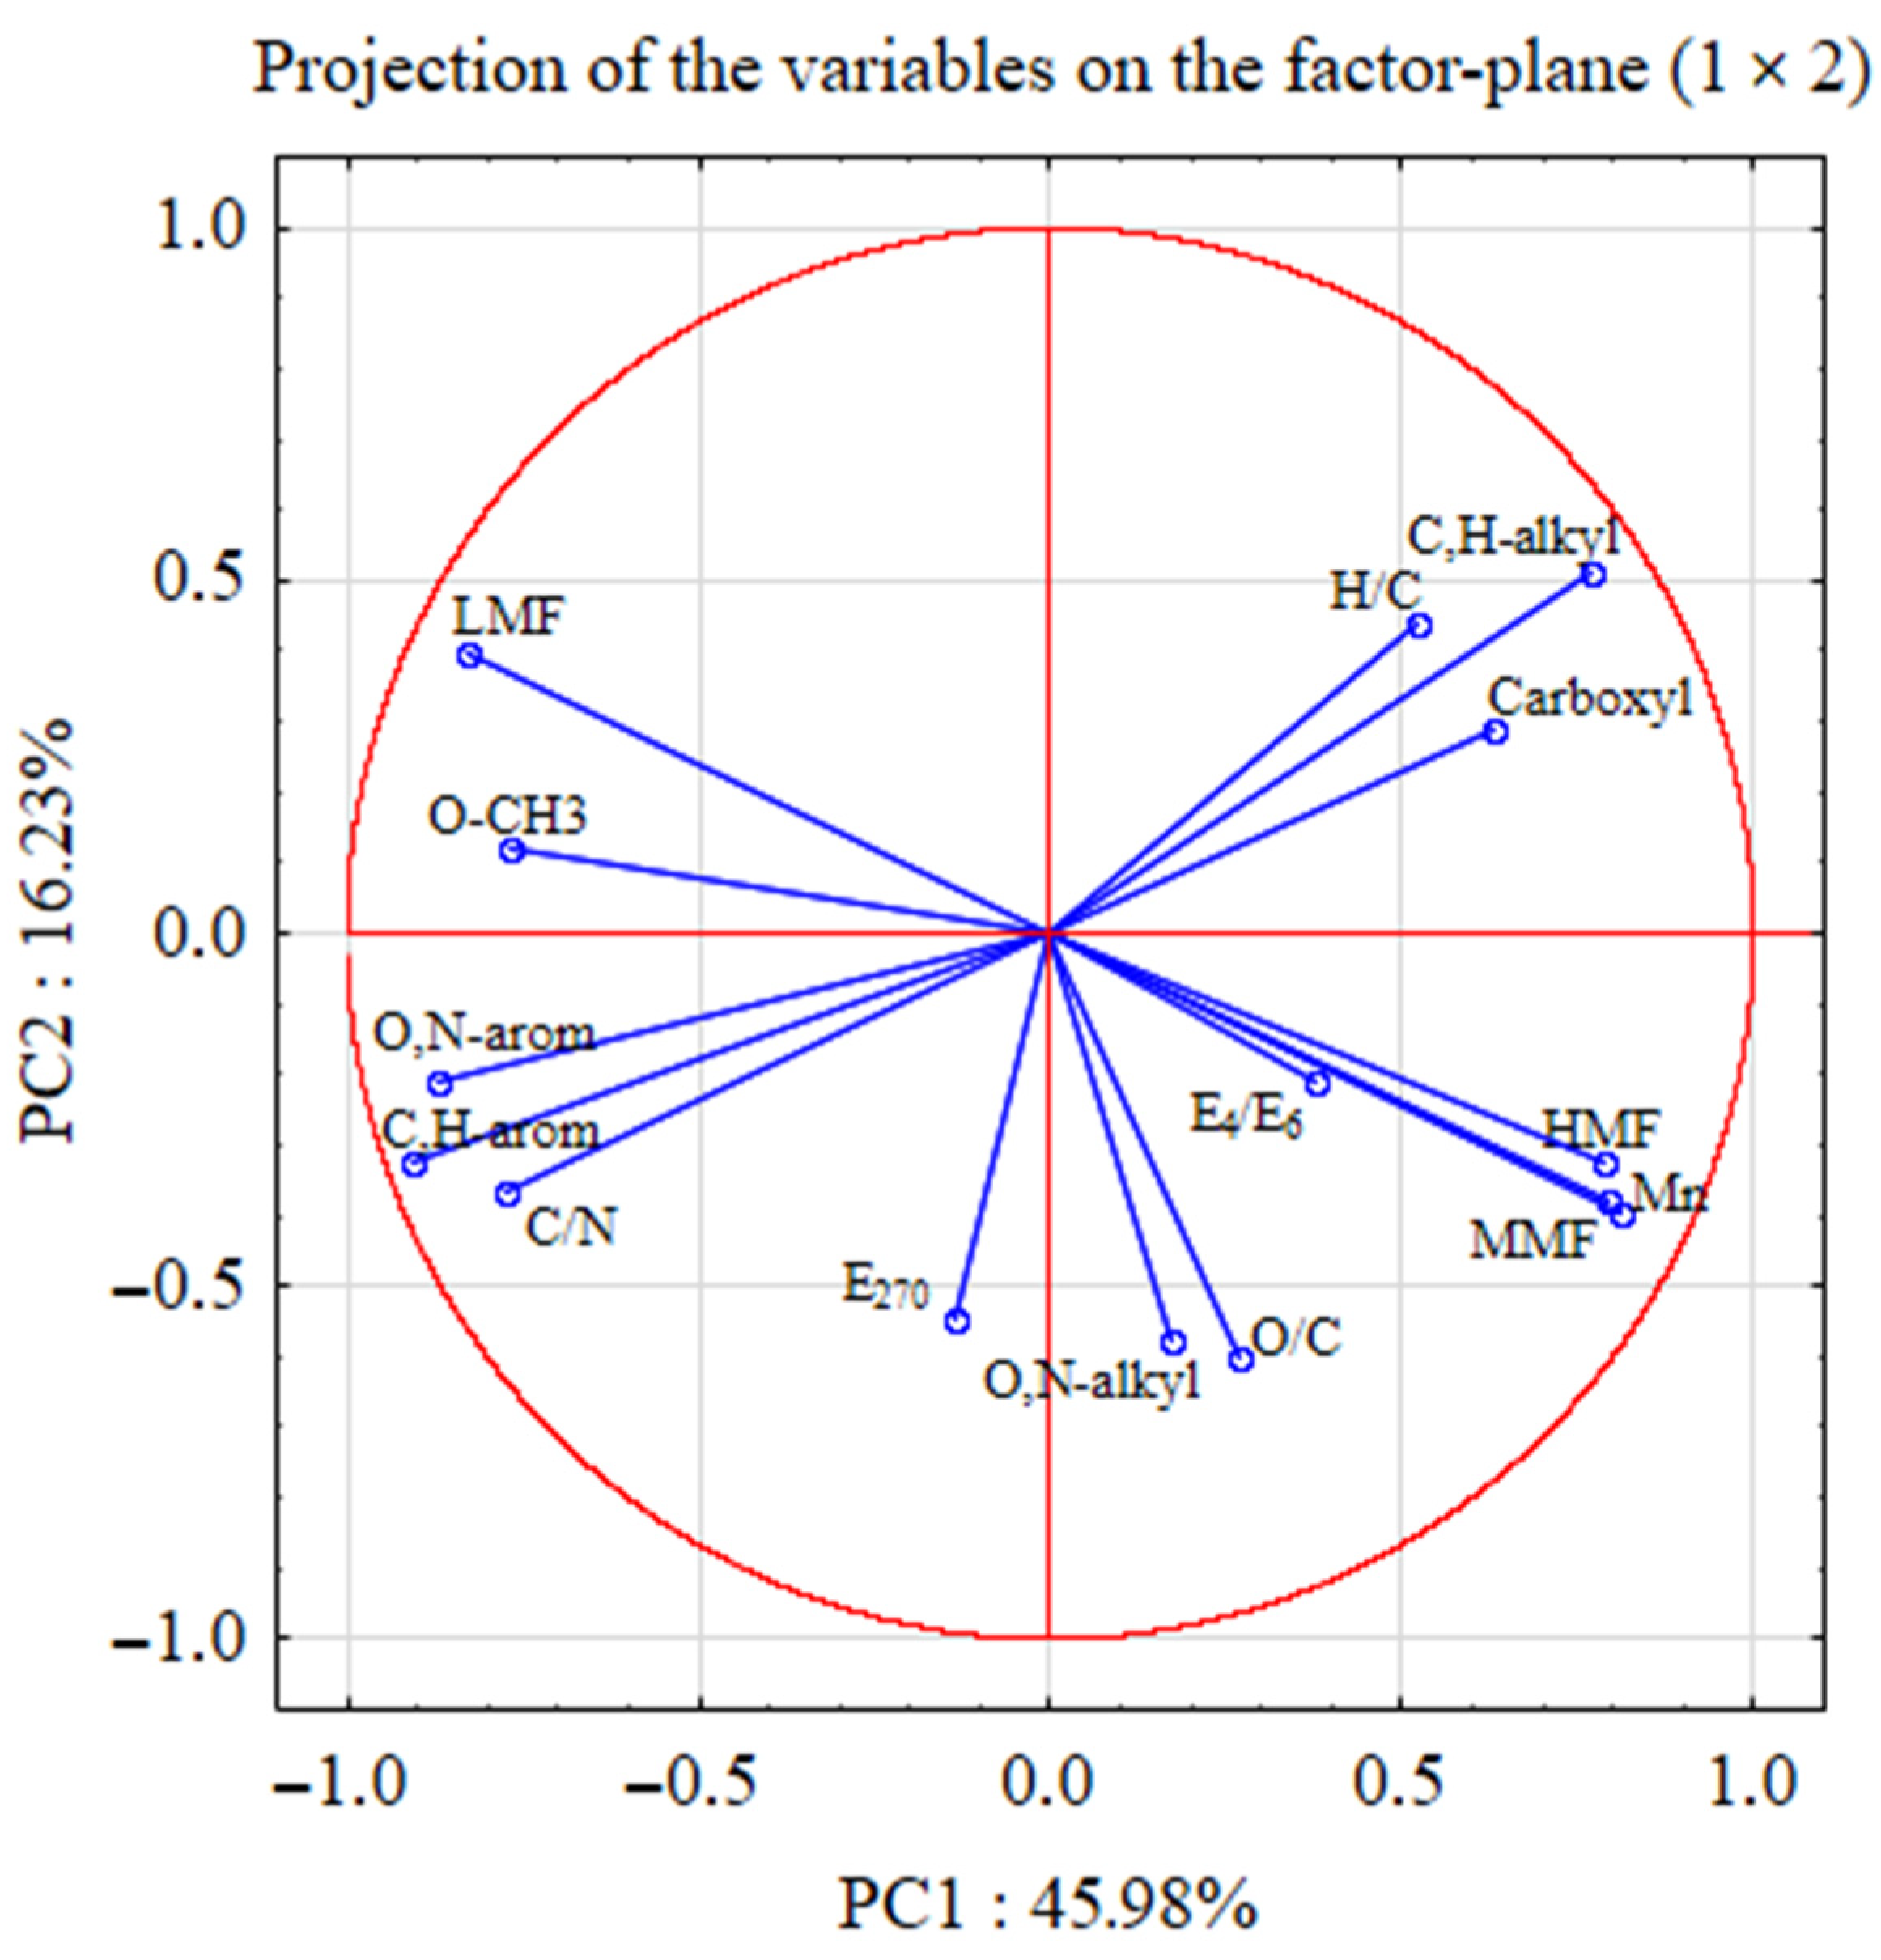
5. Statistical Analyses

The specific compositional and molecular weight distribution parameters of HAs provided by the individual physicochemical and spectroscopic assays were further subjected to statistical analysis using the PCA method. The results of the PCA explained 74.61% of the total variability of HA properties. The dimension of the 15 input variables was reduced by PCA to two principal components with eigenvalues higher than two: the first axis (PC1) explained 45.98%, and the second (PC2) 16.23% of the total variability, while the third axis (PC3) explained 12.40% (Table 3).
The PC1 was positively associated with the share of HMF, MMF, Mn, H/C, E4/E6, and the share of C,H-alkyl fragments and carboxyl groups of HAs and negatively coordinated with the share of LMF, C/N, share of O,N-arom, C,H-arom fragments and O-CH3 groups of HAs on this axis in peat soils. The PC2 was positively related to the share of LMF, H/C, share of C,H-alkyl fragments of HAs and negatively associated with the O/C, E270, share of O,N-alkyl fragments of HAs (Figure 8).
The data obtained were supported by the statistical correlation of the proportion of HMF and MMF with C,H-alkyl fragments, carboxyl groups and the x(H):x(C) molar ratio following the elemental analysis data and negative correlation with the spectral coefficients E270.
This reflected a large confinement of low condensed structures to the high and medium molecular weight fractions of HAs. Proximity of C,H-alkyl fragments to carboxyl groups at PCI bi-plot (Figure 8) indicated high probability of association of acid groups with fatty acid fragments. The spectral ratio E4/E6 gave indirect evidence of the size of HA molecules, which was reflected in the following works [43]. The statistical analysis collaterally demonstrated significant association of aromatic structures and metoxy groups with low molecular weight fraction of HAs. Adjacency of O,N-arom and C,H-arom fragments to x(C):x(N) showed that humification resulted in reduced contribution of labile nitrogen-containing fragments and increased input of condensed structures. This led to a higher share of low molecular weight fractions of HAs.
Oxygen-containing groups of HA molecules were mainly associated with the content of carbohydrate fragments, which was confirmed by the proximity of O,N-alkyl fragments and x(O):x(C) in the diagram. The PCA method demonstrated that carbohydrates were likely to be associated with the high and medium molecular weight fractions of HAs, rather than with LMF. This was supported by a significant correlation of O,N-alkyl fragments and HMF (r = 0.38, n = 42, rcr = 0.30).
The obtained results of molecular weight distribution of HAs in hummocky peatlands matched the results achieved by Trubetskoi and Trubetskaya [43], who conducted 13C-NMR analysis of gel chromatographic fractions. As a result, the authors proved that high molecular weight fractions of HAs mainly consist of long-chain aliphatic chains dominated by paraffin and carbonhydrate, amino-acid, ethanolic fragments, while low molecular weight fractions of HAs generally contain aromatic structures.

6. Conclusions

SOM of the Histosols from Cryolithozone of European Russia were investigated with the use of various instrumental methods. The data obtained (13C NMR, SEC, UV-Vis, radiocarbon data and botanical composition) revealed the main trends in the formation of HAs from Arctic peatlands under different environmental conditions. The conversion of HAs from Histosols led to an increase in the proportion of carbon in branched and short-chain paraffinic structures with their subsequent cyclization and aromatization. The results of this process were most clearly manifested in layers formed during the Holocene climatic optimum period.
Modern peat sediments (top layers) formed in the middle and late Holocene periods out of bryophyte residues contain HAs with long-chain carbohydrate and paraffin structures in their composition. These structures enlarge dynamic radii of HA molecules, thus causing high Mn values. The statistical correlation of data obtained through SEC and 13C-NMR spectroscopy indicated that high and medium molecular weight fractions of HAs mainly consist of long-chain aliphatic fragments dominated by paraffin and poly- (oligo-) saccharide fragments, and LMW fractions of HAs generally contain aromatic structures.
The climatic conditions of the Atlantic period of the Holocene determined the specific composition of HA precursors, decomposition of which led to an increase in the polydispersity index of HA molecular assemblies. Thus, the molecules of HAs are an archive of paleoclimatic records. Cryogenic processes and the destruction of the moss–lichen vegetation layer by deer herds has currently led to the degradation of the vegetation cover and the formation of bare spots. Higher biologically active temperatures of the seasonally thawed layer of soils at bare spots (without vegetation) determine the accumulation of thermodynamically more stable HA molecules with a high content of aromatic fragments. This contributes to both the stabilization of the SOM and the conservation of peatlands in general.

Author Contributions

Conceptualization, R.V. and E.L.; methodology, R.V. and E.L; software, R.V.; validation, R.V. and E.L.; formal analysis, R.V., E.L. and E.A.; investigation, R.V. and E.L; resources, R.V., E.L. and E.A.; data curation, R.V. and E.L.; writing—original draft preparation, R.V.; writing—review and editing, E.L.; visualization, R.V.; supervision, R.V.; project administration, E.L.; funding acquisition, R.V., E.L. and E.A. All authors have read and agreed to the published version of the manuscript.

Funding

The reported study was funded by the Federal budget of Russia, within the framework of the research topic of the Institute of Biology (No. 122040600023-8) and Russian Foundation for Basic research (No. 19-05-50107).

Institutional Review Board Statement

Not applicable.

Informed Consent Statement

Not applicable.

Data Availability Statement

Not applicable.

Acknowledgments

Authors are grateful to Kirill Vezhov for the analysis of HAs using size-exclusion chromatography, Research Park of Saint-Petersburg State University—Center of Chemical Analyses and Materials and Center of Magnetic Resonance Research, Scientific Park of Saint-Petersburg State University.

Conflicts of Interest

The authors declare no conflict of interest. The funders had no role in the design of the study; in the collection, analyses, or interpretation of data; in the writing of the manuscript; or in the decision to publish the results.

References

  1. Christensen, T.R.; Jonasson, S.; Callaghan, T.V.; Havstrom, M. On the potential CO2 release from tundra soils in a changing climate. Appl. Soil Ecol. 1999, 11, 127–134. [Google Scholar] [CrossRef]
  2. Zimov, S.A.; Schuur, E.A.G.; Chapin, F.S. Permafrost and the global carbon budget. Science 2006, 312, 1612–1613. [Google Scholar] [CrossRef]
  3. Schuur, E.A.; Bockheim, G.J.; Canadell, J.G.; Euskirchen, E.; Field, C.B.; Goryachkin, S.V.; Hagemann, S.; Kuhry, P.; Lafleur, P.M.; Lee, H.; et al. Vulnerability of permafrost carbon to climate change: Implications for the global carbon cycle. BioScience 2008, 58, 701–714. [Google Scholar] [CrossRef]
  4. Schuur, E.A.G.; Mcguire, A.D.; Grosse, G.; Harden, J.W.; Hayes, D.J.; Hugelius, G.; Koven, C.D.; Kuhry, P.; Lawrence, D.M.; Natali, S.M.; et al. Climate change and the permafrost carbon feedback. Nature 2015, 520, 171–179. [Google Scholar] [CrossRef] [PubMed]
  5. Klavinš, M.; Purmališ, O.; Rodinov, V. Peat humic acid properties and factors influencing their variability in a temperate bog ecosystem. Est. J. Ecol. 2013, 62, 35–52. [Google Scholar] [CrossRef]
  6. Olk, D.C.; Bloom, P.R.; Perdue, E.M.; McKnight, D.M.; Chen, Y.; Farenhorst, A.; Senesi, N.; Chin, Y.-P.; Schmitt-Kopplin, P.; Hertkorn, N.; et al. Environmental and agricultural relevance of humic fractions extracted by alkali from soils and natural waters. J. Environ. Qual. 2019, 48, 217–232. [Google Scholar] [CrossRef] [PubMed]
  7. Zeng, R.; Wei, Y.; Huang, J.; Chen, X.; Cai, C. Soil organic carbon stock and fractional distribution across central-south China. Int. Soil Water Conserv. Res. 2021, 9, 620–630. [Google Scholar] [CrossRef]
  8. Gondar, D.; Lopez, R.; Fiol, S.; Antelo, J.M.; Arce, F. Characterization and acid-base properties of fulvic and humic acids isolated from two horizons of an ombrotrophic peat bog. Geoderma 2005, 126, 367–374. [Google Scholar] [CrossRef]
  9. Swindles, G.T.; Patterson, T.R.; Roe, H.M.; Galloway, J.M. Evaluating periodicities in peat-based climate proxy records. Quat. Sci. Rev. 2012, 41, 94–103. [Google Scholar] [CrossRef]
  10. Klavinš, M.; Purmališ, O. Properties and structure of raised bog peat humic acids. J. Mol. Struct. 2013, 1050, 103–113. [Google Scholar] [CrossRef]
  11. Perminova, I.V.; Hatfield, K. Remediation chemistry of humic substances: Theory and implications for technology. In The Use of Humic Substances to Remediate Polluted Environment: From Theory to Practice; Perminova, I.V., Hatfield, K., Hertkorn, N., Eds.; Science Series IV: Earth and Environmental Sciences; Springer: Dordrecht, The Netherlands, 2005; Volume 52, pp. 3–36. [Google Scholar] [CrossRef]
  12. García, A.C.; Souza, L.G.A.; Pereira, M.G.; Castro, R.N.; García-Mina, J.M.; Zonta, E.; Lisboa, F.J.G.; Berbara, R.L.L. Structure-property-function relationship in humic substances to explain the biological activity in plants. Sci. Rep. 2016, 6, 20798. [Google Scholar] [CrossRef] [PubMed]
  13. Lee, Y.-K.; Hur, J. Using two-dimensional correlation size exclusion chromatography (2D-CoSEC) to explore the size-dependent heterogeneity of humic substances for copper binding. Environ. Pollut. 2017, 227, 490–497. [Google Scholar] [CrossRef] [PubMed]
  14. Olaetxea, M.; De Hita, D.; Garcia, A.; Fuentes, M.; Baigorri, R.; Mora, V.; Garica, M.; Urrutia, O.; Erro, J.; Zamarreño, A.M.; et al. Hypothetical framework integrating the main mechanisms involved in the promoting action of rhizospheric humic substances on plant root- and shoot growth. Appl. Soil Ecol. 2018, 123, 521–537. [Google Scholar] [CrossRef]
  15. Tan, K.H. Humic Matter in Soil and the Environment, 1st ed.; Marcel Dekker: New York, NY, USA, 2003; 495p. [Google Scholar]
  16. Zaccone, C.; Miano, T.M.; Shotyk, W. Qualitative comparison between raw peat and related humic acids in an ombrotrophic bog profile. Org. Geochem. 2007, 38, 151–160. [Google Scholar] [CrossRef]
  17. D’Orazio, V.; Senesi, N. Spectroscopic properties of humic acids isolated from the rhizosphere and bulk soil compartments and fractionated by size-exclusion chromatography. Soil Biol. Biochem. 2009, 41, 1775–1781. [Google Scholar] [CrossRef]
  18. Lodygin, E.D.; Beznosikov, V.A. The molecular structure and elemental composition of humic substances from Albeluvisols. Chem. Ecol. 2010, 26, 87–95. [Google Scholar] [CrossRef]
  19. Asakawa, D.; Iimura, I.; Kiyota, T.; Yanagi, Y.; Fujitake, N. Molecular size fractionation of soil humic acids using preparative high performance size-exclusion chromatography. J. Chromatogr. A 2011, 1218, 6448–6453. [Google Scholar] [CrossRef]
  20. Kholodov, V.A.; Konstantinov, A.I.; Kudryavtsev, A.V.; Perminova, I.V. Structure of humic acids in zonal soils from 13C NMR data. Eurasian Soil Sci. 2011, 44, 976–983. [Google Scholar] [CrossRef]
  21. Sartakov, M.P.; Komissarov, I.D.; Shundrin, L.A. The peat humic acids electronic paramagnetism research for Ob-Irtysh flood plains. Res. J. Pharm. Biol. Chem. Sci. 2015, 6, 1685–1692. [Google Scholar]
  22. Sartakov, M.P.; Novikov, A.A.; Chukhareva, N.V. Study of humic acids in various types and kinds of peats at Khantymansi autonomous area—Ygra by NMR 13C spectroscopy. Int. J. Pharm. Technol. 2016, 8, 14204–14213. [Google Scholar]
  23. Kaverin, D.A.; Pastukhov, A.V.; Lapteva, E.M.; Biasi, C.; Marushchak, M.; Martikainen, P. Morphology and properties of the soils of permafrost peatlands in the southeast of the Bol’shezemel’skaya tundra. Eurasian Soil Sci. 2016, 49, 498–511. [Google Scholar] [CrossRef]
  24. World reference base for soil resources 2014. International Soil Classification System for Naming Soils and Creating Legends for Soil Maps; FAO: Rome, Italy, 2015; 203p. [Google Scholar]
  25. Hua, Q.; Barbetti, M.; Rakowski, A.Z. Atmospheric radiocarbon for the period 1950–2010. Radiocarbon 2013, 55, 2059–2072. [Google Scholar] [CrossRef]
  26. Reimer, P.J.; Bard, E.; Bayliss, A.; Beck, J.W.; Blackwell, P.G.; Bronk, R.C.; Buck, C.E.; Cheng, H.; Edwards, R.L.; Friedrich, M.; et al. IntCal13 and Marine13 radiocarbon age calibration curves 0–50,000 years cal BP. Radiocarbon 2013, 55, 1869–1887. [Google Scholar] [CrossRef]
  27. Shishlina, N.; Sevastyanov, V.; Zazovskaya, E.; van der Plicht, J. Reservoir effect of archaeological samples from steppe bronze age cultures in southern Russia. Radiocarbon 2014, 56, 767–778. [Google Scholar] [CrossRef]
  28. Nikiforova, L.D. Dynamics of Holocene landscape zones in the northeast of the European part of the USSR. In Development of the Nature of the Territory of the USSR in the Late Pleistocene and Holocene; Nauka: Moscow, Russia, 1982; pp. 154–179. (In Russian) [Google Scholar]
  29. GOST 10650-2013; Peat. Methods for the Determination of the Disintegration Degree. Standartinform: Moscow, Russia, 2014. (In Russian)
  30. Swift, R.S. Organic matter characterization. In Methods of Soil Analysis: Part 3 Chemical Methods, 5.3; Soil Science Society of America: Madison, WI, USA, 1996; pp. 1018–1020. [Google Scholar] [CrossRef]
  31. Lodygin, E.D.; Beznosikov, V.A. The 13C NMR study of the molecular structure of humus acids from podzolic and bog-podzolic soils. Eurasian Soil Sci. 2003, 36, 967–975. [Google Scholar]
  32. Liang, B.C.; Gregorich, E.G.; Schnitzer, M.; Schulten, H.R. Characterization of water extracts of two manures and their absorption on soils. Soil Sci. Soc. Am. J. 1996, 60, 1758–1763. [Google Scholar] [CrossRef]
  33. Perminova, I.V.; Frimme, F.H.; Kudryavtsev, A.V.; Kulikova, N.A.; Abbt-Braun, G.; Hesse, S.; Petrosyan, V.S. Molecular weight characteristics of humic substances from different environments as determined by size exclusion chromatography and their statistical evaluation. Environ. Sci. Technol. 2003, 37, 2477–2485. [Google Scholar] [CrossRef]
  34. Szajdak, L.W.; Jezierski, A.; Wegner, K.; Meysner, T.; Szczepański, M. Influence of drainage on peat organic matter: Implications for development, stability and transformation. Molecules 2020, 25, 2587. [Google Scholar] [CrossRef]
  35. Routh, J.; Hugelius, G.; Kuhry, P.; Filley, T.; Tillman, P.K.; Becher, M.; Crill, P. Multi-proxy study of soil organic matter dynamics in permafrost peat deposits reveal vulnerability to climate change in the European Russian Arctic. Chem. Geol. 2014, 368, 104–117. [Google Scholar] [CrossRef]
  36. Vasilevich, R.S.; Beznosikov, V.A. Effect of climate changes in the holocene on the distribution of humic substances in the profile of forest-tundra peat mounds. Eurasian Soil Sci. 2017, 50, 1271–1282. [Google Scholar] [CrossRef]
  37. Orlov, D.S. Humic Substances of Soils and General Theory of Humification, 1st ed.; Taylor & Francis: London, UK, 1995; 325p. [Google Scholar] [CrossRef]
  38. Sire, J.; Klavins, M. Influence of the humification process on the properties of peat humic acids. Proc. Latv. Acad. Sci. Sect. B 2010, 64, 167–173. [Google Scholar] [CrossRef]
  39. Dergacheva, M.I.; Nekrasova, O.A.; Okoneshnikova, M.V.; Vasil’eva, D.I.; Gavrilov, D.A.; Ochur, K.O.; Ondar, E.E. Ratio of elements in humic acids as a source of information on the environment of soil formation. Contemp. Probl. Ecol. 2012, 5, 497–504. [Google Scholar] [CrossRef]
  40. Hugelius, G.; Routh, J.; Kuhry, P.; Crill, C. Mapping the degree of decomposition and thaw remobilization potential of soil organic matter in discontinuous permafrost terrain. J. Geophys. Res. 2012, 117, G02030. [Google Scholar] [CrossRef]
  41. Trubetskoi, O.A.; Trubetskaya, O.E. Three-dimensional fluorescence analysis of chernozem humic acids and their electrophoretic fractions. Eurasian Soil Sci. 2017, 50, 1018–1024. [Google Scholar] [CrossRef]
  42. Radmanović, S.; Nikolić, N.; Dordević, A. Humic acids optical properties of rendzina soils in diverse environmental conditions of Serbia. Arch. Tech. Sci. 2018, 18, 63–70. [Google Scholar] [CrossRef]
  43. Trubetskoi, O.A.; Trubetskaya, O.E. 13CNMR analysis of components of chernozem humic acids and their fractions with different molecular sizes and electrophoretic mobilities. Eurasian Soil Sci. 2011, 44, 281–285. [Google Scholar] [CrossRef]
  44. Ilina, S.M.; Drozdova, O.Y.; Lapitsky, S.A.; Alekhin, Y.V.; Demin, V.V.; Zavgorodnaya, Y.A.; Shirokova, L.S.; Viers, J.; Pokrovsky, O.S. Size fractionation and optical properties of dissolved organic matter in the continuum soil solution-bogriver and terminal lake of a boreal watershed. Org. Geochem. 2014, 66, 14–24. [Google Scholar] [CrossRef]
  45. Vinci, G.; Mazzei, P.; Drosos, M.; Zaccone, C.; Piccolo, A. Molecular characterization of ombrotrophic peats by humeomics. Chem. Biol. Technol. Agric. 2020, 7, 18. [Google Scholar] [CrossRef]
  46. Liu, H.; Zak, D.; Rezanezhad, F.; Lennartz, B. Soil degradation determines release of nitrous oxide and dissolved organic carbon from peatlands. Environ. Res. Lett. 2019, 14, 094009. [Google Scholar] [CrossRef]
  47. Andreicheva, L.; Marchenko-Vagapova, T.; Buravskaya, M.; Golubeva, Y. Neopleistocene and Holocene Natural Environment of European North-East of Russia, 1st ed.; GEOS: Moscow, Russia, 2015; 224p. (In Russian) [Google Scholar]
  48. Kovaleva, N.O.; Kovalev, I.V. Lignin phenols in soils as biomarkers of paleovegetation. Eurasian Soil Sci. 2015, 48, 946–958. [Google Scholar] [CrossRef]
  49. Lodygin, E.; Vasilevich, R. Environmental aspects of molecular composition of humic substances from soils of northeastern European Russia. Polish Polar Res. 2020, 41, 115–135. [Google Scholar] [CrossRef]
  50. Ricca, G.; Severini, F. Structural investigations of humic substances by IR-FT, 13C-NMR spectroscopy and comparison with a maleic oligomer of known structure. Geoderma 1993, 58, 233–244. [Google Scholar] [CrossRef]
  51. Vasilevich, R.S.; Lodygin, E.D.; Beznosikov, V.A. Molecular-mass distribution of tundra soils humic substances from the European Northeast of Russia. Biol. Commun. 2015, 4, 103–112. [Google Scholar] [CrossRef]
  52. Lodygin, E.; Vasilevich, R. Molecular-mass distribution of humic substances from Arctic soils according to size exclusion chromatography. Polish Polar Res. 2020, 41, 1–17. [Google Scholar] [CrossRef]
  53. Dmitrieva, E.D.; Leontyeva, M.M.; Siundiukova, K.V. Molecular-mass distribution of humic substances and hymatomelanic acids from different origin peats of the Tula region. Khimiya Rastitel’nogo Syr’ya 2017, 4, 187–194. [Google Scholar] [CrossRef]
  54. Piccolo, A.; Mirabella, A. Molecular weight distribution of peat humic substances extracted with different inorganic and organic solutions. Sci. Total Environ. 1987, 62, 39–46. [Google Scholar] [CrossRef]
Figure 1. Location of sampling area: Plots 1-1, 1-2 (1) and Plots 2-1, 2-2 (2).
Agronomy 12 02053 g001
Figure 2. CP/MAS 13C NMR spectra of HAs isolated from the Plot 1-1 (A), Plot 1-2 (B), Plot 2-1 (C) and Plot 2-2 (D).
Agronomy 12 02053 g002
Figure 3. Percentage of carbon in the main structural fragments (13C NMR) of HAs isolated from the Plot 1-1 (A), Plot 1-2 (B), Plot 2-1 (C) and Plot 2-2 (D).
Agronomy 12 02053 g003
Figure 4. Profile change of the branching index Kalk1 (A,C) and length index Kalk2 (B,D) of HA alkyl chains.
Agronomy 12 02053 g004
Figure 5. Typical gel chromatograms: 1—HAs from Eutric Albic Stagnic Histic Retisol (Loamic) (hor. Ehg, internal standard); 2, 3, 4—HAs from Plot 2-1 (hor. Hi 0–10 cm, hor. Hi2 30–33 cm, hor. Hif8 250–265 cm corresponding).
Agronomy 12 02053 g005
Figure 6. Number average molecular weight of the HAs from the Plot 1-1 (A), Plot 1-2 (B), Plot 2-1 (C) and Plot 2-2 (D).
Agronomy 12 02053 g006
Figure 7. The dependence of the number average molecular weight on the proportion of aliphatic fragments (13C NMR) of HAs from Plot 2-1 and Plot 2-2.
Agronomy 12 02053 g007
Figure 8. Projection of HA parameters using PCA.
Agronomy 12 02053 g008
Table 1. Properties of raw peats and HAs.
Horizon and
Depth, cm
Peat Soils CharacteristicsHA Characteristics
14C-Age
(yr BP)
Climate PeriodL2, mm/yrPeat TypeDominant Botanical SpeciesR3, %TOC, % 4Ash, %pH H2OE2700.001%E4650.001%E4/E65ΔlogK 6Molar Ratios 7
H/CO/C
Plot 1-1
Hi 0–101450 ± 70SA-20.04RaisedPolytrichum20–2547.35.43.750.2260.0296.570.801.16 ± 0.12 80.54 ± 0.11
He1 10–20n.d. 1n.d.n.dRaisedSubshrub35–4048.85.93.700.2460.0336.670.801.10 ± 0.110.55 ± 0.11
He2 20–403480 ± 70SB-20.08FenCarex, Eriophorum30–4050.04.23.740.2260.0276.830.811.07 ± 0.110.53 ± 0.11
Hef1⊥ 40–605230 ± 80AT-30.11Fen, frozenBetula sp., wood30–3534.56.44.340.2430.0296.620.811.06 ± 0.100.56 ± 0.10
Hef2⊥ 60–805680 ± 80AT-30.43Fen, frozenMenyanthes, Carex30–3543.733.14.860.2500.0307.170.850.98 ± 0.100.58 ± 0.10
Hef3⊥ 80–1005710 ± 80AT-35.71Fen, frozenBetula sp., wood, Carex35–4029.016.64.940.2100.0316.150.800.92 ± 0.090.41 ± 0.09
Hef4⊥ 100–1506130 ± 80AT-20.92Fen, frozenBetula sp., wood, Carex30–4024.947.54.950.2020.0286.240.810.90 ± 0.090.38 ± 0.09
Hef5⊥ 150–175n.d.n.d.n.dFen, frozenBetula sp., wood, Carex35–4024.354.75.370.2290.0335.960.770.94 ± 0.090.48 ± 0.10
Chfg⊥ 175–2007160 ± 80AT-10.52Fen, frozenBetula sp., Picea, wood, grass506.286.35.330.2340.0336.320.810.98 ± 0.100.49 ± 0.10
Plot 1-2
Hi 0–51310 ± 70SA-20.04RaisedPolytrichum20–2546.78.03.610.2340.0317.150.831.05 ± 0.100.52 ± 0.10
He1 5–20n.d.n.d.n.dTransitionalSubshrub, Eriophorum40–4550.74.93.420.2320.0327.910.911.01 ± 0.100.59 ± 0.10
He2 20–404720 ± 70SB-10.06FenCarex30–3549.64.63.660.2420.0327.750.890.82 ± 0.080.60 ± 0.09
Hef1⊥ 40–605270 ± 80AT-30.33Fen, frozenHypnaceous, Carex30–5047.014.14.240.2180.0336.480.820.83 ± 0.080.66 ± 0.09
Hef2⊥ 60–80n.d.n.d.n.d.Fen, frozenSubshrub, Carex35–4023.154.35.050.2370.0357.470.870.93 ± 0.090.62 ± 0.09
Hef3⊥ 80–100n.d.n.d.n.d.Fen, frozenCarex3528.344.95.000.2160.0306.510.800.93 ± 0.090.38 ± 0.09
Hef4⊥ 100–150n.d.n.d.n.d.Fen, frozenBetula sp., Picea, wood, Carex35–4024.665.15.470.2200.0306.400.800.91 ± 0.090.39 ± 0.09
Chfg1⊥
150–175
n.d.n.d.n.d.Fen, frozenBetula sp., Picea, wood, Carex40–4511.776.95.320.2250.0346.330.770.92 ± 0.090.46 ± 0.09
Chfg2⊥
175–200
n.d.n.d.n.d.Fen, frozenEquisetum, Betula sp., Picea, wood, Carex>505.188.25.510.2360.0356.350.770.92 ± 0.090.48 ± 0.09
Plot 2-1
Hi 0–10n.d.n.d.n.d.RaisedHypnaceous2046.02.63.720.1590.0236.720.831.19 ± 0.120.46 ± 0.12
He 10–201820 ± 60SA-10.07TransitionalHypnaceous3548.88.73.840.2080.0276.930.841.04 ± 0.100.45 ± 0.11
Hi1 20–30 3680 ± 70SB-20.04TransitionalSphagnum20–2550.19.23.840.2390.0306.750.820.99 ± 0.100.44 ± 0.10
Hi2 30–33 n.d.n.d.n.d.TransitionalSphagnum2047.43.73.940.2400.0298.490.950.88 ± 0.090.48 ± 0.09
Hif⊥ 33–504700 ± 80SB-10.15Transitional, frozenSphagnum2540.69.44.600.2510.0337.000.840.89 ± 0.090.48 ± 0.09
Hef1⊥ 50–70n.d.n.d.n.d.Fen, frozenCarex, Betula pubescens4047.010.35.230.2550.0336.310.820.89 ± 0.090.47 ± 0.09
Hef2⊥ 70–905620 ± 70AT-30.36Fen, frozenBetula pubescens, Carex4049.35.75.460.2370.0366.720.850.89 ± 0.090.46 ± 0.09
Hef3⊥ 90–110n.d.n.d.n.d.Fen, frozenBetula pubescens, Carex, Menyanthes4045.16.35.500.2470.0376.390.810.93 ± 0.090.48 ± 0.10
Hif1⊥ 110–1306590 ± 130AT-20.37Fen, frozenSphagnum2548.56.35.610.2330.0336.820.880.90 ± 0.090.42 ± 0.09
Hif2⊥ 130–150n.d.n.d.n.d.Fen, frozenSphagnum, Hypnaceous2550.64.15.630.2090.0296.530.910.95 ± 0.100.39 ± 0.10
Hif3⊥ 150–1706780 ± 130AT-22.55Fen, frozenSphagnum, Carex2049.54.55.520.2160.0306.460.910.94 ± 0.090.40 ± 0.09
Hif4⊥ 170–190n.d.n.d.n.d.Fen, frozenSphagnum, grass2050.03.95.510.2000.0276.240.890.93 ± 0.090.40 ± 0.09
Hif5⊥ 190–2107420 ± 120n.d.0.67Fen, frozenSphagnum, Carex2049.14.25.510.2160.0286.540.910.93 ± 0.090.40 ± 0.09
Hif6⊥ 210–230n.d.n.d.n.d.Fen, frozenSphagnum2049.64.55.540.2170.0306.400.890.92 ± 0.090.40 ± 0.09
Hif7⊥ 230–2507460 ± 130AT-1n.d.Fen, frozenHypnaceous, Menyanthes2552.54.05.730.2160.0306.520.900.96 ± 0.100.37 ± 0.10
Hif8⊥ 250–265n.d.n.d.n.d.Fen, frozenMenyanthes, Carex25–3042.622.35.310.2580.0416.550.840.87 ± 0.090.43 ± 0.09
Cfg⊥ 265–2857870 ± 90AT-10.74--n.d.0.798.15.550.3020.0506.280.760.92 ± 0.090.43 ± 0.09
Plot 2-2
Ha1 0–52070 ± 70SA-1n.d.TransitionalHypnaceous, Menyanthes,>5047.68.43.700.2130.0297.950.901.01 ± 0.100.48 ± 0.10
Ha2 5–10n.d.n.d.n.d.TransitionalHypnaceous>5047.57.73.590.2160.0298.330.930.99 ± 0.090.46 ± 0.10
He1 10–20n.d.n.d.n.d.TransitionalShrub, Eriophorum4048.37.23.630.2030.0288.140.921.06 ± 0.100.46 ± 0.11
He2 20–32n.d.n.d.n.d.TransitionalShrub, Eriophorum35–4048.17.23.680.2140.0297.270.880.99 ± 0.090.45 ± 0.10
He3 32–40n.d.n.d.n.d.FenShrub, Eriophorum, Carex35–4049.15.73.800.2550.0368.200.910.84 ± 0.080.50 ± 0.09
Hif⊥ 40–50n.d.n.d.n.d.Fen, frozenSphagnum, Carex3051.44.74.320.2460.0376.240.790.82 ± 0.080.47 ± 0.09
Hef1⊥ 50–70n.d.n.d.n.d.Fen, frozenCarex, Menyanthes3549.07.25.260.2300.0346.820.830.86 ± 0.090.46 ± 0.09
Hef2⊥ 70–90n.d.n.d.n.d.Fen, frozenHypnaceous, Carex3550.55.75.350.2400.0366.390.830.79 ± 0.080.46 ± 0.08
Hef3⊥ 90–110n.d.n.d.n.d.Fen, frozenCarex, Pinus sylvestris, Betula nana35–4048.812.45.400.2550.0396.380.780.76 ± 0.080.50 ± 0.08
Hif1⊥ 110–130n.d.n.d.n.d.Fen, frozenSphagnum, Carex20–2546.85.45.360.2270.0306.850.900.88 ± 0.090.41 ± 0.09
Hif2⊥ 130–150n.d.n.d.n.d.Fen, frozenSphagnum, Carex, wood15–2049.04.55.380.2100.0276.570.910.89 ± 0.090.39 ± 0.09
Hif3⊥ 150–170n.d.n.d.n.d.Fen, frozenSphagnum, grass2049.43.95.390.2100.0266.550.910.95 ± 0.100.38 ± 0.10
Hif4⊥ 170–190n.d.n.d.n.d.Fen, frozenSphagnum, grass2548.08.75.170.2430.0336.370.860.96 ± 0.100.40 ± 0.10
Hef⊥190–210n.d.n.d.n.d.Fen, frozenEquisetum, Pinus sylvestris35–4040.124.75.090.2610.0426.000.760.76 ± 0.080.49 ± 0.08
Chfg⊥ 210–230n.d.n.d.n.d.Fen, frozenCarexn.d.1.596.65.310.2510.0406.330.740.79 ± 0.080.49 ± 0.08
Cfg⊥ 230–240n.d.n.d.n.d.--n.d.0.698.15.50n.d.n.d.n.d.n.d.0.92 ± 0.090.38 ± 0.09
1 n.d.—not determined. 2 L—linear rate of peat accumulation. 3 R—degree of decomposition. 4 TOC—total organic carbon. 5 E4/E6 = E4650.01%/E6650.01%. 6 logK = lg(E4000.01%/E6000.01%). 7 H/C = x(H):x(C), O/C = x(O):x(C). 8 ±Δ—denotes the absolute error limits at the confidence level of 0.95.
Table 2. Apparent molecular weight distribution of the HAs.
Horizon/Depth, cmHMFMMFLMFMw/Mn
Mr 1,
kDa
SD2Molar FractionMr,
kDa
SDMolar FractionMr,
kDa
SDMolar Fraction
xSDxSDxSD
Plot 1-1
Hi 0–1041833.650.1720.20.328.20.261.190.0368.10.413.7
He1 10–2040843.00.319.70.627.20.41.190.0369.80.715.0
He2 20–40403.61.01.820.1417.60.523.070.161.100.0375.10.320.3
Hef1⊥ 40–6038951.210.0616.320.0322.770.181.180.0376.020.2421.8
Hef2⊥ 60–80391.12.90.830.0315.520.0421.390.081.260.0377.780.0823.2
Hef3⊥ 80–100367.90.30.960.0416.040.2419.200.111.050.0379.880.1524.4
Hef4⊥ 100–15037041.440.1818.00.42071.180.0479721.1
Hef5⊥ 150–175372.50.91.690.0618.730.1428.580.281.310.0369.70.315.5
Chfg⊥ 175–20037682.280.0520.20.732.90.91.450.1464.81.012.9
Plot 1-2
Hi 0–5440153.800.1120.40.527.460.221.200.0668.750.1114.0
He1 5–2040043.600.2122.00.330.010.221.270.0366.40.412.4
He2 20–4038642.70.220.30.629.050.101.270.0468.20.314.0
Hef1⊥ 40–60467.92.30.750.0314.550.2116.700.061.200.0482.560.1035.0
Hef2⊥ 60–80379.02.81.450.0817.680.2625.500.201.270.0373.040.1218.1
Hef3⊥ 80–100383.731.280.1317.40.523.80.41.180.0374.90.619.8
Hef4⊥ 100–150390.41.91.670.0917.50.325.000.171.250.0473.330.0818.8
Chfg1⊥ 150–17539052.900.1820.30.832.60.41.570.0964.510.2012.7
Chfg2⊥ 175–20036441.020.0317.20.525.050.031.240.0873.930.0417.9
Plot 2-1
Hi 0–10333.70.36.170.1024.90.930.450.201.410.0363.40.38.3
He 10–20307.50.72.90.320.50.427.920.231.460.0369.20.611.7
Hi1 20–30 30942.40.420.00.327.60.71.590.0469.91.012.1
Hi2 30–33 302.40.73.960.1423.150.0628.980.061.450.0367.060.099.8
Hif⊥ 33–5037343.610.2921.70.428.330.031.620.0368.070.2812
Hef1⊥ 50–7037053.40.321.620.1027.620.281.640.0368.980.1712.3
Hef2⊥ 70–90302.91.41.930.0718.80.419.970.061.310.0378.100.1216.3
Hef3⊥ 90–110296.42.13.720.0522.360.1129.810.031.490.0366.470.039.8
Hif1⊥ 110–130304.92.91.420.0817.040.2816.260.071.110.0482.310.1521.3
Hif2⊥ 130–15030751.430.1316.510.1618.190.031.100.0380.380.0324.7
Hif3⊥ 150–17031231.160.1316.340.0816.800.031.050.0382.040.1222.5
Hif4⊥ 170–19030970.960.1515.340.2915.480.171.010.0384.10.431.7
Hif5⊥ 190–21030531.060.0615.860.1516.60.41.010.0382.40.422.9
Hif6⊥ 210–23030981.830.1217.410.1620.70.51.090.0577.50.617.7
Hif7⊥ 230–25031251.230.2015.420.1817.60.31.110.0381.20.522.3
Hif8⊥ 250–26529740.890.0815.890.2613.830.081.160.0385.280.1624.2
Plot 2-2
Ha1 0–5306.50.72.470.0419.960.0925.590.091.300.0371.940.0713.1
Ha2 5–10306.90.32.890.0920.20.428.80.41.460.0368.30.511.6
He1 10–20303.90.32.930.0320.530.0528.540.141.450.0368.530.1411.4
He2 20–32294.90.32.550.0320.160.0327.430.081.490.0470.020.0811.7
He3 32–40278.70.42.080.0620.030.0328.860.181.620.0369.050.2410.7
Hif⊥ 40–5028132.250.2720.20.426.850.191.490.0370.90.511.5
Hef1⊥ 50–7029662.70.1920.190.0525.90.31.430.0371.40.512.2
Hef2⊥ 70–9029261.980.2118.90.422.850.111.390.0375.20.314.2
Hef3⊥ 90–110294.40.73.280.2121.50.527.640.051.550.0469.080.2610.7
Hif1⊥ 110–13030491.550.1017.440.0419.050.241.180.0379.400.1418.5
Hif2⊥ 130–150294.91.41.620.0617.640.1722.610.171.180.0375.80.315.8
Hif3⊥ 150–170303.40.71.440.0318.770.1321.580.071.160.0383.70.515.9
Hif4⊥ 170–19030861.380.1316.40.1517.90.81.240.0480.80.920.3
Hef⊥ 190–210294.91.44.190.1122.20.330.720.101.690.0465.090.209.2
Chfg⊥ 210–230271.42.640.523.90.637.650.261.990.0358.30.87.1
1 Mr—median values of molecular weights. 2 SD—standard deviation.
Table 3. Analysis of principal components for HA parameters.
Principal ComponentsEigenvalues% of Total VarianceCumulative
Eigenvalues
Cumulative % of Variance
PC 16.9045.986.9045.98
PC 22.4316.239.3362.21
PC 31.8612.4011.1974.61
PC 41.399.2812.5883.89
Publisher’s Note: MDPI stays neutral with regard to jurisdictional claims in published maps and institutional affiliations.

