Article

Yield Potential of Machine-Transplanted Rice and Correlation of Crop-Growing Rate during Grain-Filling Stage

1
Institute of Food Crops, Jiangsu Academy of Agricultural Sciences, Nanjing 210014, China
2
Jiangsu Collaborative Innovation Center for Modern Crop Production, National Engineering and Technology Center for Information Agricultrue, Key Laboratory of Crop Physiology and Ecology in Southern China, Nanjing Agricultural University, Nanjing 210095, China
*
Authors to whom correspondence should be addressed.
Submission received: 31 August 2022 / Revised: 17 September 2022 / Accepted: 22 September 2022 / Published: 25 September 2022
(This article belongs to the Special Issue Crop Yield and Quality Response to Cultivation Practices)

Abstract

:
Not enough attention has been paid to the comparison in yield performance and N responsiveness between hybrid rice and inbred rice using the large number of new cultivars released after 2000 under machine transplanting. Field experiments were conducted in 2017 and 2018; 48 widely planted rice cultivars included four groups, namely indica hybrids (IHs), japonica inbreds (JIs), indica-japonica hybrids (IJHs), and indica inbreds (IIs) that were transplanted by machine with three nitrogen fertilizer levels (0, 150, 300 kg ha−1). The average yield of the hybrids (IHs, IJHs) was higher than that of JIs or IIs with a higher crop-growing rate (CGR) during the total growth duration, regardless of the N application level; moreover, longer total growth duration was responsible for the higher yield in IJHs than in IHs. The IHs had a large gap yield which mainly came from the genetic improvement in the CGR during the grain-filling stage. The yield gap was relatively small in JIs, and longer growth duration combined with optimal daily mean temperature during the grain-filling stage was the critical factor for high yield. The JIs or IJHs had higher yield under the N300 level, while the response of IHs to nitrogen varied with different cultivars. Cultivars with higher CGR during the grain-filling stage had higher yield under the N300 level. In conclusion, this study suggests that high CGR during the grain-filling stage may be a vital trait for the development of rice with high yield and high N responsiveness at machine transplanting.

1. Introduction

Faced with a continuous increase in food demand, intensive cropping systems have been extensively developed in China [1]. The rice–wheat rotation system (single-season rice in rotation with wheat) is the major intensive rice-based cropping system in the middle-lower reaches of the Yangtze River [2,3,4,5]. With long-term studies and practices, cconsiderable progress in high-yield rice cultivation techniques has been made in the rice–wheat rotation system [6,7,8]. However, rice establishment methods have recently changed from manual transplanting to machine transplanting with less labor required [9,10]. The shift can shorten the rice-growth duration in the rice–wheat rotation system [11,12]. For manual transplanting, rice seedlings are usually transplanted at a seeding age (days from sowing to transplanting) of 25–35 days to allow longer crop-growth duration and thus higher yields in the rice–wheat rotation system. However, compared to manual transplanting, the rice seedlings transplanted by machine postpone the sowing date by 15–20 days, which leads to the delay of the growth process. Thus, the later growth stage of machine transplanted rice is more prone to cold damage [13,14,15].
Over the past three decades, high-yielding varieties are constantly bred through the old and bringing forth new ones in China [16,17,18,19,20,21]. According to the official report, the number of super rice cultivars confirmed by China’s Ministry of Agriculture (www.ricedata.cn) from 2005 to 2019 was one hundred, thirty-two, including twenty-eight Japonica inbreds (JIs), eight indica-japonica hybrids (IJHs), eight indica inbreds (IIs), and eighty-eight indica hybrids (IHs).
Numerous studies compared the yield formation among different rice cultivars by selecting typical cultivars in their corresponding ecological regions under manual transplanting. Nowadays, it is generally accepted that the yield of IJHs are higher than that of IHs or JIs at many locations [22,23,24], and the yield superiority of IJHs over IHs or JIs is mainly attributed to larger sink capacity [23], greater leaf area, and higher leaf area duration [25], as well as higher nutrient uptake [23,24]. Higher yield had also been observed for IHs than IIs with high grain weight and total biomass across many locations [26]. The difference between IHs and JIs varied by site and variety [27,28,29,30].
A holistic and intensive analysis of world rice improvement efforts reveals that the grain yield improvement of rice had also been achieved by urea nitrogen fertilizer application and by the development of high N responsive rice cultivars [31,32,33,34]. Many studies have generally observed that japonica rice needs more N input than indica rice to fulfil its yield potential [32,35]. Meng et al. [36] also suggested that the highest grain yield was achieved under 225.0–262.5 kg ha−1 nitrogen application for IHs, 300.0 kg ha−1 for JIs, and 262.5–300.0 kg ha−1 for IJHs. Moreover, the adoption of modern rice cultivars increased the response of the grain yield to N input [37].
Only a few cultivars were selected in previous studies, and systematic research on the new varieties bred after 2000 are especially lacking. Most of the previous conclusions were reached under manual transplanting; however, with the change of planting pattern, it is not known whether these new cultivars bred in manual transplanting are suitable for machine planting in the rice–wheat rotation system and whether the characteristics of high-yield varieties under machine-transplanting conditions are consistent with those under manual transplanting. Additionally, the difference in yield response to nitrogen of different varieties under machine transplanting has not been systematically investigated.
Therefore, the objectives of the present study were to: (1) compare the yield differences among different groups of rice under three nitrogen levels with the machine-transplanting method; (2) identify the agronomic traits responsible for the difference in responsiveness of yield to nitrogen application among different varieties.

2. Materials and Methods

2.1. Experimental Sites

The field experiments were conducted at Danyang County, Jiangsu Province, China (32°00′ N, 119°32′ E) in 2017 and 2018. This region is in a subtropical humid climatic zone in the middle and lower reaches of the Yangtze River. The rice production field in this region was in a rice–wheat rotation system. The soil type was clay loam, and the soil test was based on samples taken from the upper 20 cm of the soil before irrigation. The average values of soil properties across seasons and years were as follows: total nitrogen 1.12 g kg−1, total phosphorus 0.47 g kg−1, total potassium 1.98 g kg−1, rapidly available nitrogen of 85.40 mg kg−1, available phosphorus of 13.33 mg kg−1, available potassium of 119.41 mg kg−1, organic matter of 21.09 g kg−1, and pH of 6.3. The climate data regarding the daily radiation and air temperatures were measured at a meteorological station located within 3 km of the experimental site. The daily solar radiation and temperature were measured using a silicon pyranometer (LI-200, LI−COR Inc., Lincoln, NE, USA) and a temperature/RH probe (HMP45C, Vaisala Inc., Helsinki, Finland), respectively. The meteorological data of the two rice-growing seasons are shown in Figure 1.

2.2. Experimental Cultivars

The four groups of rice include two indica-japonica hybrids (IJHs), twenty-two indica hybrids (IHs), twenty-two japonica inbreds (JIs), and two indica inbreds (IIs) which have primarily been applied to the middle and lower reaches of the Yangtze River during the previous 20 years. Data of all the varieties were approved by the China Rice Data Center (https://www.ricedata.cn/variety/) and are presented in Table 1.

2.3. Experimental Design

A split plot design was arranged with N treatments as the main plots and rice varieties as the subplots with three replications and a subplot size of 45 m2. The average nitrogen input was 300 kg ha−1 for the high-yield area of the middle and lower reaches of the Yangtze River. Therefore, three nitrogen levels (N0, 0 kg ha−1; N150, 150 kg ha−1; and N300, 300 kg ha−1) were applied as urea (46.5% N content) in a three split: 40% at the basal, 30% at seven days after transplanting, and 30% at panicle initiation stage. The K and P fertilizer management was the same in both years. Phosphorus (120 kg ha−1 as single superphosphate) was applied one day before transplanting, and potassium (120 kg ha−1 as KCl) was split and applied equally at the basal and panicle initiation stages. Seeds were raised in the seedbed with a sowing date on May 31, and seedlings were transplanted by machine on June 16. The hill spacing for the JIs was 12 cm × 30 cm and 17 cm × 30 cm for the IHs and IJHs. A rice transplanter (PZ640, Iseki Agricultural Machinery Co., Ltd., Matsuyama, Japan) was used. The main plot and different types of rice were isolated by ridges and covered with plastic film to ensure separate drainage and irrigation in each main plot. Water, weeds, insects, and diseases were controlled as required to avoid yield loss. The same management practices were applied on the same date in each year.

2.4. Observations and Measurements

The dates of sowing, heading, and maturity were recorded to determine the growth duration. Heading was the date when 85% of the stems in a plot started anthesis. Maturity was the date when 95% of the grains turned yellow in color.
At heading and maturity, five representative hills in each plot were sampled for the growth analysis. After recording the plant height and the numbers of stems (main stems plus tillers) and panicles (when presented), the plant samples were separated into leaves, stems, and panicles. The dry weights of all the plant parts were determined after oven drying at 80 °C to a constant weight, and then the aboveground biomass was calculated. The crop-growing rate (CGR) was calculated using the following equation:
CGR = (biomass2 − biomass1)/(t2 − t1)
where biomass1 and biomass2 are the above-ground total dry weights at times, t1 and t2, respectively.
At maturity, all the plants within an area of 9 m2 in each plot were reaped using a mini half-feeding combine (Crawler Feeding, Qufu Dexin Agricultural Machinery Co., Ltd., Shandong, China) to determine the actual yield, adjusted to 13.5% and 14.5% moisture contents for the Indica and Japonica rice, respectively. Panicle number was recorded from 100 hills in the harvest area. Five representative hills were sampled to determine yield components. Panicles were hand-threshed, and the filled spikelets were separated by submergence in tap water. The filled spikelets were then oven-dried at 80 °C to stabilize the mass to determine the grain weight. The spikelets panicle−1, grain-filling percentage (100× filled spikelets number/total spikelets number), and harvest index (100× filled spikelet weight/total biomass at maturity) were calculated.

2.5. Statistics Analyses

The tables and figures were processed with Microsoft Excel 2016 (Microsoft, Redmond, WA, USA) or Origin 2019b (OriginLab, Northampton, MA, USA). Variance analyses of the variety, nitrogen rate, year, and their interactive effects were performed using SPSS 18.0 for Windows (SPSS, Inc., Chicago, IL, USA). The means of the treatments were compared using the LSD test at the 0.05 and 0.01 levels.

3. Results

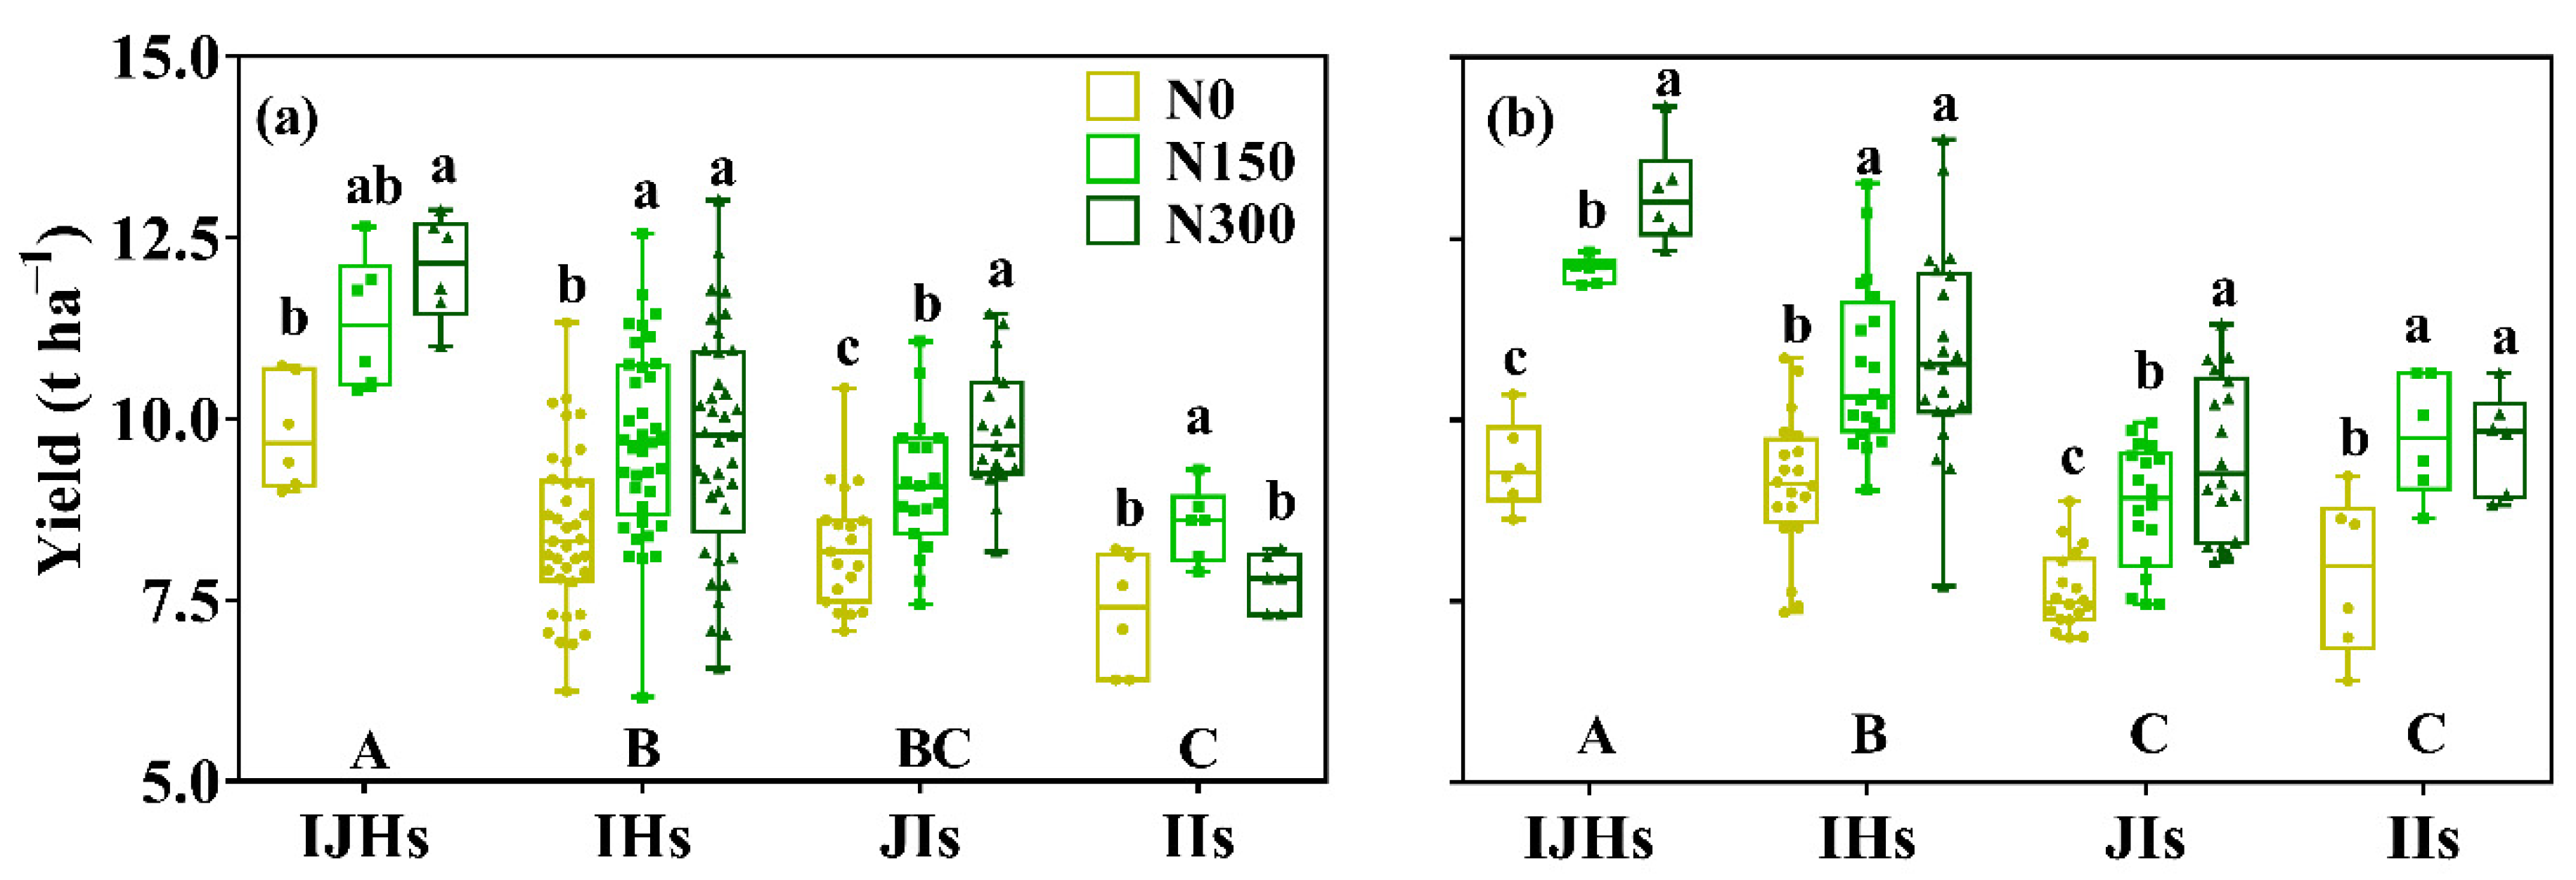
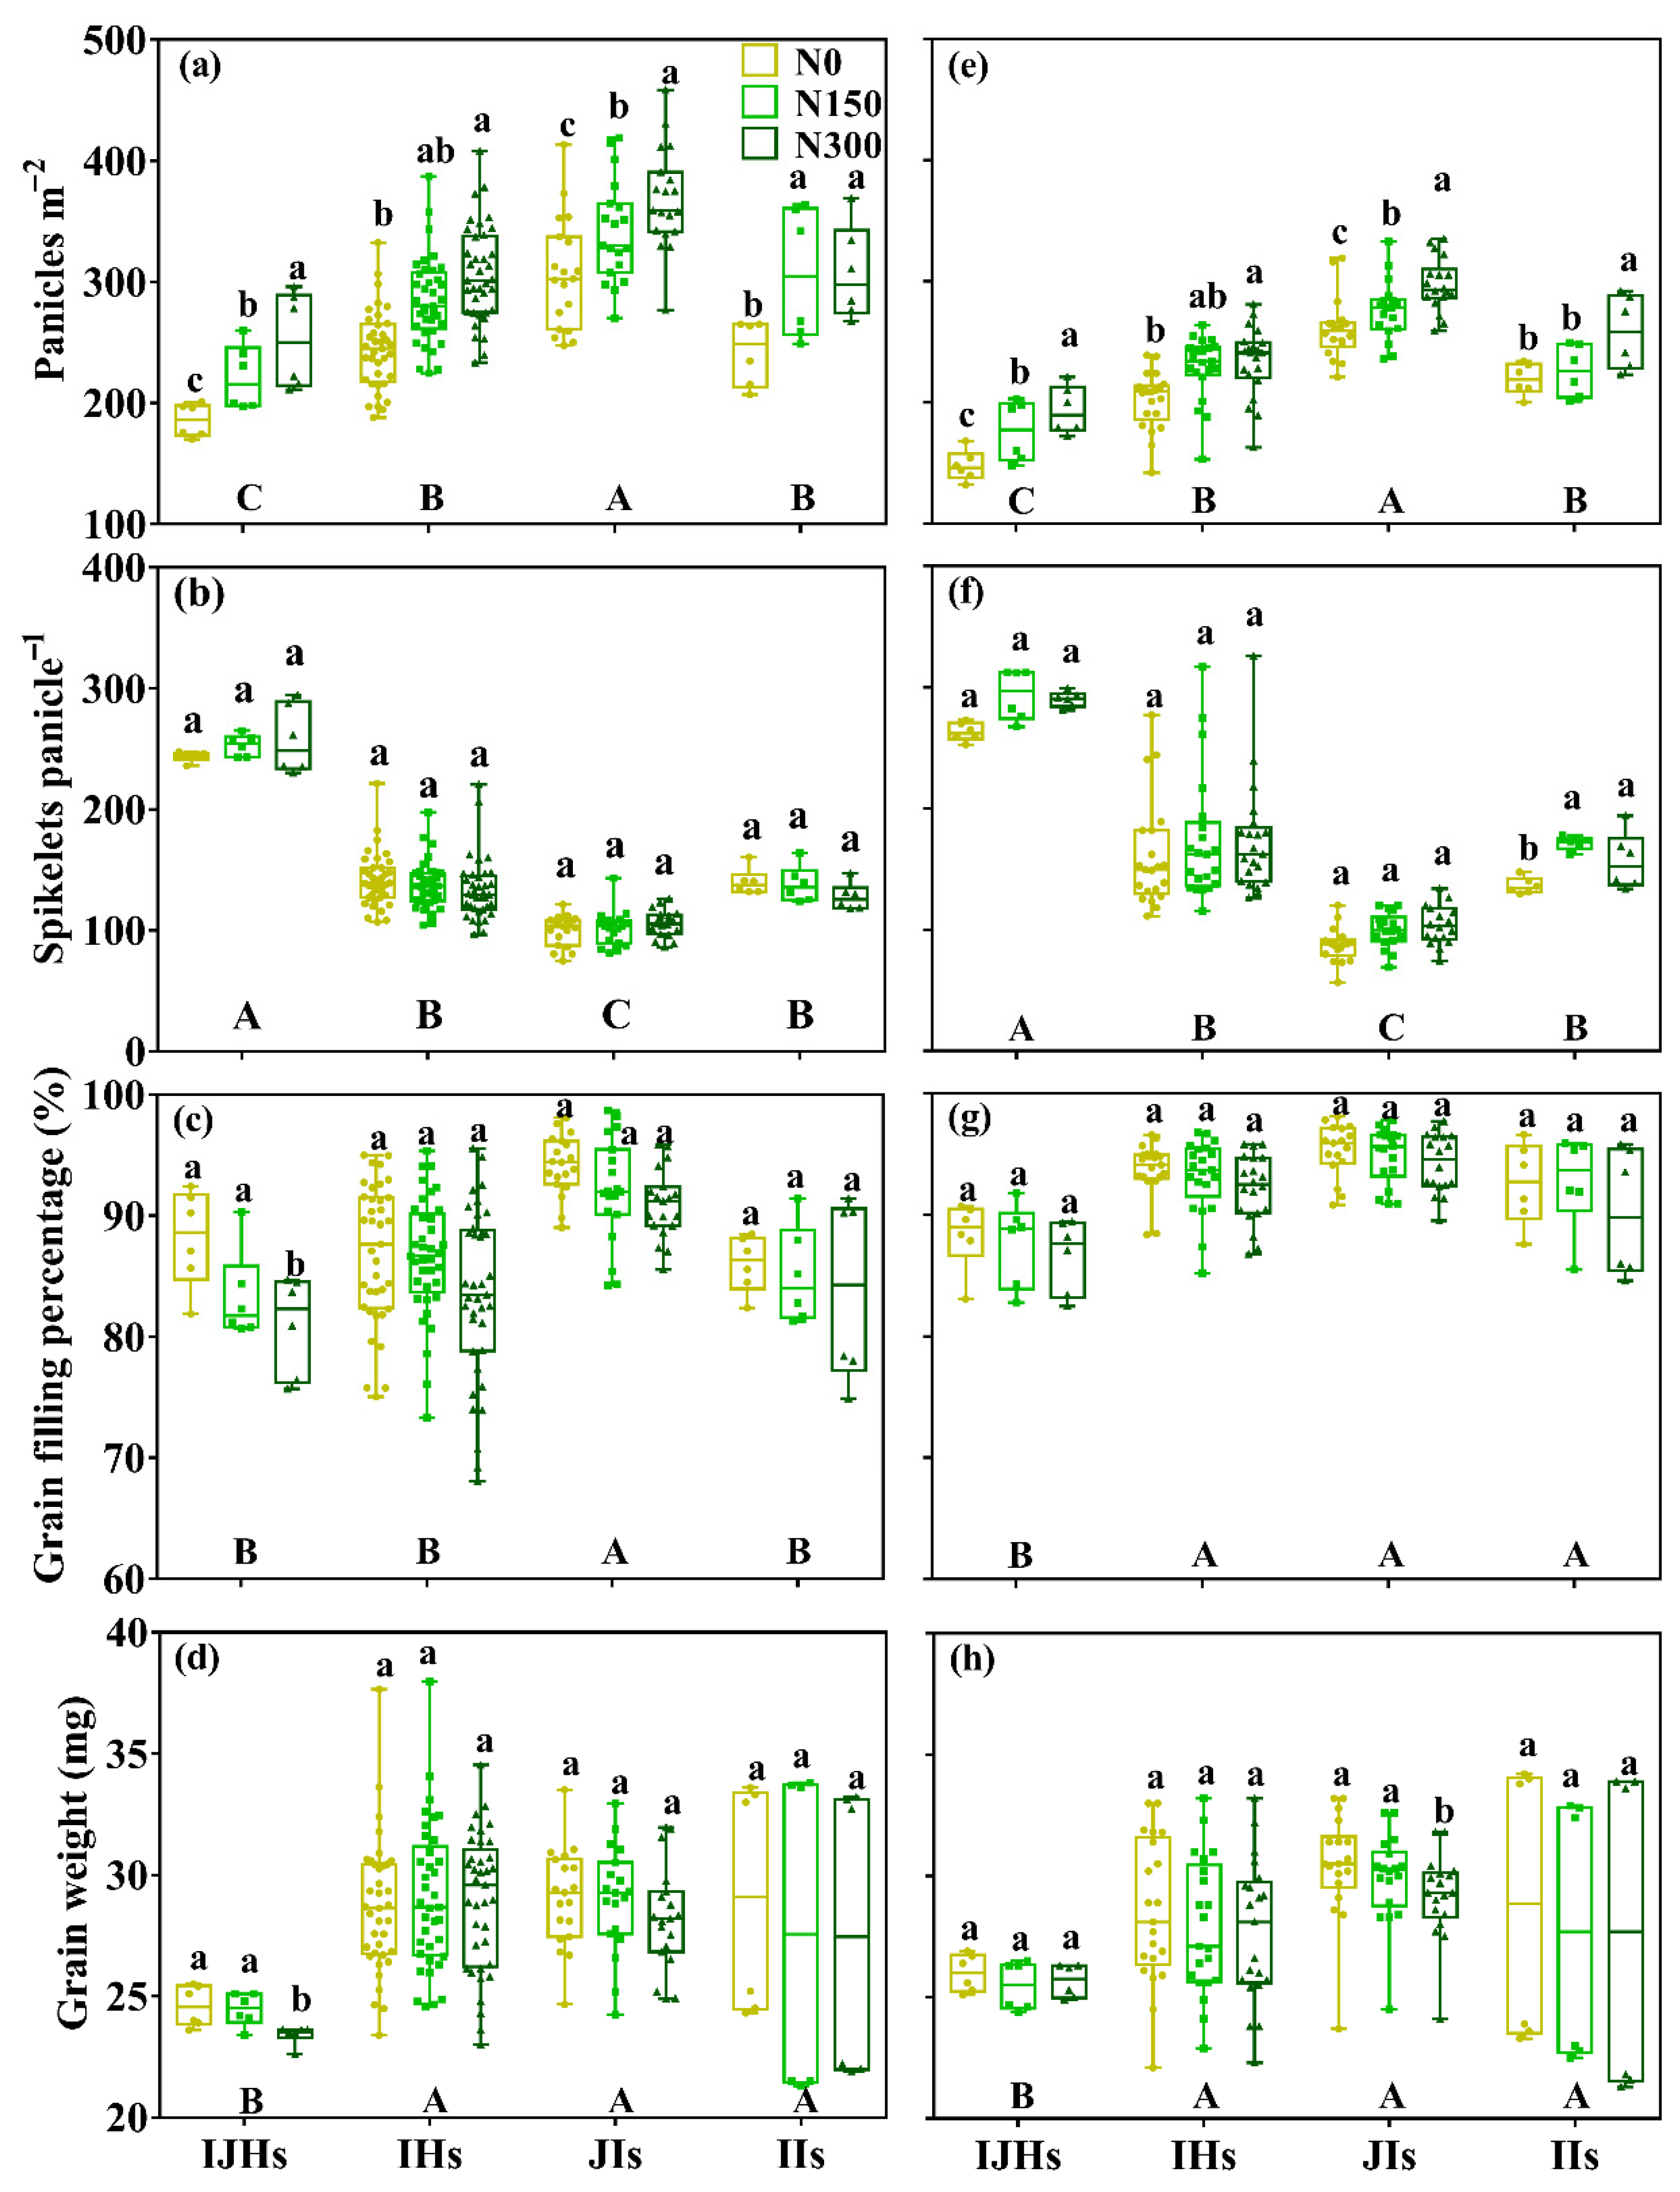
3.1. Yield and Its Components

The average yield across the three N treatments among the different rice groups exhibited a significant difference (Figure 2). The IJHs had 9.6%, 16.4%, and 19.4% higher yield than IHs, JIs, and IIs in 2017, and 17.2%, 32.7%, and 22.4% higher in 2018, respectively. Considerable variation in the yield was observed among cultivars in each group, especially for IHs, which ranged from 6.2 to 13.7 t ha−1 and from 7.4 to 13.1 t ha−1 in 2017 and 2018, respectively.
There was a significant interaction between the groups and nitrogen fertilizers in yield (Table 2 and Figur 2). The IIs exhibited a significant increase in yield at the N150 level in comparison with the N0 level, further increases in the N level did not result in higher yield and even reduced yield significantly in 2017. All cultivars of the JIs and IJHs exhibited constant increases in yield as the amounts of nitrogen application increased, while different cultivars of the IHs had large differences in response to nitrogen (Table 3 and Figure 2).
In terms of yield components (Figure 3), the panicles m2 were as follows: JIs > His > IJHs. The spikelets panicle−1 were as follows: IJHs > His > IIs or JIs, which was consistent with the difference in yield. The difference in grain-filling percentage among types during the two years were consistent In 2017, the grain-filling percentage of the JIs was significantly higher than other groups, and no significant difference was observed among IHs, JIs and IIs in 2018. Grain weight was relatively stable among groups; IJHs showed the lowest among the rice groups in both years. All yield components showed considerable variation among cultivars in each group of rice; the IHs especially exhibited a relatively large variation in spikelets panicle−1, grain-filling percentage, and grain weight compared to other groups in both years.
Nitrogen fertilizers generally increased panicles m2 and had no significant impact on the spikelets panicle−1 for all rice types in both years. Except for the grain-filling percentage of the IJHs decreasing significantly at a high-nitrogen level in 2017, the differences in the grain-filling percentages of other rice groups among nitrogen fertilizer treatments were not significant in both years. The JIs exhibited a significant decrease in the grain weight under high-nitrogen level in 2018; the grain weight of other rice groups was relatively stable across three nitrogen treatments.

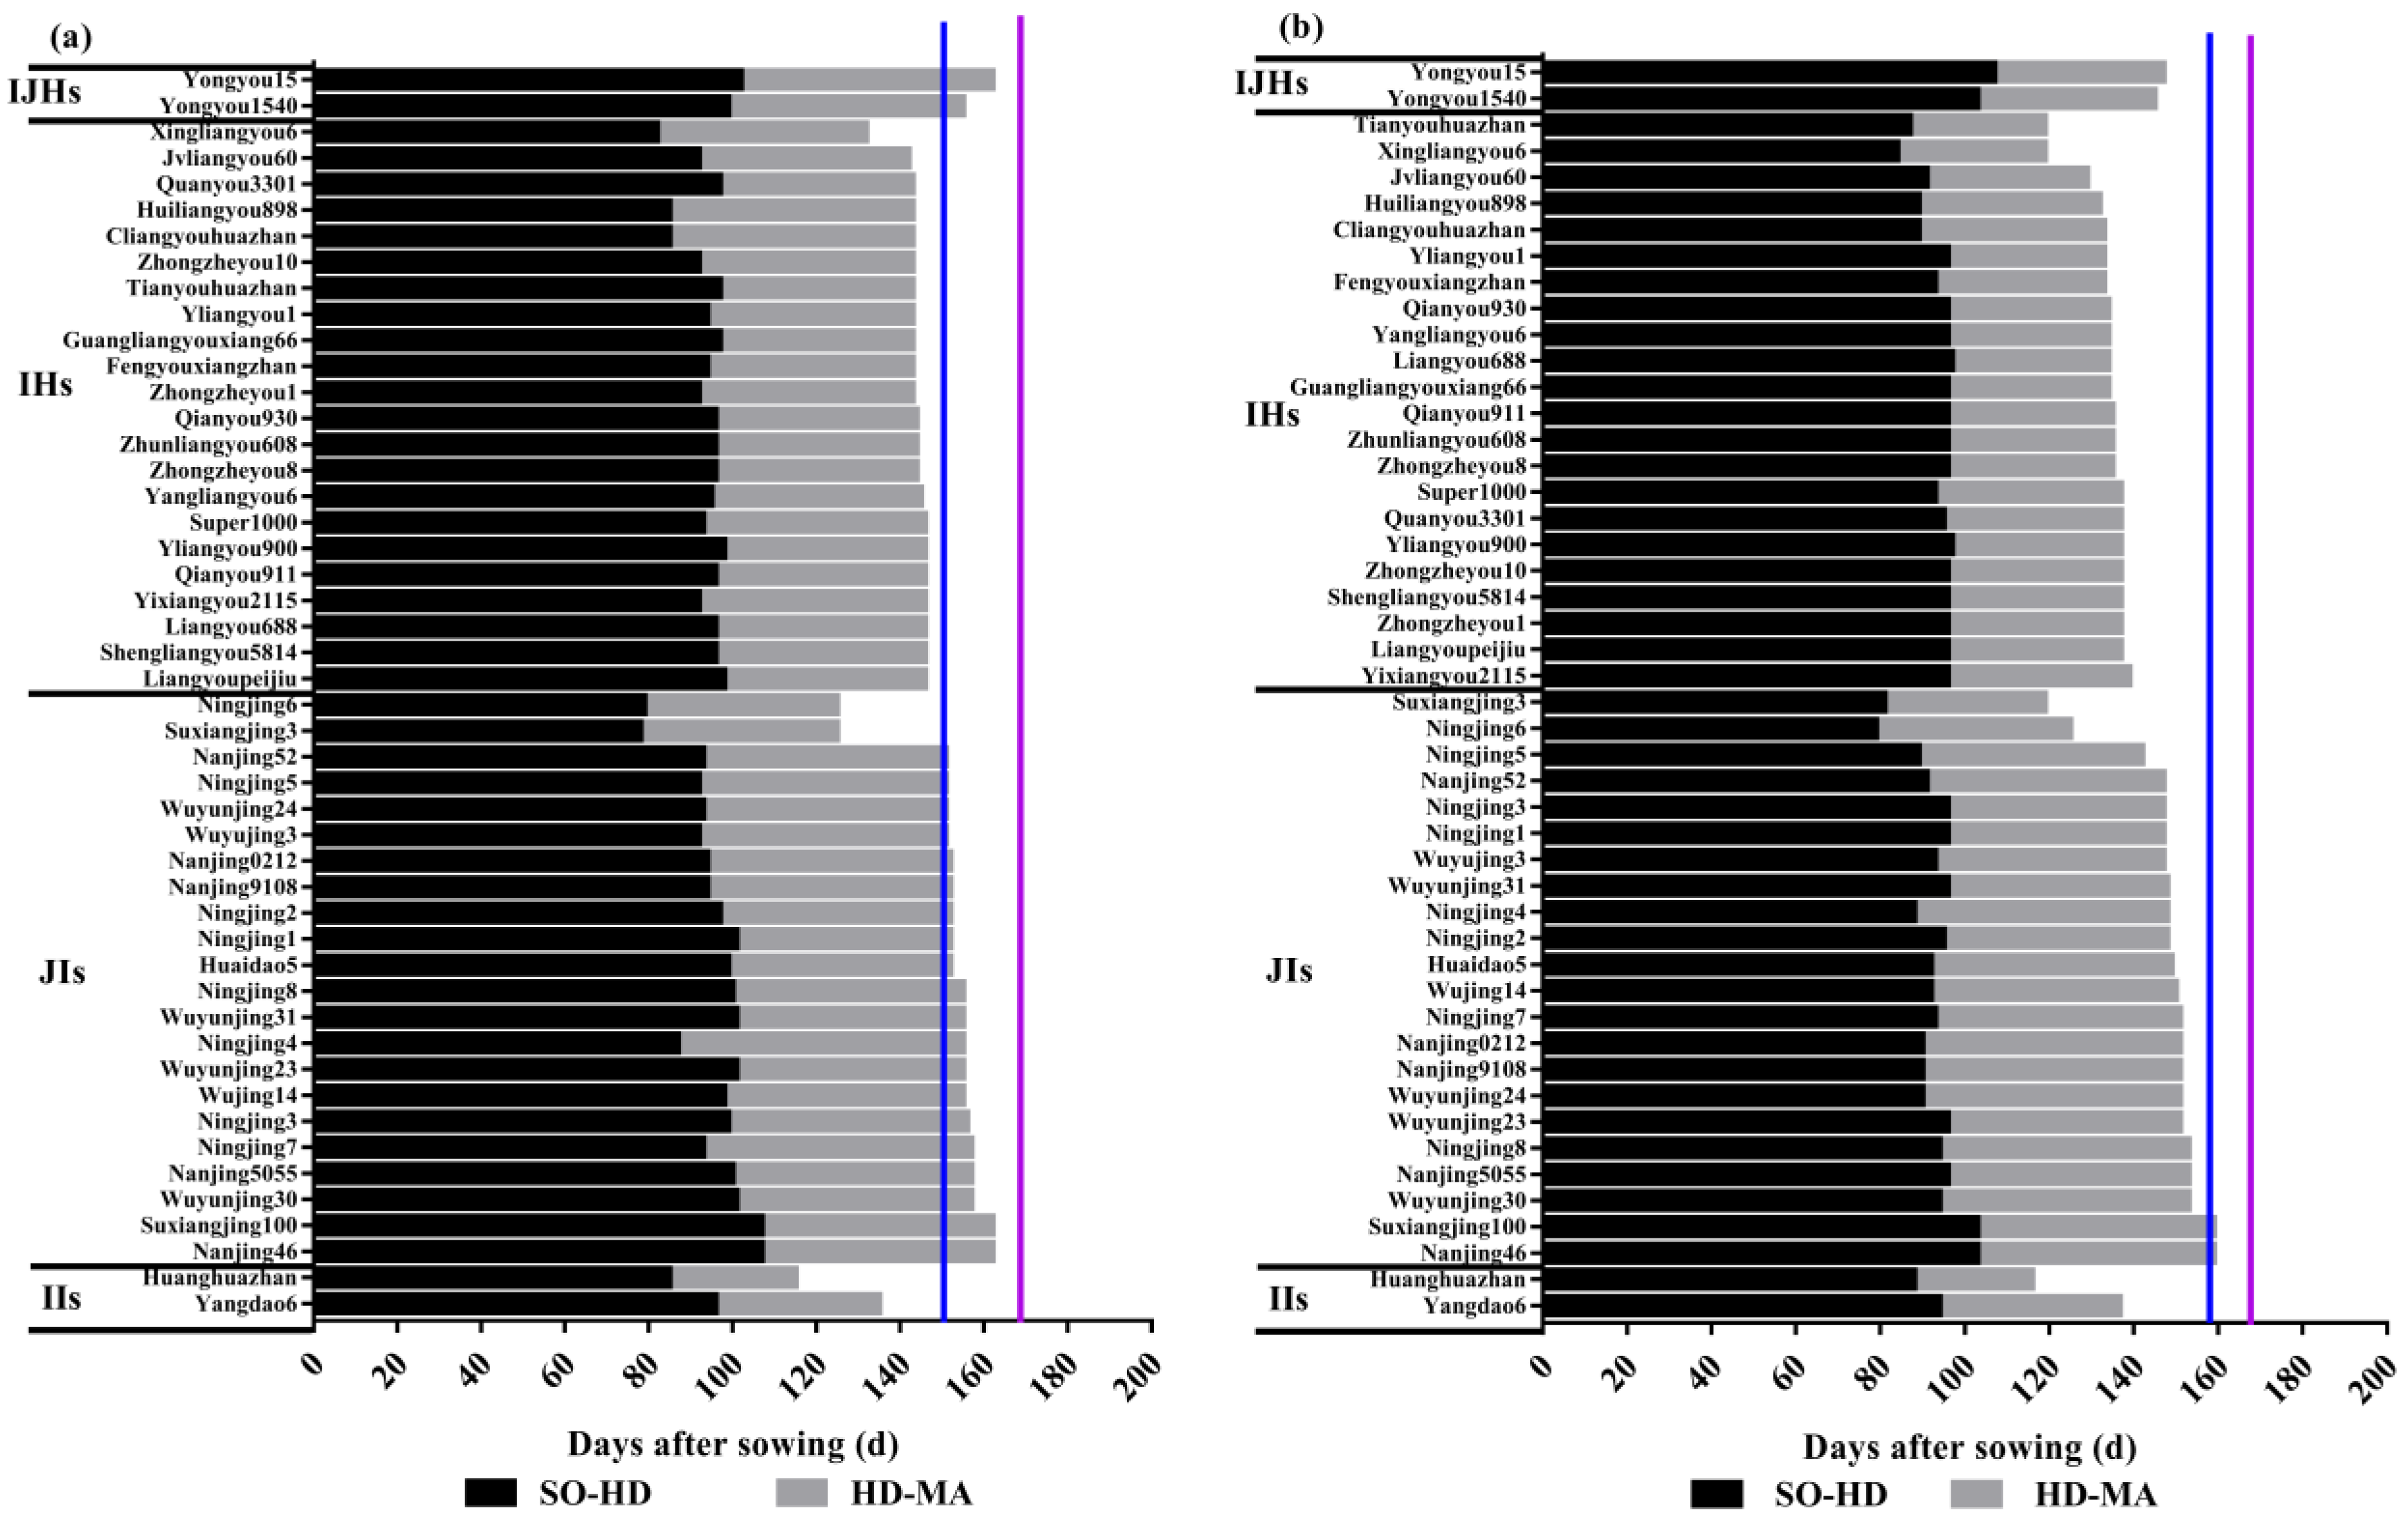
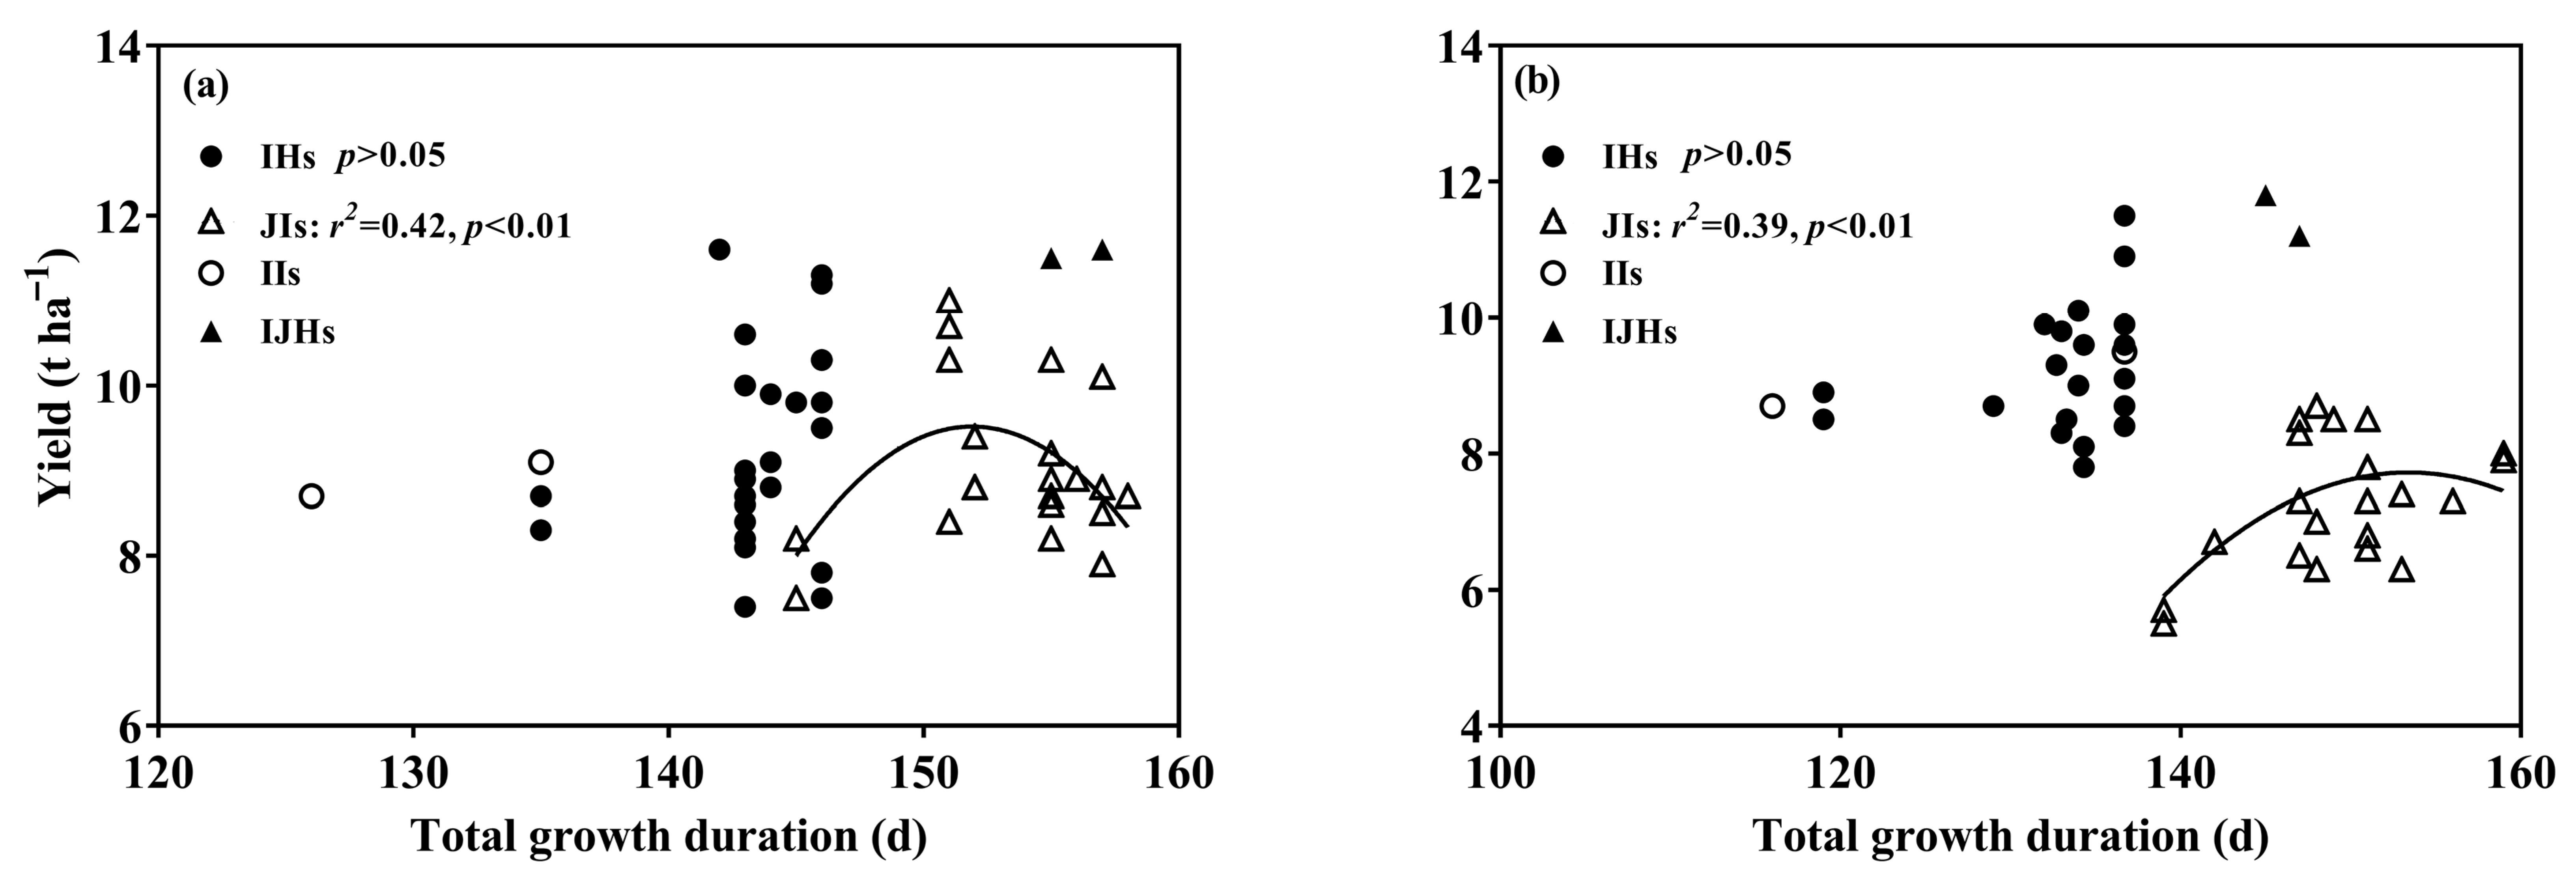
3.2. Growth Duration

All varieties could mature safely except for an IJH variety, namely Yongyou12, in 2017. The average days of the total growth duration across two years of IJHs or JIs were about 15 days and 25 days longer than IHs and IIs, respectively (Figure 4). About 10 days longer growth duration from sowing to heading (SO-HD) was found in IJHs than in other types, and the difference among IHs, JIs, and IIs was very small. Average growth duration from heading to maturity (HD-MA) of JIs was the longest, followed by IJHs, IHs, and IIs; there was little difference between JIs and IJHs in 2018. The varietal difference in the growth duration, from SO-HD as well as HD-MA, was much greater in JIs than in IHs and found the total growth duration of the JIs was parabolic related with yield (Figure 5).

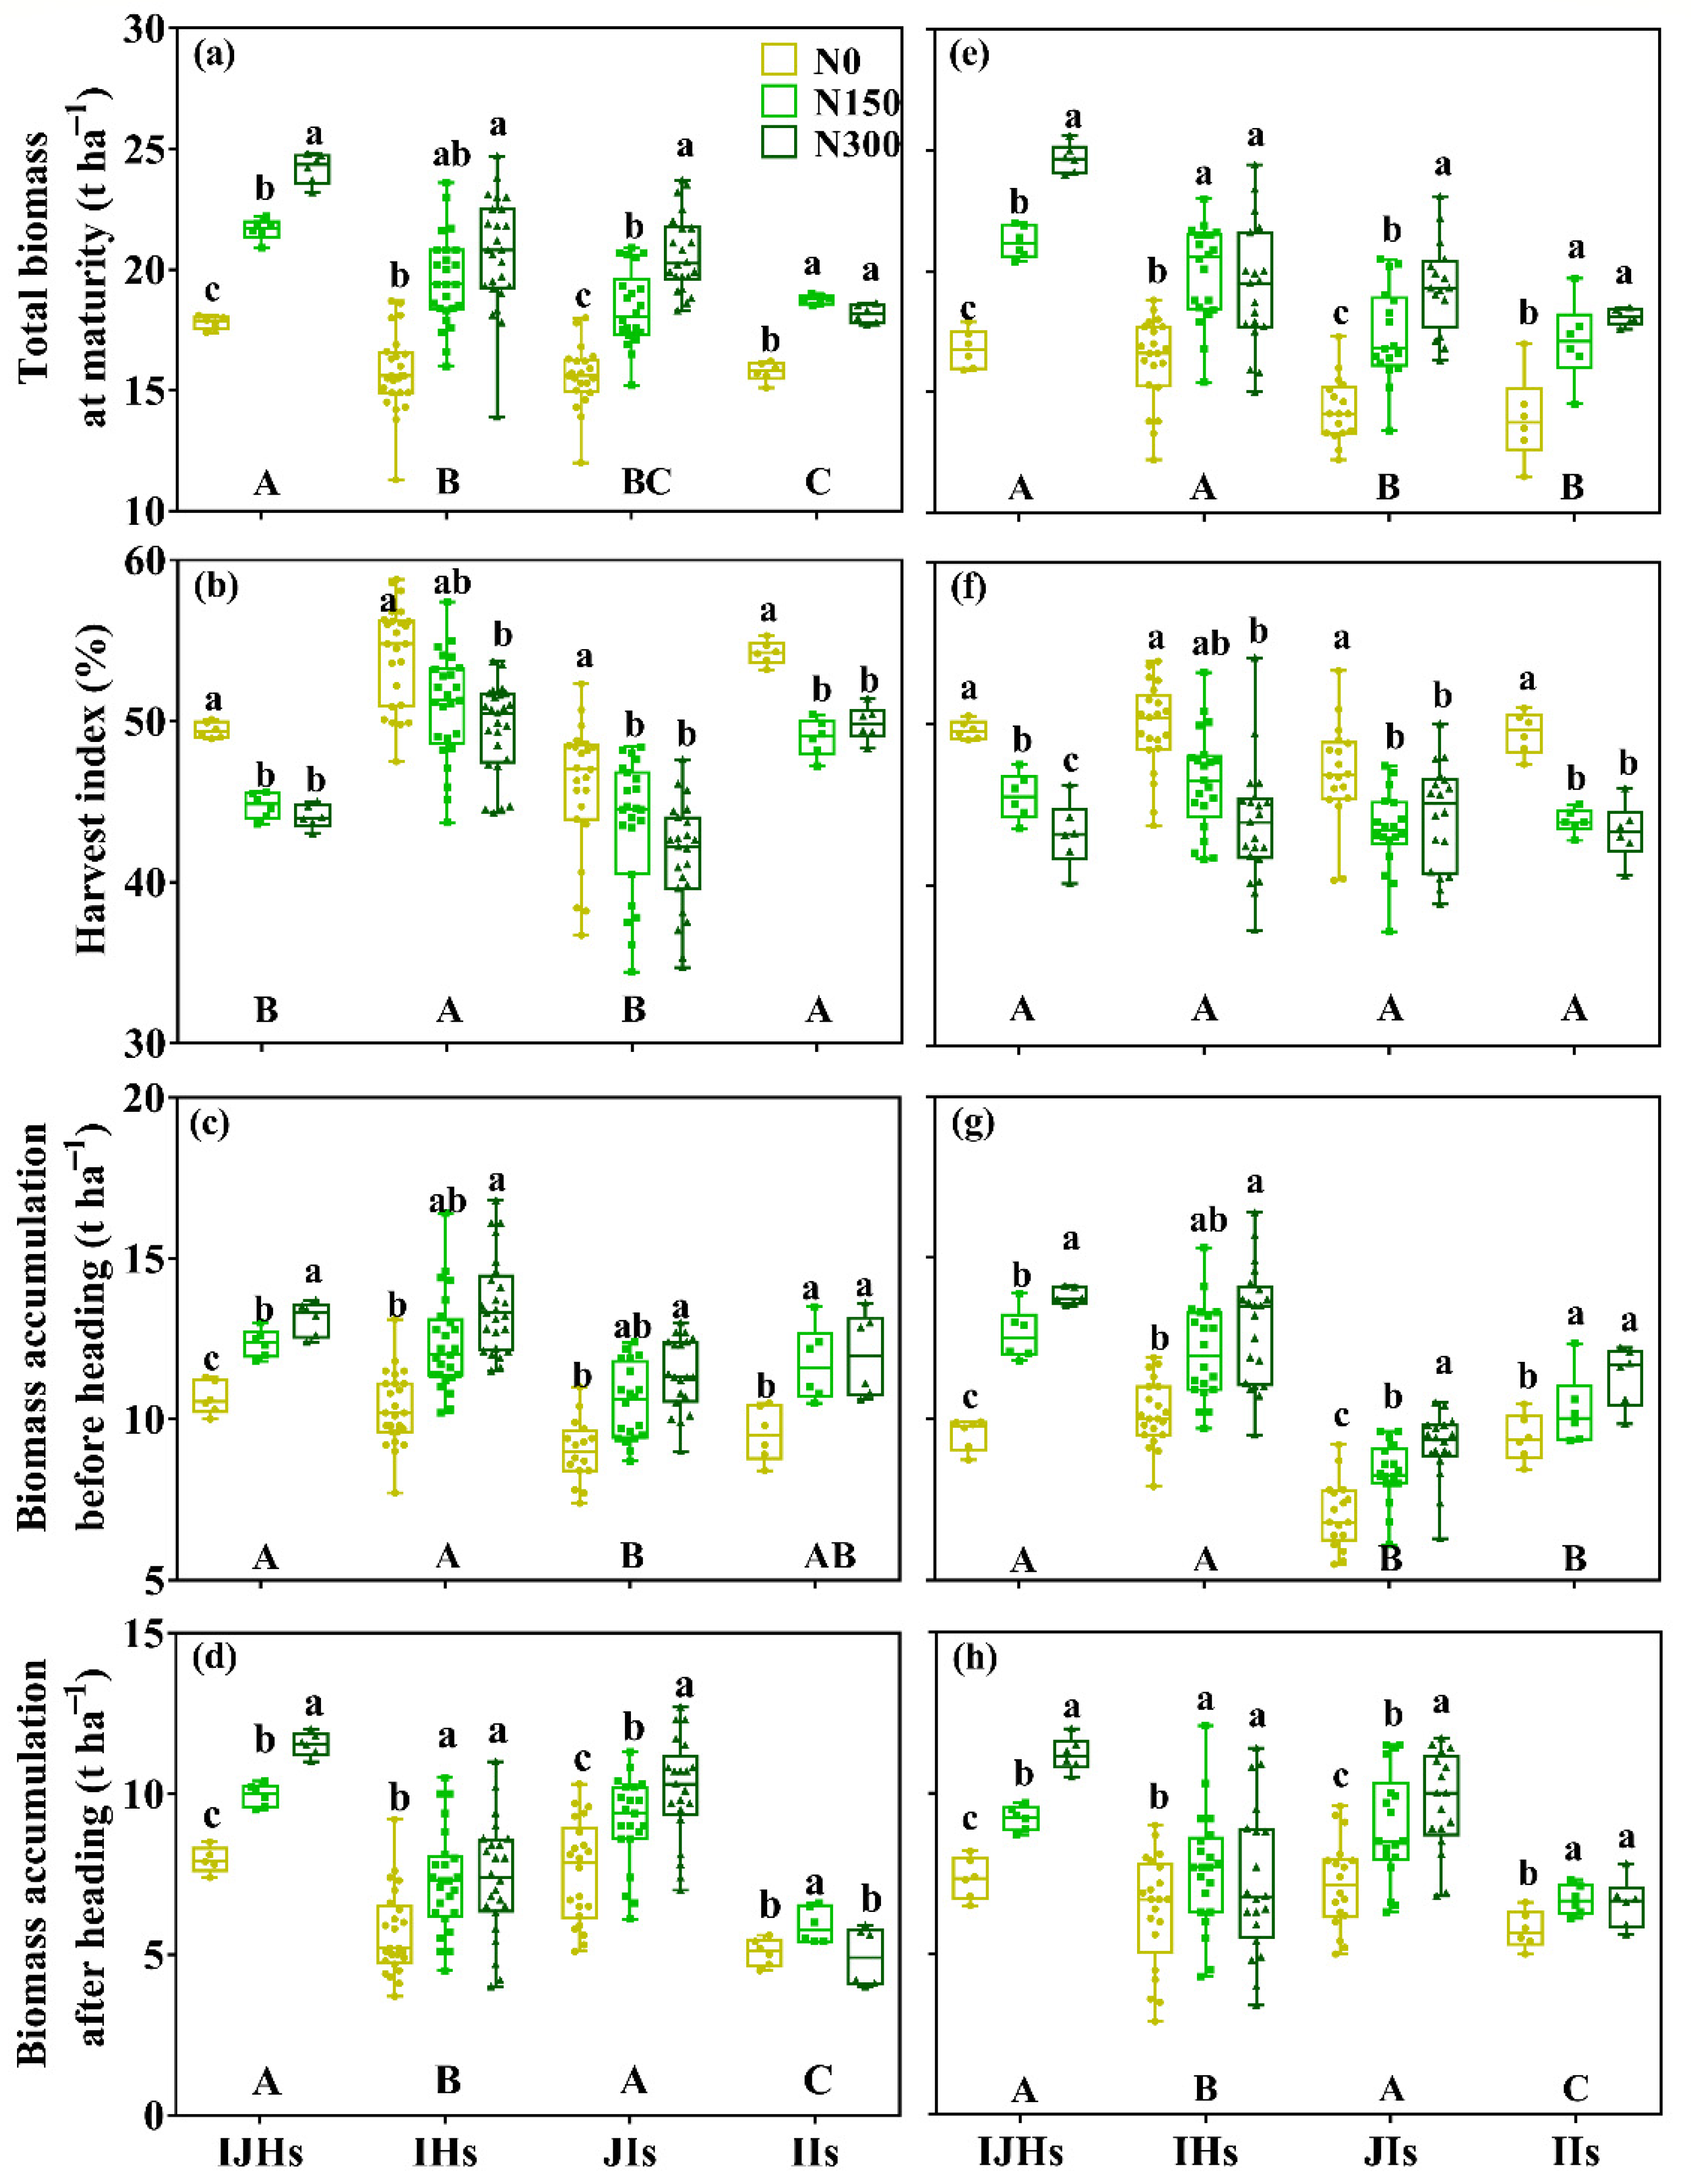
3.3. Biomass Accumulation

The difference in the accumulation of total biomass among the different rice groups exhibited a similar pattern as the difference in yield (Figure 6). The total biomass accumulations in the IJHs were 10%, 15%, and 19% higher than in IHs, JIs, and IIs, respectively. The patterns of the harvest index among the groups during the two years were inconsistent. In 2017, the harvest index of the IHs or IIs was significantly higher than the JIs or IJHs, whereas there was no significant difference in 2018. Significant differences in the biomass accumulation among groups were also observed at different stages (Table 2 and Figure 6). Before heading, the biomass accumulation in the IJHs, IHs, or IIs was higher than that in the JIs in both years; after heading, the biomass accumulation in the IJHs or JIs was significantly higher than that in the IHs or IIs. Greater varietal differences in biomass accumulation before heading and after heading were found in IHs compared to JIs.
The total biomass accumulations of the IHs, JIs, and IJHs increased significantly as the amount of nitrogen applied increased. The total biomass accumulation of the IIs first increased and then decreased as the amount of nitrogen applied increased. Compared to N0, the harvest index of the IHs did not decrease significantly at the N150 level, while the other groups of rice decreased significantly. When the amount of nitrogen applied was increased to 300 kg ha−1, the harvest index of the IHs decreased significantly, while the other groups of rice did not exhibit significant decreases except for the IJHs in 2018. The responses of biomass accumulation before heading to nitrogen levels were similar among different cultivars; dry matter accumulation increased with nitrogen application, whereas biomass accumulation after heading response to nitrogen levels varied with groups. The biomass accumulation after heading in the JIs and IJHs increased as the amount of nitrogen application increased; for the IIs, biomass accumulation after heading reached the highest value during the N150 treatment, while large variations in response to nitrogen were found in the IHs (Table 3 and Figure 6).

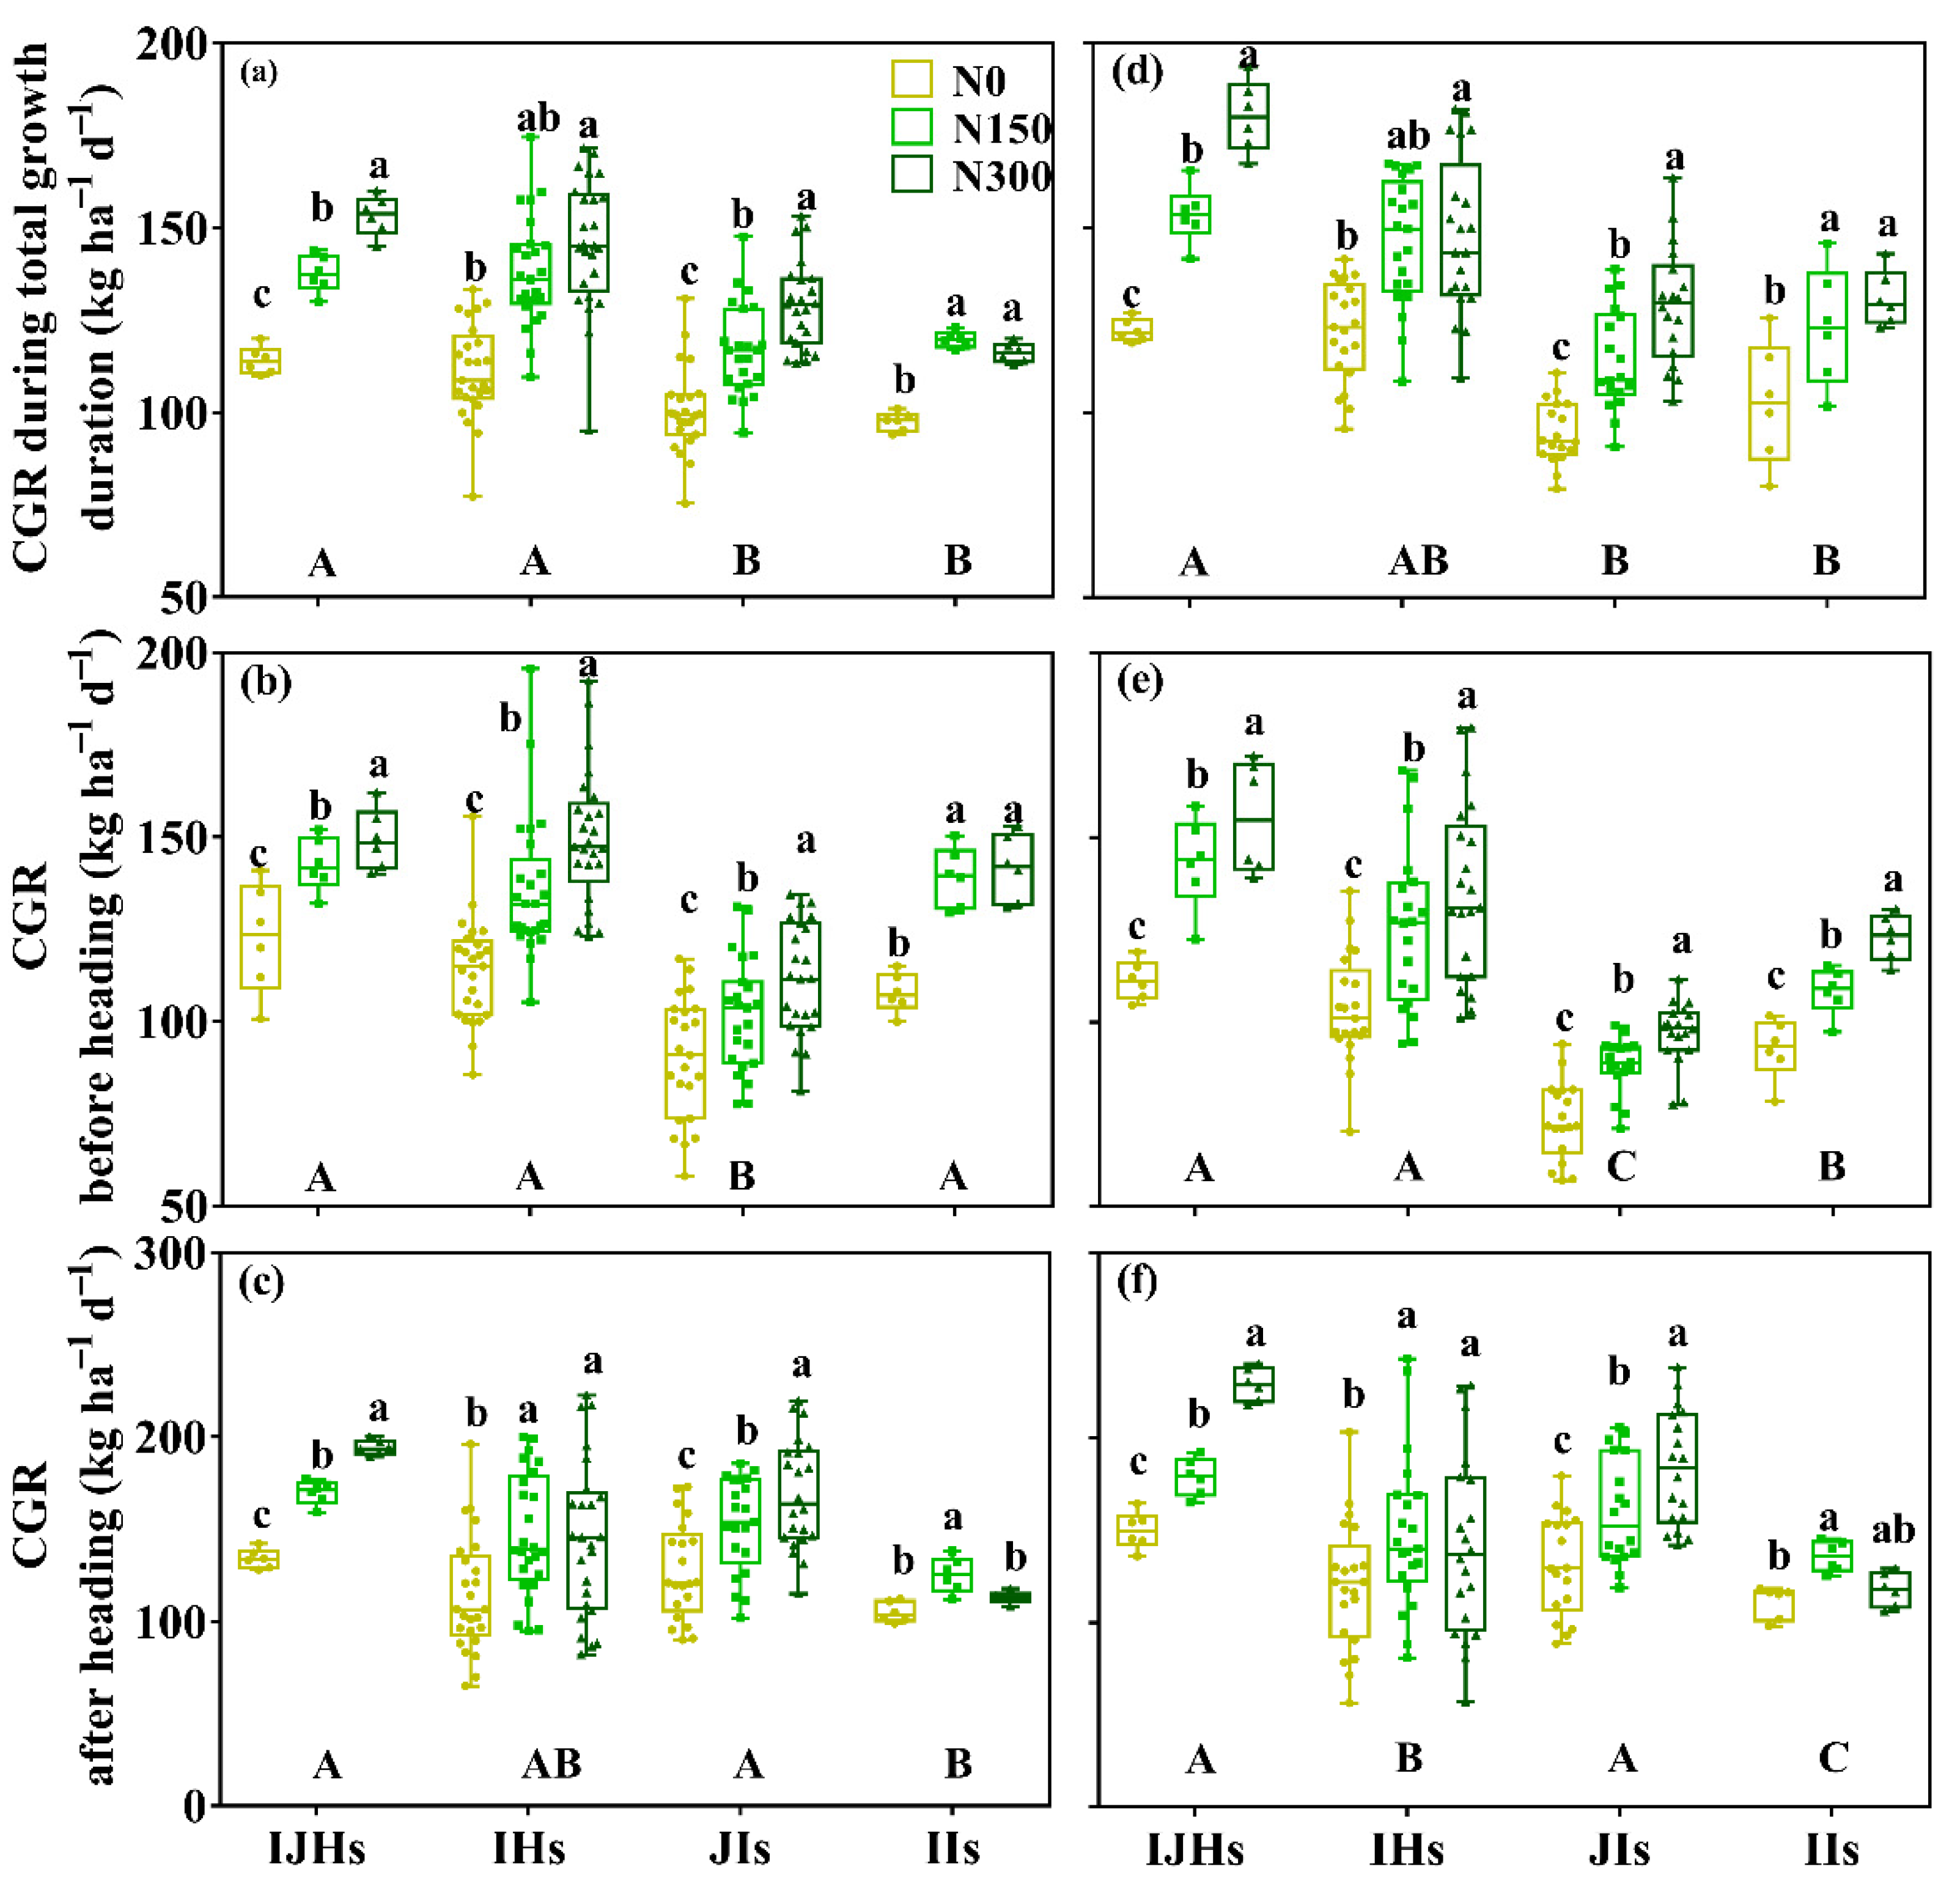
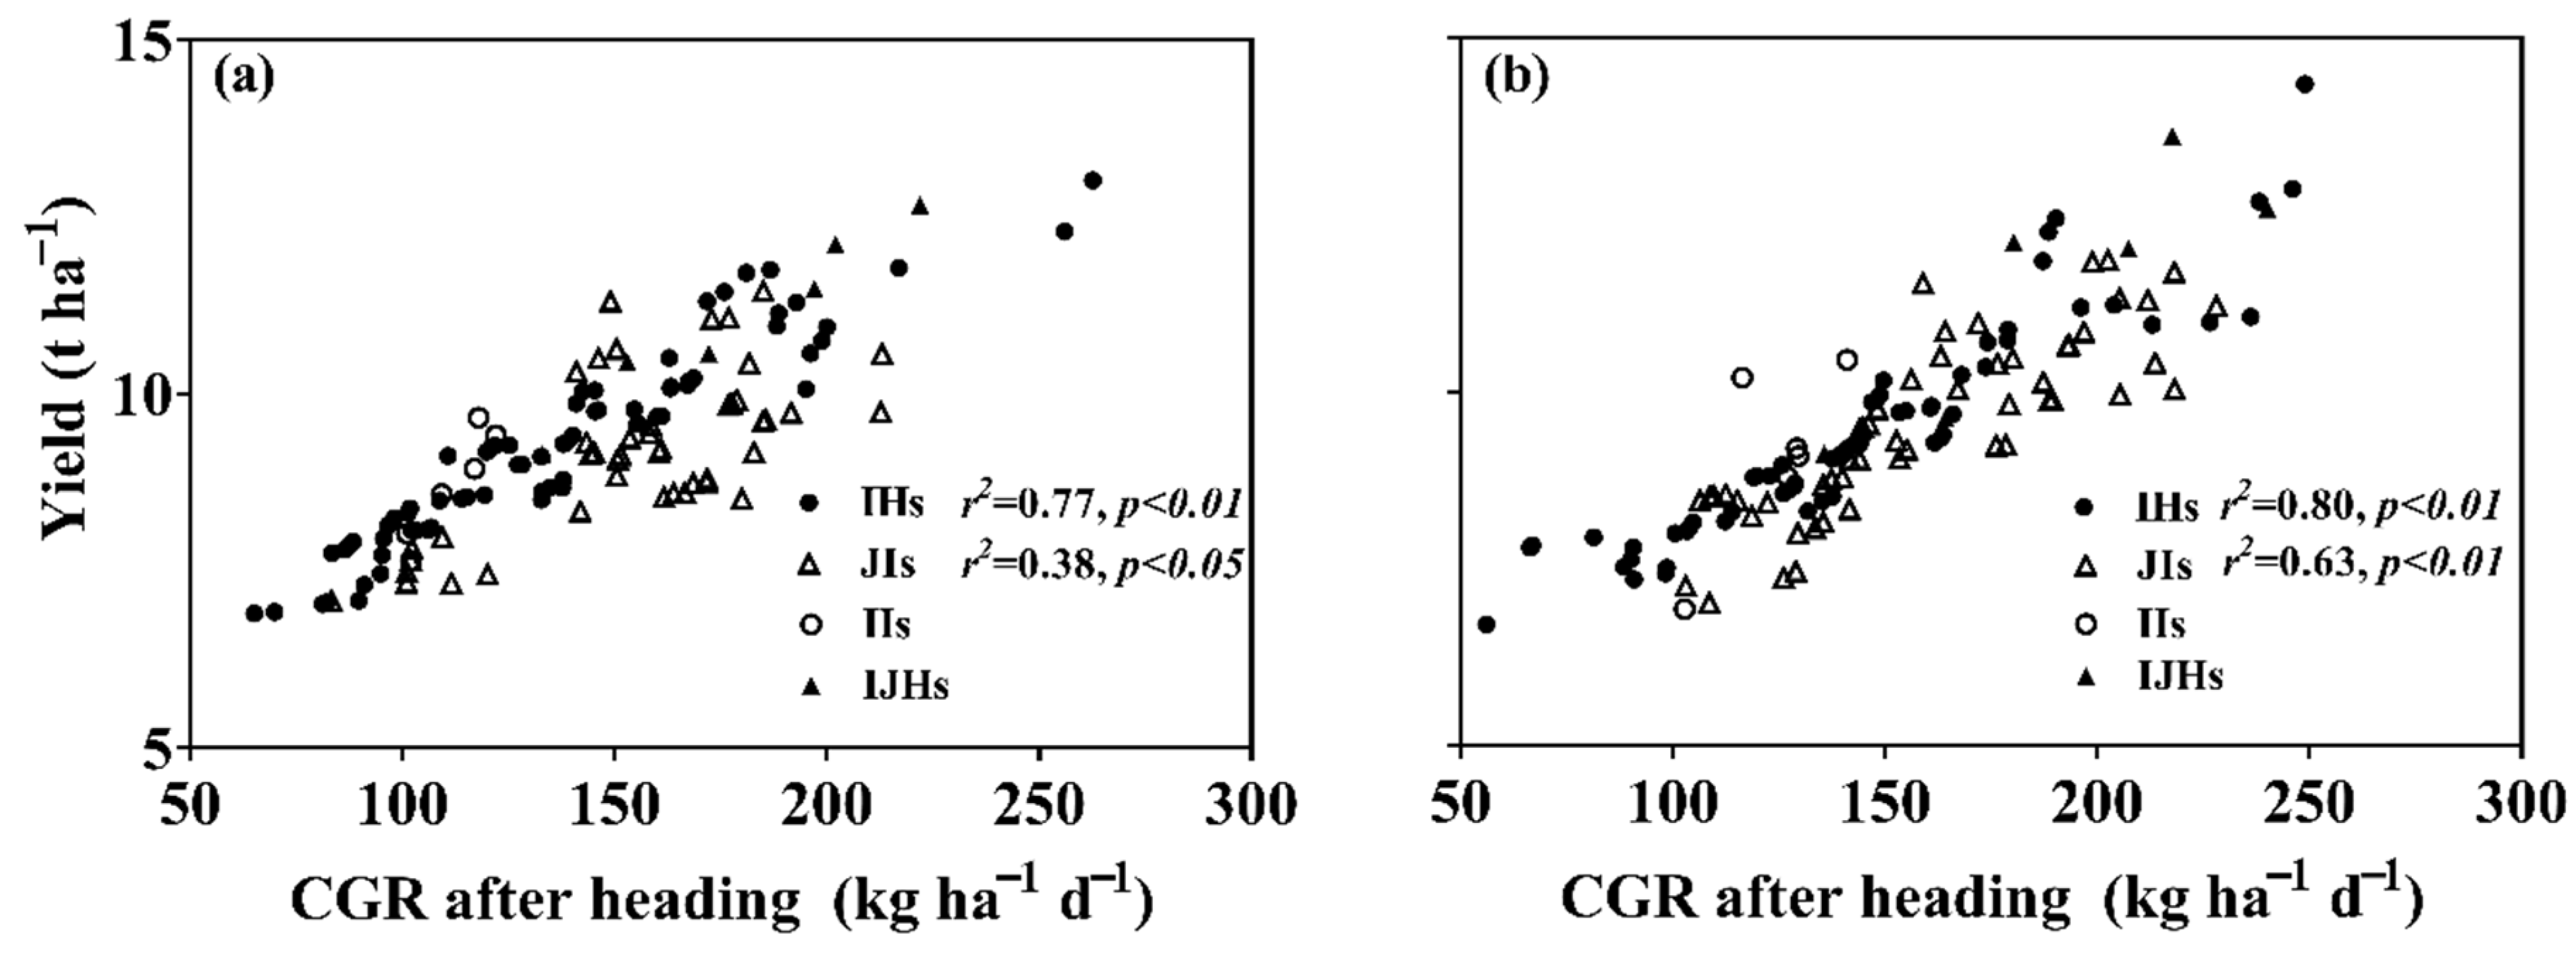
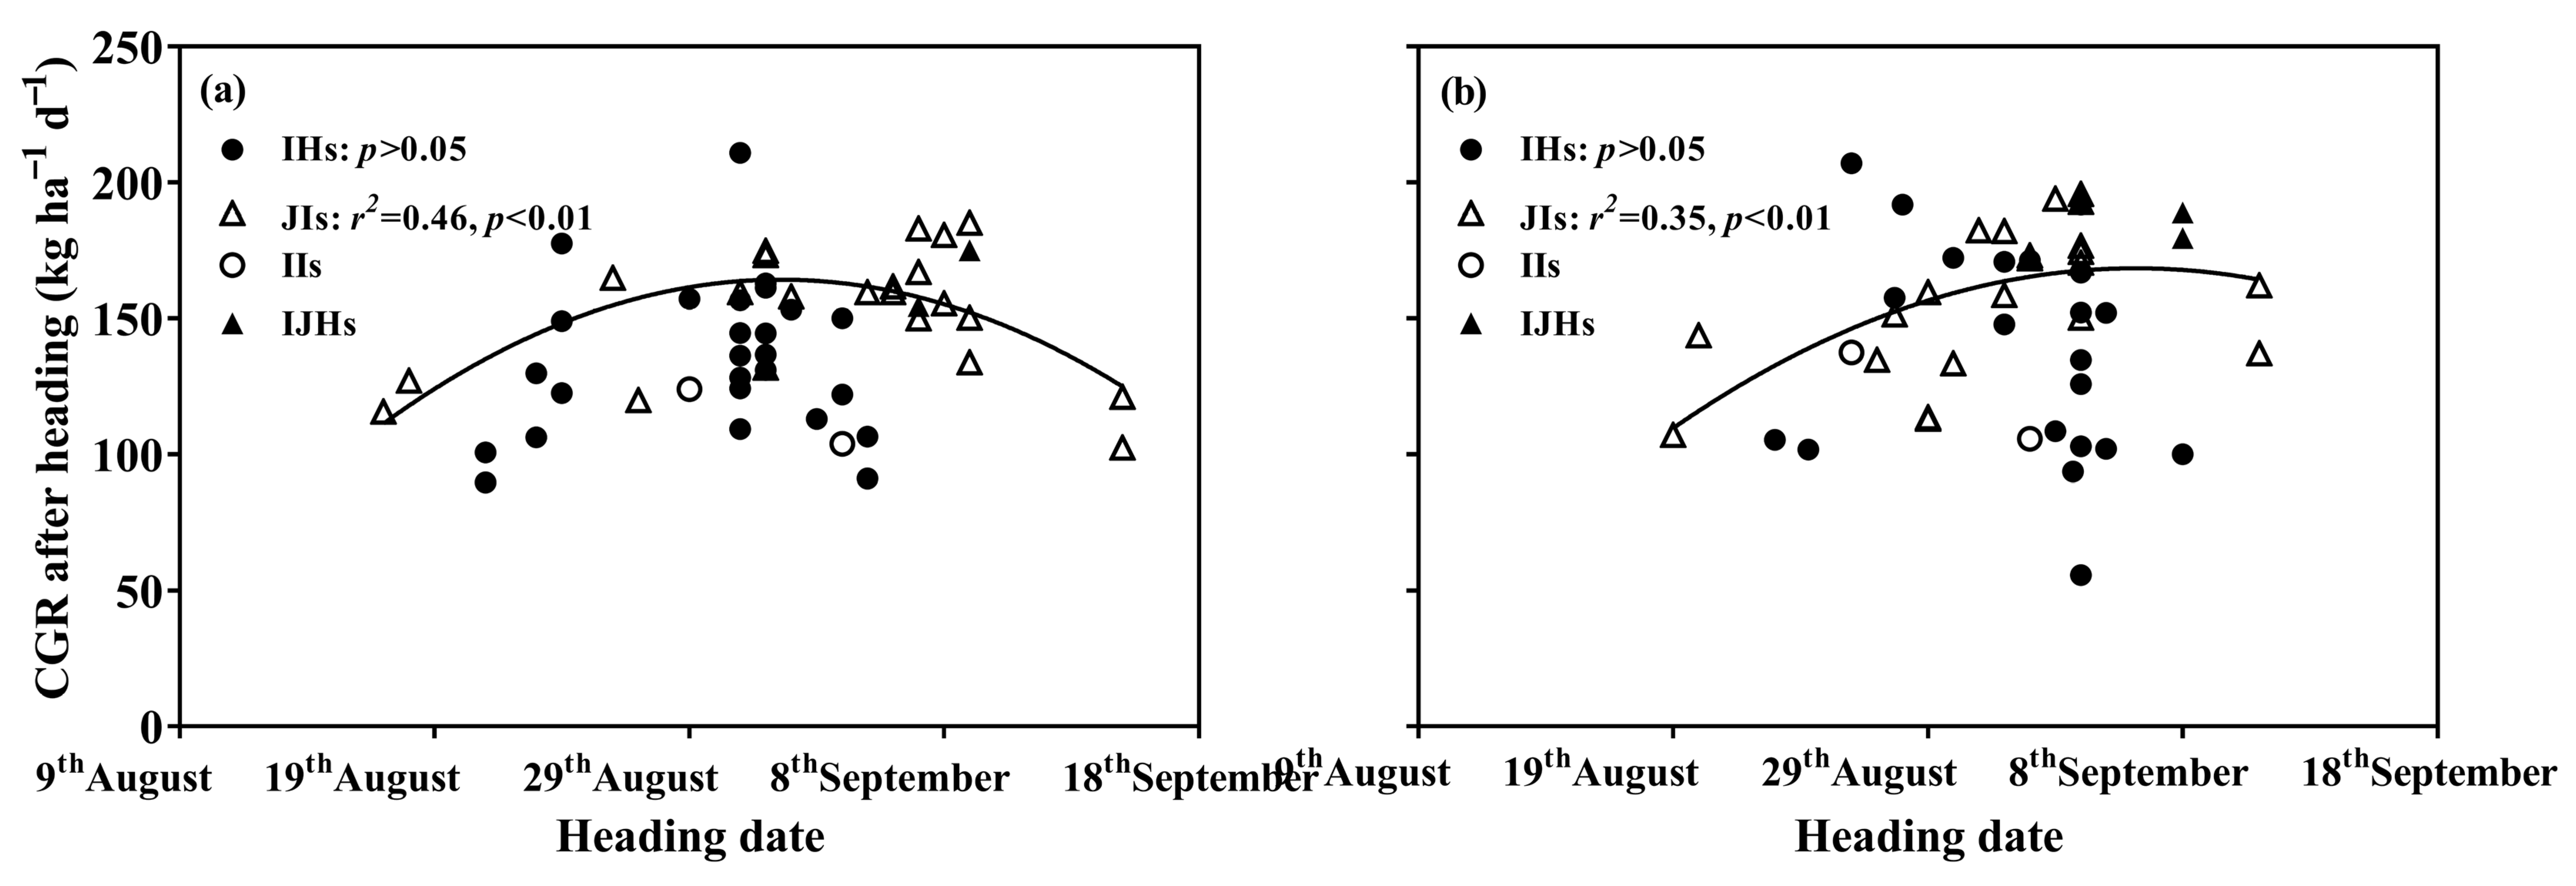
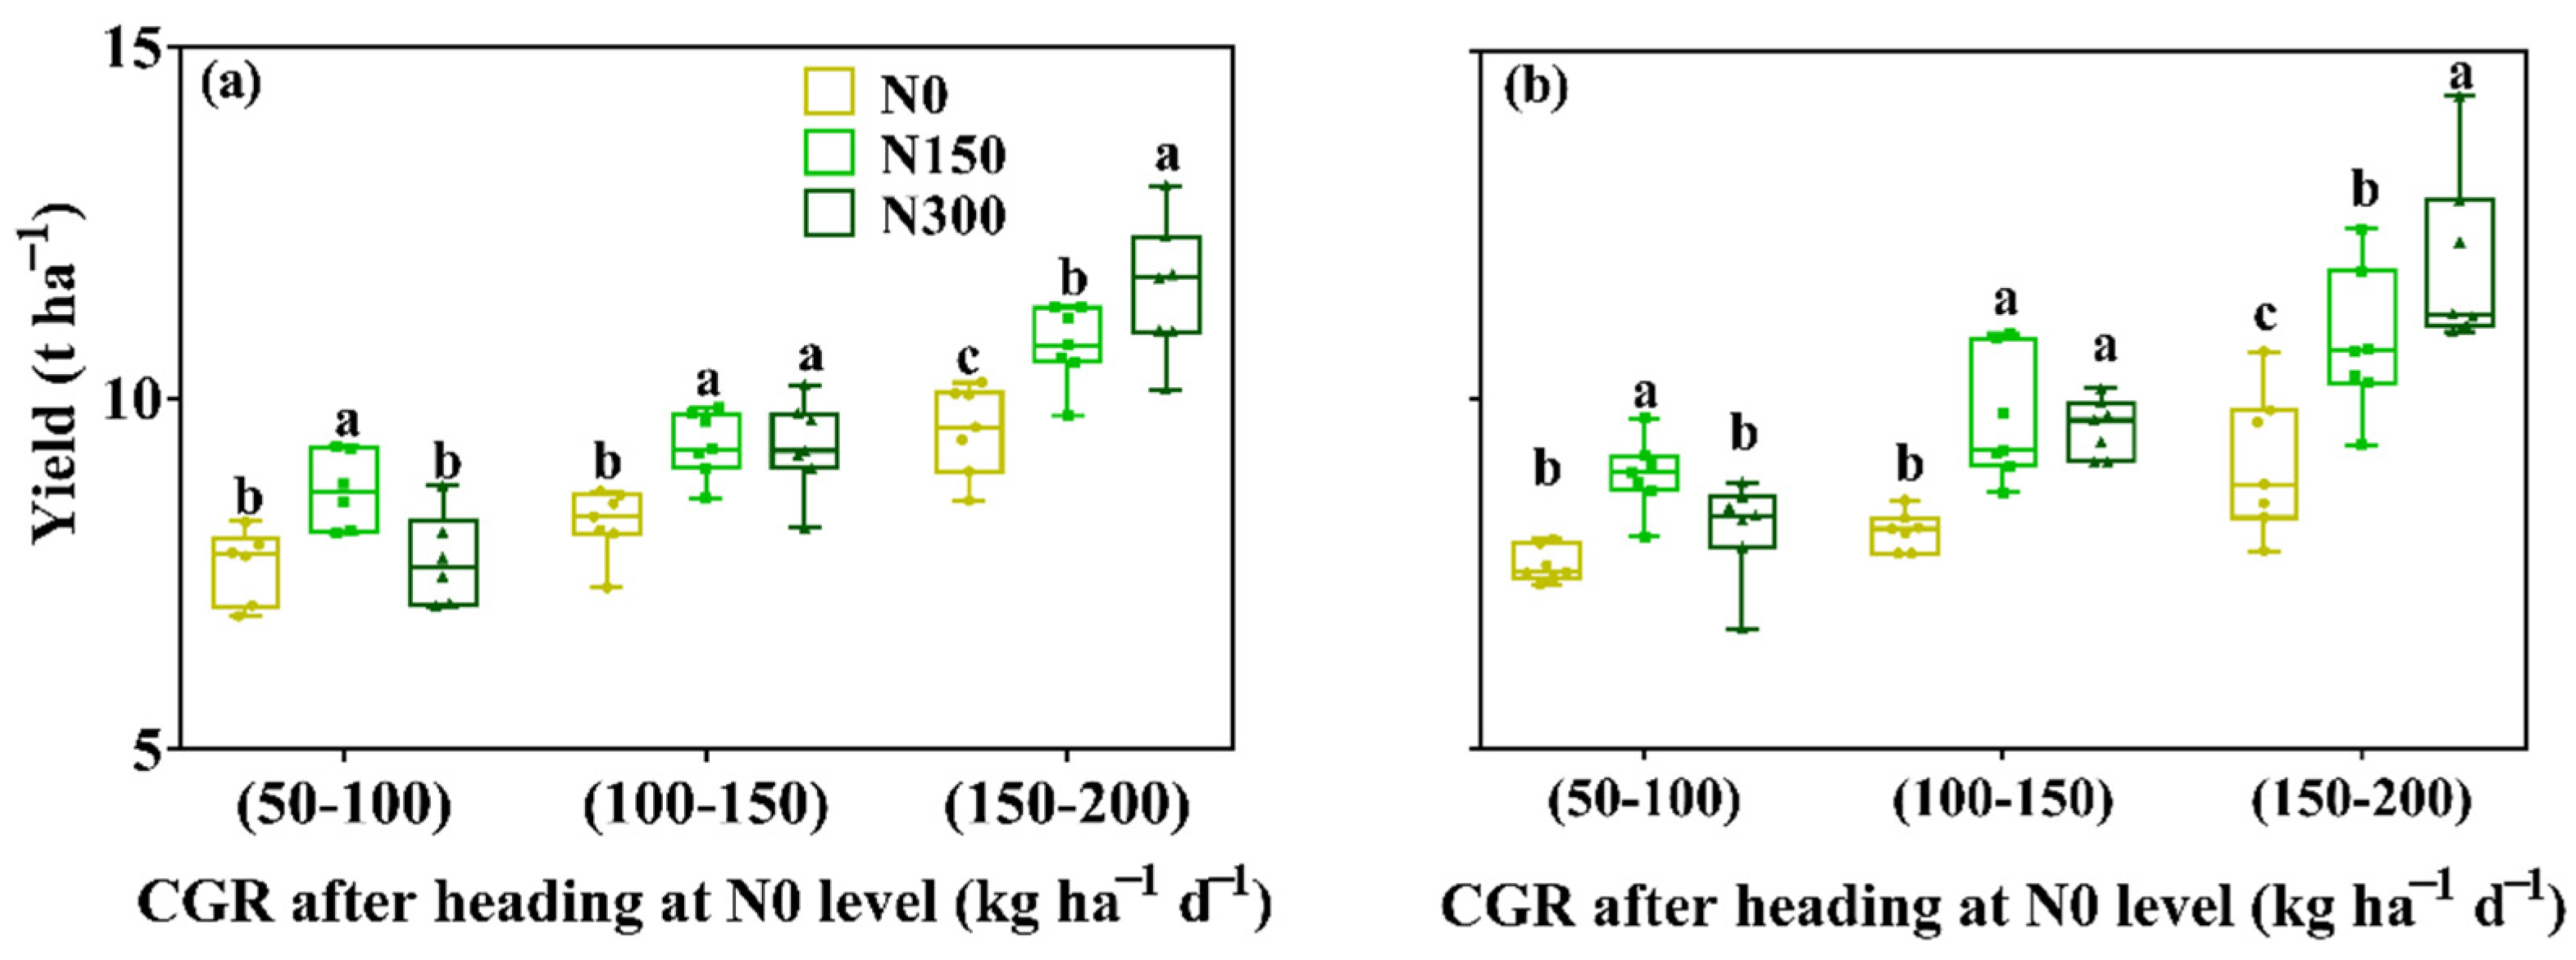
3.4. Crop-Growing Rate (CGR)

The average CGR during the total growth duration of the IHs or IJHs in both years was significantly higher than that of the JIs or IIs (Figure 7), which was approximately 15% higher in 2017 and 25% higher in 2018. Before heading, the average CGR of the IHs, Iis, or IJHs was significantly higher than that of the JIs. The average CGR after heading of the JIs or IJHs was higher than that of the IHs or IIs. The IHs had a large variation in CGR both before and after heading stage, and the CGR after heading was positively correlated with yield in IHs; the correlation coefficients were 0.77 and 0.80 in 2017 and 2018, respectively; JIs had a relatively small variation in CGR after heading compared to IHs, and the correlation coefficients were 0.38 and 0.63 in 2017 and 2018, respectively (Figure 8). However, it was found that only the CGR after heading of the JIs was parabolic related with heading date (Figure 9).
The CGR of the different rice group responses to nitrogen showed consistent patterns with biomass accumulation. Cultivars of IHs were divided into three subsets according to the CGR after heading at the N0 level and found the subset with higher CGR at N0 level had higher yield at N300 level (Figure 10).

4. Discussion

4.1. Yield Differences among Groups of Rice

Our results showed that the yield pattern was as follows: IJHs>IHs>JIs or IIs (Figure 2). The differences in yield among the different rice groups were also attributed to biomass production rather than harvest index (Figure 6a,b,e,f). Different rice groups had different benefits in biomass production at different stages. The advantage of the JIs in biomass accumulation appeared after heading, primarily resulting from longer days from heading to maturity and higher CGR after heading (Figure 4, Figure 6d,h and Figure 7c,f). The advantage that the IHs or IIs exhibited in biomass accumulation before heading can be explained by the higher CGR before heading (Figure 6c,g and Figure 7b,e). The IJHs had advantages in biomass accumulation both before and after heading. The longer growth duration and higher CGR before and after heading resulted in the higher total biomass accumulation (Figure 6c,d,g,h and Figure 7b,c,e,f), which could be explained by the heterosis of the inter-sub specific hybrid between indica and japonica cultivars. Previous studies also showed that IJHs could improve yield potentials about 30% higher than those of indica or japonica cultivars [38,39,40]. Our results suggest that hybrid heterosis in CGR rather than long growth duration may be critical for yield difference between hybrid and inbred cultivars, and high-yielding cultivars exhibited strong hybrid heterosis in CGR both before heading and after heading. This conclusion is not consistent with previous reports by Bueno [41] that a higher CGR during the vegetative phase was reported as the key parameter supporting an increase in biomass accumulation of hybrids over inbreds.
In addition, more attention should be paid to the growth duration for IJHs; previous studies reported that long growth duration was also a specific trait for high-yielding cultivars of IJHs under manual transplanting [22]. In this study, varieties with too long-growth duration (such as Yongyou12 with heading date of September 15 in 2017) fail to mature normally when unfavorable weather appears and will also delay the sowing date of the subsequent wheat (early November). Our results suggest that IJHs with optimal growth duration have higher yields under machine transplanting.
There was also a significant difference between the two years. Higher yield in 2018 could be related to the higher biomass accumulation after heading. Higher biomass accumulation after heading in 2018 resulted from higher CGR after heading, which was caused by higher daily mean temperature and higher solar radiation during the grain-filling period [42,43].

4.2. Yield Gap in IHs or JIs

IHs had a large yield gap which indicated recent breakthrough in the breeding of IHs with high yield; this was consistent with the high record yield for Y-liangyou900 of 15 t ha−1 [44]. In Gejiu, Yunnan, Chaoyou1000 had a yield of greater than 16 t ha−1 over four consecutive years [45]. The yield variation among cultivars in the IHs was due to the large difference in CGR after heading (Figure 9) because the growth duration among cultivars was relatively small; cultivars with high yield exhibited high CGRs after heading. However, many previous studies found that the genotypic difference in grain yield was most closely related to the CGR during the late reproductive period [46]. In the present study, although CGR before heading showed a large variation in IHs, no relationship with yield was found. These suggested the improvement in source capacity after heading rather than sink size was the main way to improve yield for IHs, which was consistent with the previous study [47].
Variation in total growth duration could explain the yield gap in the JIs, but varieties with too long growth duration did not produce higher yields (Figure 5). This result was not consistent with the conclusion observed by Wang et al. [21], which considered that the extension of growth duration was responsible for high yield in JIs. The discrepancy between this study and previous studies in yield gap among JIs could be due to different methods of crop establishment. Machine transplanting could delay the heading date of JIs compared to manual transplanting; late heading date of the cultivars with a long growth duration (such as Nanjing46 and Suxiangjing100) could result in a lower CGR after heading induced by lower daily mean temperature during the grain-filling stage and therefore, lower yield (Supplementary Tables S1 and S2, and Figure 9). Sinclair and Bai [48] also observed that cool temperatures slow the development rate of the crops. Furthermore, Tashiro and Wardlaw [49] and Deng et al. [50] also reported that temperature ranging from 22 °C to 27 °C is optimal for grain filling.

4.3. Difference in Nitrogen Response

Considering the yield, high efficiency, and ecological security, the amount of nitrogen application in the middle and lower reaches of the Yangtze River should not be higher than 300 kg ha−1 in the future. Therefore, this study explored the differences in yield response to nitrogen fertilizer within the range of 300 kg ha−1 of different cultivars to provide the basis for high-yield and high-efficiency nitrogen fertilizer application technology. In addition, it was found that the yield of some cultivars under the N0 level were higher than 10 t ha−1, which may be due to the high basic soil fertility in the experiment site.
In this study, it was found that the JIs and IJHs exhibited high yields when the nitrogen was 300 kg ha−1, and the IIs exhibited low yields under the same conditions (Figure 2). This suggested that the JIs and IJHs were resistant to high nitrogen (300 kg ha−1), which was consistent with the results from Zhou’s studies [51], suggesting that JIs and IJHs need more nitrogen to realize their yield potentials. Compared with inbred rice, indica hybrid rice usually has an obvious yield advantage; however, the amount of nitrogen application required for reaching its high-yield potential still remains controversial. Huang et al. [52] believed that the high yield of hybrid indica rice under the conditions of medium to high soil fertility did not depend on the input of nitrogen fertilizer, while some other studies thought indica hybrid rice had high fertilizer tolerance and needed more nitrogen to achieve high yield [53]. It was also found that the response of the IHs to nitrogen varied with cultivars; cultivars with higher CGRs after heading had higher yield than others, regardless of the N application level, and also adapted better to higher application of nitrogen (Figure 10). Therefore, the present study suggests that high CGR during the grain-filling stage could be a simple and feasible index for the selection and breeding of rice cultivars suitable for machine-transplanted and high N-responsiveness.

5. Conclusions

Hybrid rice cultivars produced higher grain yields than the inbred cultivars, resulting from a high CGR during the total growth duration. Compared to the IHs, higher grain yield was observed for the IJHs which was attributed to a longer growth duration. The large yield gap in IHs was primarily due to the difference in the CGR during the grain-filling stage; the relatively smaller yield gap in the JIs primarily resulted from the difference in the growth duration and daily mean temperature during the grain-filling stage. In addition, cultivars with a high CGR during the grain-filling stage had a higher yield advantage at a high nitrogen level.

Supplementary Materials

The following supporting information can be downloaded at: https://0-www-mdpi-com.brum.beds.ac.uk/article/10.3390/agronomy12102299/s1, Table S1: Temperature and light during the grain-filling periods of different varieties (2017); Table S2: Temperature and light during the grain-filling periods of different varieties (2018).

Author Contributions

Conceptualization, G.L., J.Y. and C.D.; methodology, G.L. and X.Z.; investigation, C.D., X.Z., C.X., E.C., B.L., X.L., Q.W., Q.Z. and X.X.; writing—original draft preparation, C.D.; writing—review and editing, C.D. and C.X.; project administration, Z.L., Y.D., J.Y. and G.L. All authors have read and agreed to the published version of the manuscript.

Funding

This work was funded by the National Key Research and Development Program of China (2017YFD0300100, 2017YFD0301204, and 2018YFD0300803), Jiangsu Key Research and Development Program (BE2017369).

Conflicts of Interest

The authors declare no conflict of interest.

References

  1. Huang, M.; Zou, Y. Integrating mechanization with agronomy and breeding to ensure food security in China. Field Crops Res. 2018, 224, 22–27. [Google Scholar] [CrossRef]
  2. Ju, C.; Buresh, R.J.; Wang, Z.; Zhang, H.; Liu, L.; Yang, J.; Zhang, J. Root and shoot traits for rice varieties with higher grain yield and higher nitrogen use efficiency at lower nitrogen rates application. Field Crops Res. 2015, 175, 47–55. [Google Scholar] [CrossRef]
  3. Liu, X.; Xu, S.; Zhang, J.; Ding, Y.; Li, G.; Wang, S.; Liu, Z.; Tang, S.; Ding, C.; Chen, L. Effect of continuous reduction of nitrogen application to a rice-wheat rotation system in the middle-lower Yangtze River region (2013–2015). Field Crops Res. 2016, 196, 348–356. [Google Scholar] [CrossRef]
  4. Bai, H.; Tao, F. Sustainable intensification options to improve yield potential and eco-efficiency for rice-wheat rotation system in China. Field Crops Res. 2017, 211, 89–105. [Google Scholar] [CrossRef]
  5. Chen, S.; Liu, S.; Zheng, X.; Yin, M.; Chu, G.; Xu, C.; Yan, J.; Chen, L.; Wang, D.; Zhang, X. Effect of various crop rotations on rice yield and nitrogen use efficiency in paddy–upland systems in southeastern China. Crop J. 2018, 6, 576–588. [Google Scholar] [CrossRef]
  6. Yang, J.C.; Du, Y.; Liu, H. Cultivation approaches and techniques for annual super-high-yielding of rice and wheat in the lower reaches of Yangtze River. Sci. Agric. Sin. 2008, 41, 1611–1621. (In Chinese) [Google Scholar]
  7. Gong, J.; Zhang, H.; Li, J.; Huo, Z.; Xu, K.; Li, D.; Liu, G. Progress in research on patterns and systematic theories of super-high-yielding cultivation in rice. Chin. J. Rice Sci. 2010, 24, 417–424. (In Chinese) [Google Scholar]
  8. Li, H.; Liu, L.; Wang, Z.; Yang, J.; Zhang, J. Agronomic and physiological performance of high-yielding wheat and rice in the lower reaches of Yangtze River of China. Field Crops Res. 2012, 133, 119–129. [Google Scholar] [CrossRef]
  9. Zhang, H.; Gong, J. Research status and development discussion on high-yielding agronomy of mechanized planting rice in China. Sci. Agric. Sin. 2014, 47, 1273–1289. (In Chinese) [Google Scholar]
  10. Zhu, D.F.; Zhang, Y.P.; Chen, H.Z.; Xiang, J.; Zhang, Y.K. Innovation and practice of high-yield rice cultivation technology in China. Sci. Agric. Sin. 2015, 48, 3404–3414. (In Chinese) [Google Scholar]
  11. Xing, Z.; Hu, Y.; Qian, H.; Cao, W.; Guo, B.; Wei, H.; Xu, K.; Huo, Z.; Zhou, G.; Dai, Q.; et al. Comparison of yield traits in rice among three mechanized planting methods in a rice-wheat rotation system. J. Integr. Agric. 2017, 16, 1451–1466. [Google Scholar] [CrossRef]
  12. Hu, Y.J.; Wu, P.; Zhang, H.C.; Dai, Q.G.; Huo, Z.Y.; Xu, K.; Gao, H.; Wei, H.Y.; Guo, B.W.; Cui, P. Comparison of agronomic performance between inter-sub-specific hybrid and inbred japonica rice under different mechanical transplanting methods. J. Integr. Agric. 2018, 17, 806–816. [Google Scholar] [CrossRef]
  13. Chen, S.; Ge, Q.; Chu, G.; Xu, C.; Yan, J.; Zhang, X.; Wang, D. Seasonal differences in the rice grain yield and nitrogen use efficiency response to seedling establishment methods in the Middle and Lower reaches of the Yangtze River in China. Field Crops Res. 2017, 205, 157–169. [Google Scholar] [CrossRef]
  14. Xing, Z.; Wu, P.; Zhu, M.; Qian, H.; Hu, Y.; Guo, B.; Wei, H.; Xu, K.; Huo, Z.; Dai, Q.; et al. Temperature and solar radiation utilization of rice for yield formation with different mechanized planting methods in the lower reaches of the Yangtze River, China. J. Integr. Agric. 2017, 16, 1923–1935. [Google Scholar] [CrossRef] [Green Version]
  15. Chen, J.; Cao, F.; Yin, X.; Huang, M.; Zou, Y. Yield performance of early-season rice cultivars grown in the late season of double-season crop production under machine-transplanted conditions. PLoS ONE 2019, 14, e213075. [Google Scholar] [CrossRef]
  16. Zhang, Y.; Tang, Q.; Zou, Y.; Li, D.; Qin, J.; Yang, S.; Chen, L.; Xia, B.; Peng, S. Yield potential and radiation use efficiency of “super” hybrid rice grown under subtropical conditions. Field Crops Res. 2009, 114, 91–98. [Google Scholar] [CrossRef]
  17. Yuan, L.P. Progress in super-hybrid rice breeding. Crop J. 2017, 5, 100–102. [Google Scholar] [CrossRef]
  18. Huang, M.; Tang, Q.Y.; Ao, H.J.; Zou, Y. Yield potential and stability in super hybrid rice and its production strategies. J. Integr. Agric. 2017, 16, 1009–1017. [Google Scholar] [CrossRef]
  19. Shi, X.; Hu, R. Rice variety improvement and the contribution of foreign germplasms in China. J. Integr. Agric. 2017, 16, 2337–2345. [Google Scholar] [CrossRef]
  20. Tang, L.; Xu, Z.; Chen, W. Advances and prospects of super rice breeding in China. J. Integr. Agric. 2017, 16, 984–991. [Google Scholar] [CrossRef]
  21. Wang, C.; Zhang, Y.; Zhu, Z.; Chen, T.; Zhao, Q.; Zhong, W.; Yang, J.; Yao, S.; Zhou, L.; Zhao, L.; et al. Research progress on the breeding of japonica super rice varieties in Jiangsu Province, China. J. Integr. Agric. 2017, 16, 992–999. [Google Scholar] [CrossRef]
  22. Wei, H.; Zhang, H.; Blumwald, E.; Li, H.; Cheng, J.; Dai, Q.; Huo, Z.; Xu, K.; Guo, B. Different characteristics of high yield formation between inbred japonica super rice and inter-sub-specific hybrid super rice. Field Crops Res. 2016, 198, 179–187. [Google Scholar] [CrossRef]
  23. Wei, H.; Meng, T.; Li, X.; Dai, Q.; Zhang, H.; Yin, X. Sink-source relationship during rice grain filling is associated with grain nitrogen concentration. Field Crops Res. 2018, 215, 23–38. [Google Scholar] [CrossRef]
  24. Wei, H.; Meng, T.; Li, C.; Xu, K.; Huo, Z.; Wei, H.; Guo, B.; Zhang, H.; Dai, Q. Comparisons of grain yield and nutrient accumulation and translocation in high-yielding japonica/indica hybrids, indica hybrids, and japonica conventional varieties. Field Crops Res. 2017, 204, 101–109. [Google Scholar] [CrossRef]
  25. Jiang, Y.H.; Xu, K.; Zhao, K.; Sun, J.J.; Wei, H.H.; Xu, J.W.; Wei, H.Y.; Guo, B.W.; Huo, Z.Y.; Dai, Q.G.; et al. Canopy structure and photosynthetic characteristics of Yongyou series of indica-japonica hybrid rice under high-yielding cultivation condition. Acta Agron. Sin. 2015, 41, 286–296. (In Chinese) [Google Scholar] [CrossRef]
  26. Jiang, P.; Xie, X.; Huang, M.; Zhou, X.; Zhang, R.; Chen, J.; Wu, D.; Xia, B.; Xiong, H.; Xu, F.; et al. Potential Yield Increase of Hybrid Rice at Five Locations in Southern China. Rice 2016, 9, 11. [Google Scholar] [CrossRef]
  27. Koutroubas, S.D.; Ntanos, D.A. Genotypic differences for grain yield and nitrogen utilization in Indica and Japonica rice under Mediterranean conditions. Field Crops Res. 2003, 83, 251–260. [Google Scholar] [CrossRef]
  28. Gong, J.; Xing, Z.; Hu, Y.; Zhang, H.; Huo, Z.; Xu, K.; Gao, H. Difference of characteristics of photosynthesis, matter production and translocation between indica and japonica super rice. Acta Agron. Sin. 2014, 40, 497–510. (In Chinese) [Google Scholar] [CrossRef]
  29. Okamura, M.; Arai-Sanoh, Y.; Yoshida, H.; Mukouyama, T.; Adachi, S.; Yabe, S.; Nakagawa, H.; Tsutsumi, K.; Taniguchi, Y.; Kobayashi, N.; et al. Characterization of high-yielding rice cultivars with different grain-filling properties to clarify limiting factors for improving grain yield. Field Crops Res. 2018, 219, 139–147. [Google Scholar] [CrossRef]
  30. Liu, Q.; Hu, J.F.; Zhou, W.; Yang, Z.P.; Chen, Y.; Ren, W.J. Dry matter production and yield characteristics of machine-transplanted rice varieties falling into different types in sichuan basin. Chin. J. Rice Sci. 2019, 33, 35–46. (In Chinese) [Google Scholar]
  31. Li, M.; Zhang, H.; Yang, X.; Ge, M.; Ma, Q.; Wei, H.; Dai, Q.; Huo, Z.; Xu, K.; Luo, D. Accumulation and utilization of nitrogen, phosphorus and potassium of irrigated rice cultivars with high productivities and high N use efficiencies. Field Crops Res. 2014, 161, 55–63. [Google Scholar] [CrossRef]
  32. Liu, L.J.; Wang, K.J.; Bian, J.L.; Xiong, Y.W.; Chen, L.; Wang, Z.Q.; Yang, J.C. Differences in yield response to nitrogen fertilizer among rice cultivars and their relationship with root morphology and physiology. Acta Agron. Sin. 2014, 40, 1999–2007. (In Chinese) [Google Scholar] [CrossRef]
  33. Jiang, P.; Xie, X.; Huang, M.; Zhou, X.; Zhang, R.; Chen, J.; Wu, D.; Xia, B.; Xu, F.; Xiong, H.; et al. Comparisons of yield performance and nitrogen response between hybrid and inbred rice under different ecological conditions in southern China. J. Integr. Agric. 2015, 14, 1283–1294. [Google Scholar] [CrossRef]
  34. Huang, L.; Sun, F.; Yuan, S.; Peng, S.B.; Wang, F. Different mechanisms underlying the yield advantage of ordinary hybrid and super hybrid rice over inbred rice under low and moderate N input conditions. Field Crops Res. 2018, 216, 150–157. [Google Scholar] [CrossRef]
  35. Yin, C.Y.; Wei, H.Y.; Zhang, Q.; Dai, Q.G.; Huo, Z.Y.; Ke, X. Differences and correlations in grain yield, n uptake and utilization between medium-maturing indica and japonica rice under different n fertilizer levels. Acta Agron. Sin. 2009, 35, 348–355. (In Chinese) [Google Scholar] [CrossRef]
  36. Meng, T.Y.; Xu, J.W.; Shao, Z.B.; Ge, M.J.; Zhang, H.C.; Wei, H.Y.; Jing, P.P. Advantages and their formation characteristics of the highest population productivity of nitrogen fertilization in japonica/indica hybrid rice of Yongyou series. Acta Agron. Sin. 2015, 41, 1711–1725. (In Chinese) [Google Scholar] [CrossRef]
  37. Tabien, R.E.; Samonte, S.O.P.; McClung, A.M. Forty-eight years of rice improvement in Texas since the release of cultivar Bluebonnet in 1944. Crop Sci. 2008, 48, 2097–2106. [Google Scholar] [CrossRef]
  38. Yang, J.; Peng, S.; Zhang, Z.; Wang, Z.; Visperas, R.M.; Zhu, Q. Grain and dry matter yields and partitioning of assimilates in japonica/indica hybrid rice. Crop Sci. 2002, 42, 766–772. [Google Scholar] [CrossRef]
  39. Guo, B.; Hua, J.; Zhou, N.; Zhang, H.; Chen, B.; Shu, P.; Huo, Z.; Zhou, P.; Cheng, F.; Huang, D.; et al. Difference in yield and population characteristics of different types of late rice cultivars in double-cropping rice area. Acta Agron. Sin. 2015, 41, 1220–1236. (In Chinese) [Google Scholar] [CrossRef]
  40. Hua, J.; Zhou, N.; Zhang, J.; Zhang, H.; Huo, Z.; Zhou, P.; Cheng, F.; Li, G.; Huang, D.; Chen, Z.; et al. Selection of late rice cultivars of japonica rice switched from indica rice in double cropping rice area. Sci. Agric. Sin. 2014, 47, 4582–4594. (In Chinese) [Google Scholar]
  41. Bueno, C.S.; Lafarge, T. Higher crop performance of rice hybrids than of elite inbreds in the tropics: 1. Hybrids accumulate more biomass during each phenological phase. Field Crops Res. 2009, 112, 229–237. [Google Scholar] [CrossRef]
  42. Peng, S.; Huang, J.; Sheehy, J.E.; Laza, R.C.; Visperas, R.M.; Zhong, X.; Centeno, G.S.; Khush, G.S.; Cassman, K.G. Rice yield decline with higher night temperature from global warming. Proc. Natl. Acad. Sci. USA 2004, 101, 9971–9997. [Google Scholar] [CrossRef] [PubMed]
  43. Wang, D.; Laza, M.R.C.; Cassman, K.G.; Huang, J.; Nie, L.; Ling, X.; Centeno, G.S.; Cui, K.; Wang, F.; Li, Y.; et al. Temperature explains the yield difffference of doubleseason rice between tropical and subtropical environments. Field Crops Res. 2016, 198, 303–311. [Google Scholar] [CrossRef]
  44. Chang, S.; Chang, T.; Song, Q.; Zhu, X.; Deng, Q. Photosynthetic and agronomic traits of an elite hybrid rice Y-Liang-You 900 with a record-high yield. Field Crops Res. 2016, 187, 49–57. [Google Scholar] [CrossRef]
  45. Li, G.; Yang, C. Design and Practice of Precise Quantitative Cultivation Techniques for Super-High Yield of Rice; China Agriculture Press: Beijing, China, 2019. [Google Scholar]
  46. Takai, T.; Matsuura, S.; Nishio, T.; Ohsumi, A.; Shiraiwa, T.; Horie, T. Rice yield potential is closely related to crop growth rate during late reproductive period. Field Crops Res. 2006, 96, 328–335. [Google Scholar] [CrossRef]
  47. Huang, L.; Yang, D.; Li, X.; Peng, S.B.; Wang, F. Coordination of high grain yield and high nitrogen use efficiency through large sink size and high post-heading source capacity in rice. Field Crops Res. 2019, 233, 49–58. [Google Scholar] [CrossRef]
  48. Sinclair, T.R.; Bai, Q. Analysis of high wheat yields in northwest China. Agric. Syst. 1997, 53, 373–385. [Google Scholar] [CrossRef]
  49. Tashiro, T.; Wardlaw, I. The effect of high temperature on the accumulation of dry matter: Carbon and nitrogen in the kernel of rice. Funct. Plant Biol. 1991, 18, 259–265. [Google Scholar] [CrossRef]
  50. Deng, N.; Ling, X.; Sun, Y.; Zhang, C.; Fahad, S.; Peng, S.; Cui, K.; Nie, L.; Huang, J. Influence of temperature and solar radiation on grain yield and quality in irrigated rice system. Eur. J. Agron. 2015, 64, 37–46. [Google Scholar] [CrossRef]
  51. Zhou, Q.; Yuan, R.; Zhu, K.; Wang, Z.; Yang, J. Characteristics of grain yield and nitrogen absorption and utilization of indica/japonica hybrid rice Yongyou 2640 under different nitrogen application rates. Acta Agron. Sin. 2022, 48, 2285–2299. (In Chinese) [Google Scholar]
  52. Huang, M.; Jiang, P.; Shan, S.; Gao, W.; Ma, G.; Zou, Y.; Uphoff, N.; Yuan, L. Higher yields of hybrid rice do not depend on nitrogen fertilization under moderate to high soil fertility conditions. Rice 2017, 10, 1–5. [Google Scholar] [CrossRef] [PubMed]
  53. Tang, J.; Sun, Z.; Chen, Q.; Damaris, R.; Lu, B.; Hu, Z. Nitrogen fertilizer induced alterations in the root proteome of two rice cultivars. Int. J. Mol. Sci. 2019, 20, 3674. [Google Scholar] [CrossRef] [PubMed] [Green Version]
Figure 1. Daily photosynthetically active solar radiation (a,c) and temperature (b,d) during the entire growth duration in 2017 (a,b) and 2018 (c,d). The red horizontal lines in (b,d) denote high temperature stress.
Agronomy 12 02299 g001
Figure 2. Boxplots of yield for indica-japonica hybrids (IJHs), indica hybrids (IHs), japonica inbreds (JIs), and indica inbreds (IIs) under different N levels in 2017 (a) and 2018 (b). Data are the means of three replicates. The horizontal lines in the boxes indicate median values in each treatment; the lower limits and upper limits of the boxes represent the 25 and 75 percentiles, respectively; and vertical bars of the boxes represent the 5 and 95 percentiles; different color boxes indicate different N treatments. Different uppercase letters above the columns indicate statistical significance at the p < 0.05 level among different rice groups, and different lowercase letters above columns indicate statistical significance at the p < 0.05 level among different nitrogen levels.
Agronomy 12 02299 g002
Figure 3. Boxplots of yield components for indica-japonica hybrids (IJHs), indica hybrids (IHs), japonica inbreds (JIs), and indica inbreds (IIs) under different N levels in 2017 (ad) and 2018 (eh), respectively. Data are means of three replicates. Different uppercase letters above columns indicate statistical significance at the p < 0.05 level among different rice groups, and different lowercase letters above columns indicate statistical significance at the p < 0.05 level among different nitrogen levels.
Agronomy 12 02299 g003
Figure 4. Days from sowing to heading (SO-HD) and days from heading to maturity (HD-MA) for the indica-japonica hybrids (IJHs), indica hybrids (IHs), japonica inbreds (JIs), and indica inbreds (IIs) in 2017 (a) and 2018 (b), respectively. The blue line represents biological zero temperature (14 °C) for IHs and IIs, and the purple line represents biological zero temperature (12 °C) for JIs and IJHs.
Agronomy 12 02299 g004
Figure 5. Relationship between yield and total growth duration in 2017 (a) and 2018 (b), respectively. IJHs, indica-japonica hybrids; IHs, indica hybrids; JIs, japonica inbreds; IIs, indica inbreds. p < 0.01, significance at the 0.01 probability level according to the LSD test.
Agronomy 12 02299 g005
Figure 6. Boxplots of total biomass at maturity (a,e), harvest index (b,f), biomass accumulation before heading (c,g), and biomass accumulation after heading (d,h) for indica-japonica hybrids (IJHs), indica hybrids (IHs), japonica inbreds (JIs), and indica inbreds (IIs) under different N levels in 2017 (ad) and 2018 (eh), respectively. Data are the means of three replicates. Different uppercase letters above the columns indicate statistical significance at the p < 0.05 level among the different rice groups, and different lowercase letters above columns indicate statistical significance at the p < 0.05 level among different nitrogen levels.
Agronomy 12 02299 g006
Figure 7. Boxplots of CGR during the total growth duration (a,d), CGR before heading (b,e), and CGR after heading (c,f) for indica-japonica hybrids (IJHs), indica hybrids (IHs), japonica inbreds (JIs), and indica inbreds (IIs) under different N levels in 2017 (ac) and 2018 (df), respectively. Data are the means of three replicates. Different uppercase letters above the columns indicate statistical significance at the p < 0.05 level among different rice groups, and different lowercase letters above columns indicate statistical significance at the p < 0.05 level among different nitrogen levels.
Agronomy 12 02299 g007
Figure 8. Relationship between yield and CGR after heading in 2017 (a) and 2018 (b). IJHs, indica-japonica hybrids; IHs, indica hybrids; JIs, japonica inbreds; IIs, indica inbreds. p < 0.05, significant at the 0.05 probability level according to the LSD test; p < 0.01, significance at the 0.01 probability level according to the LSD test.
Agronomy 12 02299 g008
Figure 9. Relationship between CGR after heading with heading date in 2017 (a) and 2018 (b), respectively. IJHs, indica-japonica hybrids; IHs, indica hybrids; JIs, japonica inbreds; IIs, indica inbreds. p > 0.05, not significant at the 0.05 probability level according to the LSD test. p < 0.01, significant at the 0.01 probability level according to the LSD test.
Agronomy 12 02299 g009
Figure 10. Yields of three subsets of indica hybrids (IHs) based on CGR after heading at N0 level in 2017 (a) and 2018 (b), respectively. Different lowercase letters above the columns indicate statistical significance at the p < 0.05 level among different nitrogen levels.
Agronomy 12 02299 g010
Table 1. Different rice cultivars tested in this study in 2017 and 2018.
CultivarGroupYear of Planting AreaCultivarGroupYear of Planting Area
Official Release(×104 ha)Official Release(×104 ha)
LiangyoupeijiuIHs1999604Wuyunjing7JIs1995363
Zhongzheyou1IHs1999155Wujing14JIs1999126
FengyouxiangzhanIHs200149Ningjing1JIs2001106
Zhongzheyou8IHs200170Ningjing2JIs200113
Xingliangyou6IHs2003217Ningjing3JIs200134
Guangliangyouxiang66IHs200550Nanjing46JIs200414
Yliangyou1IHs2005249Nanjing5055JIs200572
Zhunliangyou608IHs200625Wuyunjing23JIs200599
Shengliangyou5814IHs2007157Wuyunjing24JIs200675
TianyouhuazhanIHs2007150Suxiangjing3JIs2006
Liangyou688IHs200841Ningjing4JIs2007143
Zhongzheyou10IHs20088Ningjing5JIs20075
Yixiangyou2115IHs200953Ningjing6JIs20092
Yangliangyou6IHs2009287Nanjing52JIs20095
Qianyou930IHs2009 Nanjing9108JIs2009111
Qianyou911IHs2010 Nanjing0212JIs20103
CliangyouhuazhanIHs201063Wuyunjing31JIs201010
Huiliangyou898IHs201110Suxiangjing100JIs2011
Jvliangyou60IHs2012 Ningjing7JIs2011
Yliangyou900IHs201325Ningjing8JIs2012
Quanyou3301IHs2013 Yangdao6IIs199344
Chaoyou1000IHs2014 HuanghuazhanIIs2002257
Wuyujing3JIs1990608Yongyou1540IJHs20108
Huaidao5JIs1994175Yongyou538IJHs201329
Detailed information is supported by China Rice Data Center (https://www.ricedata.cn/variety/). IJHs, indica-japonica hybrids; IHs, indica hybrids; JIs, japonica inbreds; IIs, indica inbreds.
Table 2. Analysis of variance on yield-related traits of different types under different N levels.
TraitsGroupNitrogenYearG × NG × YN × YG × N × Y
Yield******nsnsns
Panicles m2******nsnsnsns
Spikelets panicle−1**ns**nsnsnsns
Grain filling percentage******ns***ns
Grain weight *******ns*ns
Total biomass at maturity******nsnsnsns
Harvest index****nsns*nsns
Biomass accumulation before heading****nsnsnsnsns
Biomass accumulation after heading********nsnsns
CGR during the total growth duration*****nsnsnsns
CGR before heading****nsnsnsnsns
CGR after heading******nsnsns
G, group; N, nitrogen level; Y, year; CGR, crop-growing rate; ns, no significance at the 0.05 probability level; * and **, significance at 0.05 and 0.01 probability levels, respectively.
Table 3. Analysis of variance on yield-related traits of indica-japonica hybrids (IJHs), indica hybrids (IHs), japonica inbreds (JIs), and indica inbreds (IIs) under different N levels in each group of rice.
Traits IJHs IHs JIs IIs
CNC × NCNC × NCNC × NCNC × N
Yieldns**ns**********ns***ns
Panicles m2ns**ns****ns****ns***ns
Spikelets panicle−1nsnsns****ns**nsnsnsnsns
Grain filling percentagens**ns******ns**ns*nsns
Grain weight ns**ns****ns*********ns
Total biomass at maturityns**ns*********nsns**ns
Harvest indexns**ns****ns***nsns**ns
Biomass accumulation before headingns**ns****ns***nsns**ns
Biomass accumulation after headingns**ns**********nsns*ns
CGR during the total growth durationns**ns****ns***nsns**ns
CGR before headingns**ns****nsns**nsns**ns
CGR after headingns**ns**********nsns*ns
IJHs, indica-japonica hybrids; IHs, indica hybrids; JIs, japonica inbreds; IIs, indica inbreds; C, cultivar; N, nitrogen level; CGR, crop-growing rate; ns, no significance at the 0.05 probability level; * and **, significance at 0.05 and 0.01 probability levels, respectively.
Publisher’s Note: MDPI stays neutral with regard to jurisdictional claims in published maps and institutional affiliations.

