Article

Screening Soybean for Adaptation to Relay Intercropping Systems: Associations between Reproductive Organ Abscission and Yield

1
College of Agronomy, Sichuan Agricultural University, Yaan 625014, China
2
Department of Crop and Forest Sciences, University of Lleida–AGROTECNIO–CERCA Center, 25003 Lleida, Spain
3
The Municipal People’s Government Office of Nanchong, Nanchong 637000, China
*
Authors to whom correspondence should be addressed.
These authors contributed equally to this work.
Submission received: 29 August 2022 / Revised: 21 September 2022 / Accepted: 28 September 2022 / Published: 1 October 2022
(This article belongs to the Special Issue Crop Yield and Quality Response to Cultivation Practices)

Abstract

:
The flower and pod abscission is one of the characteristics of soybean that severely limits yield, especially when intercropped with maize. Therefore, suitable soybean cultivars for intercropping are urgently needed to improve farmland productivity. We conducted a two-year field experiment to evaluate the flower and pod abscission, dry matter production, and yield advantages of 15 soybean cultivars. The results of the principal component analysis (PCA) and cluster analysis (CA) showed that 15 soybean cultivars were classified into three groups, i.e., high-yielding group (HYG), mid-yielding cultivars (MYG), and low-yielding cultivars (LYG). In the HYG group, ND12 and GX3 had characteristics of more flowers and pods and less abscission of flowers and pods. Moreover, the net assimilation rate (NAR) and relative growth rate (RGR) of HYG were significantly higher than the other. The HYG obtained a considerably higher partition ratio of 53% from biomass to seed than the other. Therefore, selecting and breeding cultivars with the characteristics of more flowers and pods and less abscission of flowers and pods can help to increase soybean yield in intercropping.

1. Introduction

Although it is predicted that the global cropland area will increase by 0.64% by 2030, the explosive growth of the global population will still cause excessive agricultural land reclamation due to food shortages [1]. Agriculture production needs to find a new way to feed the larger population by utilizing the limited cultivated area. Additionally, developing and using high-yielding and high-quality crops is an effective way to stabilize agricultural production. In terms of the cereal–legume intercropping systems, the integrated intercropping system is an efficient way to increase crop production and intensive use of arable land, which is a worldwide practice by farmers [2,3]. However, the early breeding programs do not select cultivars for the intercropping systems. The cultivars proved their value in monoculture, not intercropping, mainly due to their yield potential. Recently, a new challenge for contemporary breeders and cultivators is to select varieties suitable for intercropping [4].
The purpose of crop variety screening determines the basis for their screening. For example, soybean varieties selected for shade tolerance, herbicide resistance, and pest and disease resistance will strengthen the specified tolerance [5,6,7]. Since soybean breeding and cultivation vary with the growth environment, variety selection has become vital to soybean production. Soybean varieties suitable for intercropping systems might vary considerably depending on their ability to tolerate the interference of the other crop. The relay strip intercropping systems expose soybean to shading from neighboring plants [8,9], which affects soybean vegetative and reproductive growth. When shading happens, soybean leaf area decreases, and the intercepted radiation is limited [10]. In addition, poor growth conditions increase the amount of flower and pod abscission. Soybean will produce twice as many flowers, and excessive flower production per plant only provides an essential precedent condition [11]. Approximately 25% of soybean flowers would develop into pods [12]. Therefore, bringing the abscising characteristics of flowers and pods into the index system suitable for relay strip intercropping soybean cultivar selection is necessary.
Categorizing soybean into different groups is convenient for research on breeding and cultivation. Previous studies classified the local soybean varieties according to the maturity group [13], the environments and planting patterns [14], and so forth. In this article, we will combine flower and pod abscission traits and yield traits to conduct a classification and statistical analysis of soybean. We added classification indicators based on predecessors, hoping to more accurately find soybean varieties suitable for planting in intercropping systems.
Reproductive organ abscission is an important process affecting the pod setting of soybean [15,16,17], which decides the seed number and weight, as well as the final yield [18]. Seed number and weight are the determining factors of soybean yield, which is affected by the number of flowers produced, the number of pods retained on the plant, and the number of seeds per pod [19,20]. However, previous studies confirmed that the vital phase for soybean seed number is the R3–R6 period [21,22], which belongs to the reproductive growth period. Even so, it is better to consider the soybean vegetative growth stages, because the quality of the soybean vegetative growth stage directly determines its flowering time and number [23]. In this context, we divided the soybean growth stages into four periods: vegetative, flowering, podding, and harvesting. Then, we more accurately investigated the number of flowering and abscission flowers, the number of podding and abscission pods, and the yield components. Thus, it helped to more accurately analyze the relationship between flower and pod abscission traits and yield traits.
The process of soybean flowering, pod formation, and yield formation is also the process of accumulation and distribution of its internal substances. Reasonable and effective biomass accumulation and distribution will increase the number and weight of soybean seeds, which is an important approach for improving soybean yield [22,24]. Researchers usually use different growth parameters to measure the crop’s growth trajectory in terms of crop growth rate (CGR), relative growth rate (RGR), and net assimilation rate (NAR) [25]. Soybean CGR and RGR are determined by aboveground biomass accumulation per day per unit area, and NAR is measured using the active leaf area and biomass production [26,27]. Those crop growth parameters are the estimate of soybean growth, reflected in the rate of net photosynthetic carbon assimilated into organs. In this paper, combined with the above soybean growth parameters, we can further analyze the difference in net photosynthesis rate, biomass accumulation, and partition between different soybean groups.
The traditional selection of soybean cultivars is mainly based on yield and agronomic characteristics. Our current research analyzes and classifies soybean cultivars according to the features of the abscission of flowers and pods, as well as the grain yield. The results of this study will be beneficial to breeding and selecting cultivars best adapted to the intercropping systems. The aims of this study were as follows: (1) to classify the relay strip intercropped soybean cultivars by analyzing the flower and pod abscission traits and yield variation, and (2) to analyze the features of flowers and pods abscission, dry matter accumulation, and partition of the high-yielding soybean group.

2. Materials and Methods

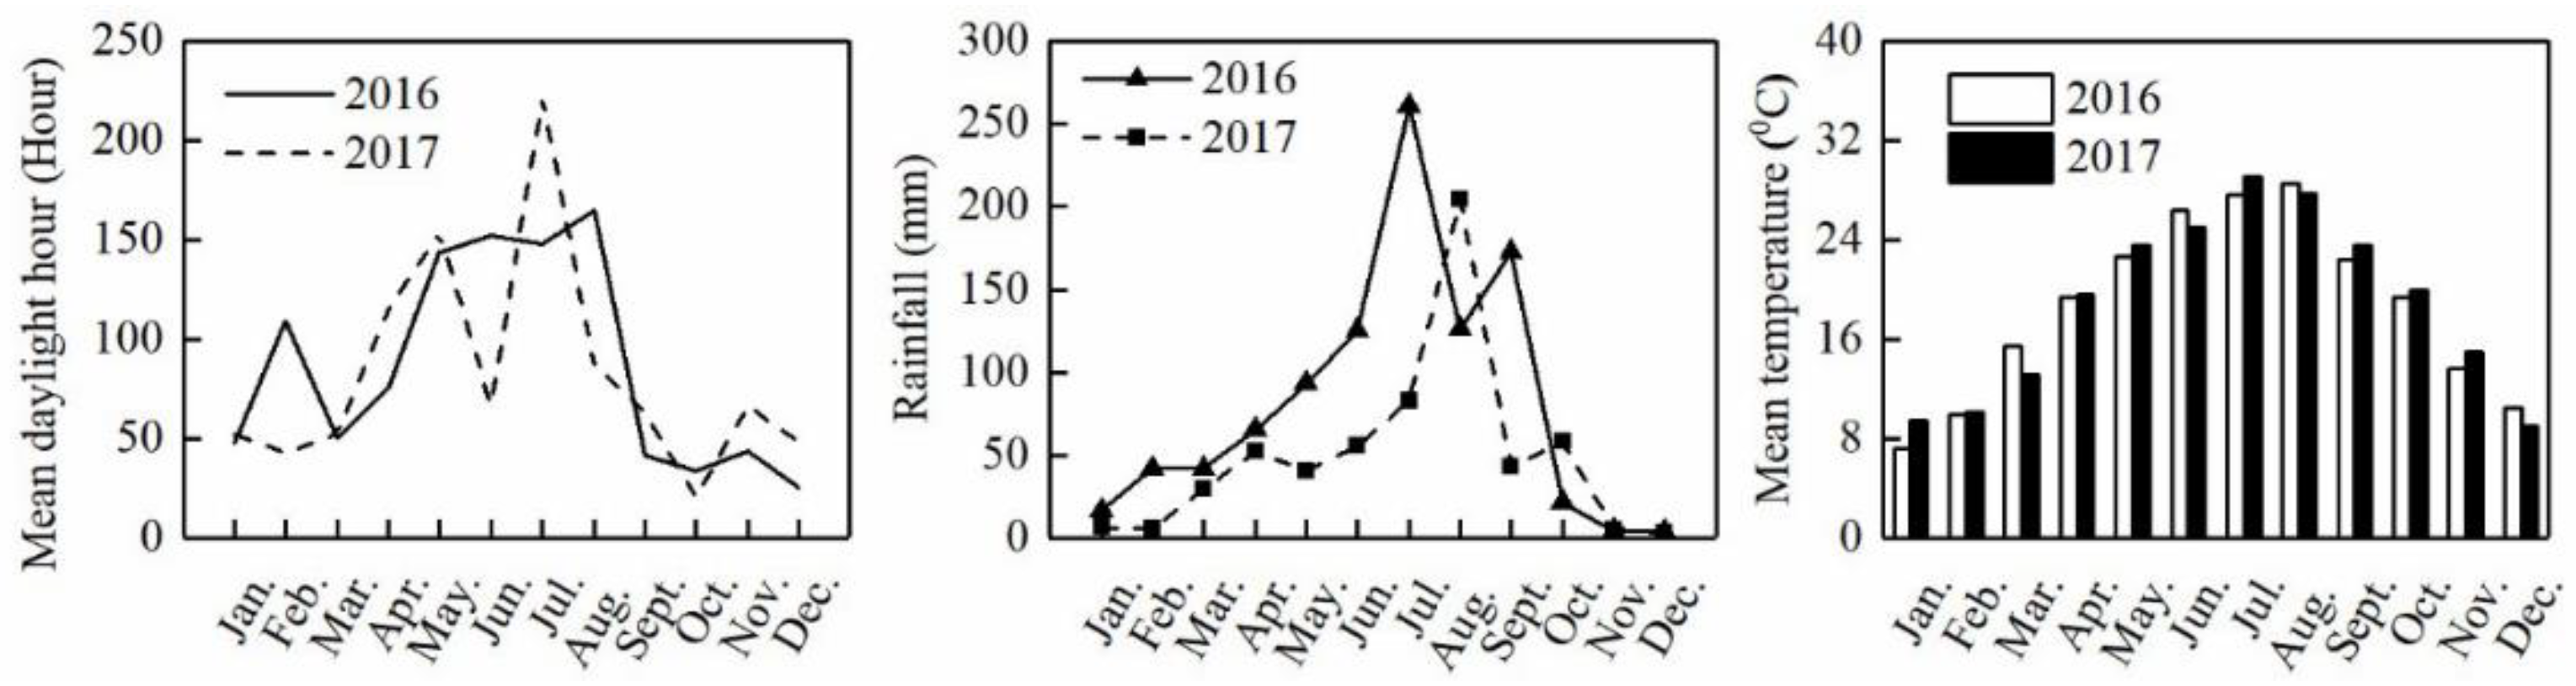
2.1. Experiment Sites

The field experiment was conducted in Renshou Sichuan province, Southwestern China (29°40′–30°16′ N, 104°00′–104°30′ E) over two growing seasons from 2016 to 2017. The climate was subtropical monsoon humid, with an annual temperature of 19.4 °C, annual precipitation of 779.6 mm, and annual sunshine of 1012.7 h (Figure 1). This experiment includes 15 soybean cultivars. The background information is shown in Table S1, and all 15 soybean cultivars and the maize cultivar Chuandan 418 are major production cultivars. The field soil texture is clay loam [28], with a pH of 8.1, organic matter (OM) of 14 g kg−1 [29], total nitrogen (TN) of 1.12 g kg−1 [30], total phosphorus (TP) of 1.85 g kg−1 [31], total potassium (TK) of 24.80 g kg−1 [32], alkaline hydrolyzed N (AN) of 120 mg kg−1, and available P (Olsen-P) of 16 mg kg−1 [33].

2.2. Experiment Design and Field Management

A total of 15 soybean cultivars were grown in the maize–soybean relay strip intercropping system. All treatments were replicated three times in a single factor complete random design. The wide–narrow row planting pattern was used in the maize–soybean relay strip intercropping system [2]. Maize was planted in narrow rows with a row spacing of 0.4 m, and soybean was planted in wide rows with a row spacing of 0.4 m. The interspecific row spacing between the maize and soybean was 0.6 m. The hole spacing was 0.17 m for all crops, and one seedling for maize and two seedlings for soybean. The plant densities of maize and soybean were 58,500 per ha and 117,000 per ha. All nitrogen (N), phosphate (P), and potassium (K) fertilizers were applied as the base fertilizer with the amount of 240 kg N ha−1, 70 kg P2O5 ha−1, and 90 kg K2O ha−1 for maize, and 30 kg N ha−1, 63 kg P2O5 ha−1, and 52.5 kg P2O5 ha−1 for soybean, respectively. Maize was sown on 10 April 2016 and 5 April 2017 and harvested on 28 August 2016 and 7 September 2017, respectively. Soybean was sown on 8 June 2016 and 10 June 2017 and was harvested on 25 October 2016 and 4 November 2017, respectively.

2.3. Plant Sampling and Measurements

The soybean growth period was identified according to Fehr et al. [34]. Before the soybean beginning flowering (R1) stage, eight soybean plants were selected and labeled in each plot. A self-made collection device was installed on the labeled plants for collecting fallen flowers and pods. The labeled plants were divided into the bottom layer (1–6 nodes), the middle layer (7–12 nodes), and the top layer (13 nodes and above) according to the nodes on the main stem. We counted the abscised flowers and pods at 3:30 PM every two days from R1 to the full seeds stage (R6). The self-made collection device was maintained on the labeled plants until the full maturity stage (R8) to investigate the mature pods per plant.
Another eight plants from each plot were sampled to measure soybean leaf area and aboveground biomass at the fifth trifoliolate stage (V5), the full bloom stage (R2), the full podding stage (R4), and the R8 stage. Four leaf discs (diameter 12 mm) were punched from each of the 10 soybean leaves. Then, all sampled leaves (without petiole and yellow leaves), stems, pods, and seeds were oven-dried at 105 °C for 30 min and weighed after constant weight at 75 °C. The per plant leaf area was calculated based on the leaf discs area and dry weight. At the R8 stage, 10 consecutive plants were harvested from each plot. Then, the effective pods per plant, seed number per pod, and 100-seed weight were counted to calculate grain yield.

2.4. Calculation and Statistical Analysis

The per plant leaf area was calculated as follows:
Leaf area per plant = (disc area/disc dry weight) × leaf dry weight per plant
Soybean flower and pod abscission characters indexes, i.e., total flower number (FN, No.), flower abscission (FA, No.), flower abscission rate (FAR, %), pod abscission (PA, No.), pod abscission rate (PAR, %), and pod number (PN, No.) [35] were calculated as follows:
FN = FA + PA + PN
FAR = FA/FN × 100%
PAR = PA/PN × 100%
Crop growth parameters, including relative growth rate (RGE), net assimilation rate (NAR), and crop growth rate (CGR) [25] were calculated as follows:
RGR = (lnW2 − lnW1)/(T2 − T1)(g g−1 day−1)
NAR = ((W2 − W1) (T2 − T1)) × ((lnA2 − lnA1)/(A2 − A1))(g m−2 day−1)
CGR = (1/p)(W2 − W1)/(T2 − T1)(g m−2 day−1)
where W is aboveground dry weight, A is leaf area, T is sampling date, and subscripts 1 and 2 denote different sampling dates. The CGR was assessed based on the change in crop aboveground dry matter per unit land area between two sampling dates. In this experiment, the soybean’s land sharing ratio (p) was 0.5.
The analysis of variance (ANOVA) and cluster analysis (CA) was performed using IBM SPSS Statistics v.22.0 (SPSS Inc. Chicago, IL, USA). The least significant difference (LSD) method was used for multiple comparisons at p < 0.05. The principal component analysis (PCA) was performed using Origin 2019 (OriginLab, Northampton, MA, USA).

3. Results

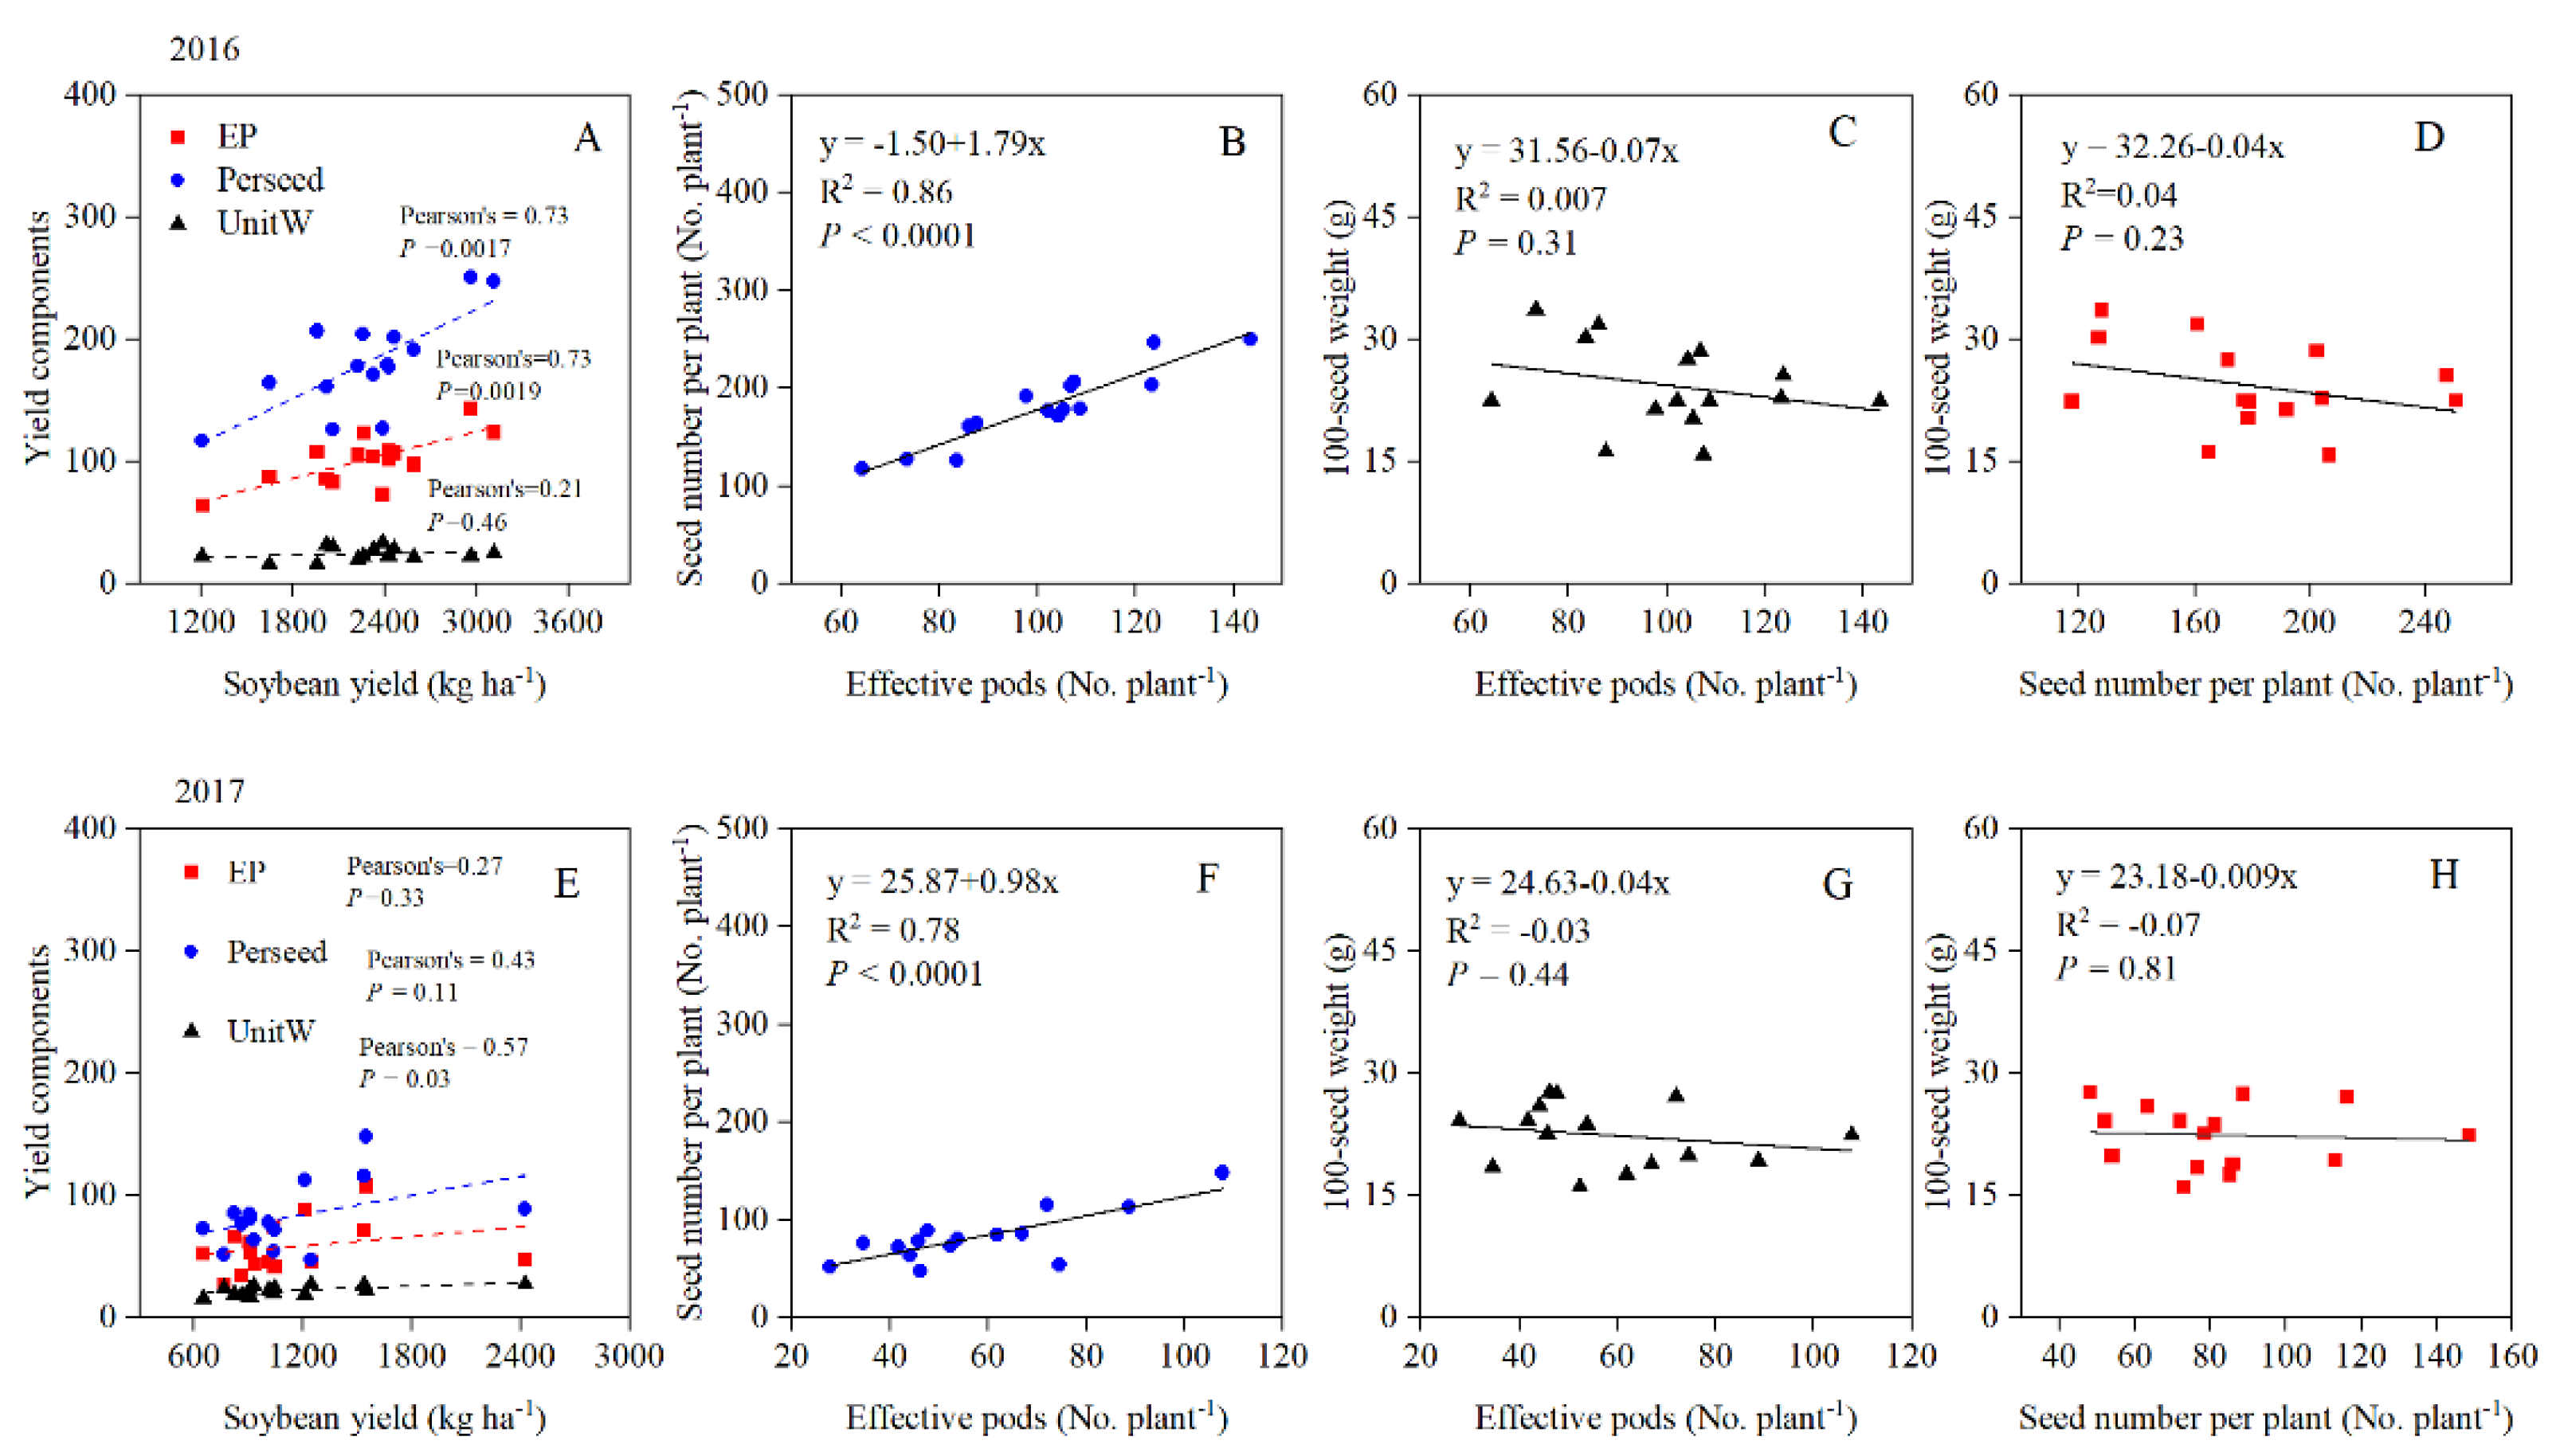
3.1. Yield and Yield Components

Soybean yield was significantly positively correlated with effective pods and seed number per plant in 2016 (Figure 2A) and 100-seed weight in 2017 (Figure 2E). The seed number per plant significantly increased with the increase in effective pods (p < 0.0001, Figure 2B,F). The 100-seed weight was independent of the effective pods (Figure 2C,G) and the seed number per plant (Figure 2D,H).

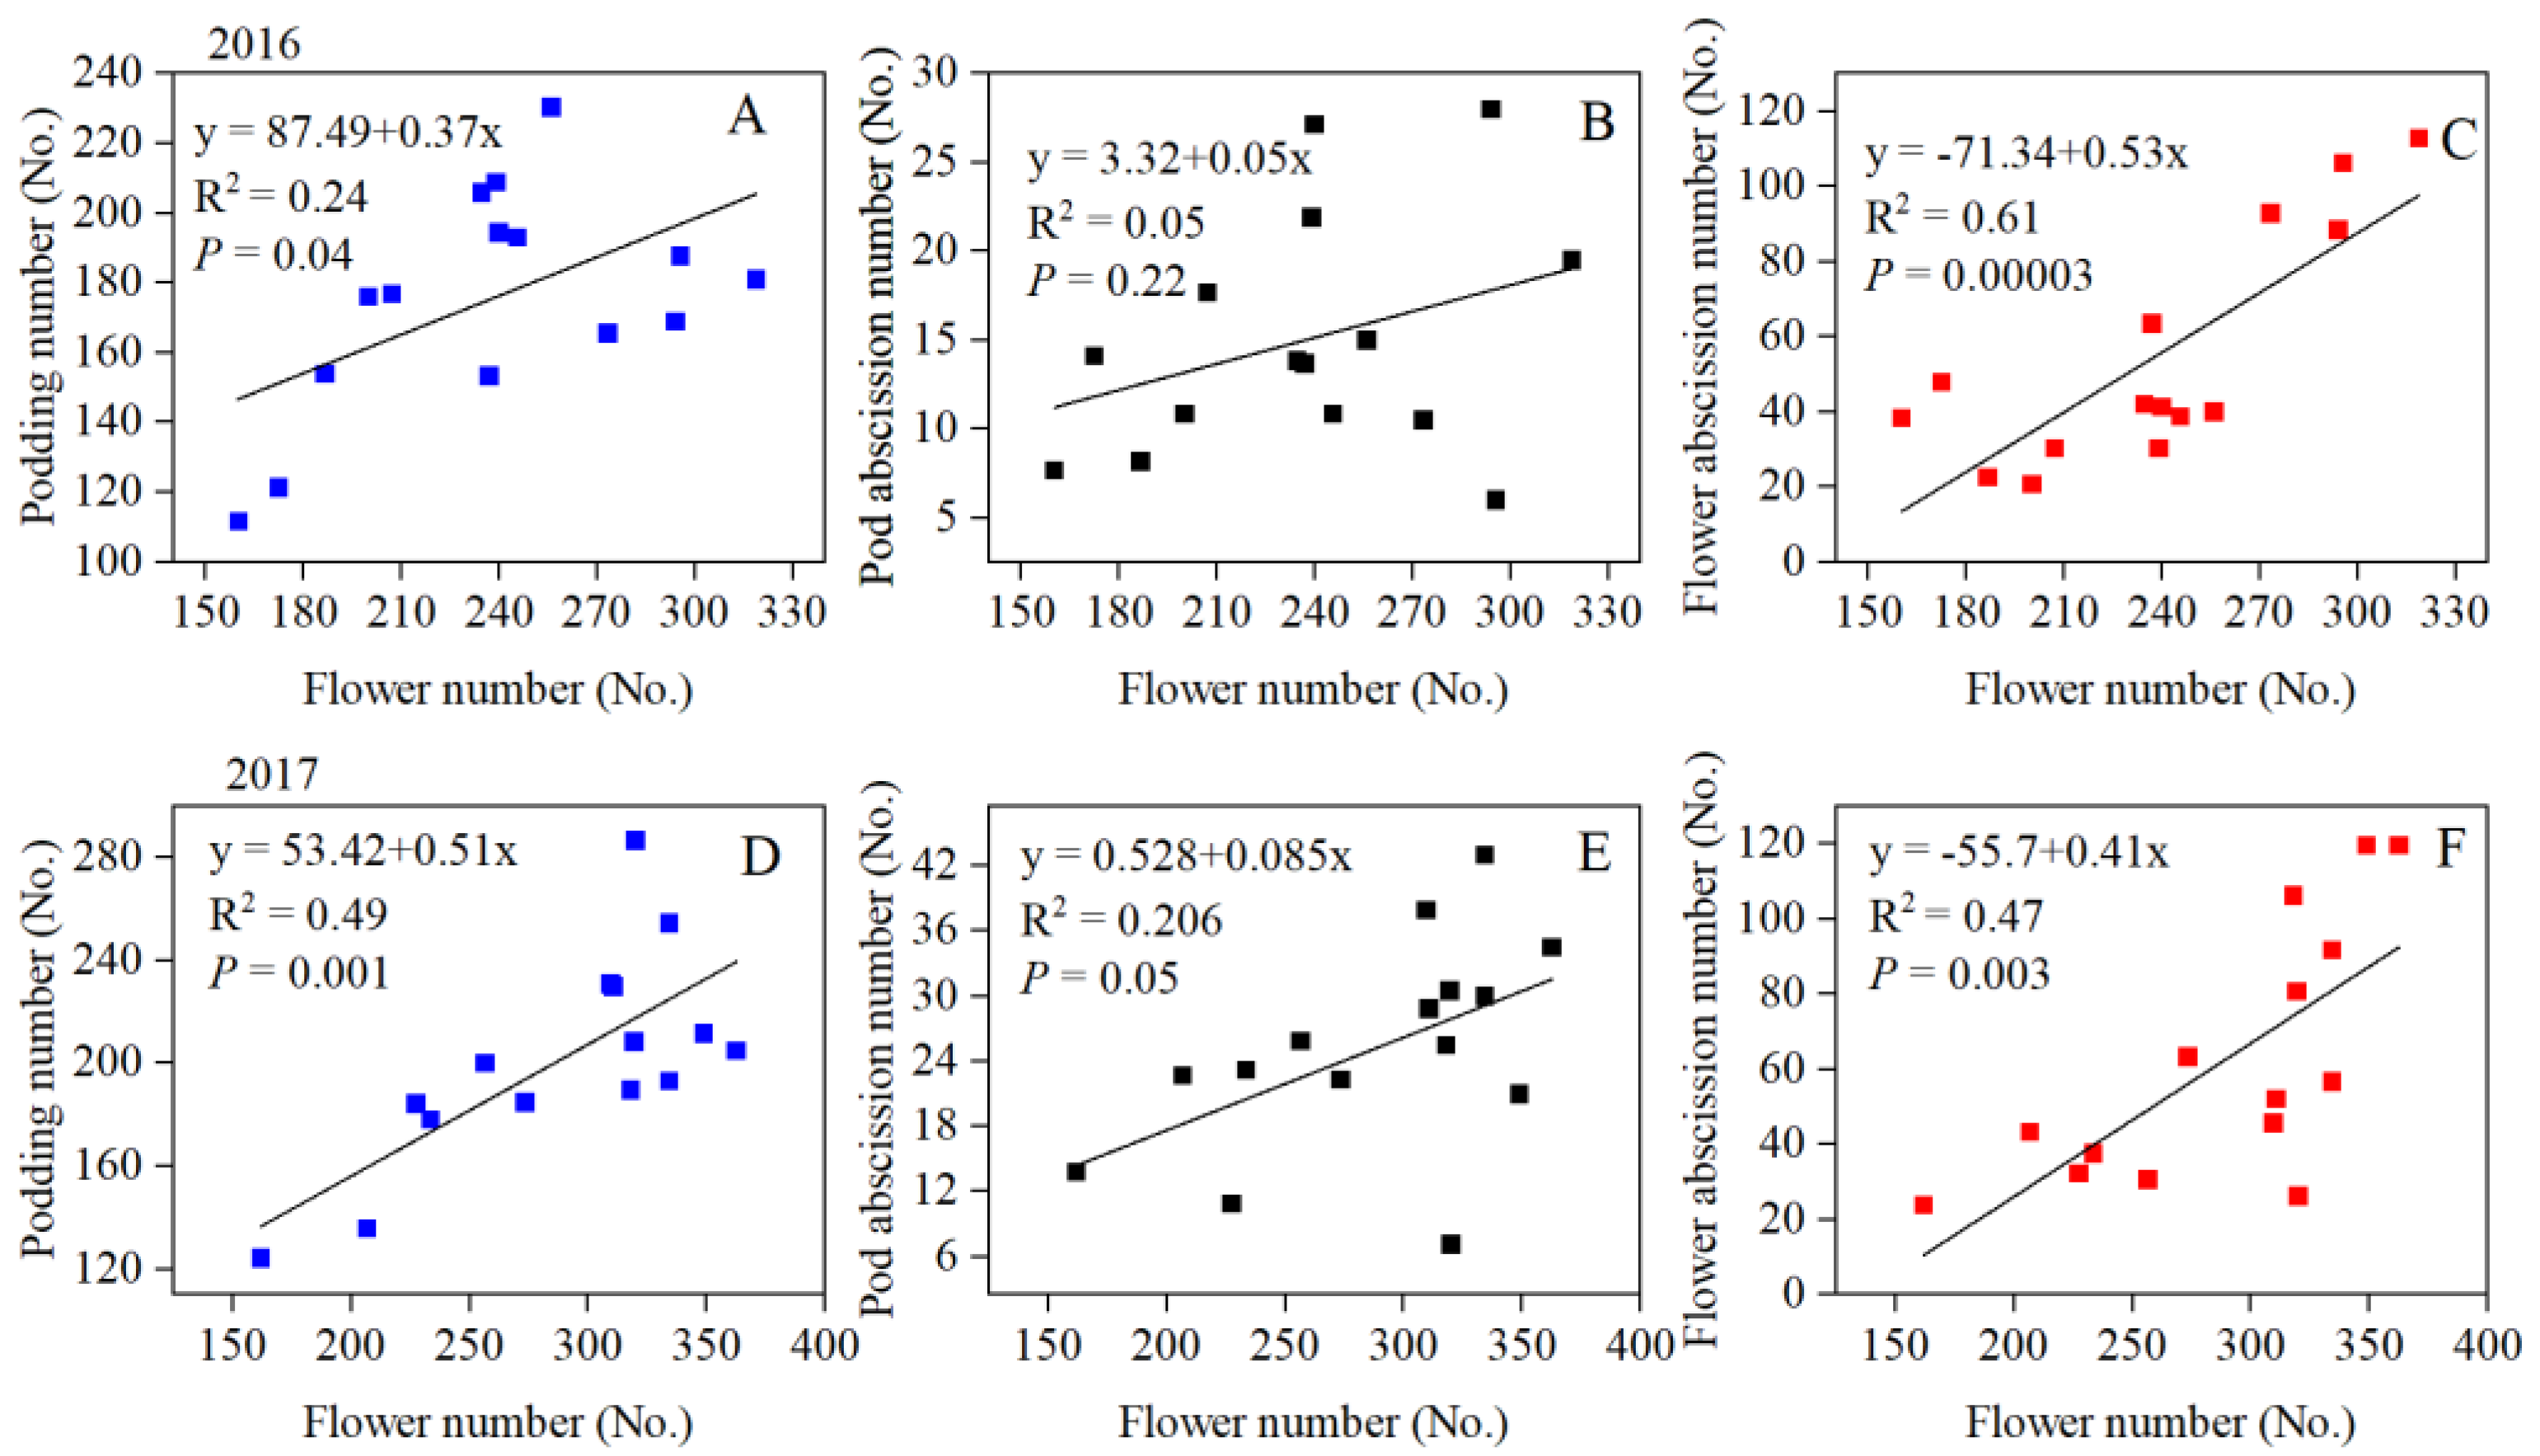
3.2. Flower and Pod Abscission Characters

In the two-year experiments, soybean flower number was remarkably positively associated with the podding number (Figure 3A,D) and flower abscission number (Figure 3C,F). Although, the pod abscission number increased with the increase in flower number, the correlation between pod abscission number and flower number was not significant (Figure 3B,E).

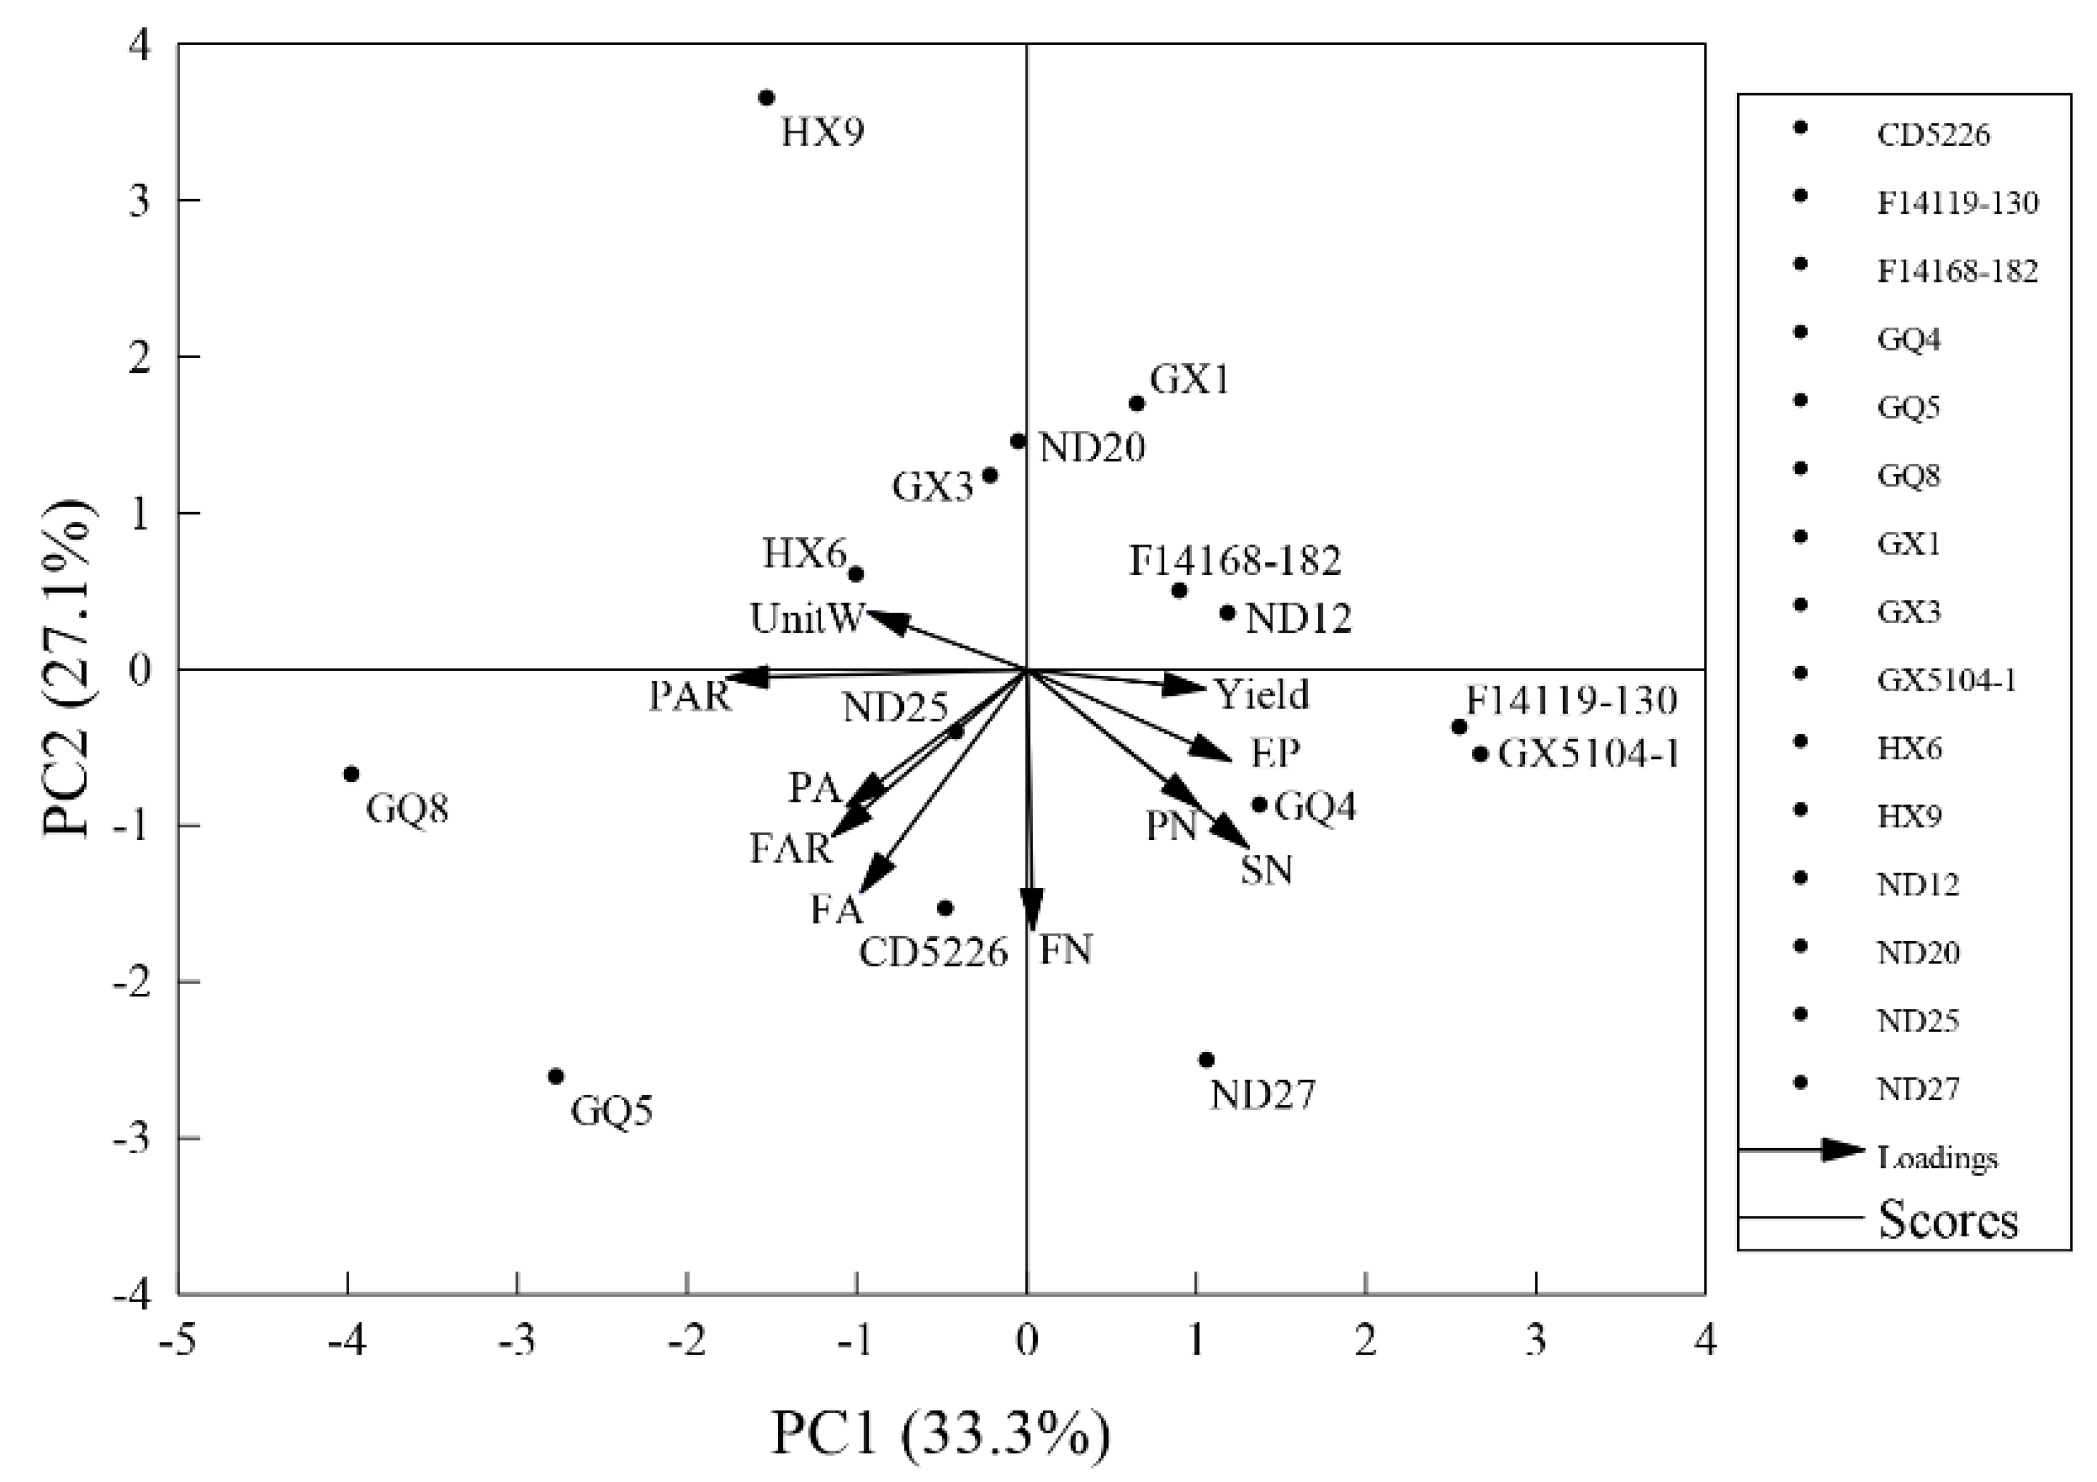
3.3. Principal Component Analysis (PCA) on Agronomic Traits

The results of the PCA analysis indicated that three principal components (PC) were identified (Figure 4, Tables S2 and S3). The top three principal components explained a total variation of 77.7%, principal component one (PC1) accounted for 33.3%, principal component two (PC2) accounted for 27.1%, and principal component three (PC3) accounted for 17.4%. The top three critical variables for PC1 were abscission pods rate, seeds per plant, and effective pods. Therefore, the PC1 was identified as the soybean pods’ development character. Moreover, the soybean pods’ development character placed in the fourth quadrant in the loading plot was close together with soybean yield and, therefore, positively correlated. The PC2 was identified as the soybean flowers’ development character, characterized by the flower number, flower abscission, and flower abscission rate. Meanwhile, flowers’ development characters were placed in the same quadrant and positively correlated with each other. Moreover, the PC3 was recognized as the soybean yield components character. The yield components characters included pod number, 100-seed weight, and grain yield. In the loading plot, yield was placed in the fourth quadrant, however, the pod number and 100-seed weight were placed in the third quadrant. Thus, pod number and 100-seed weight were negatively correlated with grain yield.

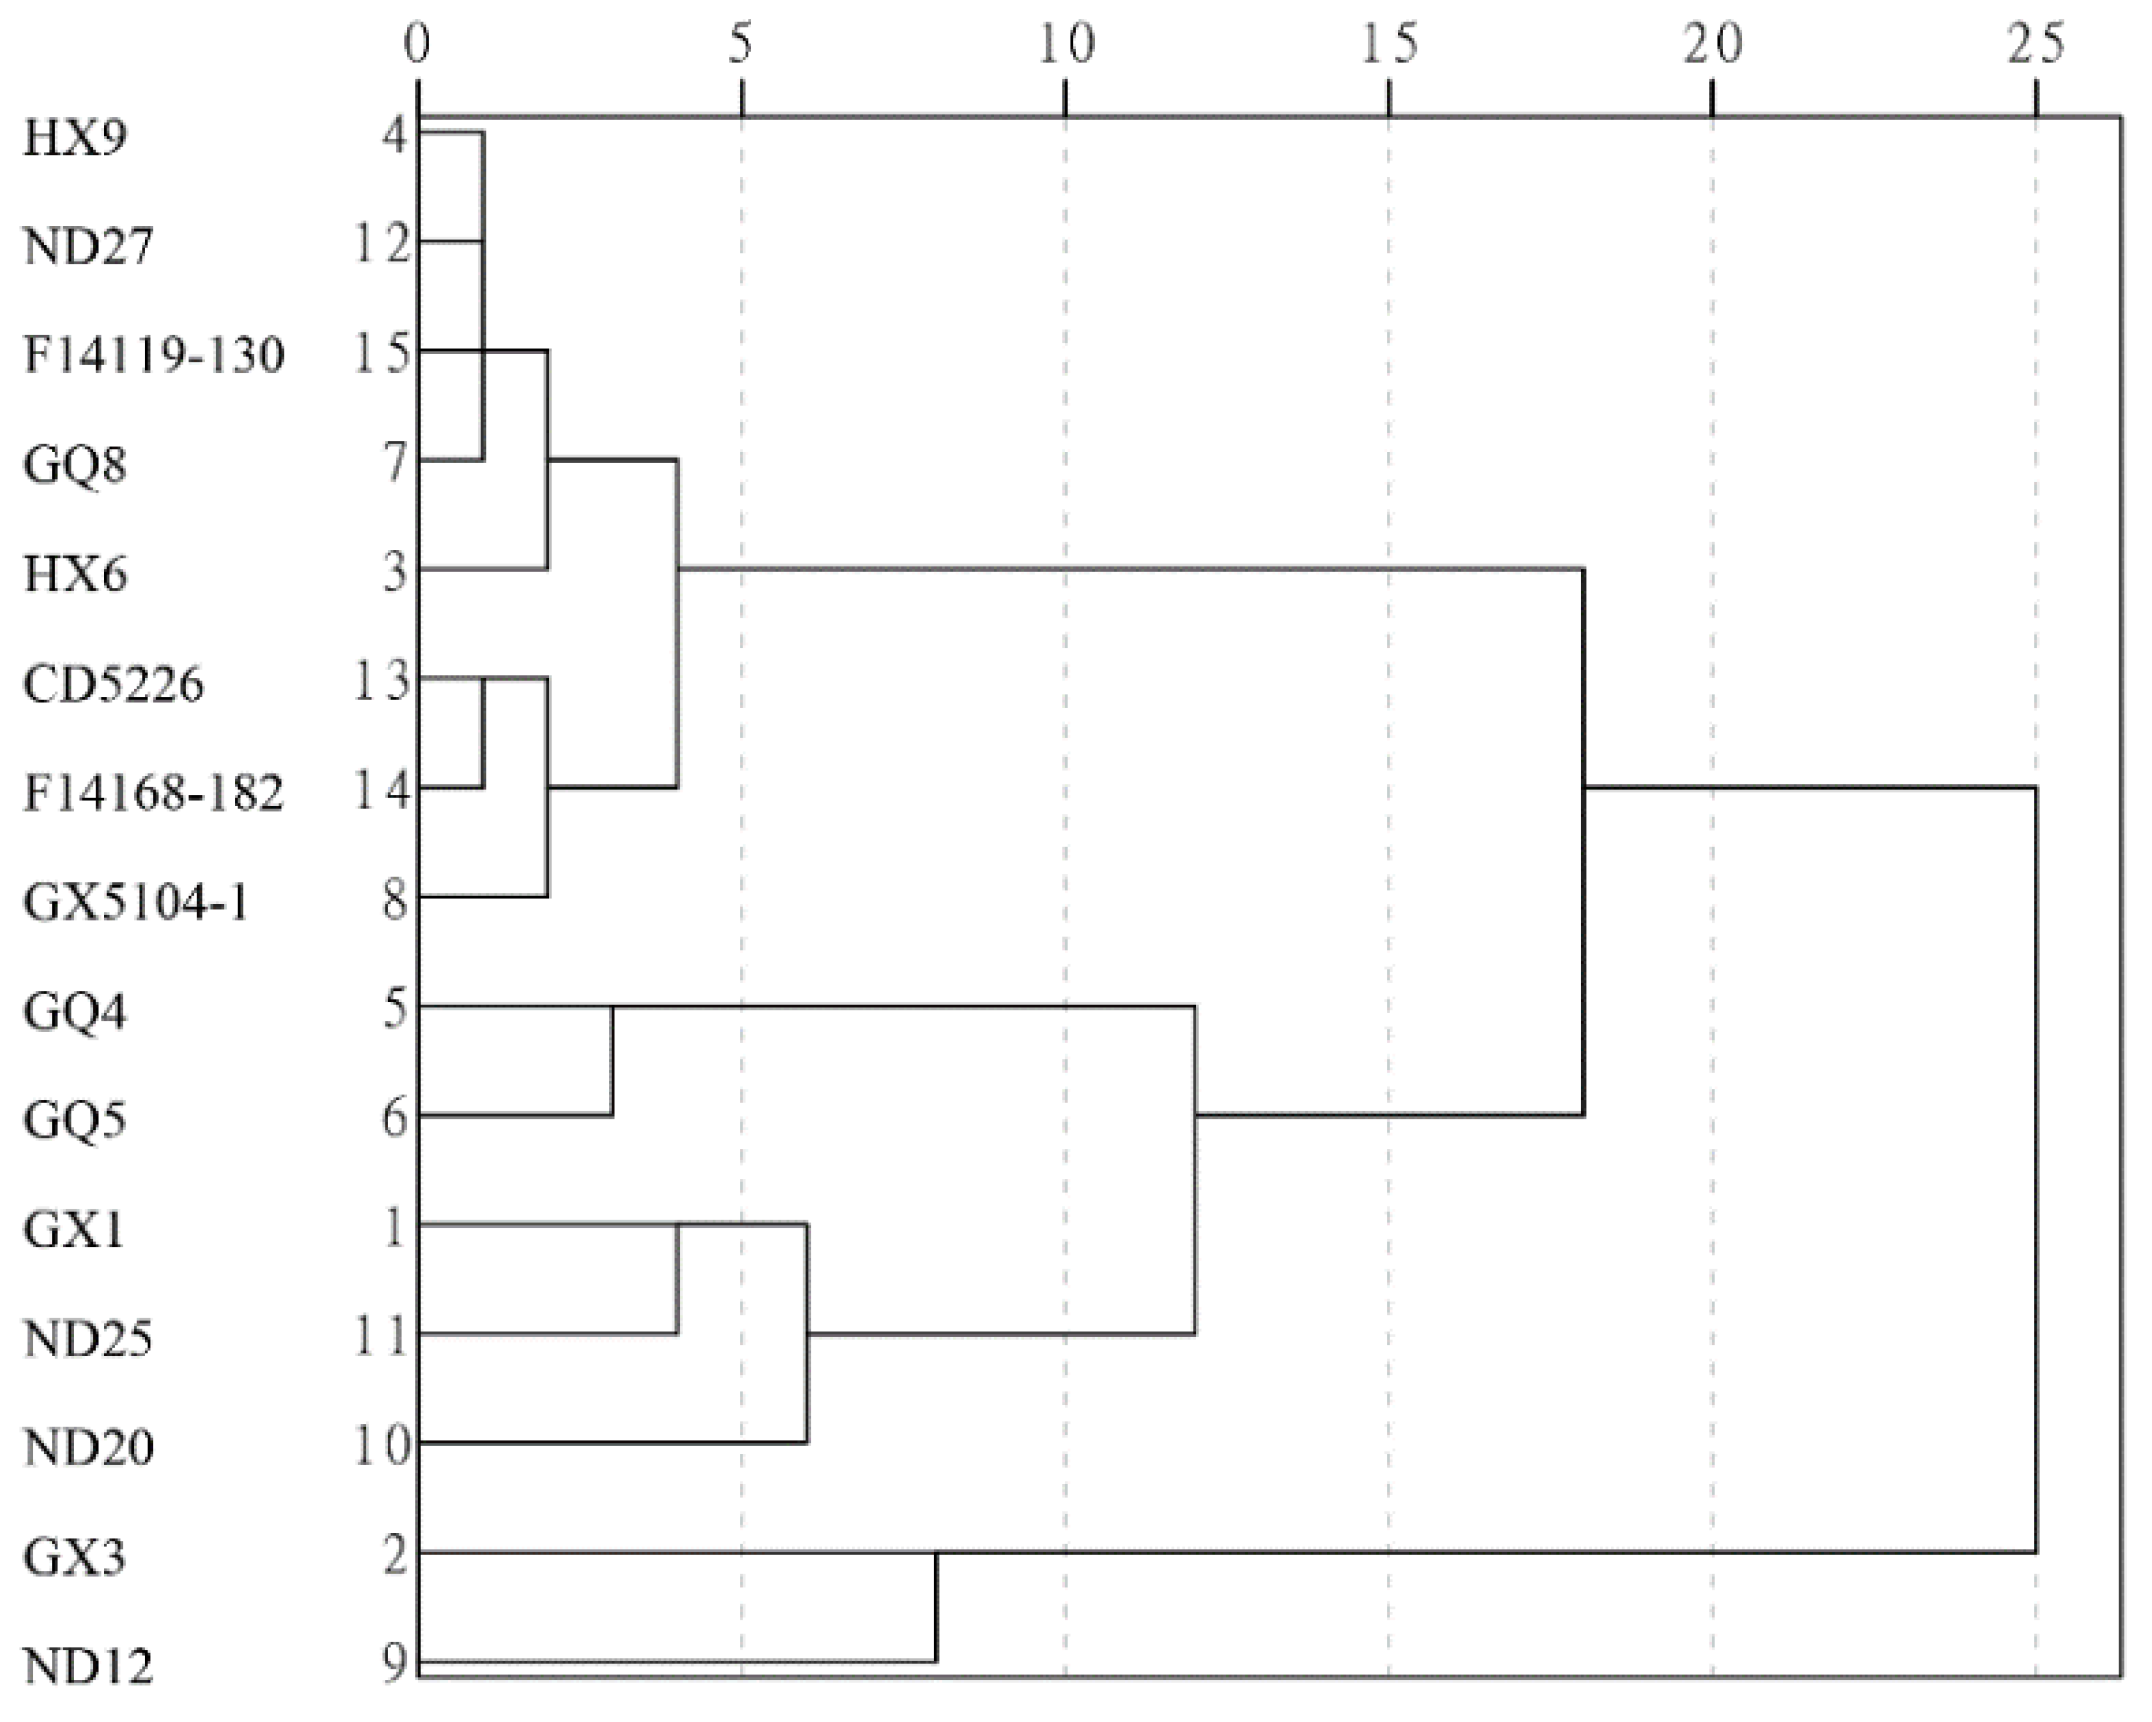
3.4. Cluster Analysis (CA) of Soybean Cultivars Based on PCA

Three new variables of principal component analysis were used for the cluster analysis. According to group analysis, n variables can form an m group (m < n). In other words, genotype group analysis should be classified based on the similarity rate of separated groups [36]. The method of average linkage between groups was used for cluster analysis (Figure 5). The results of the cluster analysis indicates that soybean cultivars can be classified into three groups (Tables S4 and S5). The first group was high-yielding cultivars, including GX3 and ND12. The two soybean cultivars both had the highest yield, seeds number, flowers and pods number, as well as the lowest flower abscission rate and pod abscission rate. The second group was low-yielding cultivars, i.e., GQ4, GQ5, GX1, ND25, and ND20, characterized by the lowest yield, effective pod, seed number, and flower and pod abscission characteristics (abscission number and abscission rate). In contrast, the 100-seed weight of the low-yielding group was the highest among the three groups. Finally, the rest of the cultivars, i.e., HX9, ND27, F14119-130, GQ8, HX6, CD5226, F14168-182, and GX5104-1 were categorized as the mid-yielding group. The mid-yielding group was characterized by the highest number of effective pods; the lowest flower number, pod number, and pod abscission; the mid-level of seed number, flower abscission, flower abscission rate, and pod abscission rate.

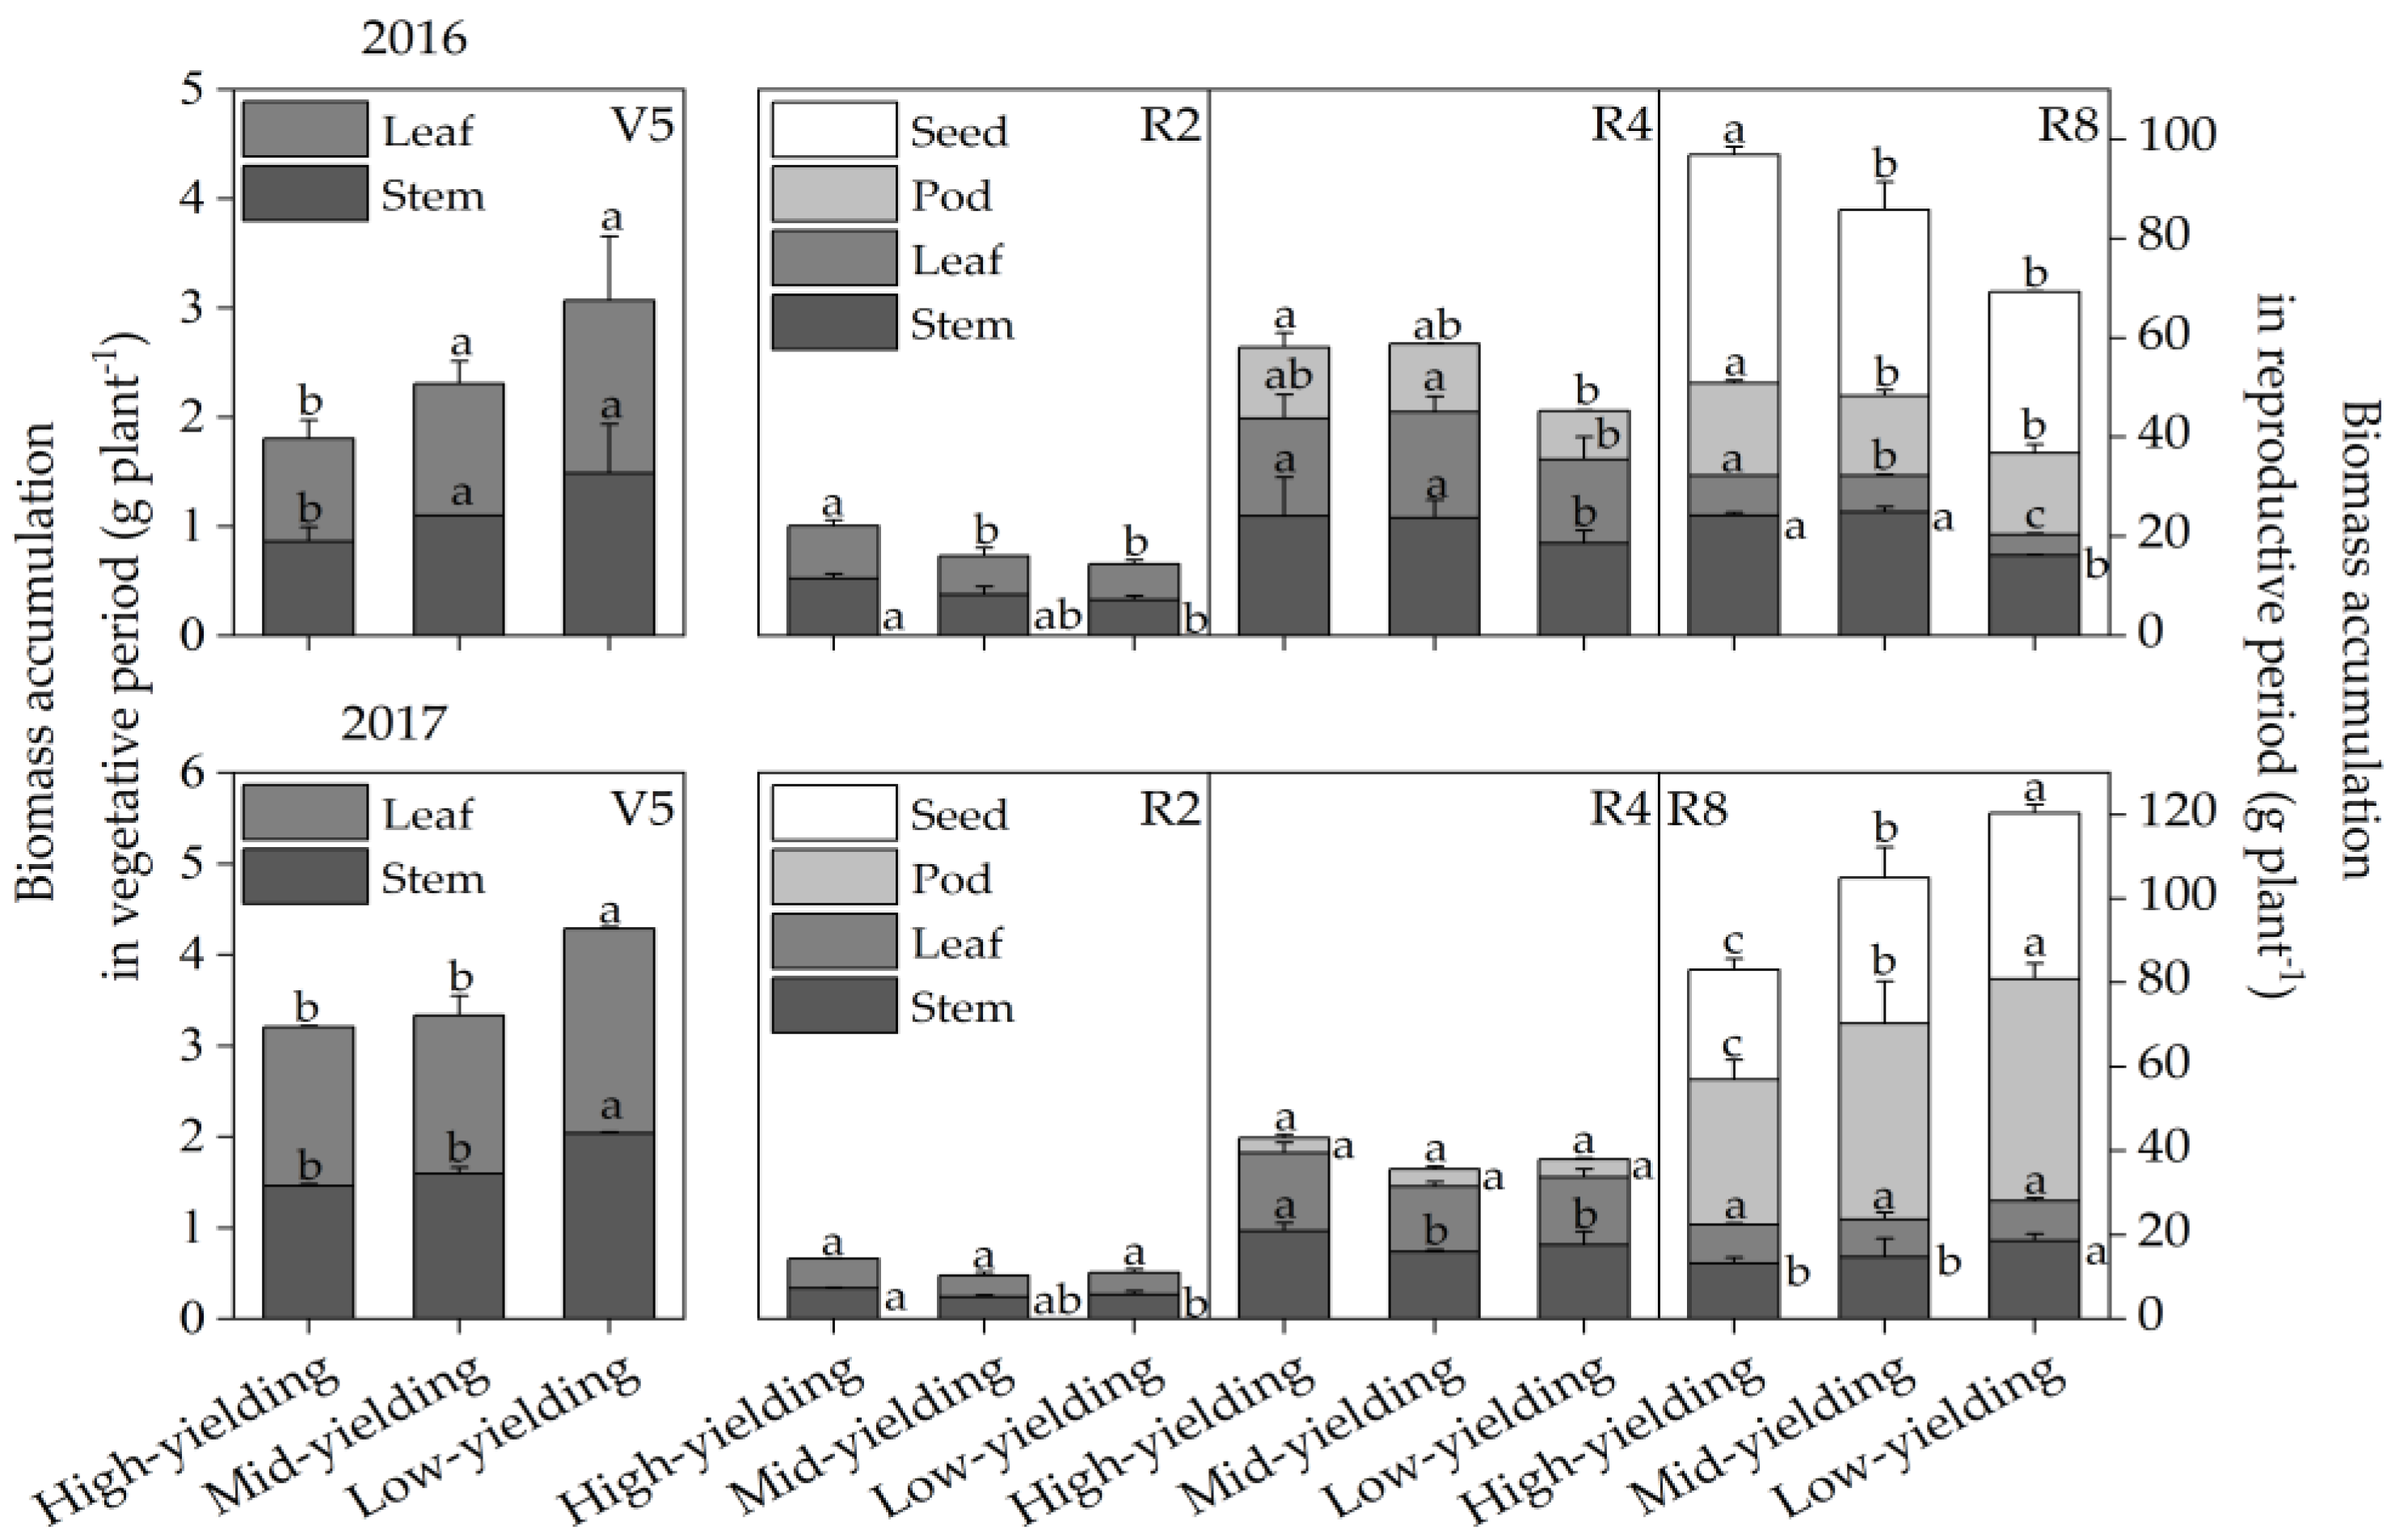
3.5. Biomass Accumulation of High-, Mid-, and Low-Yielding Cultivars

At the V5 stage, the biomass of the low-yielding group was significantly higher than both the high- and mid-yielding groups (Figure 6). At the R2 and R4 stages, the biomass of the high-yielding group was considerably higher than the other. Meanwhile, more biomass of the high-yielding group was partitioned to the stem rather than leaf or pod at the R4 stage. At the R8 stage, the biomass partitioned to the seed peaked in the high-yielding group compared to the other.

3.6. Crop Growth Parameters

The leaf area of the high-yielding group was significantly lower than the mid-yielding and low-yielding groups at the V5 stage (Table 1). However, the leaf area among the three groups did not differ at the R2 and R4 stages. The biomass accumulation was affected by the leaf area. Although the biomass of the high-yielding group was the lowest among all groups at the V5 stage, a more robust increase in biomass was obtained in the high-yielding group rather than the other at the R2 and R4 stages. Finally, the seed weight per plant peaked in the high-yielding group in 2016.
The results showed that the net assimilation rate (NAR) and relative growth rate (RGR) of the high-yielding group were significantly higher than the other in the vegetative phase (V5-R2). In the reproduction period (R2-R4 and R4-R8), the RCG was not different among the three groups. Although the crop growth rate (CGR) of the high-yielding group was notably higher than the mid- and low-yielding groups in the V5-R2 period, no differences were observed among the three groups in the R2-R4 and R4-R8 periods.

4. Discussion

4.1. Reasonable Vegetative and Reproductive Growth of the High-Yielding Group Will Decrease Flower and Pod Abscission under Relay Strip Intercropping Systems

Soybean plants will produce numerous flowers and pods, from bottom to top. Excessive flowers formed per plant may be a precondition to reproductive prosperity in soybean. However, most flowers and young pods will be abscised rather than develop into mature pods [37]. The previous study documented that the flower number per plant is not the uppermost factor determining the final pod number per plant [11]. However, too many flowers and pods were abscised, which will negatively affect the grain yield. The reproductive organs of soybean, flower, and pod development also play a critical role in the number and weight of soybean seeds and ultimately becomes the key to soybean yield [20]. In this study, the linear regression results showed that the number of effective pods was a suitable indicator for soybean yield. The number of pods was positively correlated with the seed number per plant and the number of flowers (Figure 2B–F and Figure 3A–D). Simultaneously, the PCA and CA analyses indicated that the abscission number of flowers and pods of the high-yielding group was also the lowest (Figure 4 and Figure 5, Table S5). It shows that one of the ways to maintain the high-yielding group’s yield is by reducing the abscission number of flowers and pods.
The difference in abscission characters between soybean groups was regulated by their podding habits, growth environment, and growth stages [18]. The cultivars can be classified into early-, medium-, and late-maturing cultivars according to the mature period. There was a significant negative correlation between the rate of abscised reproductive organs and the number of days of flowering and pod formation [19]. Extending the soybean flowering and pod-forming period will be beneficial to reducing flower and pod abscission [16]. The results of CA analysis showed that the high-yielding group was characterized by middle–late maturing, e.g., GX3 and ND12. The middle–late maturing cultivars had a longer reproductive period after flowering than the early maturing cultivars (Figure 5 and Table S4). This may be one reason why the high-yielding group achieved the highest rate through forming more flowers and pods, and fewer flowers and pods were abscised. In contrast, the higher abscission of flowers and pods was observed in the early-maturing soybean (GX1), possibly due to the shorter reproductive period. Although GQ8 (the middle-maturing cultivar) formed many flowers, most of the flowers were abscised. After a relatively longer compensation growth, the middle-maturing cultivar obtained a greater yield than the early-maturing cultivar. This indicated that the duration of soybean reproductive growth affects the development and abscission of flowers and pods when growing up in the relay intercropping system.
The relay intercropping system showed a notable difference between the soybean vegetative and reproductive periods. Because soybean flowering and pod development are simultaneous and the coexistence period is longer, there is a long-term nutrient competition among reproductive organs during this period [38,39]. Therefore, there will be a higher requirement for the adaptability of soybean cultivars for the relay intercropping system. Simultaneously, photosynthate supply has been implicated in the control of abscission. Within a few days after flowering, the ovary and ovule of soybean begin to develop rapidly by consuming many nutrients [40,41]. However, due to the increased competition for photosynthate between reproductive organs, the lack of nutrients will not be able to meet the needs of flowers and immature pods, eventually leading to abscission [38]. In the present study, CGR, RGR, and NAR interactions were insignificant between groups and years (Table 2). However, the RGR of the two cropping seasons significantly differed during the R2-R4 period (Table 2), mainly because the rainfall from August to September in the two years was quite different; this period happens to be the flowering and podding stages of soybean. Although the three groups’ CGR, RGR, and NAR were significantly different in the V5-R2 period, the differences among the three groups were insignificant in the subsequent growth periods (Table 2). This is because after the end of shading (the maize was already harvested in the relay intercropping system), the leaf area and biomass accumulation in the V5 and R2 stages were significantly different among cultivars (Table 1). At the same time, it reflects the unique characteristics of the relay intercropping system as the shading from maize ends in the reproductive transition period (before flowering) of soybean. It indicated that the high adaptability of the high-yielding group was better than that in the other two groups.
The maize–soybean relay intercropping systems are characterized by the harvest of maize being earlier than the flowering of soybean. Therefore, cultivars with better adaptability are needed. The high-yielding group was more adaptable in this critical reproductive transition period because the CGR, RGR, and NAR were significantly higher than those of the middle-yielding and low-yielding groups. Additionally, it demonstrated that the high-yielding cultivars with an adequate photosynthetic capacity would decrease their abscission of flowers and pods.

4.2. Enlightenment of Relay Intercropping System Based on Soybean High-Yielding Varieties to Improve Soybean Yield

Environmental conditions are the uppermost factors determining the final surviving flower and pod numbers [11]. Sufficient light significantly decreased the abscission rate of flowers, while shading significantly increased it [7,42,43]. Then, the variation in flowering results in the change in pod number per plant. In the maize–soybean intercropping system, the soybean biomass was positively correlated with soybean yield, but the proportion of stem biomass was significantly negatively correlated with yield when soybean photosynthesis was suppressed [44]. In the present study, soybean suffers from maize shading during the coexistence period, leading to lower biomass in the high-yielding group than in the mid- and low-yielding groups (Figure 6). However, the high-yielding group owned a longer branching stage and accumulated more dry matter than the other during the recovery growth of soybean [45]. After the maize harvest, a more robust recovery growth was observed in the high-yielding group rather than the mid- and low-yielding groups. This indicates that under shading stress, the high-yielding group could make up for the defects in the early stage. Although the light resources limited the high-yielding group during the coexistence period, a greater dry matter was partitioned to leaves other than stems. The higher biomass allocated to leaves in the high-yielding group than in the other groups is probably the reason for the high yield.
Previous studies reported that the shaded environment in intercropping limits soybean growth and decreases grain yield [42,46]. Plants can determine the light environment by sensing changes in the ratio of red to far-red lights from the environment [47]. Generally, plants have two phenotypes when suffering from shading, that is, shade-avoidance and shade-tolerant. In this article, ND12 and F14119-130, as shade-tolerant soybean cultivars have better tolerance and recovery growth ability than shade-avoidance soybean cultivars. From the reproductive growth to the maturity stage, the biomass accumulation of high-yielding cultivars gradually increased, and there was no significant difference between the three types in the end (Figure 6). The mid-yielding group partitioned more biomass to the stem, however, the high-yielding cultivars allocated 53% of biomass to the leaf than other organs (Figure 6). Moreover, the NAR and RGR of the high-yielding group were significantly higher than the others in the V5-R2 period (Table 2). This indicated that we should breed shade-tolerant cultivars with middle- or longer maturing characters for the relay intercropping systems, which benefit more from the recovery growth.

5. Conclusions

In this study, we tested 15 soybean cultivars widely applied for the maize–soybean relay strip intercropping system and provided the indexes, e.g., the flower and pod abscission, dry matter production, and yield advantages, for the specific soybean screening and breeding for relay intercropping. The soybean cultivars were classified into three groups based on the PCA and CA analyses. ND12 and GX3 belonged to the high-yielding group and owned higher yields than the mid- and low-yielding groups. High-yielding cultivars had a strong tolerance in the shaded environment. During the reproductive growth period, soybean flowers and pods had a shorter coexistence period to avoid nutrient competition. Finally, high-yielding cultivars achieved more flowers and pods, fewer flowers and pods abscised, and then they achieved a yield advantage.

Supplementary Materials

The following supporting information can be downloaded at: https://0-www-mdpi-com.brum.beds.ac.uk/article/10.3390/agronomy12102379/s1, Table S1: Background information on the measured soybean cultivars; Table S2: Variability analysis on agronomy traits of the fifteen soybeans under maize-soybean relay intercropping; Table S3: Eigenvectors of leading principal components; Table S4: Classification result of soybean cultivar; Table S5: Mean value of agronomic traits of High-yielding, Mid-yielding and Low-yielding soybean.

Author Contributions

Conceptualization, Q.D., P.C., W.Y. and T.Y.; methodology, Q.D., P.C., W.Y. and T.Y.; investigation, Q.D.; writing—original draft preparation, Q.D. and P.C.; writing—review and editing, Q.D., P.C., B.Z., Y.H., W.Y. and T.Y.; funding acquisition, W.Y. and T.Y. All authors have read and agreed to the published version of the manuscript.

Funding

This research was funded by the Program on Industrial Technology System of National Soybean (CARS-04-PS18), and the National Key Research and Development Program of China (2021YFF1000500). Qing Du was a recipient of a joint PhD scholarship supported by the China Scholarship Council (CSC) (No. 202106910037).

Acknowledgments

Thanks to Wu Xiaoling for providing soybean seeds and Wang Xiaochun for providing maize seeds.

Conflicts of Interest

The authors declare no conflict of interest.

References

  1. Zhang, W.; Qi, Y.; Zhang, Z. A long-term forecast analysis on worldwide land uses. Environ. Monit. Assess. 2006, 119, 609–620. [Google Scholar] [CrossRef]
  2. Du, J.; Han, T.; Gai, J.; Yong, T.; Sun, X.; Wang, X.; Yang, F.; Liu, J.; Shu, K.; Liu, W.; et al. Maize-soybean strip intercropping: Achieved a balance between high productivity and sustainability. J. Integr. Agric. 2018, 17, 747–754. [Google Scholar] [CrossRef] [Green Version]
  3. Liu, X.; Rahman, T.; Song, C.; Yang, F.; Su, B.; Cui, L.; Bu, W.; Yang, W. Relationships among light distribution, radiation use efficiency and land equivalent ratio in maize-soybean strip intercropping. Field Crops Res. 2018, 224, 91–101. [Google Scholar] [CrossRef]
  4. Moore, V.M.; Schlautman, B.; Fei, S.-z.; Roberts, L.M.; Wolfe, M.; Ryan, M.R.; Wells, S.; Lorenz, A.J. Plant Breeding for Intercropping in Temperate Field Crop Systems: A Review. Front. Plant Sci. 2022, 13, 843065. [Google Scholar] [CrossRef]
  5. Wu, Y.; Yang, F.; Gong, W.; Ahmed, S.; Fan, Y.; Wu, X.; Yong, T.; Liu, W.; Shu, K.; Liu, J.; et al. Shade adaptive response and yield analysis of different soybean genotypes in relay intercropping systems. J. Integr. Agric. 2017, 16, 1331–1340. [Google Scholar] [CrossRef]
  6. Nandula, V.K. Herbicide Resistance Traits in Maize and Soybean: Current Status and Future Outlook. Plants 2019, 8, 337. [Google Scholar] [CrossRef] [PubMed] [Green Version]
  7. Rubiales, D.; Fondevilla, S.; Chen, W.; Gentzbittel, L.; Higgins, T.J.V.; Castillejo, M.A.; Singh, K.B.; Rispail, N. Achievements and Challenges in Legume Breeding for Pest and Disease Resistance. Crit. Rev. Plant Sci. 2015, 34, 195–236. [Google Scholar] [CrossRef] [Green Version]
  8. Lv, Y.; Francis, C.; Wu, P.; Chen, X.; Zhao, X. Maize-Soybean Intercropping Interactions Above and Below Ground. Crop Sci. 2014, 54, 914–922. [Google Scholar] [CrossRef]
  9. Liu, X.; Rahman, T.; Yang, F.; Song, C.; Yong, T.; Liu, J.; Zhang, C.; Yang, W. PAR Interception and Utilization in Different Maize and Soybean Intercropping Patterns. PLoS ONE 2017, 12, e0169218. [Google Scholar] [CrossRef] [Green Version]
  10. Gao, Y.; Duan, A.; Qiu, X.; Sun, J.; Zhang, J.; Liu, H.; Wang, H. Distribution and Use Efficiency of Photosynthetically Active Radiation in Strip Intercropping of Maize and Soybean. Agron. J. 2010, 102, 1149–1157. [Google Scholar] [CrossRef]
  11. Bing, L.; Ning, Q.D. Effects of shading on spatial distribution of flower and flower abscission in field-grown three soybeans in Northern China. Emir. J. Food Agric. 2015, 27, 629–635. [Google Scholar] [CrossRef] [Green Version]
  12. Doku, E.V. Flower and pod abscission in soybean Glycine max (L.) Merril. Ghana J. Agric. Sci. 1976, 9, 119–124. [Google Scholar]
  13. Jia, H.; Jiang, B.; Wu, C.; Lu, W.; Hou, W.; Sun, S.; Yan, H.; Han, T. Maturity group classification and maturity locus genotyping of early-maturing soybean varieties from high-latitude cold regions. PLoS ONE 2014, 9, e94139. [Google Scholar] [CrossRef]
  14. Gai, J.Y.; Wang, Y.S.; Zhang, M.C.; Wang, J.A.; Chang, R.Z. Studies on the Classification of Maturity Groups of Soybeans in China. Acta Agron. Sin. 2001, 27, 286–292. [Google Scholar]
  15. Oberholster, S.D.; Peterson, C.M.; Dute, R.R. Pedicel abscission of soybean: Cytological and ultrastructural changes induced by auxin and ethephon. Botany 1991, 69, 2177–2186. [Google Scholar] [CrossRef]
  16. Jiang, H.; Egli, D.B. Shade Induced Changes in Flower and Pod Number and Flower and Fruit Abscission in Soybean. Agron. J. 1993, 85, 221–225. [Google Scholar] [CrossRef]
  17. Ascough, G.D.; Nogemane, N.; Mtshali, N.P.; van Staden, J.; Bornman, C.H. Flower abscission: Environmental control, internal regulation and physiological responses of plants. S. Afr. J. Bot. 2005, 71, 287–301. [Google Scholar] [CrossRef] [Green Version]
  18. Burn, W.; Heindl, J.; Betts, K. The physiology of reproductive abscission in soybeans. In Proceedings of the World Soybean Research Conference III: Proceedings; CRC Press: Boca Raton, FL, USA, 2022; pp. 866–874. [Google Scholar]
  19. Quijano, A.; Morandi, E.N. Post-flowering leaflet removals increase pod initiation in soybean canopies. Field Crops Res. 2011, 120, 151–160. [Google Scholar] [CrossRef]
  20. Nagasuga, K. Soybean Seed Production and Canopy Photosynthesis in Cultivation; IntechOpen: London, UK, 2018. [Google Scholar] [CrossRef] [Green Version]
  21. Egli, D.B. Soybean Reproductive Sink Size and Short-term Reductions in Photosynthesis during Flowering and Pod Set. Crop Sci. 2010, 50, 1971–1977. [Google Scholar] [CrossRef]
  22. Monzon, J.P.; Cafaro La Menza, N.; Cerrudo, A.; Canepa, M.; Rattalino Edreira, J.I.; Specht, J.; Andrade, F.H.; Grassini, P. Critical period for seed number determination in soybean as determined by crop growth rate, duration, and dry matter accumulation. Field Crops Res. 2021, 261, 108016. [Google Scholar] [CrossRef]
  23. Kokubun, M. Physiological Mechanisms Regulating Flower Abortion in Soybean. IntechOpen, 2011. Available online: https://www.intechopen.com/chapters/15727 (accessed on 29 August 2022).
  24. Kakiuchi, J.; Kobata, T. Shading and Thinning Effects on Seed and Shoot Dry Matter Increase in Determinate Soybean during the Seed-Filling Period. Agron. J. 2004, 96, 398–405. [Google Scholar] [CrossRef]
  25. Sudhakar, P.; Latha, P.; Reddy, P.V. Phenotyping Crop Plants for Physiological and Biochemical Traits; Nikki Levy: London, UK, 2016. [Google Scholar]
  26. Han, S.-S.; Park, H.-J.; Shin, T.; Ko, J.; Choi, W.-J.; Lee, Y.-H.; Bae, H.-S.; Ahn, S.-H.; Youn, J.-T.; Kim, H.-Y. Effects of Tillage System, Sowing Date, and Weather Course on Yield of Double-Crop Soybeans Cultivated in Drained Paddy Fields. Agronomy 2022, 12, 1901. [Google Scholar] [CrossRef]
  27. Singer, J.W.; Meek, D.W.; Sauer, T.J.; Prueger, J.H.; Hatfield, J.L. Variability of light interception and radiation use efficiency in maize and soybean. Field Crops Res. 2011, 121, 147–152. [Google Scholar] [CrossRef]
  28. Yong, T.; Chen, P.; Dong, Q.; Du, Q.; Yang, F.; Wang, X.; Liu, W.; Yang, W. Optimized nitrogen application methods to improve nitrogen use efficiency and nodule nitrogen fixation in a maize-soybean relay intercropping system. J. Integr. Agric. 2018, 17, 664–676. [Google Scholar] [CrossRef]
  29. Pietsch, D.; Mabit, L. Terrace soils in the Yemen Highlands: Using physical, chemical and radiometric data to assess their suitability for agriculture and their vulnerability to degradation. Geoderma 2012, 185, 48–60. [Google Scholar] [CrossRef]
  30. Okalebo, J.R.; Gathua, K.W.; Woomer, P.L. Laboratory methods of soil and plant analysis: A working manual second edition. Sacred Afr. Nairobi 2002, 21, 25–26. [Google Scholar]
  31. Olsen, S.; Sommers, L.; Page, A. Methods of soil analysis. Part 1982, 2, 403–430. [Google Scholar]
  32. Wang, H.; Cheng, W.; Li, T.; Zhou, J.-m.; Chen, X. Can Nonexchangeable Potassium be Differentiated from Structural Potassium in Soils. Pedosphere 2016, 26, 206–215. [Google Scholar] [CrossRef]
  33. Olsen, S.R. Estimation of Available Phosphorus in Soils by Extraction with Sodium Bicarbonate; Department of Agriculture: Washington, DC, USA, 1954. [Google Scholar]
  34. Fehr, W.R.; Caviness, C.E.; Burmood, D.T.; Pennington, J.S. Stage of Development Descriptions for Soybeans, Glycine Max (L.) Merrill. Crop Sci. 1971, 11, 929–931. [Google Scholar] [CrossRef]
  35. Wang, H.; Sun, X.; Yue, Y. Association mapping of flower and pod abscission with SSR markers in Northeast spring sowing soybeans. Soil Crop 2014, 3, 32–40. [Google Scholar]
  36. Ghanbari, S.; Nooshkam, A.; Fakheri, B.A.; Mahdinezhad, N. Assessment of Yield and Yield Component of Soybean Genotypes (Glycine Max L.) in North of Khuzestan. J. Crop Sci. Biotech. 2018, 21, 435–441. [Google Scholar] [CrossRef]
  37. Cheng, Y.; Liu, J.; Yang, X.; Ma, R.; Liu, C.; Liu, Q. RNA-seq Analysis Reveals Ethylene-Mediated Reproductive Organ Development and Abscission in Soybean (Glycine max L. Merr.). Plant Mol. Biol. Report. 2012, 31, 607–619. [Google Scholar] [CrossRef]
  38. Heitholt, J.J.; Egli, D.B.; Leggett, J.E.; Mackown, C.T. Role of Assimilate and Carbon-14 Photosynthate Partitioning in Soybean Reproductive Abortion. Crop Sci. 1986, 26, 999. [Google Scholar] [CrossRef]
  39. Pigeaire, A.; Seymour, M.; Delane, R.; Atkins, C. Partitioning of dry matter into primary branches and pod initiation on the main inflorescence of Lupinus angustifolius. Aust. J. Agric. Res.—AUST J AGR RES 1992, 43, 685–696. [Google Scholar] [CrossRef]
  40. Liang, F.; Ren, H.; Chen, C. A Study on Flower-Pod shedding And its Relation With Development of ovary And ovule In Summer Soybean (in Chinese). J. Henan Vocat. -Tech. Teach. Coll. 1991, 19, 1–6. [Google Scholar]
  41. Chamberlin, M.A.; Horner, H.T.; Palmer, R.G. Nutrition of ovule, embryo sac, and young embryo in soybean: An anatomical and autoradiographic study. Can. J. Bot. 1993, 71, 1153–1168. [Google Scholar] [CrossRef]
  42. Liu, B.; Liu, X.B.; Wang, C.; Li, Y.S.; Jin, J.; Herbert, S.J. Soybean yield and yield component distribution across the main axis inresponse to light enrichment and shading under different densities. Plant Soil Environ. 2010, 56, 384–392. [Google Scholar] [CrossRef] [Green Version]
  43. Bing, L.; Yansheng, L.; Xiaobing, L.; Cheng, W.; Jian, J.; Herbert, S.J. Lower total soluble sugars in vegetative parts of soybean plants are responsible for reduced pod number under shading conditions. Aust. J. Crop Sci. 2011, 5, 1852–1857. [Google Scholar]
  44. Yang, F.; Liao, D.; Wu, X.; Gao, R.; Fan, Y.; Raza, M.A.; Wang, X.; Yong, T.; Liu, W.; Liu, J.; et al. Effect of aboveground and belowground interactions on the intercrop yields in maize-soybean relay intercropping systems. Field Crops Res. 2017, 203, 16–23. [Google Scholar] [CrossRef]
  45. Greentracewicz, E.; Page, E.R.; Swanton, C.J. Shade Avoidance in Soybean Reduces Branching and Increases Plant-to-Plant Variability in Biomass and Yield Per Plant. Weed Sci. 2011, 59, 43–49. [Google Scholar] [CrossRef]
  46. Gommers, C.M.; Visser, E.J.; St Onge, K.R.; Voesenek, L.A.; Pierik, R.J.T.i.P.S. Shade tolerance: When growing tall is not an option. Trends Plant Sci. 2013, 18, 65–71. [Google Scholar] [CrossRef] [PubMed]
  47. Gelderen, K.V.; Kang, C.; Paalman, R.; Keuskamp, D.H.; Hayes, S.; Pierik, R. Far-red Light Detection in the Shoot Regulates Lateral Root Development through the HY5 Transcription Factor. Plant Cell 2018, 30, 101–116. [Google Scholar] [CrossRef] [PubMed] [Green Version]
Figure 1. Mean daylight hours (hour), rainfall (mm), and temperature (°C) during the cropping seasons in 2016 and 2017 in Renshou Sichuan.
Agronomy 12 02379 g001
Figure 2. Relationships between soybean yield and yield components in 2016 and 2017. EP, effective pods; Perseed, seed number per plant; UnitW, 100-seed weight. Correlation analysis between yield and yield components (A,E), between seed number per plant and effective pods (B,F), between 100-seed weight and effective pods (C,G), and between 100-seed weight and seed number per plant (D,H). Data points represent the mean value of each cultivar. In panels (A,E), the regression lines denote the relationships between yield and EP (red dashed line), yield and Perseed (blue dashed line), and yield and UnitW (black dashed line).
Agronomy 12 02379 g002
Figure 3. Relationships between soybean flower number and podding number (A,D), flower number and pod abscission number (B,E), and flower number and flower number abscission (C,F) in 2016 and 2017. Data points represent the mean value of each cultivar.
Agronomy 12 02379 g003
Figure 4. Principal component analysis. Yield: grain yield; EP: effective pod; PN: pod number; SN: seed number; FN: flower number; FA: flower abscission; FAR: flower abscission rate; PA: pod abscission; PAR: pod abscission rate; UnitW: 100-seed weight.
Agronomy 12 02379 g004
Figure 5. Dendrogram of the 15 soybean cultivars using the average linkage between groups.
Agronomy 12 02379 g005
Figure 6. Aboveground biomass accumulation (g plant−1) of high-, mid-, and low-yielding groups at the V5, R2, R4, and R8 stages (2016-2017). V5: the fifth trifoliolate stage; R2: the full bloom stage; R4: the full pod stage; and R8: the full maturity stage. Regarding each organ, different lowercase letters indicate significant differences among the three soybean groups (p < 0.05). Data were shown as mean with standard error.
Agronomy 12 02379 g006
Table 1. Leaf area (m−2), biomass (g plant−1), and seed weight (g plant−1) of high-, mid-, and low-yielding groups at the different growth stages (2016–2017).
YearsGroupsLeaf Area
(m−2)
Biomass
(g plant−1)
Seed Weight
(g plant−1)
V5R2R4V5R2R4R8R8
2016High-yielding0.139 b0.667 a1.456 a1.80 b22.10 a58.03 a96.82 a45.91 a
Mid-yielding0.141 ab0.44 a1.282 ab2.31 ab16.05 b58.79 a85.81 a37.50 ab
Low-yielding0.168 a0.500 a1.077 b3.07 a14.46 b45.32 a69.21 b32.39 b
2017High-yielding0.147 c0.299 a0.916 a3.21 b14.25 a43.05 a83.05 b26.07 b
Mid-yielding0.161 b0.329 a0.887 a3.34 b10.25 b35.63 b105.0 a34.75 a
Low-yielding0.194 a0.353 a0.979 a4.29 a11.00 ab37.97 b120.4 a39.49 a
ANOVA
Groups (G)*nsns**nsnsns
Years (Y)ns*ns*******ns
G×Ynsnsnsnsnsnsns**
V5: the fifth trifoliolate stage; R2: the full bloom stage; R4: the full pod stage; R8: the full maturity stage. Different lowercase letters within the column indicate significant differences among the three soybean groups (p < 0.05). The * and ** denote significant differences at p < 0.05 and p < 0.01; ns: not significant.
Table 2. Net assimilation rate (NAR), relative growth rate (RGR), and crop growth rate (CGR) of high-, mid-, and low-yielding groups at different growth periods (2016–2017).
YearsGroupsNAR
(g m−2 day−1)
RGR
(g g−1 day−1)
CGR
(g m−2 day−1)
V5-R2R2-R4V5-R2R2-R4R4-R8V5-R2R2-R4R4-R8
2016High-yielding1.232 a1.750 a0.0499 a0.0465 a0.0113 a0.812 a3.593 a1.552 a
Mid-yielding1.041 ab2.798 a0.0381 ab0.0662 a0.0077 a0.550 b4.273 a1.081 a
Low-yielding0.838 b2.215 a0.0331 b0.0575 a0.0094 a0.45 b3.086 a0.956 a
2017High-yielding2.134 a3.988 a0.0340 a0.0552 a0.0181 a0.442 a2.880 a2.300 a
Mid-yielding0.867 b3.330 a0.0231 b0.0615 a0.0207 a0.277 b2.538 a2.776 a
Low-yielding0.707 b2.860 a0.0216 b0.0621 a0.0229 a0.269 b2.697 a3.297 a
Groups (G)*ns*nsns*nsns
Years (Y)nsnsns*nsnsnsns
G×Ynsnsnsnsnsnsnsns
V5: the fifth trifoliolate stage; R2: the full bloom stage; R4: the full pod stage; R8: the full maturity stage. Different lowercase letters within the column indicate significant differences among the three soybean groups (p < 0.05). The * denotes significant differences at p < 0.05; ns: not significant.
Publisher’s Note: MDPI stays neutral with regard to jurisdictional claims in published maps and institutional affiliations.

