Article

Starch Bio-Synthetic Pathway Genes Contribute to Resistant Starch Content Differentiation in Bread Wheat

1
Henan Institute of Crop Molecular Breeding, Henan Academy of Agricultural Sciences, Zhengzhou 450001, China
2
School of Agricultural Sciences, Zhengzhou University, Zhengzhou 450001, China
3
National Key Laboratory of Wheat and Maize Crop Science, Henan Agricultural University, Zhengzhou 450002, China
4
Shennong Laboratory, Zhengzhou 450002, China
*
Authors to whom correspondence should be addressed.
Submission received: 25 October 2022 / Revised: 18 November 2022 / Accepted: 21 November 2022 / Published: 25 November 2022
(This article belongs to the Special Issue Enhanced Product Quality of Plant Material from Field Crops)

Abstract

:
Resistant starch (RS) is a special group of starches which are slowly degraded and rarely digested in the gastrointestinal tract. It was recognized as a new type of dietary fiber that improved cardiovascular, cerebrovascular, and intestinal health. Breeding high-RS-content wheat is one of the most efficient and convenient approaches for providing an adequate amount of RS for a healthy diet. However, studies which aim to genetically illustrate RS content in wheat are still rare. In the present study, a panel of 207 wheat varieties were collected world-wide and planted under three locations. The RS content of each variety was measured, and 14 additive genetic loci were found to stably exist under more than two environments. Meanwhile, four genes were recognized as the putative candidates with annotated functions of β-amylase, α-1,4 glucan phosphorylase, sucrose transporter, and NAC domain protein. A kompetitive allele-specific PCR (KASP) marker was developed from the SNP AX-94546744, representing the genetic locus of β-amylase located. The AX-94546744-T allele can significantly increase the RS content compared to the AX-94546744-C allele. The genetic loci and KASP marker associated with RS content may be useful for wheat germplasm cultivation and variety breeding with a high RS content, further helping to improve the nutritional quality in wheat.

1. Introduction

Starch is mainly stored in the endosperm of cereals and occupies approximately 70% weight of the cereal grains [1]. The basic botanical role of starch is to provide plants with a stable reserve of glucose for metabolism [2]. Most importantly, starch is the main source of energy acquisition for human beings. A special group of fractions within the starch and their degradation that cannot be digested by α-amylase in the small intestine and fermented in the colon is defined as resistant starches (RS) [3,4]. RS commonly exists in cereal grains and edible tubers of starchy plants, such as beans, sorghum, corn kernels, potatoes, and rice. The RS content is largely divergent in different crops. In Indica rice, the RS content is 1.52%, while the glutinous rice of RS is absent in the grain. The common maize contains a higher RS content of 3.89%; however, the RS content in the high-amylose maize can reach up to 44.8% [5,6]. The potato starch is the optimal source for RS acquisition and usually contains more than 60% of RS [6]. According to the sources and characteristics, the RS can be classified into five types, i.e., RS1–RS5 [7]. RS1 designates physical inaccessibility to enzymes that are usually found in coarsely ground or whole-kernel grains [3]. RS2 describes granular starch with the B- or C-polymorph commonly obtained from high-amylose maize starch, raw potato, and raw banana starch [3]. RS3 commonly refers to retrograded amylose such as cooked and cooled starchy foods [8]. RS4 refers to chemically modified starches and RS5 mainly consists of amylose–lipid complexes [9]. All the five types of RS were resistant to digestion in the small intestine due to enzyme inaccessibility conferred by physical or chemical properties; therefore, RS was recognized as a new type of dietary fiber [10,11].
Recent and ongoing studies have provided strong evidence that the intake of RS can help to attenuate and prevent symptoms of diabetes, cardiovascular disease, obesity, and colon cancer [12,13,14,15]. Diets with RS affect the gastrointestinal (GI) microbiota, which is known to contribute to the health of the host, including immune system development and protection against infection [16,17]. RS pass through the upper digestive tract to the colon, where they are fermented by various bacteria, producing important metabolites, including short-chain fatty acids (SCFAs) [18]. The daily intake of 40 g of RS helped to modulate body fat, SCFAs and gut microbiota, thus, significantly reducing visceral and subcutaneous fat [19,20]. The slow-digestible properties of RS can help to decrease postprandial glucose as well as insulin secretion; therefore, it is beneficial in preventing and attenuating type 2 diabetes symptoms [21,22]. However, it was reported that an insufficient intake of RS in daily diets was predominant [9,23,24]. The major RS in wheat wholemeal flour is RS2, and the amount of RS2 and the ability to form RS3 are the main concerns for increasing RS content through biotechnological manipulation or breeding approaches [25]. Although the RS content in wheat flour (usually 1–2%, even <1%) is lower than that in potato and maize, the common wheat, as one of the most important staple crops which provides 20% of calories for all the population worldwide, still represents the most economical way for solving the chronic disease, such as diabetes, cardiovascular disease and obesity, for the majority [26,27].
The genes involved in starch biosynthesis have been illustrated in plants [1,28]. Amylose is produced by granule-bound starch synthase I (GBSSI), which is encoded by the Waxy (Wx) gene [29]. Amylopectin synthesized via the catalysis of a group of genes, including starch synthase (SS), starch sranching snzyme (SBE), starch se-branching snzyme (DBE), ssoamylase-type DBE (ISA), and pullulanase-type DBE (PUL) and phosphorylase (PHO1) [30,31,32]. Furthermore, the RS content was revealed to be highly associated with the amylose content [33]. Studies on high-, intermediate- and low-amylose rice varieties reported that the combination of amylose content and pasting temperature explained the >76% variation in RS content [34]. The chain length, the strong interactions between the chains, and the granular structure of amylose contribute to the indigestibility of the starch granular [35]. Theoretically, the most effective approach for increasing RS content is the disfunction of the amylopectin-related homologous genes in wheat. Researchers have produced high-RS wheat by editing the starch-branching enzyme gene, TaSBEIIa, and the EMS mutant. The RS content increased from 1.2% to 8.7% in the triple-null TasbeIIa mutant [26]. In an EMS-induced mutation population, the RS content even reached up to 41% in the high-amylose mutant lines [27]. By comparing the expression level of starch metabolic pathway homologous genes between low- and high-amylose mutant lines, results showed that GBSSI and their isoforms, Beta-amylase 1 (BMY1), as well as Pho1, Pho2, and SPA, had a higher expression in the high-amylose line, while SBE, SSIII, SBEI, SBEIII, and ISA3 were detected with a higher expression in the low-amylose mutant lines [27]. Mutation lines with a loss function of all the three SSIIa and SSIIIa copies in A, B, and D genomes increased amylose content by 18% and 6%, respectively, in the bread wheat [36,37]. In barley the starch metabolism genes, BMY1, GBSSI, limit dextrinase 1 (LDA1), SSI, and SSIIa related to amylose and amylopectin content [38]. Strong evidence suggested that the homologous starch biosynthesis genes were detected in the model plant, rice, and arabidopsis, performing various functions on amylose and amylopectin content, as well as RS content in bread wheat [39]. However, other genes, such as phosphorylase and isoamylase, may contribute to RS content.
However, a high RS content plays a mutual role in end-use and processing quality. The addition of RS can increase the firmness and decrease the cooking loss and stickiness of gluten-free pasta [40]. The bread made by high-RS-content flour was much brighter and the volume decreased [26]. High RS levels could decreased the volume and height, and the number and area of gas cells of muffins significantly [41]. High concentrations of RSIII reduced the structural integrity of dough, which then decreased the end-use quality [42]. All the studies emphasized the necessity of coordination between the increase in RS content and the improvement in end-use quality in wheat breeding [40,43]. Not only do the genetic factors influence the RS content, but also the environmental factors, such as temperature [44]. Therefore, one of the practical approaches used to improve RS content involves detecting and transferring the elite RS genetic loci into major varieties with high end-use quality.
With its health benefits, the need to improve the RS content in wheat has become concerning. However, the variation of RS content in current varieties is relatively narrow. In recent years, scientists have attempted to create high-RS-content lines through biotechnology, such as EMS mutation, RNAi, and gene editing (reviewed by [39]). The mutant lines significantly increased the RS content, even up to >40% [27]. However, the high-RS lines usually accompanied an inferior yield and quality traits, such as the shrink seeds, lower seed weight, and reduced extensibility and elasticity. Therefore, this study aimed to evaluate and select the high-RS-content varieties and elucidate the superior genetic loci which can be used to improve the RS content in wheat breeding.

2. Materials and Methods

2.1. Plant Materials

A genome-wide association study (GWAS) population consisted of 207 bread wheat (Triticum aestivm L.) varieties, which were collected from the major wheat planting area of China and seven other countries worldwide. The population was used to dissect a series of quality traits (peroxidase and polyphenol oxidase activity) and nutritional traits (znic and calcium content) in wheat [45,46,47,48]. All the varieties were obtained from Henan Province Crop Germplasm Bank (constructed and managed by Henan Academy of Agricultural Sciences, HAAS) and International Maize and Wheat Improvement Center (CIMMYT) through a Joint Laboratory project of HAAS and CIMMYT. The authors were granted permission to use the collections.
The association population was planted in Yuanyang (113°97′ E, 35°5′ N), Kaifeng (114°30′ E, 34°80′ N), and Shangqiu (SQ, 115°65′ E, 34°45′ N) in Henan province, China, during the planting season of 2016–2017. Each variety was planted in a plot with 2 rows of 2 by 0.2 m, with 10 cm spaces between adjacent plants. Each of the varieties were sown in October and harvested in May of the next year. The field nursery was consistent with the local management. During the whole growth period, the plants were irrigated four times at the sowing time, before freezing in winter, the booting developmental stage in spring, and then grain filling stage, respectively. Fertilizer was applied four times at the sowing time, before the developmental stage of four leaves, then heading and grain filling was performed, respectively.

2.2. Evaluation of RS Content

All varieties planted in the three locations were harvested and the grains were used to prepare the wholemeal flour, following the method approved by American Association of Cereal Chemists (AACC) (26–21.02) using Brabender Quadrumat Junior Mill (Brabender, Duisburg, Germany). The RS content of each sample was measured with 100 ± 5 mg of wholemeal flour, utilizing the resistant starch assay kit (Megazyme K-RSTAR, Megazyme, Wicklow, Ireland), which was developed according to the AACC method (32–40). Each sample was measured with 3 replicates. All the operations following the protocol were provided by the kit. The RS content was calculated according to the protocol provided at (http://www.megazyme.com (accessed on 16 October 2022)) and following the formula [49]:
RS (%) = A1/A0 × 0.9 × 0.1 × 10.3/0.1 × 100/W
A1: the absorption value of samples with a wavelength of 510 nm; A0: the absorption value of standard glucose with a wavelength of 510 nm; W: the weight of tested samples.

2.3. Statistical Analysis

Sets of tools and software packages were adopted for statistical analysis. The phenotypic description parameters, such as the variation, mean value, standard deviation, and coefficient of variation, were analyzed using the “psych” package of R (version 3.5.3) (R Core Team 2020). Best Linear Unbiased Prediction (BLUP) and broad-sense heritability (H2) for each trait were calculated by the “Lme4” package in R. Phenotypic variations, correlations between different locations, and the Shapiro–Wilk test for normality distribution were analyzed by SAS 9.2 and IBM SPSS Statistics 22, respectively.

2.4. Genotyping of All Varieties and Quality Control

High-quality genomic DNA was extracted from the leaves of seedlings of 207 wheat varieties in the association population and used for genotyping with the wheat 660 K Illumina Infinium SNP array following the Axiom 2.0 Assay Manual Workflow protocol [45]. The genotypes of each variety were called utilizing software obtained from commercial sources (Affymetrix and Illumina). Standardized quality control, imputation, and statistical analyses were conducted. The reliable SNP were screened using the Plink version 1.9 software (http://www.cog-genomics.org/plink2/ (accessed on 19 November 2021)) with a minor allele frequency > 0.05 and missing genotype data < 10%. Finally, 224,706 SNP were obtained for the GWAS of RS-related genetic loci in the association population. The panel of varieties were classified to two groups according to population structure and kinship analysis based on the SNP [45,46,47,48].

2.5. GWAS for RS Genetic Loci

The TASSEL 5.0 software was used for the GWAS with the Q (population structure) + K (relationship) matrix and MLM model. The SNP with a −log10 P ≥ 3.0 and the simultaneous significant divergence (t-test, p < 0.05) of RS content were detected between alleles in SNP, and the significant SNP were identified. The R software package “ggplot2” was used to statistically analyze and visualize the significant SNP R (version 3.5.3) (R Core Team 2020). A quantile–quantile plot and the Manhattan plot were constructed by the “qqman” package. The significant SNP with the highest phenotypic contribution were assigned as the peak SNP; accordingly, the significant SNP with a physical distance of 5 Mb up- and down- stream to the peak SNP were integrated into one QTL. Each allele of a peak SNP was assigned with scores: homozygous superior alleles (which help to increase the RS content) were given a score of 2, homozygous inferior alleles (which were associated with decreasing RS content) were given a score of 0, and heterozygous alleles were scored with 1. A scatter plot was then drawn using Origin 2017.

2.6. KASP Primer Design and Genotype Detection

A genomic sequence with a length of 100 bp on the 5′ and 3′ strands surrounding the peak SNP was used for primer design. Two allele-specific primers were labeled with the FAM (5′-TGAAGGTGACCAAGTTCATGCT3-′) and HEX (5′- GAAGGTCGGAGTCAACGGATT 3-′) sequences at the 5′ end. The target SNP was anchored at the 3′ end of each primer. The PCR reactions were prepared using the KASP assay mixture, consisting of 2.5 μL of KASP master mix, 0.04 μL of Mgcl2, 1μL of template DNA (100 ng/μL), 0.76 μL of ddH2O, and 0.7 μL of primer mixture (with a 100 μL mixture as the unit, and the proportion of primer addition was F1:F2:R = 12:12:30, while the remaining volume was supplemented with ddH2O). The PCR cycles were carried out with the following protocol: pre-denaturation at 95 °C for 15 min, denaturation at 95 °C for 20 s, annealing at 64 °C for 60 s, denaturation and annealing for 10 cycles, each cycle reduced by 1 °C, denaturation at 95 °C for 20 s, annealing at 57 °C for 60 s, and denaturation and annealing for 35 cycles. The signal was then read after 1 min at 37 °C [50]. Bio-rad CFX Maestro 1.1 (Bio-Rad, Hercules, CA, USA) was used for fluorescence detection and data analysis.

2.7. Candidate Gene Prediction

The genomic sequence with the physical distance of 5 Mb up- and down- stream of the peak SNP of all the 14 integrated QTL were used for candidate gene predictions. According to the Chinese Spring reference genome (IWGSC RefSeqv2.1), all the genes in the target regions were annotated through Ensemble Plants (http://plants.ensembl.org/Triticum_aestivum/Info/Index (accessed on 5 November 2021)). Then, the genes expressed in grains were filtered from the Wheat Expression Browser (http://www.wheat-expression.com (accessed on 10 November 2021)) and were used to compare the expression level between the alleles of each peak SNP in the association population. Only the genes that were expressed in the grains with 20 days after pollination (DAP) and were significantly differentiated (t-test, p < 0.05) between two alleles were categorized using gene ontology (GO), the Kyoto Encyclopedia of Genes and Genomes (KEGG), eukaryotic orthologous groups (KOG), and the SWISS-PROT database analysis. The candidate genes were predicted by following the functional annotation.

3. Results

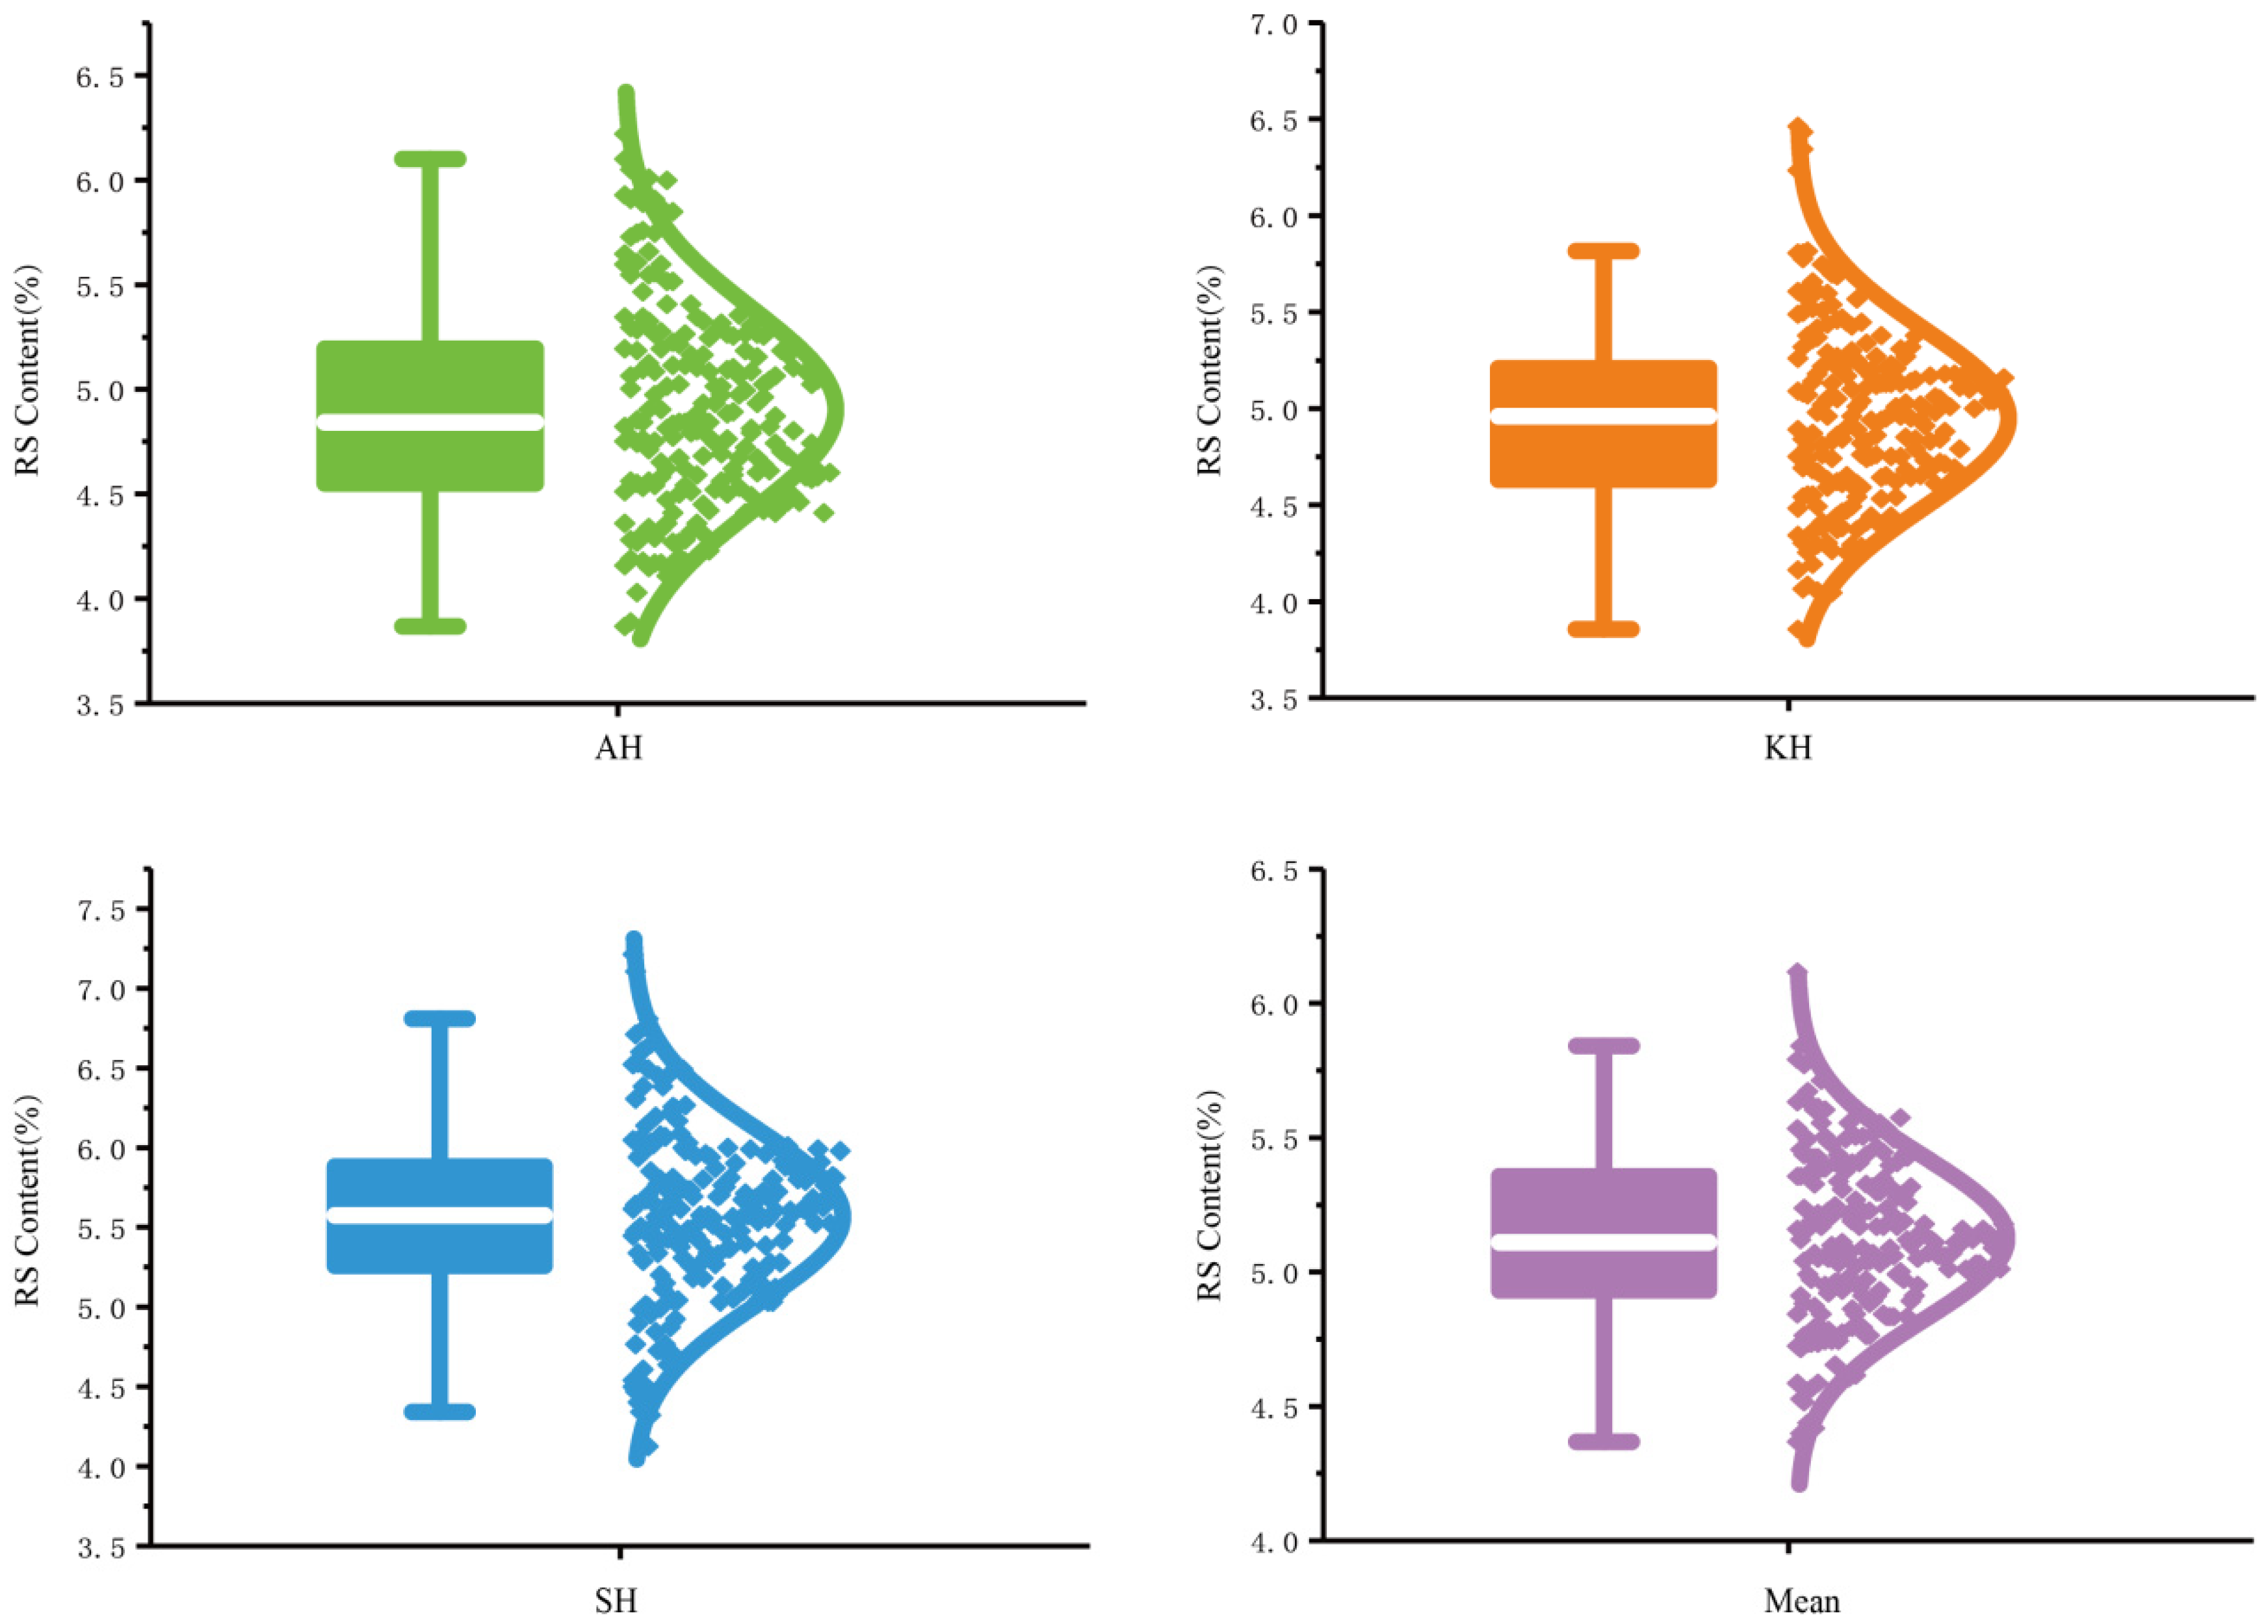
3.1. RS Content Evaluation and Phenotypic Distribution in the GWAS Population

The grains of 207 varieties planted in three locations were used to measure RS content (Table S1). Although the values of RS content varied across three locations, they demonstrated a normal distribution (except for Shangqiu), representing one of the typical characteristics of quantitative traits (Figure 1 and Table S2). The highest average RS content value of all the varieties was obtained in Shangqiu, which reached 5.54%, while the average values in Yuanyang and Kaifeng were very similar, i.e., 4.94% and 4.90%, respectively (Figure 1 and Table S1). The highest RS content was 7.28%, which detected the variety, Shiluan02-1, in the location of Shangqiu, and Yumai53 displayed the lowest RS content of 3.80% in Yuanyang. By comparing the average value from all the three locations, it was found that Zhengmai366 and Taishan5hao demonstrated the lowest and highest values, with 4.39% and 6.15%, respectively (Tables S1 and S2). ANOVA was conducted to illustrate the effects of genotypes, environment, and genotype–environment interactions—all of which significantly (p < 0.001) influenced the RS content in the association population (Table S3).

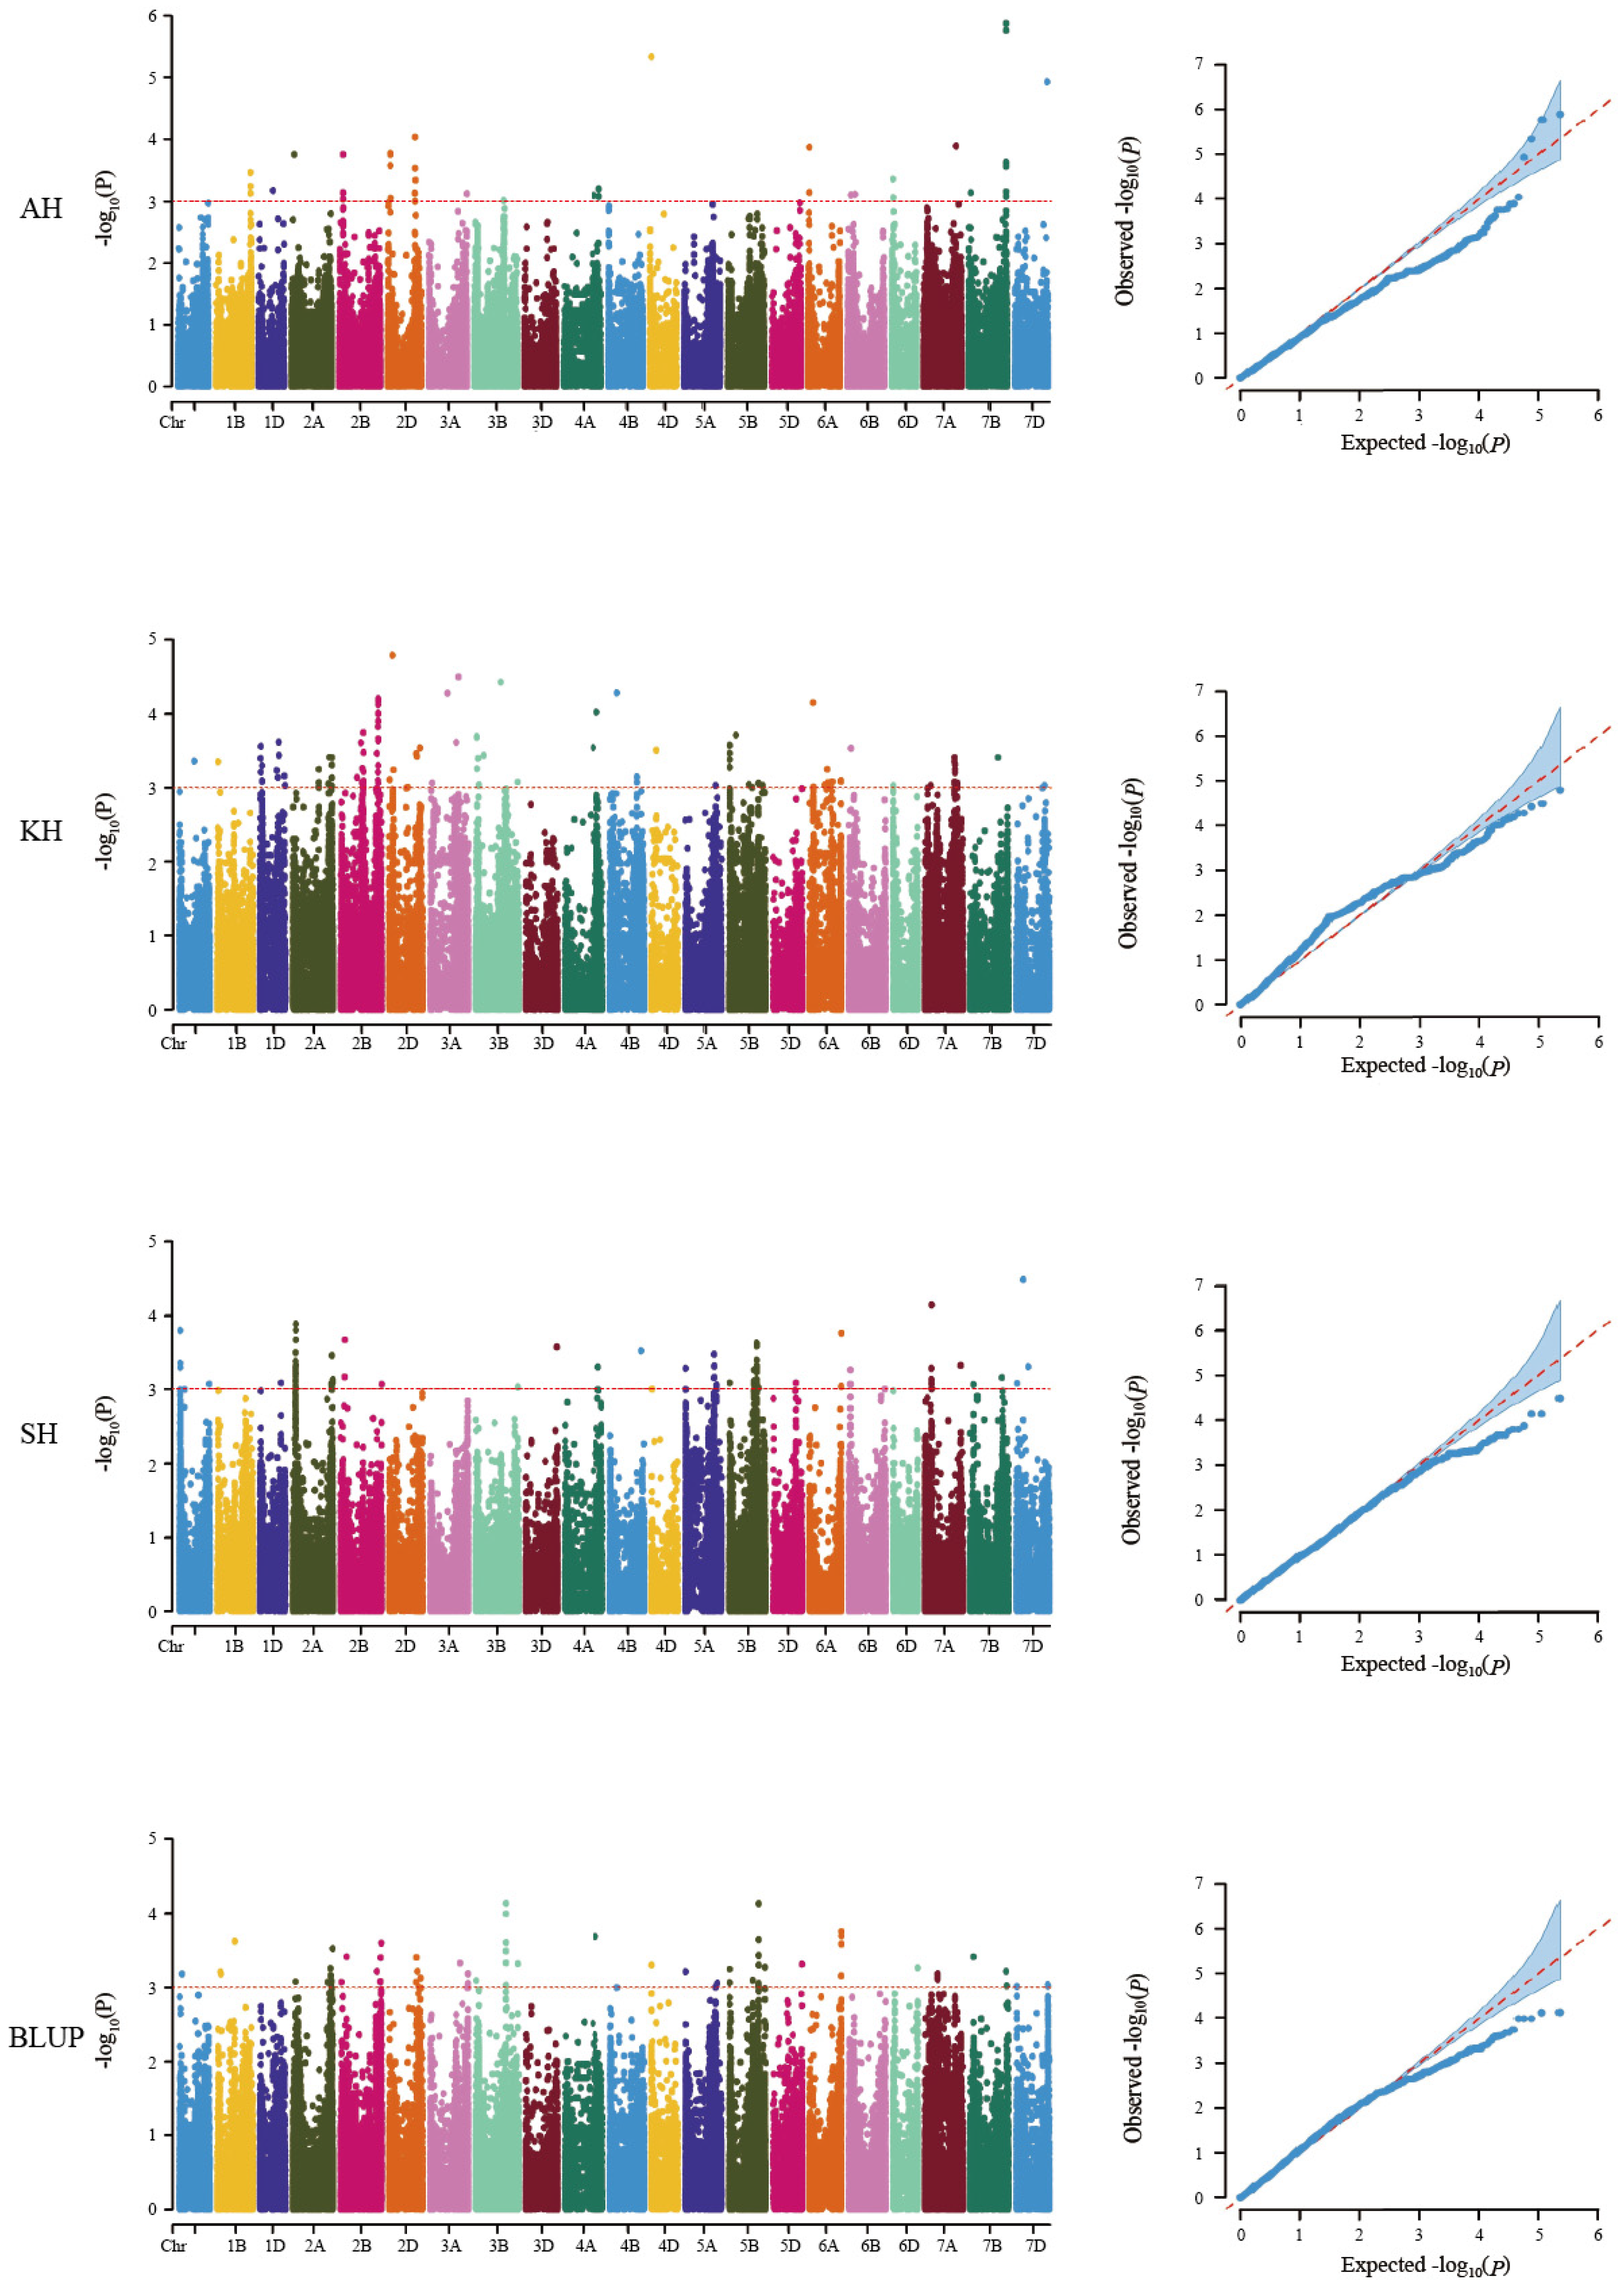
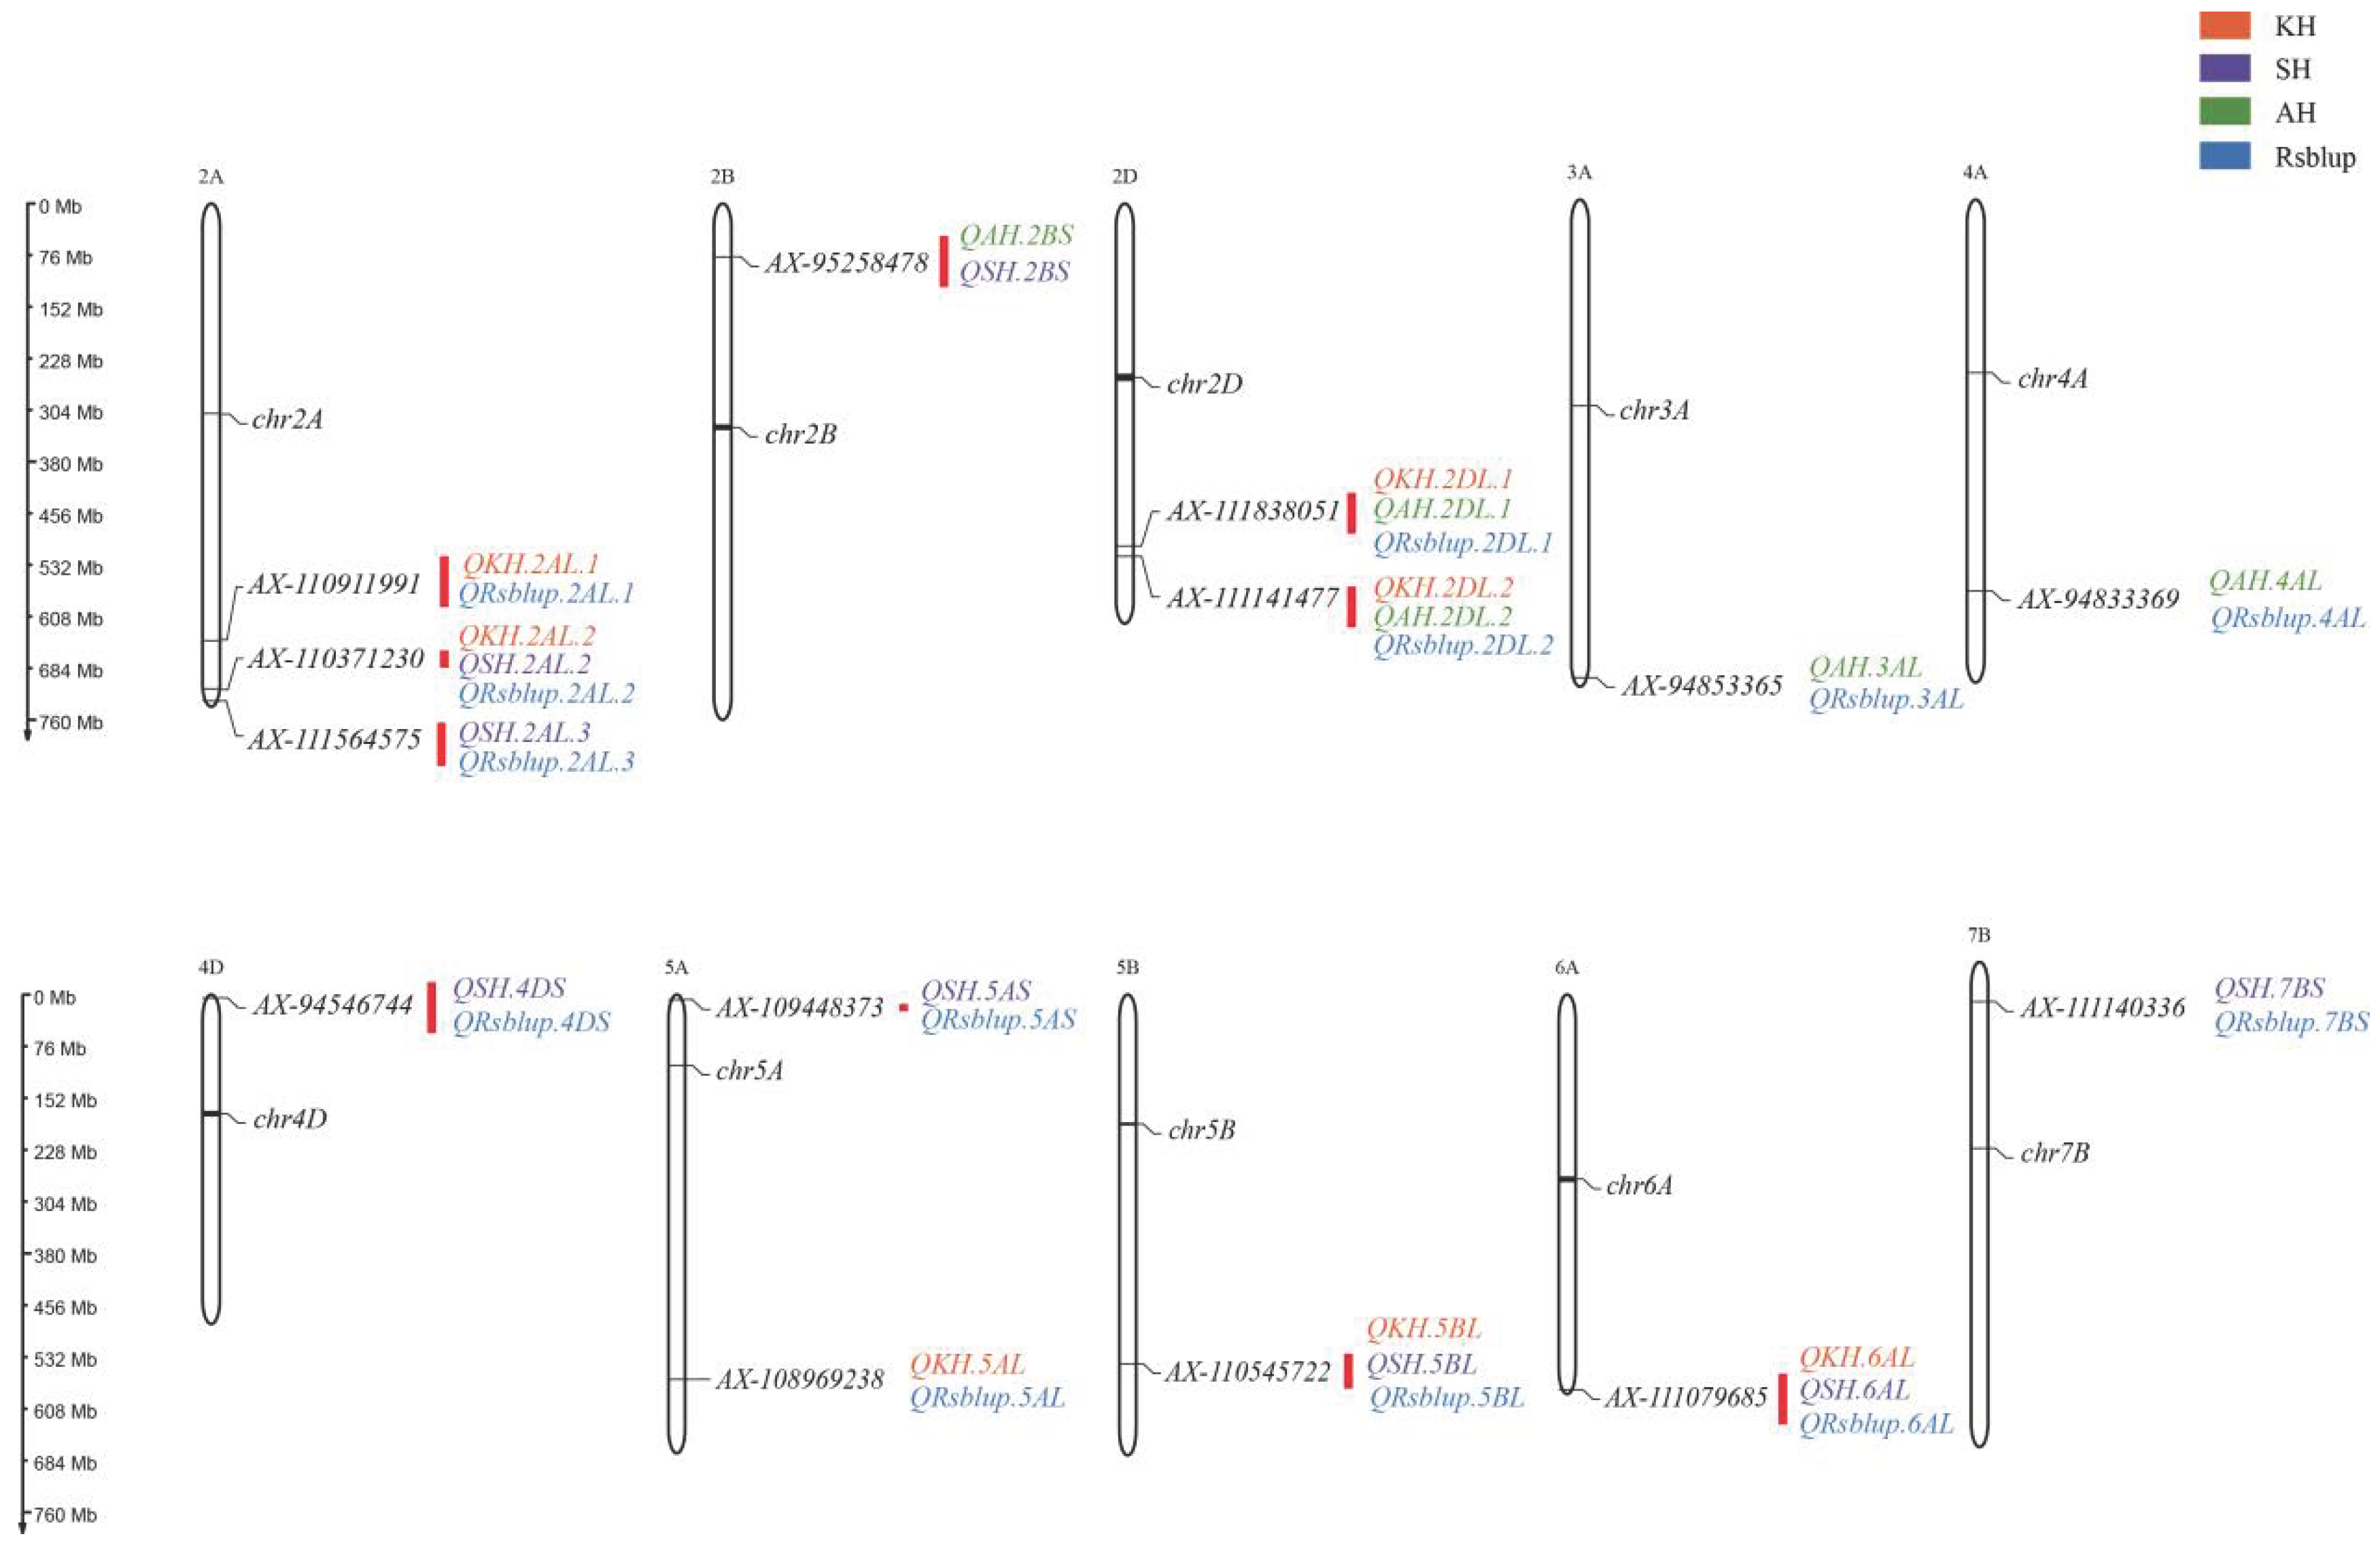
3.2. Detection of the Genetic Loci for RS Content

The genetic loci associated with RS content were elucidated through the GWAS using the mixed linear model (MLM) with a phenotypic value from three locations and the BLUP values of each variety. In total, 440 SNP were significantly dissected and were associated with RS content (−log10 P ≥ 3) (Figure 2). Some of the SNP were clustered in a neighboring genome region; therefore, the significant SNP were integrated as QTL with a physical distance of 10 Mb, which estimated the whole genome LD decay distance of the present association population, and the SNP with the highest values of −log10 P were assigned as the peak SNP. Then, all the significant SNP were integrated into 123 QTL, and among which, 23 were repeatedly detected under two or more environments (BLUP was recognized as an independent environment). The peak SNP of the 23 repeatedly detected QTL were selected to evaluate the QTL’s contribution to RS content. Finally, only 14 peak SNP demonstrated a significant difference between different alleles (t-test, p < 0.05) (Table 1). The QTL hosting 14 significant peak SNP distributed on chromosomes 2A, 2B, 2D, 3A, 4A, 4D, 5A, 5B, 6A, and 7B, contributed to 5.41–8.81% of the phenotypic variation (Table 1). The QTL was distributed unevenly on each chromosome. Chromosome 2A contained three QTL, showing the largest number; chromosomes 5A and 2D mapped two QTL; and the other seven chromosomes had only one QTL (Figure 3). The physical position of the 14 QTL were aligned with the reference genome sequence of Chinese Spring. Unexpectedly, all the QTL tended to be located near the centromere chromosomes and the telomere (Figure 3). Some of them, including qRS.2AL-3, qRS.4DS, qRS.5AS, and qRS.6AL, even were mapped in the telomere (Figure 3).

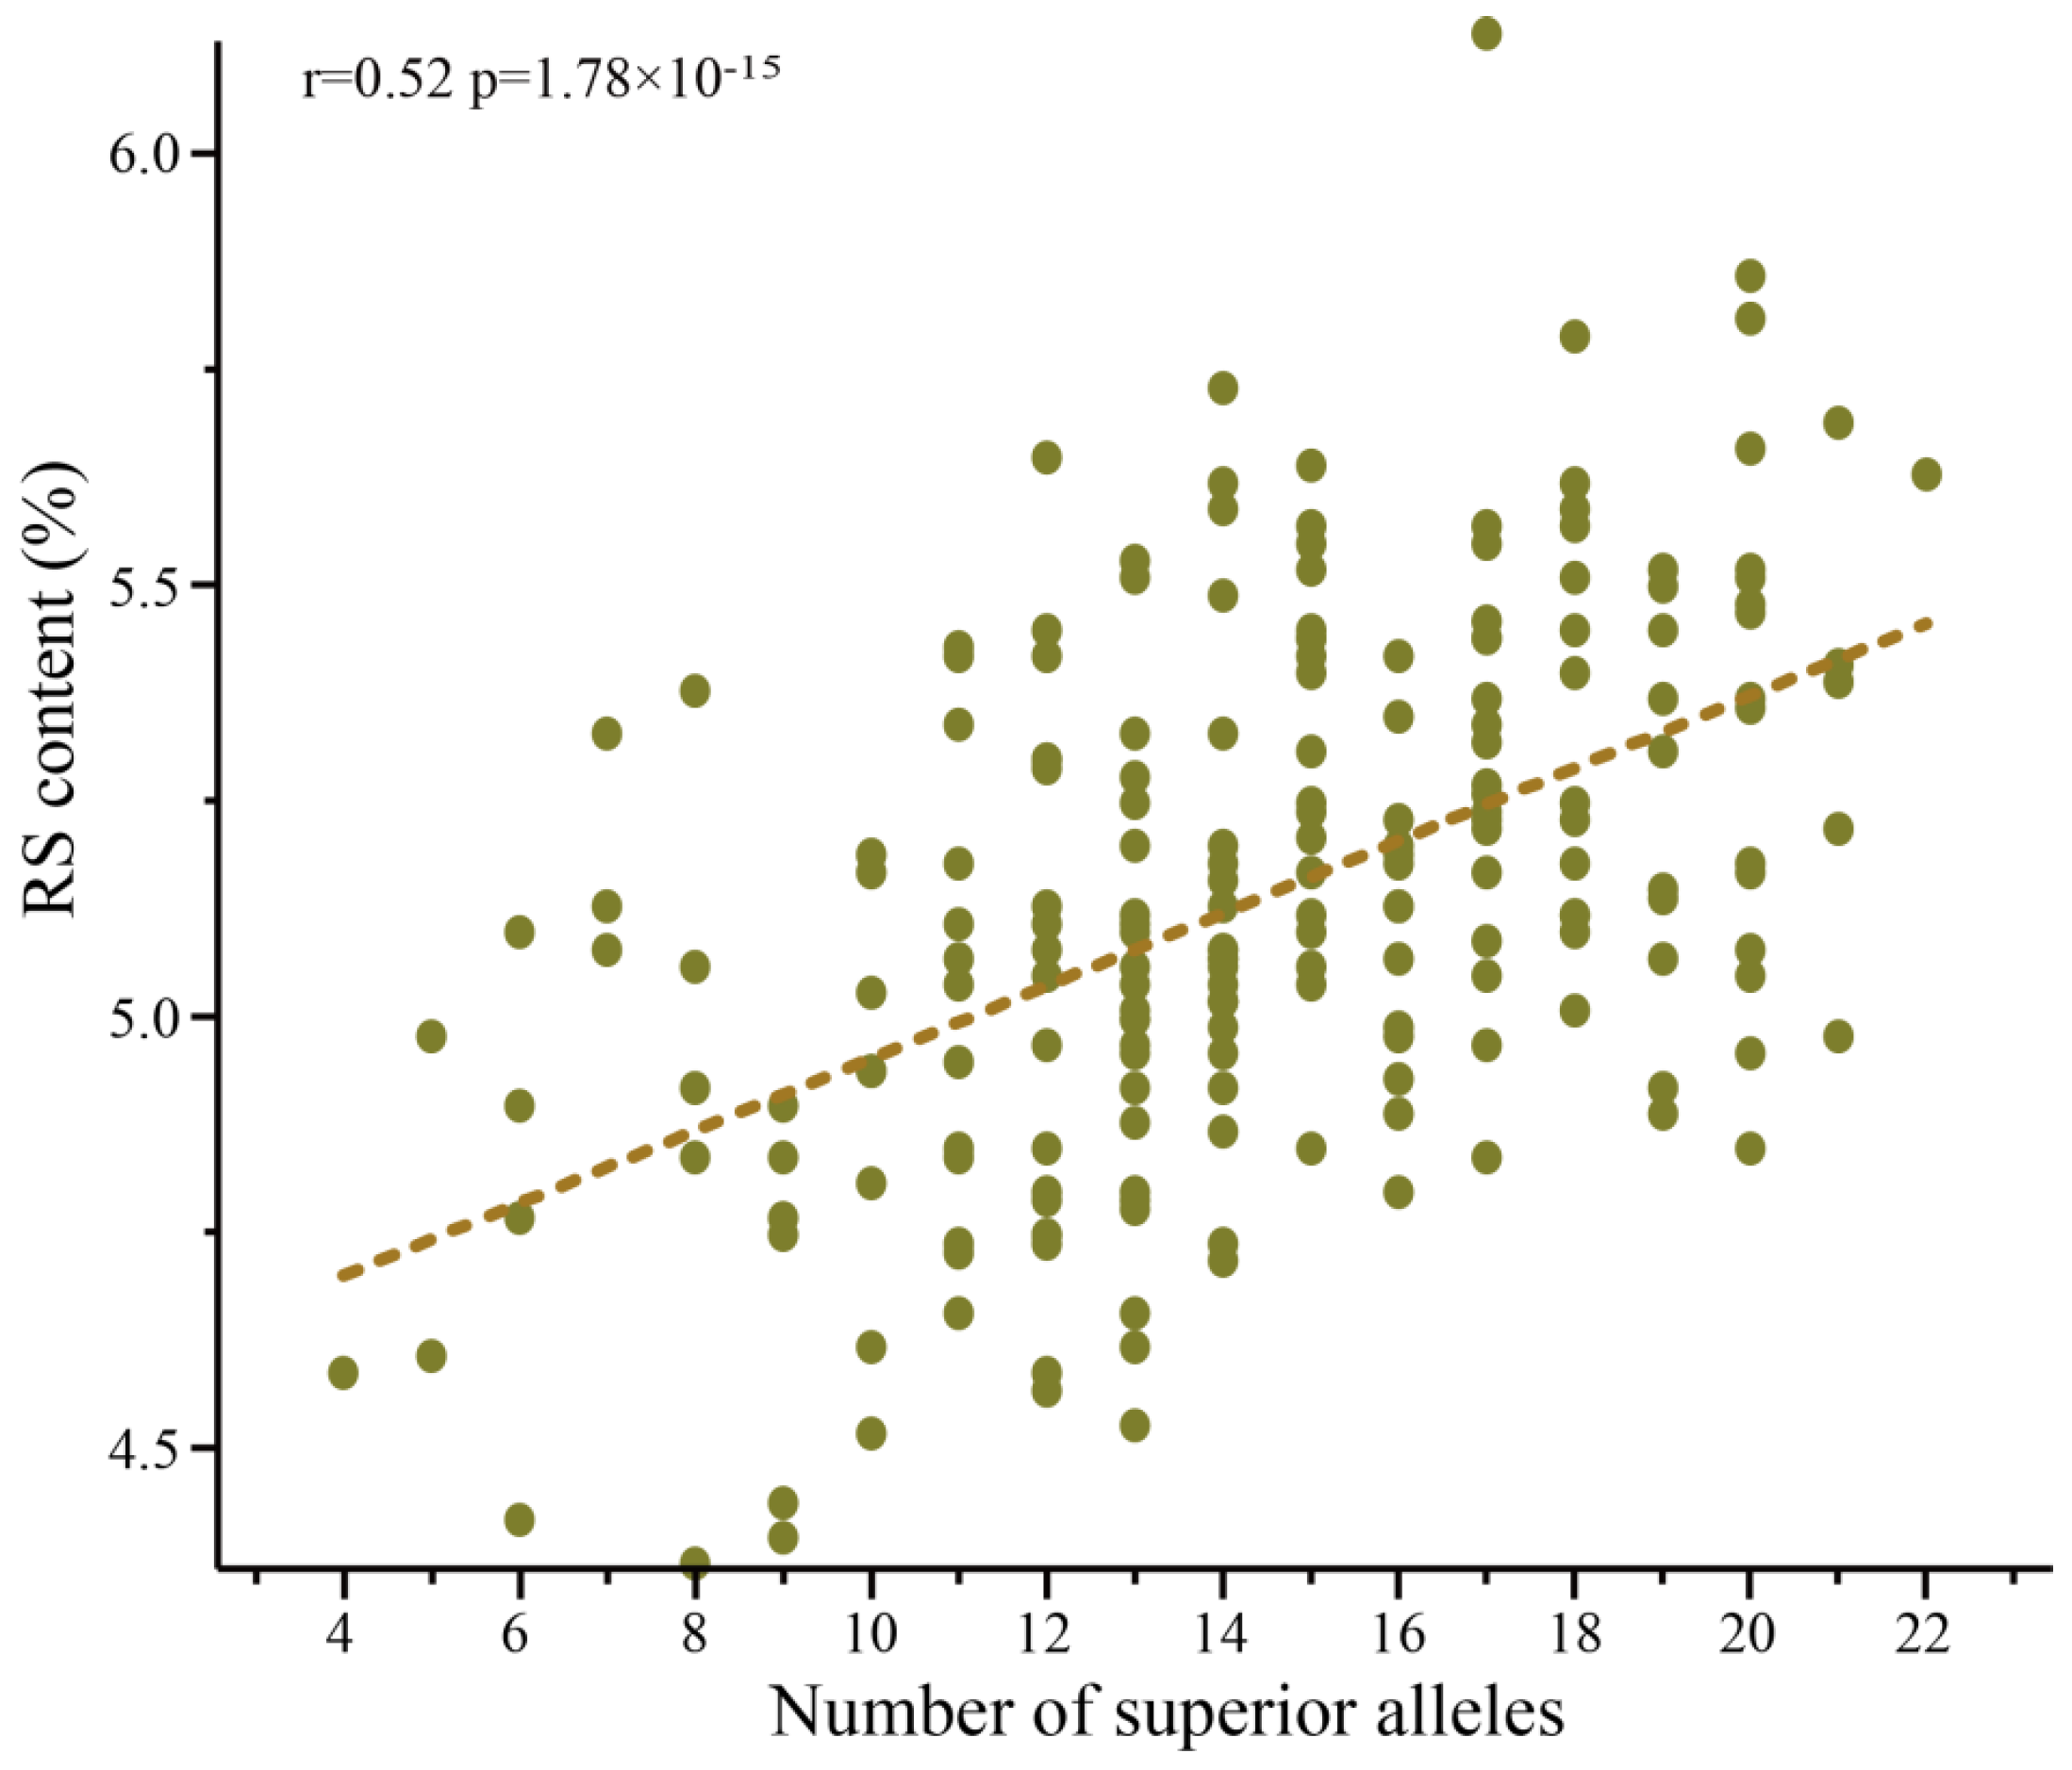
3.3. Additive Effect to the RS Content of the SNP

The peak SNP of 14 QTL were evaluated in relation to their function on the RS content. Most of the SNP displayed two types of genotypes in the association population, with the exception of two SNP sites, AX-94546744 and AX-109448373, which demonstrated three genotypes, (two were homozygous of each nucleotide in the SNP and one was heterozygous). Three SNP, AX-95258478, AX-94853365, and AX-94833369, only detected the heterozygosity and homozygosity of one nucleotide in the SNP sites (Table 2). The SNP genotypes which increased the RS content were assigned superior alleles; accordingly, the alleles related with decreased RS content were recognized as inferior alleles (t- test, Table 2). In the present association population, superior alleles displayed an additive effect. The RS content of the varieties were significantly related to the number of superior alleles (r = 0.52, p = 1.78 × 10⁻¹⁵) (Figure 4). The variety, Xi’nong979, which has the highest number of superior alleles (22), showed an RS content of 5.62%—this was significantly higher (t-test, p < 0.001) than 4.58%, of which was obtained from the least number of superior alleles (4) in the variety, Huamai5hao (Table S4).

3.4. Candidate Gene Prediction

In total, 1850 genes were annotated from 14 integrated QTL, among which, 665 genes were detected with an expression in grains. Finally, 171 grain-expressed genes were detected and were significantly differentiated (t-test, p < 0.05) between alleles in all of the 14 peak SNP (Table S5). The functions of the 171 differentially expressed genes were annotated through GO and KEGG analysis. The genes mainly enriched the cellular component of proteasome regulatory particles, base subcomplexes, nucleolus, and proteasome storage granules (Figure S1). Meanwhile, related catalytic activity and protein catabolic processes regulated the biological process (Figure S2). The molecular functions of the genes were annotated with methyltransferase activity, chromatin binding, enzyme regulator activity, etc. (Figure S3). The genes were related with splicesome, proteasome, and beta-alanine metabolism pathways (Figure S4). Finally, four genes, TraesCS4D03G0010800, TraesCS5A03G0943300, TraesCS6A03G1026400, and TraesCS7B03G0151400, were recognized as putative candidates from the regions of peak SNP, including AX-94546744, AX-108969238, AX-111079685, and AX-111140336. Accordingly, the gene functions were annotated with β-amylase, α-1,4 glucan phosphorylase, sucrose transporter, and NAC domain protein, respectively (Table S5). These putative candidate genes were reported to be involved with the starch synthesize pathway previously.

3.5. KASP Marker Development

On account of the TraesCS4D03G0010800 gene, annotated with β-amylase, the most clarified and direct function with starch synthesis was located in the genomic region related with peak SNP AX-94546744 (C/T), and the SNP AX-94546744 was selected for developing the KASP marker (Table S6). Varieties in the association population were genotyped by the KASP marker. There were 26 varieties containing AX-94546744-C, while 171 varieties with AX-94546744-T, besides eight varieties, were heterozygous, and two were undetermined genotypes (Table S7). Phenotypic variation was evaluated between genotypes in the SNP AX-94546744. The AX-94546744-T allele increased RS content, and the average RS content of varieties with AX-94546744-T was 5.16%, which was significantly higher than that of AX-94546744-C, only 4.93% (Figure 5). In the present association population, the SNP AX-94546744 could efficiently distinguish high-RS-content varieties from low-RS-content varieties.

4. Discussion

The starch biosynthesis pathway is relatively clear, as shown by a series of genes being revealed. The major primer of starch synthesis is malto-oligosaccharide (MOS), whose chain was extended by the PHO1, PTST2 (protein targeting to starch) genes [51,52,53], as well as SSIV and SSV, following catalyzing by SSI, SSIIa, SSIIIa, PHO1, SBE, and GBSSI, generating long-chain linear and branched glutens in Arabidopsis [53,54,55]. Subsequently, they were used to synthesize amylose and amylopectin, mainly processed by GBSSI [29,56] and SSI, SSIIa, SSIIIa, SSIVb, SBEI, and DBE [57,58,59,60]. Although the de novo synthesis of the original MOS in cereals is not so clear, it can be obtained through nascent amylopectin processed by ISA1 and ISA2, and/or starch degraded by α/β-amylases [60,61,62]. In wheat, the improvement in RS content is usually through mutant or editing the known functional genes, such as GBSSI, BMY, SSIII, SBEI, SBEII, SBEIII, and ISA3. However, RS-related genetic loci detected through GWAS and QTL mapping are relative rare in wheat. QTL mapping revealed three genetic loci on chromosome 2D and 4A (2 QTL), respectively, which account for more than 10% of the phenotypic variation. High RS-associated markers were developed from the genetic locus. Our present study detected 14 integrated QTL distributed on 10 chromosomes, which included 2D and 4A. From the detected QTL, TraesCS4D03G0010800, which annotated the function of β-amylase, was predicted as the candidate gene of qRS.4DS, whose peak SNP was AX-94546744 (Table S5). The expression level of TraesCS4D03G0010800 in the varieties with a genotype of ‘TT’ was significantly higher than those with a genotype of ‘CC’ (Table S8). A higher content of β-amylase (TraesCS4D03G0010800) provides more MOS for starch synthesis; therefore, the total starch content and RS content in the varieties with genotype of ‘TT’ were significantly higher (Table S8). There is a reasonable explanation and high certainty for recognizing TraesCS4D03G0010800 as the candidate gene for qRS.4DS. Sucrose transporters can transfer the sucrose, which is recognized as an important substrate for starch synthesis, from mesophyll in leaves where the photosynthesis occurs to sink, such as developing grains through phloem [63]. In qRS.6AL (with a peak SNP of AX-111079685), TraesCS6A03G1026400, annotated as a sucrose transporter, was primarily predicted as the candidate gene. As a hypothesis, the varieties with the ‘AX-111079685-G’ SNP containing a higher allelic expression level demonstrated a higher RS content; however, the data contested our hypothesis. Although TraesCS6A03G1026400 contributes to starch content, it was excluded as the candidate gene for RS content. Furthermore, it has been reported that the RS content was also regulated by transcript factors and the phosphorylation mechanism [64,65,66]. Therefore, additional genes, α-1,4 glucan phosphorylase (PHO) and the NAC transcript factor, were the selected candidates for qRS.6AL (peak SNP AX-111079685) and qRS.7BS (peak SNP AX-111140336). For the rest of the ten integrated QTL, no candidate genes were predicted. The result indicated that there might be other new genes that had not revealed a controlling RS content in wheat. Further research would focus on dissecting the new genes that control the RS content in wheat.
Recent studies have identified several key genes that encode enzymes involved in the RS formation; however, RS formation mechanisms in common with wheat have still not been comprehensively described. It has been described that RS content, controlled by a complex interaction network, consisted of intrinsic genes and environment factors (reviewed by [1,67]). Usually, high temperature was recognized as having an adverse effect on starch synthesis [68,69,70,71]. The amylose accumulation was increased under a lower temperature, resulting from the promotion of the Wx gene expression [68]. A high temperature inhibits the accumulation of starch by inducing the alternative splicing of the Opaque2-like transcription factor, OsbZIP58, which helped to increase the starch synthesis gene expression while decreasing the expression of the starch hydrolyzing gene expression under a high temperature [72]—its ritual to genetically improve and clarify genetic loci under various environments. In the present study, three locations, spanning from 113°97′ E to 115°65′ E in longitude and from 34°45′ N to 35°5′ N in latitude, were selected to plant the association population. Although all the planting locations were in the winter wheat growing environment, the average temperature in May, during the crucial developmental stage for starch accumulation, was divergent, i.e., 18.1–30.8 °C, 19–29.8 °C, and 15.7–28.7 °C in Yuanyang, Kaifeng, and Shangqiu, respectively (http://www.tianqihoubao.com/ (accessed on 18 Augest 2022)). Accordingly, the highest average RS content value of all varieties was obtained in Shangqiu, which reached 5.54% (Table S1). The multi-location field trials helped us to more accurately detect genetic loci interactions with environmental factors.
Owing to the health benefits, improvement in the RS content attracted more and more attention among crop biotechnologists and breeders. The method of extraction and measurement affected the RS content. The varieties and control lines were usually found with an RS content of 1–2% in fine-milled flour [26,36]; however, the mutant lines or gene editing lines were found with an RS content of 2% to 45% [27,37]. The study, which aimed to illustrate the variation among the Goni method, AOAC method, mediate temperature pancreas α-amylase, and thermostability pancreas α-amylase-digested method, suggested that the same flour sample was measured RS contents of 4%, 11%, 27%, and 31% [73]. The RS content of varieties in the present study are 3–5%, which seems higher than that in other studies—this may be a result of the wholemeal flour used for measurement. Additionally, this result is consistent with previous studies which reported that RS comprised on average of 6.6% of ground grain and 3.9% of wheat flour [74]. Therefore, the development of the high-RS-content gene-related molecular markers will help to select high RS lines more accurately. Allelic polymorphism between starch synthesis genes was revealed in rice. Two major functional Wx alleles, Wxa and Wxb, were distinguished based on a G-to-T mutant at the 5′ splice site in the first intron of indica and japonica sub-species, respectively [75,76]. The functional allele, Wxa, produced a higher mRNA level, so that large amounts of amylose and RS could be generated [76,77,78]. Other functional polymorphisms were also identified in the SSI, SSIIa, and SBE gene families, and functional SSIIa was related with a higher RS content [58,79,80,81]. In wheat, mutants targeted with the most important starch synthesis pathway genes were obtained. The GBSSI and SSIIa mutants were produced through a nullisomic–tetrasomic crossing, with a lack of target genes in the A and B sub-genomes, and with a loss of the hexaploidy wheat target gene function in the D sub-genome [82,83]. Accordingly, the sequence divergence between functional and null alleles was investigated, and molecular markers were developed to assist breeding [83,84]. It was revealed that the RS content increased in SSIIa mutant wheat lines [85]. However, the germplasm of the SSIIa mutant and its molecular markers were not commonly used in high-RS-content wheat breeding. There is still a challenge to create high-RS-content lines and breed wheat varieties. Sequence polymorphisms between genetic loci detected in the present study could be investigated in future research to provide more molecular markers for high-RS-content wheat breeding. Additionally, starch synthesis is a ritual biological process for yield, considering the adverse effects and advantages of RS for end-use quality, the appropriate content of RS involved with quality, and yield improvement coordinately. The elite gene alleles were indicated in our association population, whereby most varieties were commercial varieties, functioned in a broad genetic background, and coordinated with the climate of the main planting regions in China, thus, making it convenient to accumulate high quality and yield genes with a high RS content. It is helpful to coordinately improve both nutritional quality and yield in wheat breeding.

5. Conclusions

In the present study, the RS content of the association population including 207 wheat varieties were measured under three locations. GWAS detected 14 QTL for the RS content under more than two environments, which contributed 5.41–8.81% to the phenotypic variation. The effect of SNP with the highest phenotypic contribution from each QTL was evaluated, and the SNP demonstrated an obvious additive effect on RS content. The variety Xi’nong979, which obtained the highest number of superior SNP (22) and a relatively high RS content (5.62%), would be useful for high-RS-content wheat improvement. Four genes, TraesCS4D03G0010800, TraesCS5A03G0943300, TraesCS6A03G1026400, and TraesCS7B03G0151400, with annotated functions of β-amylase, α-1,4 glucan phosphorylase, sucrose transporter, and NAC domain protein, respectively, were recognized as the putative candidates for RS content in the association population. Our present study provides genetic resources for high-RS wheat germplasm selection and variation breeding. The elite gene alleles and KASP marker would be used for nutritional quality improvement in wheat.

Supplementary Materials

The following supporting information can be downloaded at: https://0-www-mdpi-com.brum.beds.ac.uk/article/10.3390/agronomy12122967/s1, Figure S1: GO enrichment of 171 genes in the integrated QTL regions-Cellular Component; Figure S2: GO enrichment of 171 genes in the integrated QTL regions-Biological Process; Figure S3: GO enrichment of 171 genes in the integrated QTL regions-Molecular Function; Figure S4: KEGG enrichment of 171 genes in the integrated QTL regions. Table S1: Varieties used in the present study and the RS content under three locations; Table S2: Descriptive statistics of RS content under three locations in the association population; Table S3: Analysis of variance (ANOVA) and broad-sense heritability for RS content based on three environments; Table S4: Number of superior SNP and RS content of each accession in the association population; Table S5: Differentially expressed genes annotation in all the integrated QTL; Table S6: Primers designed based on KASP marker AX-94546744; Table S7: RS content and genotype detected by KASP marker developed from peak SNP AX-94546744; Table S8: Effect of candidate gene alleles on RS content in the association population.

Author Contributions

Conceptualization, Z.L. and Z.Z.; Data curation, J.H., H.D. and S.G.; Formal analysis, J.H. and Z.Z.; Funding acquisition, Z.W. and Z.L.; Investigation, H.D., Y.W., C.L., W.L., M.Q., P.Y. and Z.D.; Methodology, Y.W. and C.L.; Project administration, Z.W. and Z.L.; Software, X.S. and Y.W.; Supervision, B.T. and Z.W.; Visualization, S.G. and X.S.; Writing—original draft, J.H.; Writing—review and editing, J.H., W.Y. and Z.Z. All authors have read and agreed to the published version of the manuscript.

Funding

This project was financially supported by the Outstanding Youth Fund of Henan Academy of Agricultural Sciences (2021JQ04), Agriculture Research System of Henan Province (HARS-22–01-S and HARS-22–01-G3), Scientific and Technological Research Project of Henan Province (222102110082).

Data Availability Statement

The raw SLAF sequencing data can be found in Genome Sequence Archive (https://bigd.big.ac.cn/gsa/browse/CRA003543, accessed on 16 October 2022, PRJCA003913). The RNA-seq data are available in Genome Sequence Archive (https://bigd.big.ac.cn/gsa/browse/CRA004223, PRJCA005188/, accessed on 16 October 2022).

Conflicts of Interest

The authors declare no conflict of interest.

References

  1. Huang, L.; Tan, H.; Zhang, C.; Li, Q.; Liu, Q. Starch biosynthesis in cereal endosperms: An updated review over the last decade. Plant Commun. 2021, 2, 100237. [Google Scholar] [CrossRef]
  2. Macneill, G.J.; Sahar, M.; Minow, M.A.A.; Patterson, J.A.; Tetlow, I.J.; Emes, M.J. Starch as a source, starch as a sink: The bifunctional role of starch in carbon allocation. J. Exp. Bot. 2017, 68, 4433–4453. [Google Scholar]
  3. Englyst, H.; Kingman, S.; Cummings, J. Classification and Measurement of Nutritionally Important Starch Fractions. Eur. J. Clin. Nutr. 1992, 46, S33–S50. [Google Scholar]
  4. Englyst, H.N.; Cummings, J.H. Digestion of the polysaccharides of some cereal foods in the human small intestine. Am. J. Clin. Nutr. 1985, 42, 778–787. [Google Scholar]
  5. Bin, S.; Yin, Y.; Li, T.; Huang, R.; Zhang, P. Analysis of the resistant starch content in cereals. Feed. Res. 2006, 2006, 2. [Google Scholar]
  6. Slade, A.J.; McGuire, C.; Loeffler, D.; Mullenberg, J.; Skinner, W.; Fazio, G.; Holm, A.; Brandt, K.M.; Steine, M.N.; Goodstal, J.F.; et al. Development of high amylose wheat through TILLING. BMC Plant Biol. 2012, 12, 69. [Google Scholar] [CrossRef] [Green Version]
  7. Birt, D.F.; Boylston, T.; Hendrich, S.; Jane, J.L.; Hollis, J.; Li, L.; McClelland, J.; Moore, S.; Phillips, G.J.; Rowling, M.; et al. Resistant starch: Promise for improving human health. Adv. Nutr. 2013, 4, 587–601. [Google Scholar] [CrossRef] [Green Version]
  8. Woo, K.S.; Seib, P.A. Cross-Linked Resistant Starch: Preparation and Properties. Cereal Chem. 2002, 79, 819–825. [Google Scholar]
  9. Harris, K.F. An introductory review of resistant starch type 2 from high-amylose cereal grains and its effect on glucose and insulin homeostasis. Nutr. Rev. 2019, 77, 748–764. [Google Scholar] [CrossRef] [Green Version]
  10. Meseguer Soler, I.; Martinez Para, M.C.; Farre Rovira, R. Dietary fiber (I). Definition, properties and composition. Med. Clin. 1997, 109, 641–644. [Google Scholar]
  11. Roman, L.; Martinez, M.M. Structural Basis of Resistant Starch (RS) in Bread: Natural and Commercial Alternatives. Foods 2019, 8, 267. [Google Scholar] [CrossRef] [Green Version]
  12. Zhao, L.; Zhang, F.; Ding, X.; Wu, G.; Lam, Y.Y.; Wang, X.; Fu, H.; Xue, X.; Lu, C.; Ma, J.; et al. Gut bacteria selectively promoted by dietary fibers alleviate type 2 diabetes. Science 2018, 359, 1151–1156. [Google Scholar] [CrossRef] [Green Version]
  13. Ze, X.; Ben David, Y.; Laverde-Gomez, J.A.; Dassa, B.; Sheridan, P.O.; Duncan, S.H.; Louis, P.; Henrissat, B.; Juge, N.; Koropatkin, N.M.; et al. Unique Organization of Extracellular Amylases into Amylosomes in the Resistant Starch-Utilizing Human Colonic Firmicutes Bacterium Ruminococcus bromii. MBio 2015, 6, e01058–15. [Google Scholar] [CrossRef] [Green Version]
  14. Liu, S.; Willett, W.C.; Manson, J.E.; Hu, F.B.; Rosner, B.; Colditz, G. Relation between changes in intakes of dietary fiber and grain products and changes in weight and development of obesity among middle-aged women. Am. J. Clin. Nutr. 2003, 78, 920–927. [Google Scholar] [CrossRef] [Green Version]
  15. Peterson, C.M.; Beyl, R.A.; Marlatt, K.L.; Martin, C.K.; Aryana, K.J.; Marco, M.L.; Martin, R.J.; Keenan, M.J.; Eric, R. Effect of 12 wk of resistant starch supplementation on cardiometabolic risk factors in adults with prediabetes: A randomized controlled trial. Am. J. Clin. Nutr. 2018, 108, 492–501. [Google Scholar]
  16. Cook, T.M.; Mansuy-Aubert, V. Communication between the gut microbiota and peripheral nervous system in health and chronic disease. Gut Microbes 2022, 14, 2068365. [Google Scholar] [CrossRef]
  17. Corfield, A.P. The Interaction of the Gut Microbiota with the Mucus Barrier in Health and Disease in Human. Microorganisms 2018, 6, 78. [Google Scholar] [CrossRef]
  18. Kovatcheva-Datchary, P.; Egert, M.; Maathuis, A.; Rajilic-Stojanovic, M.; de Graaf, A.A.; Smidt, H.; de Vos, W.M.; Venema, K. Linking phylogenetic identities of bacteria to starch fermentation in an in vitro model of the large intestine by RNA-based stable isotope probing. Environ. Microbiol. 2009, 11, 914–926. [Google Scholar] [CrossRef]
  19. Zhang, L.; Ouyang, Y.; Li, H.; Shen, L.; Ni, Y.; Fang, Q.; Wu, G.; Qian, L.; Xiao, Y.; Zhang, J.; et al. Metabolic phenotypes and the gut microbiota in response to dietary resistant starch type 2 in normal-weight subjects: A randomized crossover trial. Sci. Rep. 2019, 9, 4736. [Google Scholar] [CrossRef] [Green Version]
  20. Scarpellini, E.; Balsiger, L.M.; Maurizi, V.; Rinninella, E.; Gasbarrini, A.; Giostra, N.; Santori, P.; Abenavoli, L.; Rasetti, C. Zinc and gut microbiota in health and gastrointestinal disease under the COVID-19 suggestion. Biofactors 2022, 48, 294–306. [Google Scholar] [CrossRef]
  21. Sanders, L.M.; Dicklin, M.R.; Palacios, O.M.; Maki, C.E.; Wilcox, M.L.; Maki, K.C. Effects of potato resistant starch intake on insulin sensitivity, related metabolic markers and appetite ratings in men and women at risk for type 2 diabetes: A pilot cross-over randomised controlled trial. J. Hum. Nutr. Diet. 2021, 34, 94–105. [Google Scholar] [CrossRef]
  22. Song, X.; Dong, H.; Zang, Z.; Wu, W.; Zhu, W.; Zhang, H.; Guan, Y. Kudzu Resistant Starch: An Effective Regulator of Type 2 Diabetes Mellitus. Oxid. Med. Cell. Longev. 2021, 2021, 4448048. [Google Scholar] [CrossRef]
  23. Murphy, M.M.; Douglass, J.S.; Birkett, A. Resistant starch intakes in the United States. J. Am. Diet. Assoc. 2008, 108, 67–78. [Google Scholar] [CrossRef]
  24. Wang, Q.; Wang, P.; Xiao, Z. Resistant starch prevents tumorigenesis of dimethylhydrazine-induced colon tumors via regulation of an ER stress-mediated mitochondrial apoptosis pathway. Int. J. Mol. Med. 2018, 41, 1887–1898. [Google Scholar] [CrossRef]
  25. Lafiandra, D.; Riccardi, G.; Shewry, P.R. Improving cereal grain carbohydrates for diet and health. J. Cereal Sci. 2014, 59, 312–326. [Google Scholar] [CrossRef] [Green Version]
  26. Li, J.; Jiao, G.; Sun, Y.; Chen, J.; Zhong, Y.; Yan, L.; Jiang, D.; Ma, Y.; Xia, L. Modification of starch composition, structure and properties through editing of TaSBEIIa in both winter and spring wheat varieties by CRISPR/Cas9. Plant Biotechnol. J. 2021, 19, 937–951. [Google Scholar] [CrossRef]
  27. Mishra, A.; Singh, A.; Sharma, M.; Kumar, P.; Roy, J. Development of EMS-induced mutation population for amylose and resistant starch variation in bread wheat (Triticum aestivum) and identification of candidate genes responsible for amylose variation. BMC Plant Biol. 2016, 16, 217. [Google Scholar] [CrossRef]
  28. Qu, J.; Xu, S.; Zhang, Z.; Chen, G.; Zhong, Y.; Liu, L.; Zhang, R.; Xue, J.; Guo, D. Evolutionary, structural and expression analysis of core genes involved in starch synthesis. Sci. Rep. 2018, 8, 12736. [Google Scholar] [CrossRef]
  29. Wang, Z.Y.; Wu, Z.L.; Xing, Y.Y.; Zheng, F.G.; Guo, X.L.; Zhang, W.G.; Hong, M.M. Nucleotide sequence of rice waxy gene. Nucleic Acids Res. 1990, 18, 5898. [Google Scholar] [CrossRef] [Green Version]
  30. Streb, S.; Delatte, T.; Umhang, M.; Eicke, S.; Schorderet, M.; Reinhardt, D.; Zeeman, S.C. Starch granule biosynthesis in Arabidopsis is abolished by removal of all debranching enzymes but restored by the subsequent removal of an endoamylase. Plant Cell 2008, 20, 3448–3466. [Google Scholar] [CrossRef] [Green Version]
  31. Yun, M.S.; Umemoto, T.; Kawagoe, Y. Rice debranching enzyme isoamylase3 facilitates starch metabolism and affects plastid morphogenesis. Plant Cell Physiol. 2011, 52, 1068–1082. [Google Scholar] [CrossRef] [Green Version]
  32. Nishi, A.; Nakamura, Y.; Tanaka, N.; Satoh, H. Biochemical and genetic analysis of the effects of amylose-extender mutation in rice endosperm. Plant Physiol. 2001, 127, 459–472. [Google Scholar]
  33. Regina, A.; Bird, A.; Topping, D.; Bowden, S.; Freeman, J.; Barsby, T.; Kosar-Hashemi, B.; Li, Z.; Rahman, S.; Morell, M. High-amylose wheat generated by RNA interference improves indices of large-bowel health in rats. Proc. Natl. Acad. Sci. USA 2006, 103, 3546–3551. [Google Scholar] [CrossRef] [Green Version]
  34. Chen, M.H.; Bergman, C.J.; McClung, A.M.; Everette, J.D.; Tabien, R.E. Resistant starch: Variation among high amylose rice varieties and its relationship with apparent amylose content, pasting properties and cooking methods. Food Chem. 2017, 234, 180–189. [Google Scholar]
  35. Yadav, B.S.; Sharma, A.; Yadav, R.B. Resistant starch content of conventionally boiled and pressure-cooked cereals, legumes and tubers. J. Food Sci. Technol. 2010, 47, 84–88. [Google Scholar] [CrossRef] [Green Version]
  36. Schoen, A.; Joshi, A.; Tiwari, V.; Gill, B.S.; Rawat, N. Triple null mutations in starch synthase SSIIa gene homoeologs lead to high amylose and resistant starch in hexaploid wheat. BMC Plant Biol. 2021, 21, 74. [Google Scholar] [CrossRef]
  37. Fahy, B.; Gonzalez, O.; Savva, G.M.; Ahn-Jarvis, J.H.; Warren, F.J.; Dunn, J.; Lovegrove, A.; Hazard, B.A. Loss of starch synthase IIIa changes starch molecular structure and granule morphology in grains of hexaploid bread wheat. Sci. Rep. 2022, 12, 10806. [Google Scholar] [CrossRef]
  38. Sparla, F.; Falini, G.; Botticella, E.; Pirone, C.; Talame, V.; Bovina, R.; Salvi, S.; Tuberosa, R.; Sestili, F.; Trost, P. New starch phenotypes produced by TILLING in barley. PLoS ONE 2014, 9, e107779. [Google Scholar] [CrossRef] [Green Version]
  39. Kim, K.H.; Kim, J.Y. Understanding Wheat Starch Metabolism in Properties, Environmental Stress Condition, and Molecular Approaches for Value-Added Utilization. Plants 2021, 10, 2282. [Google Scholar] [CrossRef]
  40. Foschia, M.; Beraldo, P.; Peressini, D. Evaluation of the physicochemical properties of gluten-free pasta enriched with resistant starch. J. Sci. Food Agric. 2017, 97, 572–577. [Google Scholar] [CrossRef]
  41. Fiszman, S.M.; Salvador, A.; Baixauli, R.; Sanz, T. Muffins with resistant starch: Baking performance in relation to the rheological properties of the batter. J. Cereal Sci. 2008, 47, 502–509. [Google Scholar]
  42. Rohlfing, K.A.; Paez, A.; Kim, H.J.; White, P.J. Effects of Resistant Starch and Fiber from High-Amylose Non-Floury Corn on Tortilla Texture. Cereal Chem. 2010, 87, 581–585. [Google Scholar]
  43. Korus, J.; Witczak, M.; Ziobro, R.; Juszczak, L. The impact of resistant starch on characteristics of gluten-free dough and bread. Food Hydrocoll. 2009, 23, 988–995. [Google Scholar]
  44. Keeling, P.; Banisadr, R.; Barone, L.; Wasserman, B.; Singletary, G. Effect of Temperature on Enzymes in the Pathway of Starch Biosynthesis in Developing Wheat and Maize Grain. Aust. J. Plant Physiol. 1994, 21, 807. [Google Scholar]
  45. Liu, C.; Zhou, Z.; Wu, Z.; Qin, M.; Shi, X.; Wang, Y.; Li, W.; Yao, W.; Lei, Z.; Zhao, R. In-depth genetic analysis reveals conditioning of polyphenol oxidase activity in wheat grains by cis regulation of TaPPO2A-1 expression level. Genomics 2020, 112, 4690–4700. [Google Scholar] [CrossRef]
  46. Zhou, Z.; Guan, H.; Liu, C.; Zhang, Z.; Geng, S.; Qin, M.; Li, W.; Shi, X.; Dai, Z.; Lei, Z.; et al. Identification of genomic regions affecting grain peroxidase activity in bread wheat using genome-wide association study. BMC Plant Biol. 2021, 21, 523. [Google Scholar] [CrossRef]
  47. Shi, X.; Zhou, Z.; Li, W.; Qin, M.; Yang, P.; Hou, J.; Huang, F.; Lei, Z.; Wu, Z.; Wang, J. Genome-wide association study reveals the genetic architecture for calcium accumulation in grains of hexaploid wheat (Triticum aestivum L.). BMC Plant Biol. 2022, 22, 229. [Google Scholar] [CrossRef]
  48. Zhou, Z.; Shi, X.; Zhao, G.; Qin, M.; Ibba, M.I.; Wang, Y.; Li, W.; Yang, P.; Wu, Z.; Lei, Z.; et al. Identification of Novel Genomic Regions and Superior Alleles Associated with Zn Accumulation in Wheat Using a Genome-Wide Association Analysis Method. Int. J. Mol. Sci. 2020, 21, 1928. [Google Scholar] [CrossRef] [Green Version]
  49. Mccleary, B.V.; Mcloughlin, C.; Charmier, L.; Mcgeough, P. Measurement of available carbohydrates, digestible and resistant starch in food ingredients and products. Cereal Chem. 2019, 97, 114–137. [Google Scholar]
  50. Rasheed; Awais; Liu; Jindong; Guo; Qi; Dreisigacker; Susanne; Zhai; Shengnan. Development and validation of KASP assays for genes underpinning key economic traits in bread wheat. Theor. Appl. Genet. Int. J. Breed. Res. Cell Genet. 2016, 129, 1843–1860. [Google Scholar]
  51. Seung, D.; Smith, A.M. Starch granule initiation and morphogenesis-progress in Arabidopsis and cereals. J. Exp. Bot. 2019, 70, 771–784. [Google Scholar] [CrossRef]
  52. Hwang, S.K.; Koper, K.; Satoh, H.; Okita, T.W. Rice Endosperm Starch Phosphorylase (Pho1) Assembles with Disproportionating Enzyme (Dpe1) to Form a Protein Complex That Enhances Synthesis of Malto-oligosaccharides. J. Biol. Chem. 2016, 291, 19994–20007. [Google Scholar] [CrossRef] [Green Version]
  53. Malinova, I.; Qasim, H.M.; Brust, H.; Fettke, J. Parameters of Starch Granule Genesis in Chloroplasts of Arabidopsis thaliana. Front. Plant Sci. 2018, 9, 761. [Google Scholar] [CrossRef]
  54. Cuesta-Seijo, J.A.; Nielsen, M.M.; Ruzanski, C.; Krucewicz, K.; Beeren, S.R.; Rydhal, M.G.; Yoshimura, Y.; Striebeck, A.; Motawia, M.S.; Willats, W.G.; et al. In vitro Biochemical Characterization of All Barley Endosperm Starch Synthases. Front. Plant Sci. 2015, 6, 1265. [Google Scholar] [CrossRef] [Green Version]
  55. Nakamura, Y.; Ono, M.; Utsumi, C.; Steup, M. Functional interaction between plastidial starch phosphorylase and starch branching enzymes from rice during the synthesis of branched maltodextrins. Plant Cell Physiol. 2012, 53, 869–878. [Google Scholar] [CrossRef]
  56. Tetlow, I.J. Starch biosynthesis in developing seeds. Seed Sci. Res. 2011, 21, 5–32. [Google Scholar]
  57. Zhou, H.; Wang, L.; Liu, G.; Meng, X.; Jing, Y.; Shu, X.; Kong, X.; Sun, J.; Yu, H.; Smith, S.M.; et al. Critical roles of soluble starch synthase SSIIIa and granule-bound starch synthase Waxy in synthesizing resistant starch in rice. Proc. Natl. Acad. Sci. USA 2016, 113, 12844–12849. [Google Scholar] [CrossRef] [Green Version]
  58. Baysal, C.; He, W.; Drapal, M.; Villorbina, G.; Medina, V.; Capell, T.; Khush, G.S.; Zhu, C.; Fraser, P.D.; Christou, P. Inactivation of rice starch branching enzyme IIb triggers broad and unexpected changes in metabolism by transcriptional reprogramming. Proc. Natl. Acad. Sci. USA 2020, 117, 26503–26512. [Google Scholar] [CrossRef]
  59. Hayashi, M.; Crofts, N.; Oitome, N.F.; Fujita, N. Analyses of starch biosynthetic protein complexes and starch properties from developing mutant rice seeds with minimal starch synthase activities. BMC Plant Biol. 2018, 18, 59. [Google Scholar] [CrossRef] [Green Version]
  60. Abt, M.R.; Zeeman, S.C. Evolutionary innovations in starch metabolism. Curr. Opin. Plant Biol. 2020, 55, 109–117. [Google Scholar] [CrossRef]
  61. Oa, W.; Chloroplasts, A.; Smith, S.M.; Samuel, C. β-AMYLASE4, a Noncatalytic Protein Required for Starch Breakdown, Acts Upstream of Three Active β-Amylases in Arabidopsis Chloroplasts. Plant Cell 2008, 20, 1040–1058. [Google Scholar]
  62. Du, L.; Xu, F.; Fang, J.; Gao, S.; Tang, J.; Fang, S.; Wang, H.; Tong, H.; Zhang, F.; Chu, J.; et al. Endosperm sugar accumulation caused by mutation of PHS8/ISA1 leads to pre-harvest sprouting in rice. Plant J. 2018, 95, 545–556. [Google Scholar] [CrossRef] [Green Version]
  63. Weschke, W.; Panitz, R.; Sauer, N.; Wang, Q.; Neubohn, B.; Weber, H.; Wobus, U. Sucrose transport into barley seeds: Molecular characterization of two transporters and implications for seed development and starch accumulation. Plant J. 2000, 21, 455–467. [Google Scholar] [CrossRef] [Green Version]
  64. Liu, Y.; Hou, J.; Wang, X.; Li, T.; Majeed, U.; Hao, C.; Zhang, X. The NAC transcription factor NAC019-A1 is a negative regulator of starch synthesis in wheat developing endosperm. J. Exp. Bot. 2020, 71, 5794–5807. [Google Scholar] [CrossRef]
  65. Gao, Y.; An, K.; Guo, W.; Chen, Y.; Zhang, R.; Zhang, X.; Chang, S.; Vincenzo, R.; Jin, F.; Cao, X. The endosperm-specific transcription factor TaNAC019 regulates glutenin and starch accumulation and its elite allele improves wheat grain quality. Plant Cell 2021, 33, 603–622. [Google Scholar]
  66. Hennen-Bierwagen, T.A.; Lin, Q.; Grimaud, F.; Planchot, V.; Keeling, P.L.; James, M.G.; Myers, A.M. Proteins from multiple metabolic pathways associate with starch biosynthetic enzymes in high molecular weight complexes: A model for regulation of carbon allocation in maize amyloplasts. Plant Physiol. 2009, 149, 1541–1559. [Google Scholar] [CrossRef] [Green Version]
  67. Shen, L.; Li, J.; Li, Y. Resistant starch formation in rice: Genetic regulation and beyond. Plant Commun. 2022, 3, 100329. [Google Scholar] [CrossRef]
  68. Hirano, H.Y.; Sano, Y. Enhancement of Wx gene expression and the accumulation of amylose in response to cool temperatures during seed development in rice. Plant Cell Physiol. 1998, 39, 807–812. [Google Scholar]
  69. Fan, X.; Li, Y.; Lu, Y.; Zhang, C.; Li, E.; Li, Q.; Tao, K.; Yu, W.; Wang, J.; Chen, Z.; et al. The interaction between amylose and amylopectin synthesis in rice endosperm grown at high temperature. Food Chem. 2019, 301, 125258. [Google Scholar] [CrossRef]
  70. Hakata, M.; Kuroda, M.; Miyashita, T.; Yamaguchi, T.; Kojima, M.; Sakakibara, H.; Mitsui, T.; Yamakawa, H. Suppression of alpha-amylase genes improves quality of rice grain ripened under high temperature. Plant Biotechnol. J. 2012, 10, 1110–1117. [Google Scholar] [CrossRef] [Green Version]
  71. Radchuk, V.V.; Borisjuk, L.; Sreenivasulu, N.; Merx, K.; Mock, H.P.; Rolletschek, H.; Wobus, U.; Weschke, W. Spatiotemporal profiling of starch biosynthesis and degradation in the developing barley grain. Plant Physiol. 2009, 150, 190–204. [Google Scholar] [CrossRef] [Green Version]
  72. Xu, H.; Li, X.; Zhang, H.; Wang, L.; Zhu, Z.; Gao, J.; Li, C.; Zhu, Y. High temperature inhibits the accumulation of storage materials by inducing alternative splicing of OsbZIP58 during filling stage in rice. Plant Cell Environ. 2020, 43, 1879–1896. [Google Scholar] [CrossRef]
  73. You, Q.; Huang, J.; Feng, W.; Su, X.; Wang, W.; Yang, M. Study on the method of resistant starch measurement in wheat flour. J. Henan Univ. Technol. 2014, 35, 4. [Google Scholar]
  74. Štěrbová, L.; Bradová, J.; Sedlá?ek, T.; Holasová, M.; Fiedlerová, V.; Dvořáček, V.; Smrčková, P. Influence of technological processing of wheat grain on starch digestibility and resistant starch content. Starch Stärke 2016, 68, 593–602. [Google Scholar]
  75. Bao, J.; Xin, Z.; Xu, F.; Qiang, H.; Park, Y.J. Genome-wide association study of the resistant starch content in rice grains: Genome-wide association study of resistant starch in rice. Starch Stärke 2017, 69, 1600343. [Google Scholar]
  76. Zhang, C.; Zhu, J.; Chen, S.; Fan, X.; Li, Q.; Lu, Y.; Wang, M.; Yu, H.; Yi, C.; Tang, S.; et al. Wx(lv), the Ancestral Allele of Rice Waxy Gene. Mol. Plant 2019, 12, 1157–1166. [Google Scholar] [CrossRef] [Green Version]
  77. Zeng, D.; Liu, T.; Ma, X.; Wang, B.; Zheng, Z.; Zhang, Y.; Xie, X.; Yang, B.; Zhao, Z.; Zhu, Q.; et al. Quantitative regulation of Waxy expression by CRISPR/Cas9-based promoter and 5’UTR-intron editing improves grain quality in rice. Plant Biotechnol. J. 2020, 18, 2385–2387. [Google Scholar] [CrossRef]
  78. Zhou, H.; Xia, D.; Zhao, D.; Li, Y.; Li, P.; Wu, B.; Gao, G.; Zhang, Q.; Wang, G.; Xiao, J.; et al. The origin of Wx(la) provides new insights into the improvement of grain quality in rice. J. Integr. Plant Biol. 2021, 63, 878–888. [Google Scholar] [CrossRef]
  79. Zhang, C.; Yang, Y.; Chen, Z.; Chen, F.; Pan, L.; Lu, Y.; Li, Q.; Fan, X.; Sun, Z.; Liu, Q. Characteristics of Grain Physicochemical Properties and the Starch Structure in Rice Carrying a Mutated ALK/SSIIa Gene. J. Agric. Food Chem. 2020, 68, 13950–13959. [Google Scholar] [CrossRef]
  80. Chen, Z.; Lu, Y.; Feng, L.; Hao, W.; Li, C.; Yang, Y.; Fan, X.; Li, Q.; Zhang, C.; Liu, Q. Genetic Dissection and Functional Differentiation of ALK(a) and ALK(b), Two Natural Alleles of the ALK/SSIIa Gene, Responding to Low Gelatinization Temperature in Rice. Rice 2020, 13, 39. [Google Scholar] [CrossRef]
  81. Guo, D.; Ling, X.; Zhou, X.; Li, X.; Wang, J.; Qiu, S.; Yang, Y.; Zhang, B. Evaluation of the Quality of a High-Resistant Starch and Low-Glutelin Rice (Oryza sativa L.) Generated through CRISPR/Cas9-Mediated Targeted Mutagenesis. J. Agric. Food Chem. 2020, 68, 9733–9742. [Google Scholar] [CrossRef]
  82. Nakamura, T.; Yamamori, M.; Hirano, H.; Hidaka, S.; Nagamine, T. Production of waxy (amylose-free) wheats. Mol. Gen. Genet. 1995, 248, 253–259. [Google Scholar] [CrossRef]
  83. Shimbata, T.; Nakamura, T.; Vrinten, P.; Saito, M.; Yonemaru, J.; Seto, Y.; Yasuda, H. Mutations in wheat starch synthase II genes and PCR-based selection of a SGP-1 null line. Theor. Appl. Genet. 2005, 111, 1072–1079. [Google Scholar] [CrossRef]
  84. Saito, M.; Vrinten, P.; Ishikawa, G.; Graybosch, R.; Nakamura, T. A novel codominant marker for selection of the null Wx-B1 allele in wheat breeding programs. Mol. Breed. 2009, 23, 209–217. [Google Scholar]
  85. Yamamori, M.; Kato, M.; Yui, M.; Kawasaki, M. Resistant starch and starch pasting properties of a starch synthase IIa-deficient wheat with apparent high amylose. Crop Pasture Sci. 2006, 57, 531–535. [Google Scholar]
Figure 1. Phenotypic distribution of the RS content in the association population and the average RS content under three locations. The locations where the association population planted were labeled under the x-axis, while the RS content was displayed in the y-axis. The dots with different colors represent the value of RS content of each variety in the association population. Different color represent RS content investigated from different locations.
Agronomy 12 02967 g001
Figure 2. Manhattan and Q-Q plots for RS content in the association population under three locations. AH, KH, and SH represent the planting location of Yuanyang, Kaifeng, and Shangqiu, respectively, while BLUP represents the BLUP values of the three environments. The red, horizontal dotted line in Manhattan plots indicates the significance threshold line (−log10 P = 3). The red dotted lines in Q-Q plots represent the theoretical values of observed −log10 P equal to expected −log10 P. The blue shades indicate the theoretical threshold.
Agronomy 12 02967 g002
Figure 3. The physical position of the 14 RS content-related QTL. The centromere structure was marked by black bars. QTL detected from various locations were marked by four colors. KH, SH, AH, and Rsblup represent QTL detected from Kaifeng, Shangqiu, Yuanyang, and BLUP.
Agronomy 12 02967 g003
Figure 4. Additive effect of the superior alleles to the RS content in the association population. Correlation analysis between the number of superior SNP alleles and RS content. The dots represent varieties with various superior alleles; the RS content was marked on the y-axis accordingly. The dotted line represented fitted correlation line. The green dots showed varieties in the association population.
Agronomy 12 02967 g004
Figure 5. The effect of the AX-94546744 SNP on RS content in the association population. The blue and orange bars represent the RS content of vaireties with AX-94546744-C and AX-94546744-T in the association population. The genotype of the SNP is labeled under the x-axis. The y-axis indicates the RS content of each group. ** indicates the significance differences among the various genotypes at p < 0.01 level (ANOVA).
Agronomy 12 02967 g005
Table 1. Genetic loci for RS content in the association population under three locations identified through GWAS.
CodeIntegrated QTL aPeak SNP−Log10 PR2(%) bLocations c
1qRS.2AL-1AX-1109119913.04–3.065.56–7.08KH, BLUP
2qRS.2AL-2AX-1103712303.02–3.455.41–7.75KH, SH, BLUP
3qRS.2AL-3AX-1115645753.09–3.527.06–8.24SH, BLUP
4qRS.2BSAX-952584783.03–3.755.71–7.12AH, SH
5qRS.2DL-1AX-1118380513.06–4.035.56–8.07KH, AH, BLUP
6qRS.2DL-2AX-1111414773.21–3.436.01–8.00KH, AH, BLUP
7qRS.3ALAX-948533653.05–3.195.62–5.85AH, BLUP
8qRS.4ALAX-948333693.09–3.695.63–6.94AH, BLUP
9qRS.4DSAX-945467443.00–3.305.52–7.82SH, BLUP
10qRS.5ASAX-1094483733.21–3.285.90–7.53SH, BLUP
11qRS.5ALAX-1089692383.00–3.036.95–7.04KH, BLUP
12qRS.5BLAX-1105457223.01–4.125.38–7.93KH, SH, BLUP
13qRS.6ALAX-1110796853.03–3.765.41–8.81KH, SH, BLUP
14qRS.7BSAX-1111403363.06–3.415.48–6.42SH, BLUP
a The name of integrated QTL according to the nomenclature of QTL. The abbreviation of the trait-resistant starch following the chromosome which the QTL located. b Phenotypic contribution of each genetic loci. c AH, KH, and SH represent the planting location of Yuanyang, Kaifeng, and Shangqiu, respectively, while BLUP represents the BLUP values of the three environments.
Table 2. Evaluation of the superior alleles in significant SNP.
CodePeak SNPSNPNo. of Variety aRS Content (%) b
1AX-110911991A/G157/495.09/5.21 *
2AX-110371230A/G41/1595.22/5.11 *
3AX-111564575C/T36/1624.99/5.17 **
4AX-95258478A/R182/255.11/5.27 *
5AX-111838051C/G80/1255.18/5.08 *
6AX-111141477A/G80/1255.18/5.08 *
7AX-94853365C/S167/395.16/4.99 **
8AX-94833369C/Y179/285.16/4.89 ***
9AX-94546744C/T/Y26/25/1524.88/5.18/5.16 (a/b/b)
10AX-109448373A/G/R43/59/1025.02/5.15/5.16 (a/b/b)
11AX-108969238C/T149/555.16/5.05 *
12AX-110545722A/G109/985.17/5.07 *
13AX-111079685A/G138/655.17/5.05 **
14AX-111140336C/T146/595.07/5.27 ***
The values in the column “No. of varieties” and “RS content (%)” were, in turn, corresponding to the genotypes in column “SNP”. a The total number may not add up to 207, which is the variety number that consisted in the association population in cases where the genotype of some lines were missing. b RS content differentiation between genotypes in each SNP. *, **, and *** indicate the different level at p < 0.05, 0.01, and 0.001 (t-test), respectively. The lowercase letters, a and b, in the brackets indicate significant differences after an analysis of variance (p < 0.05).
Publisher’s Note: MDPI stays neutral with regard to jurisdictional claims in published maps and institutional affiliations.

