
UV-B Radiation as a Novel Tool to Modulate the Architecture of In Vitro Grown Mentha spicata (L.)
 , and
, and 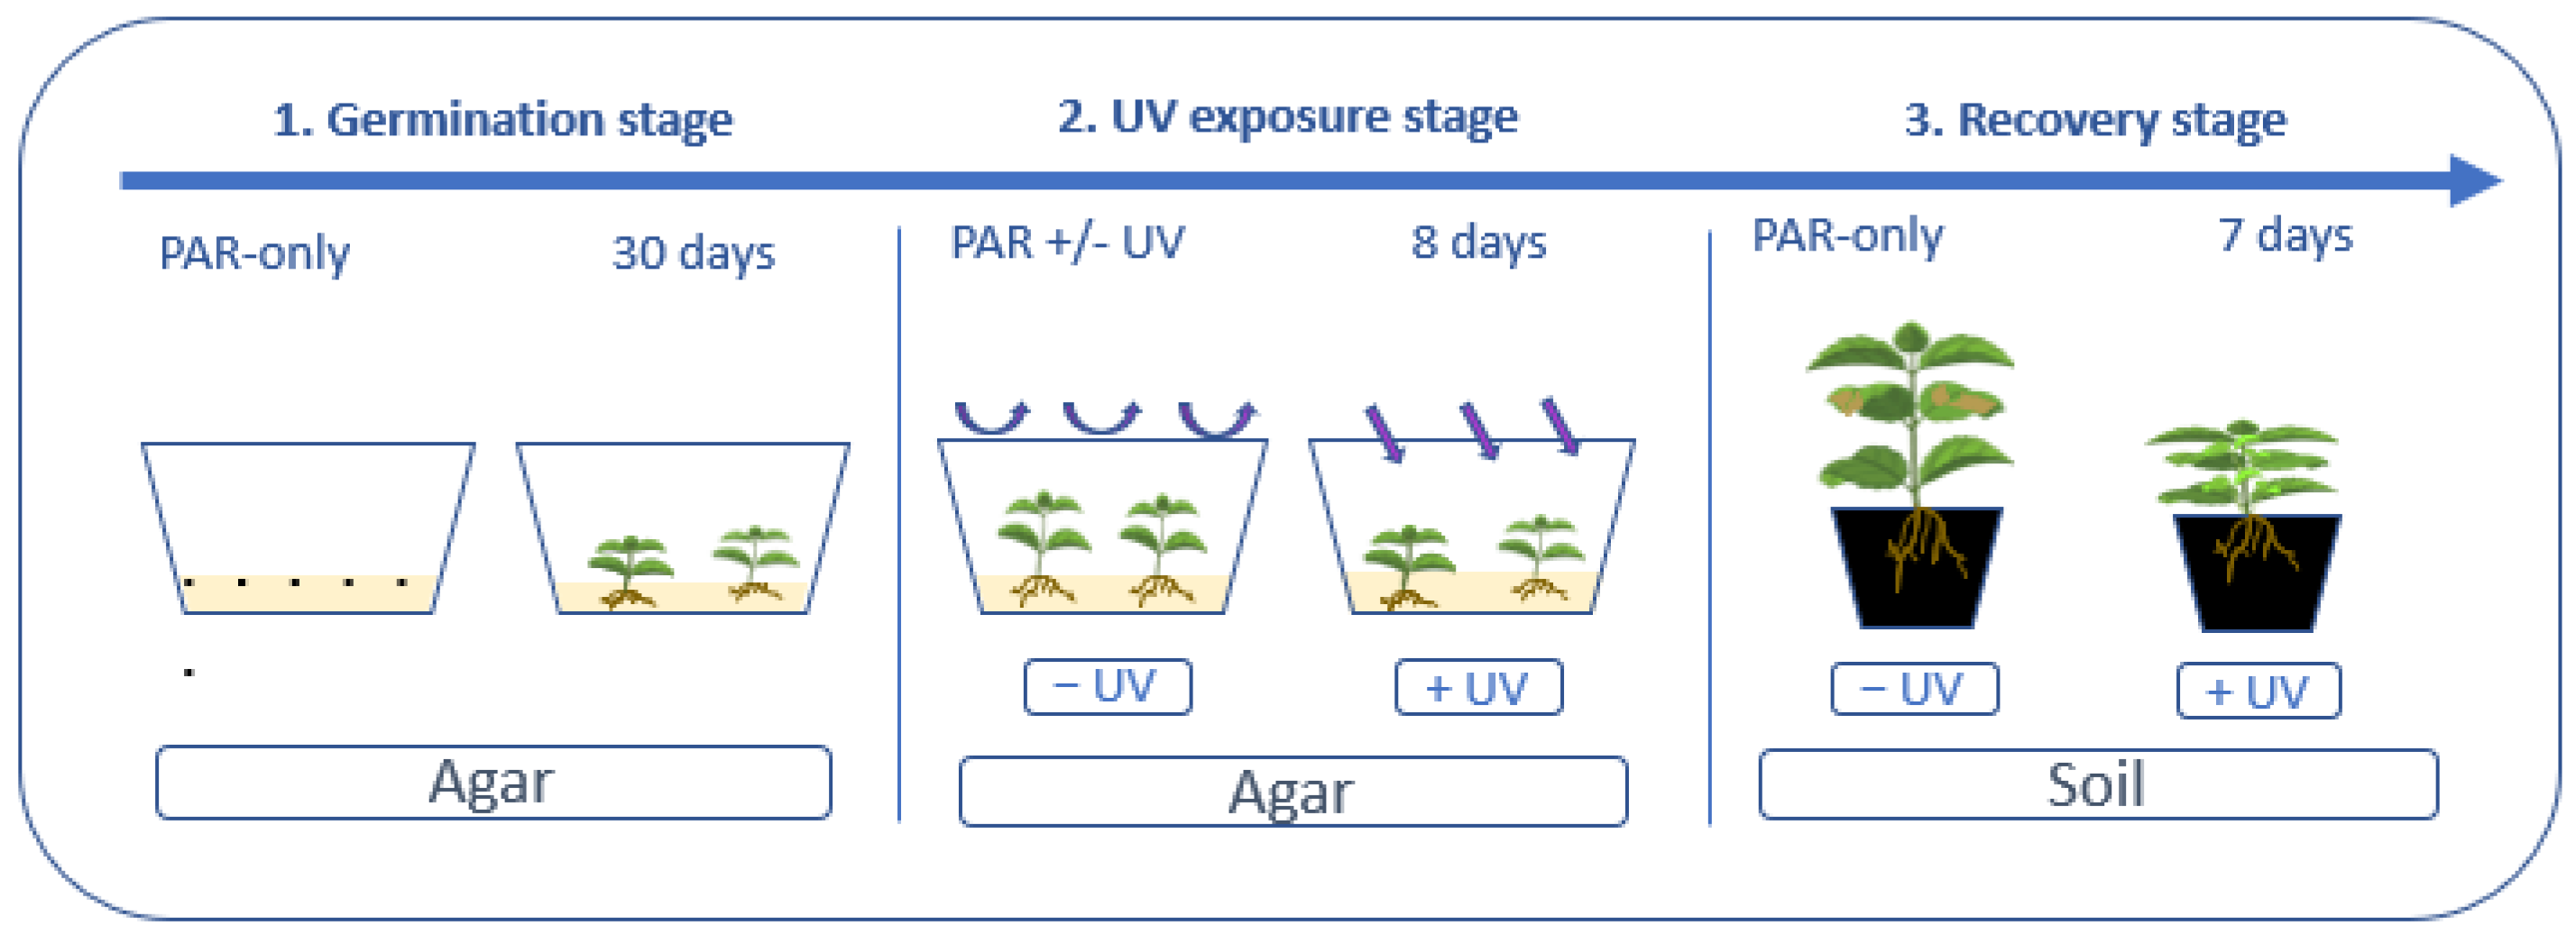
Abstract
:1. Introduction
2. Materials and Methods
2.1. Experimental Set-Up
2.1.1. Plant Material and Germination Stage
2.1.2. UV—Exposure Stage
2.1.3. Recovery Stage
2.1.4. Light, Humidity and Temperature Conditions
2.2. Biometric Analysis
2.3. Root Morphology
2.4. Hormone Analysis
2.5. Statistical Analysis
3. Results
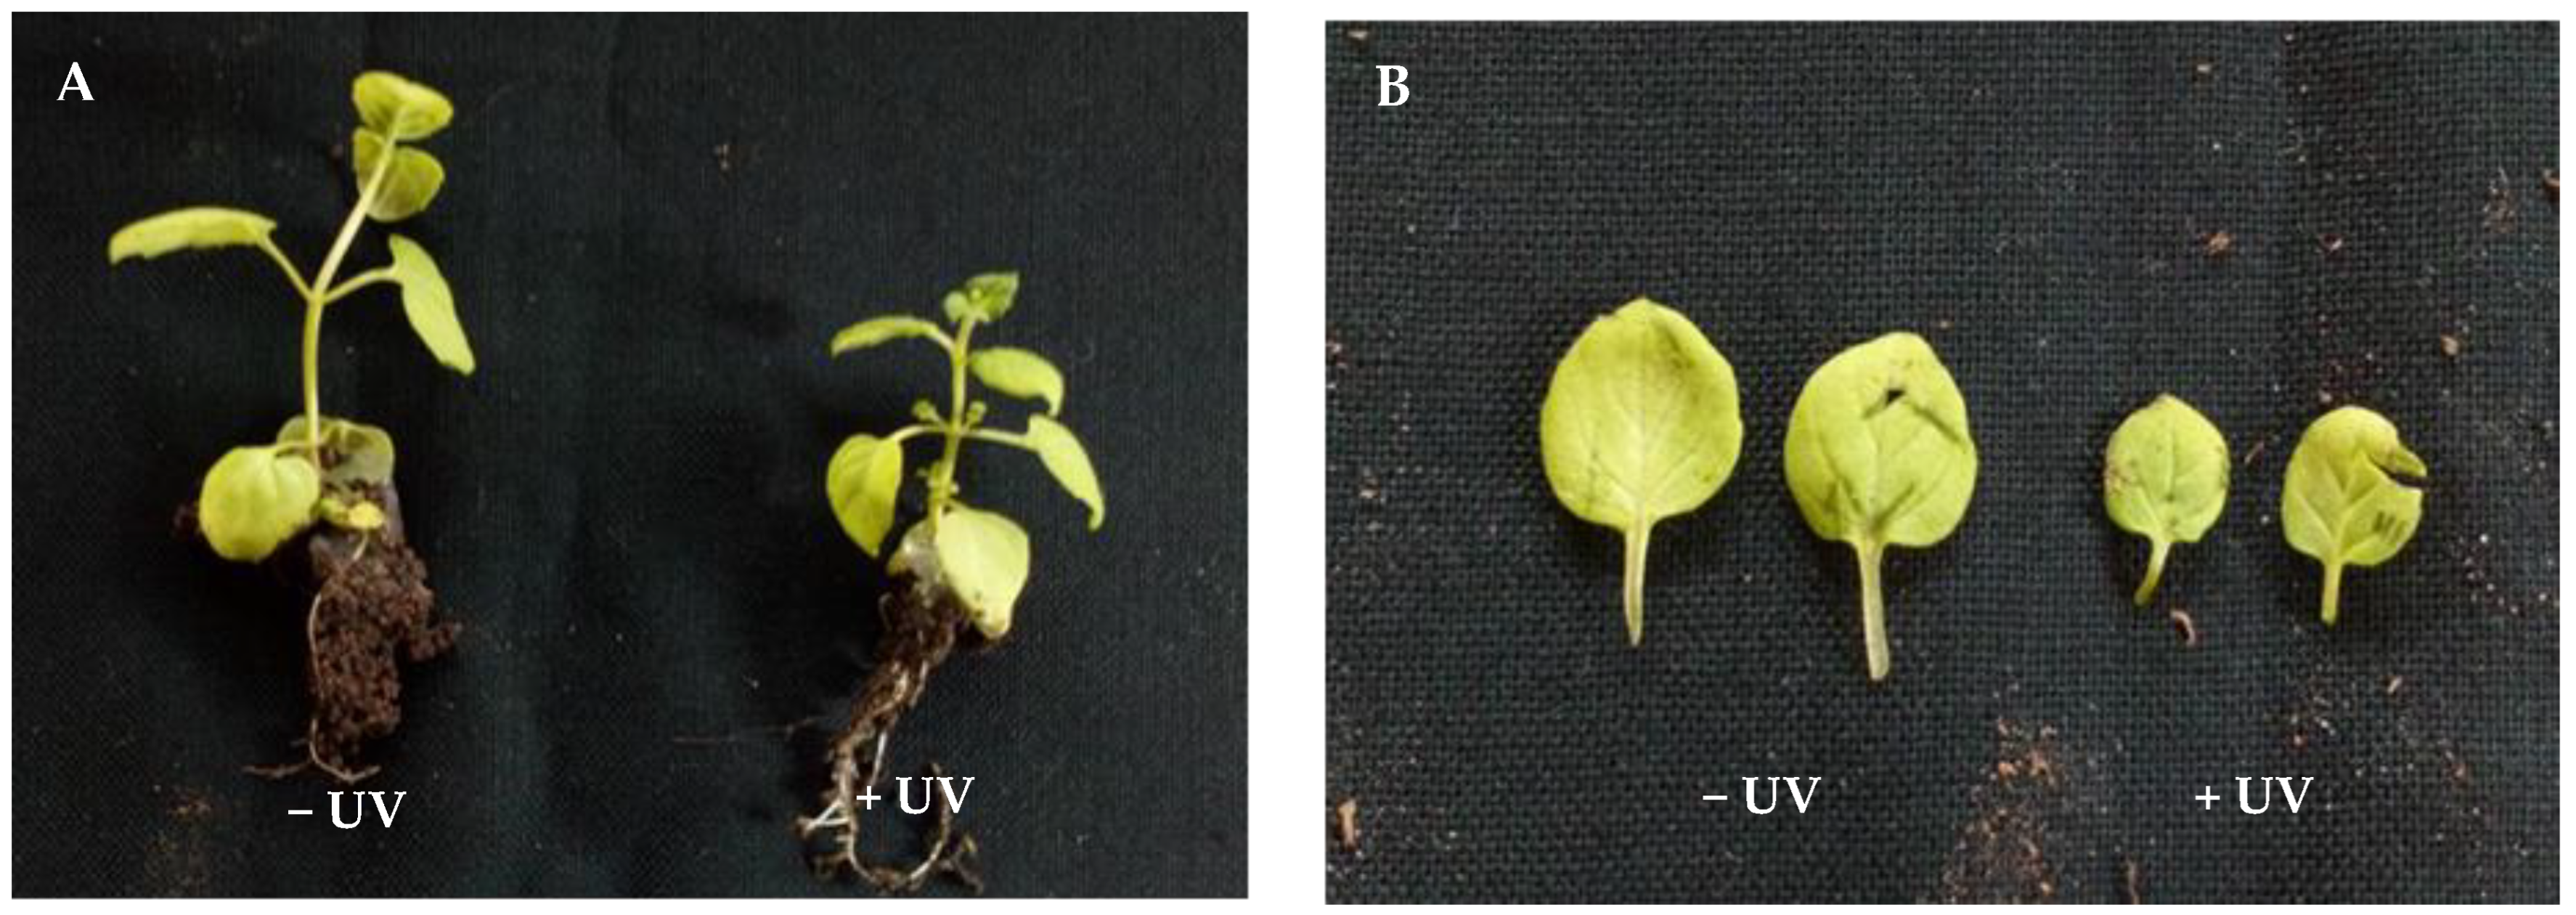
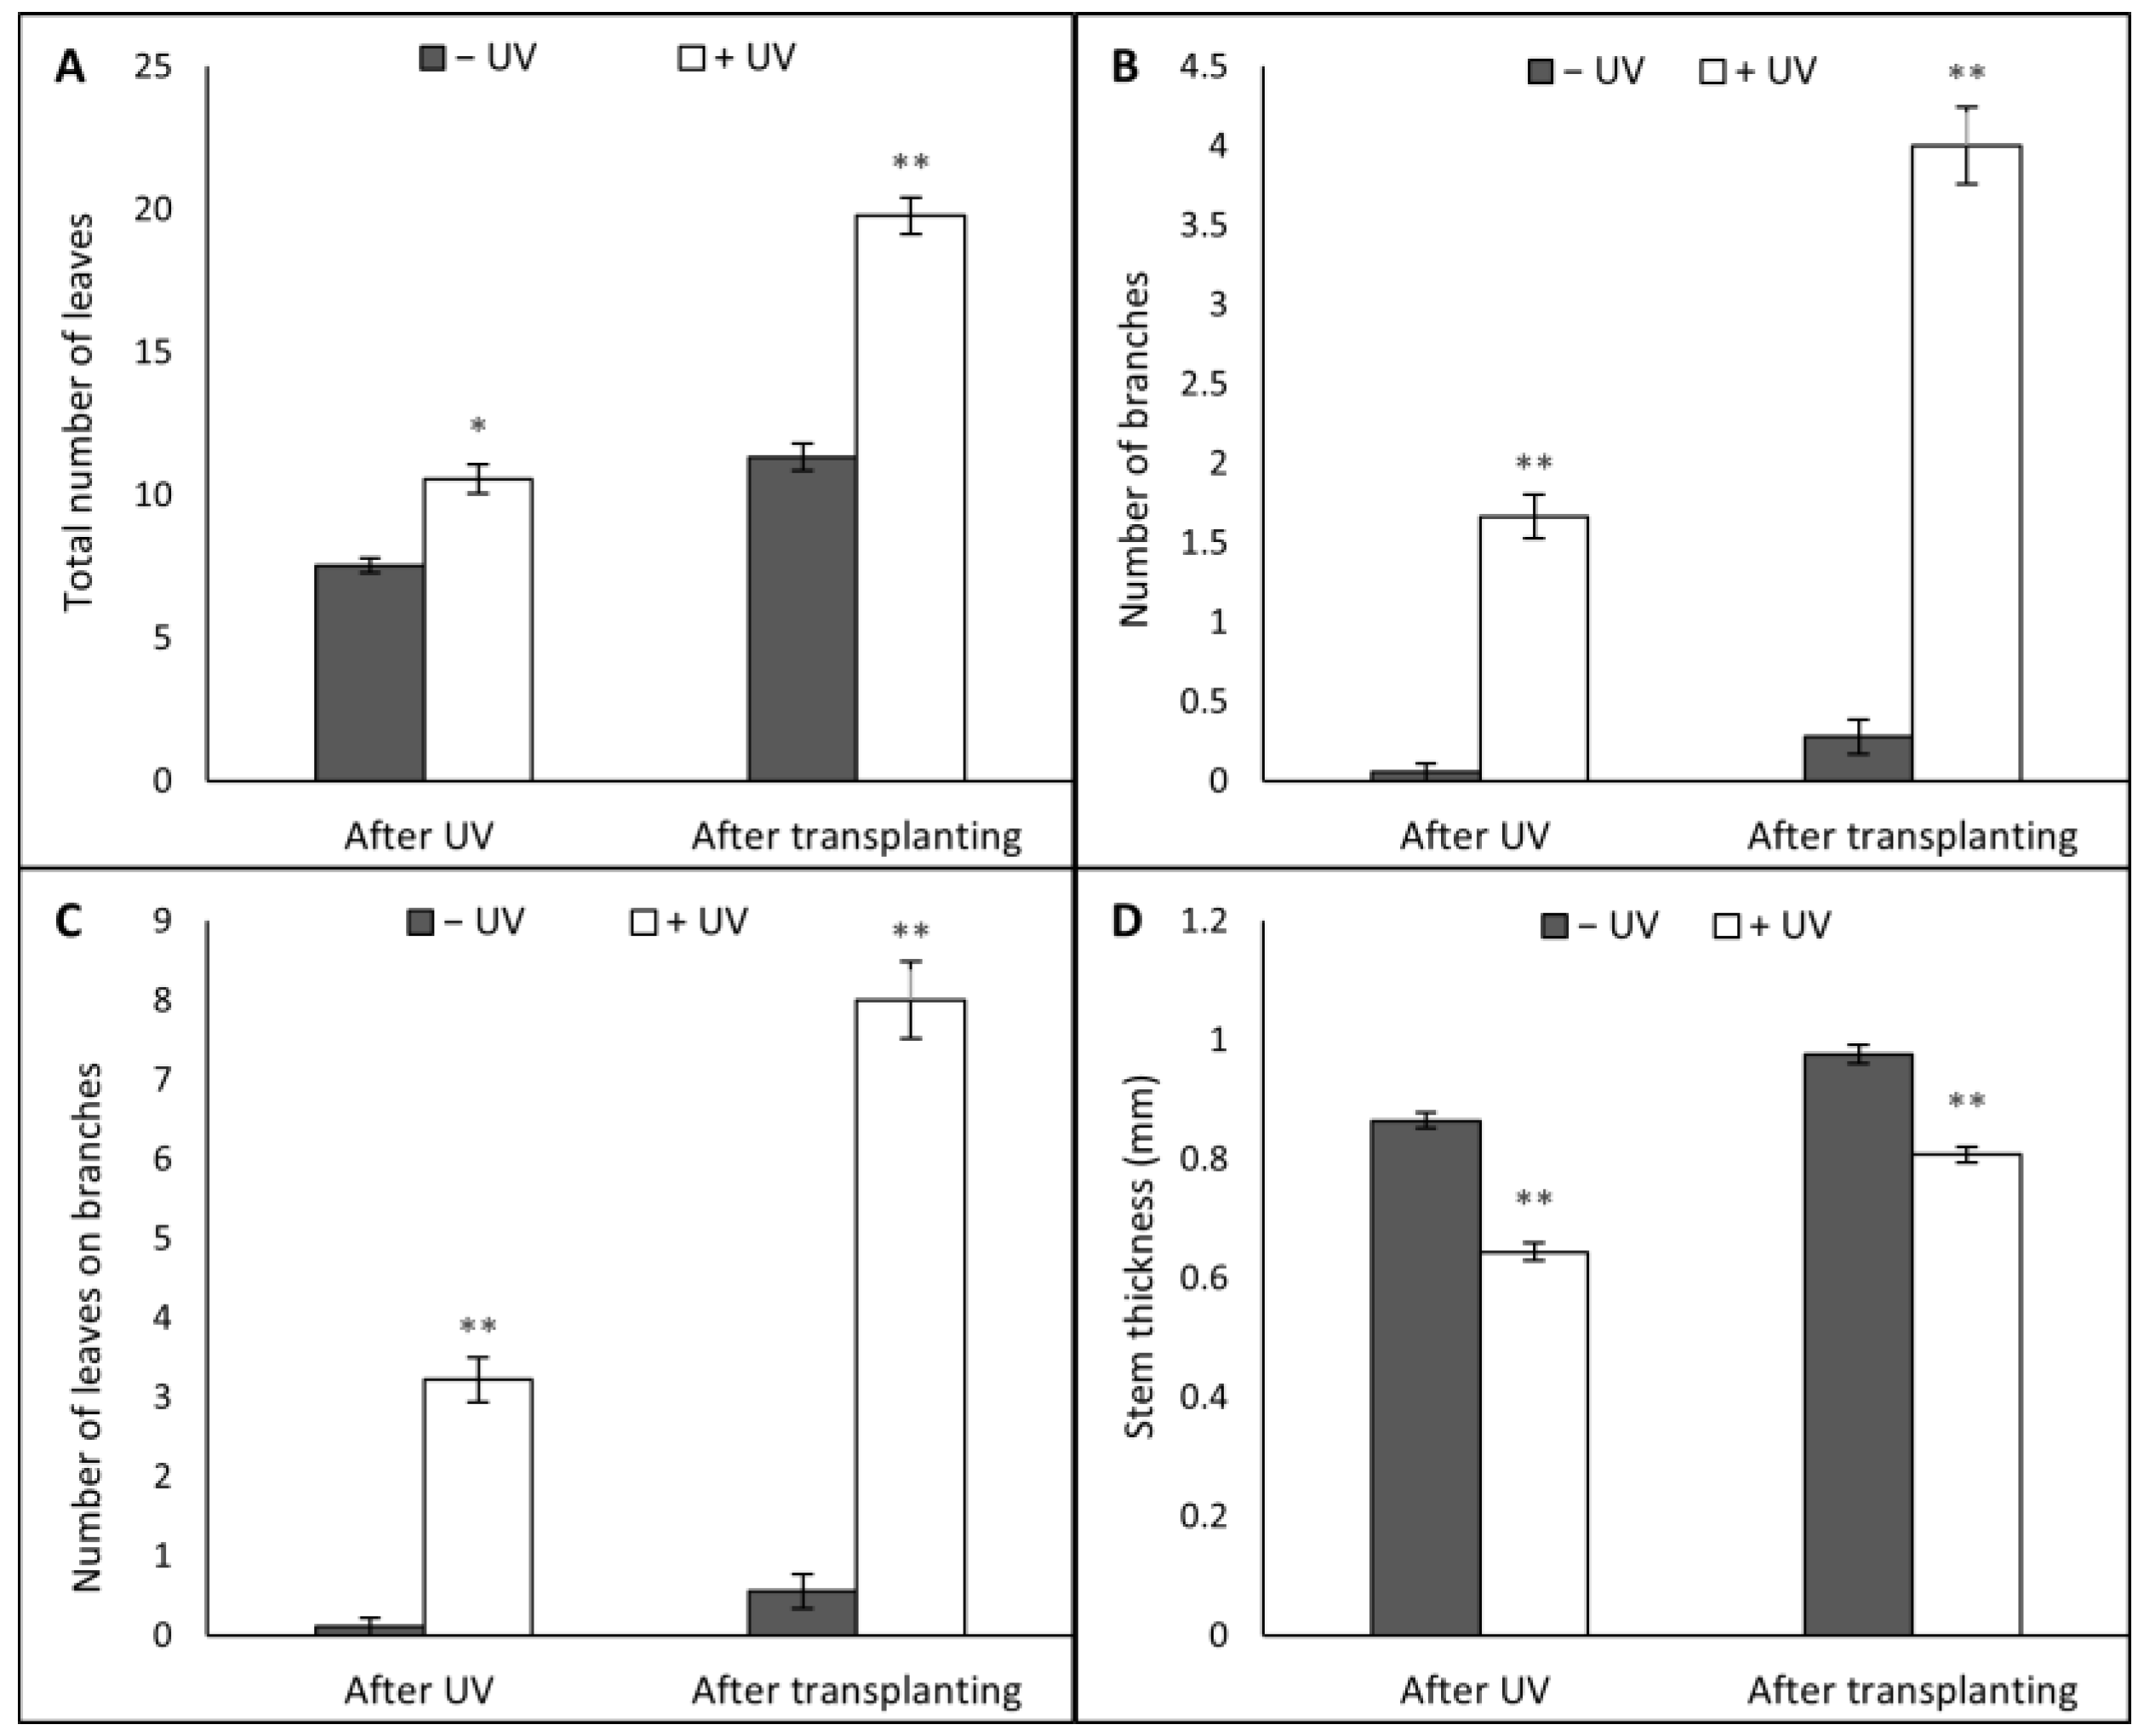
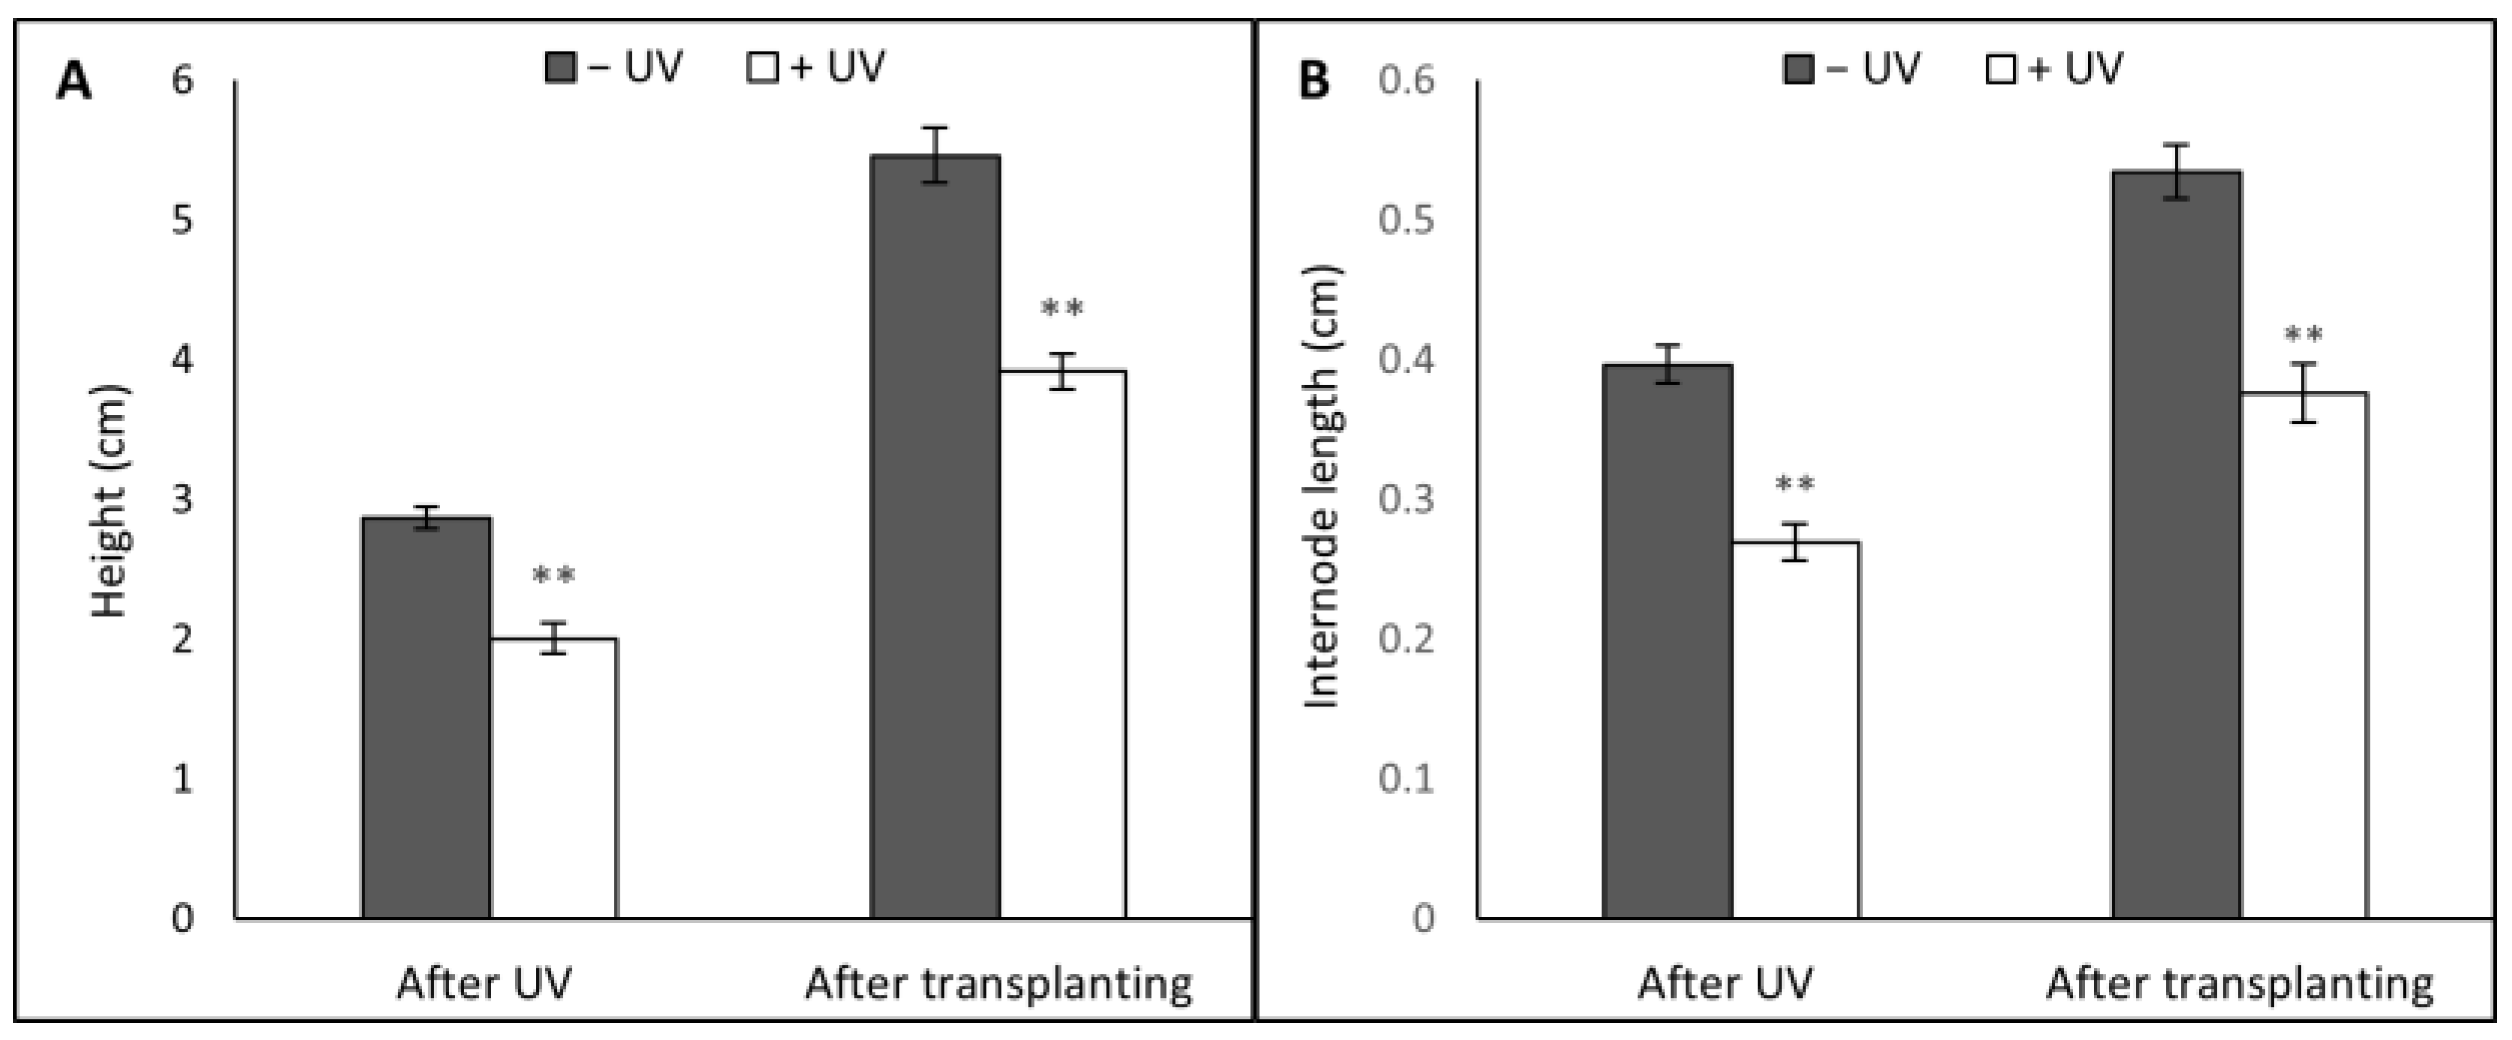
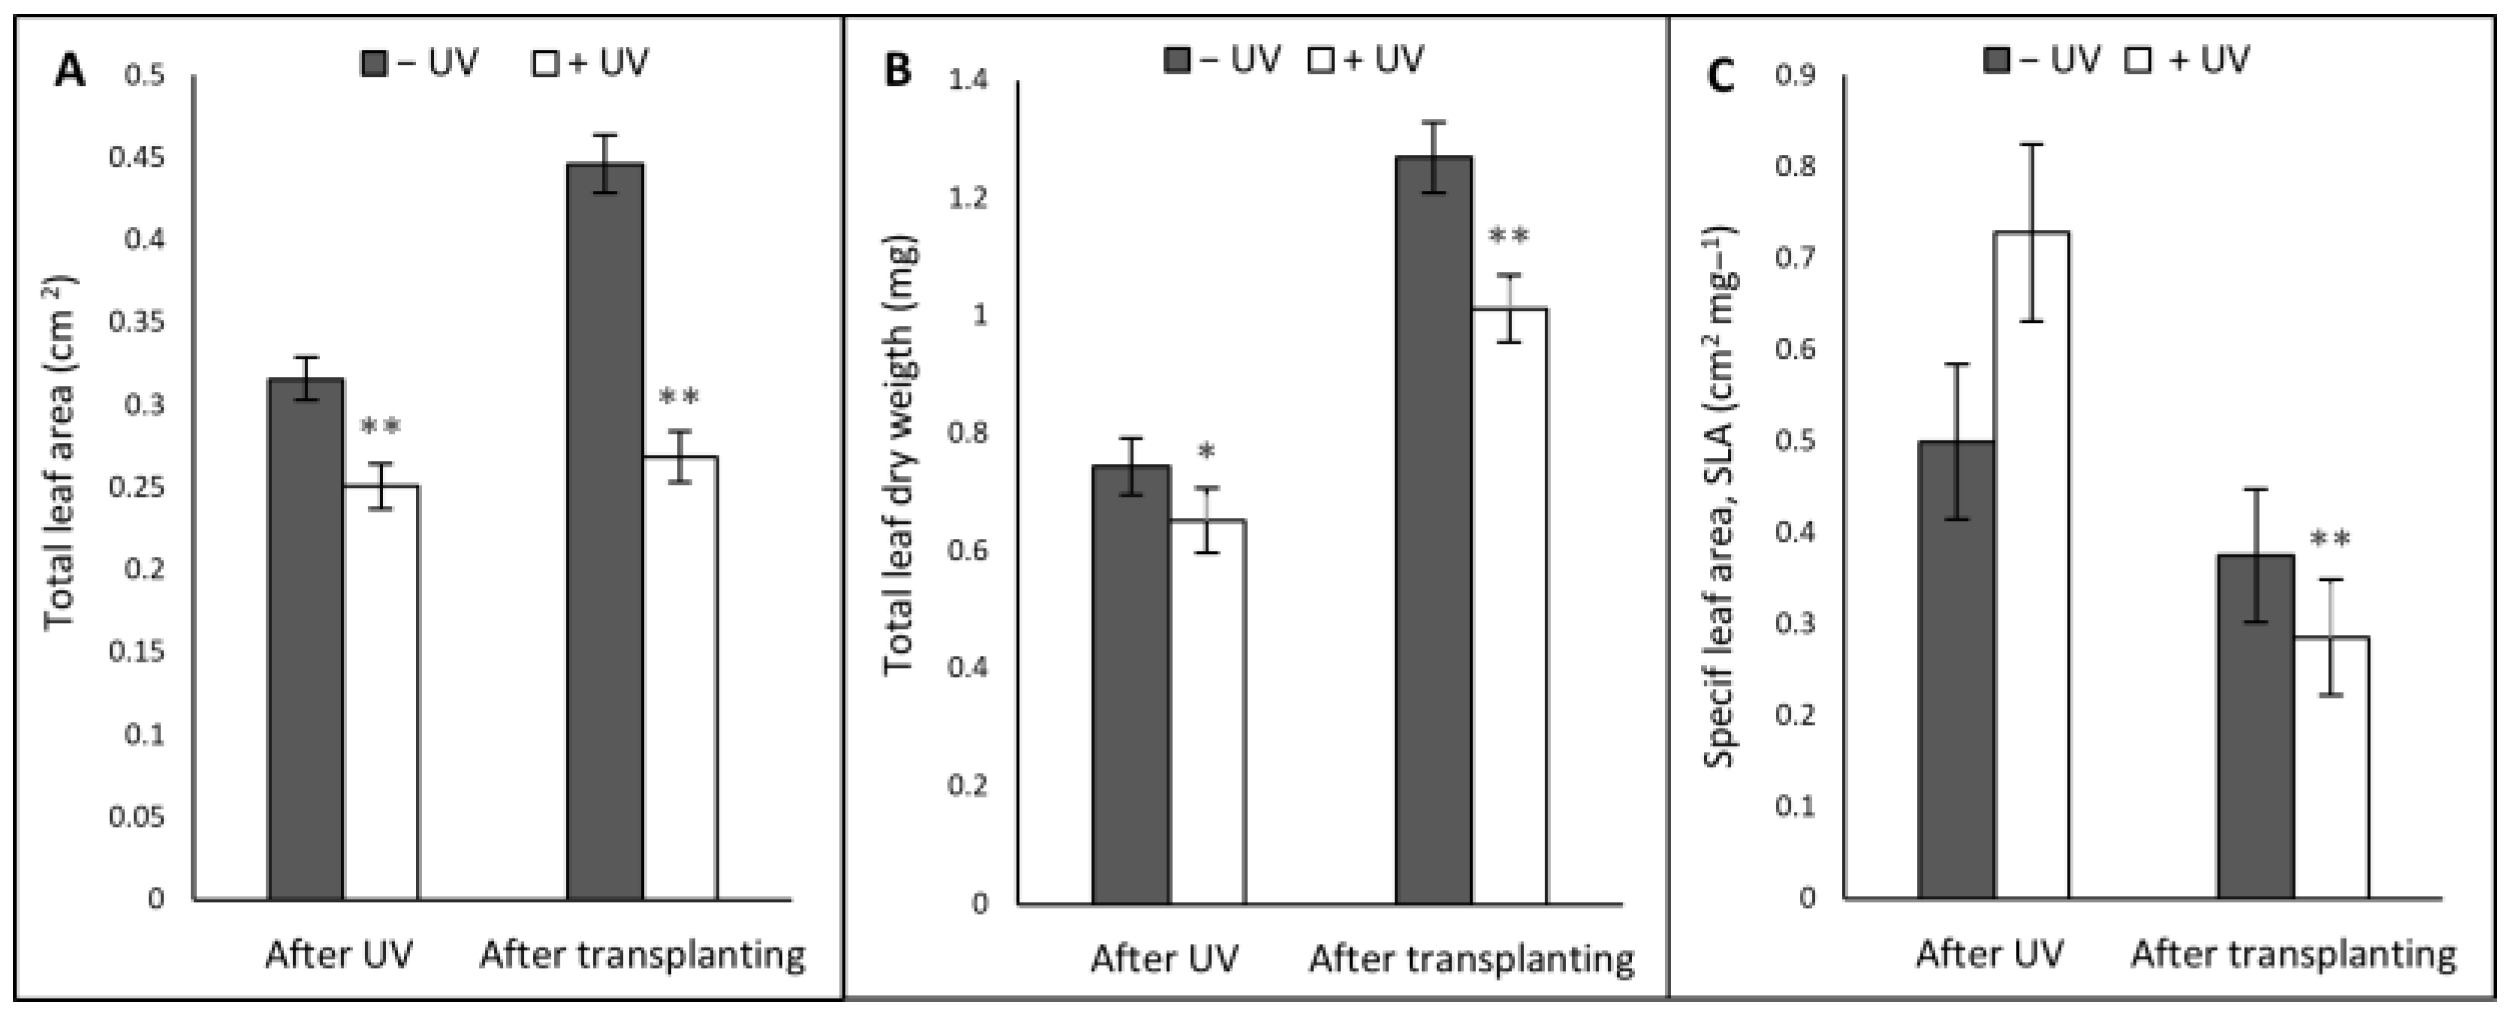
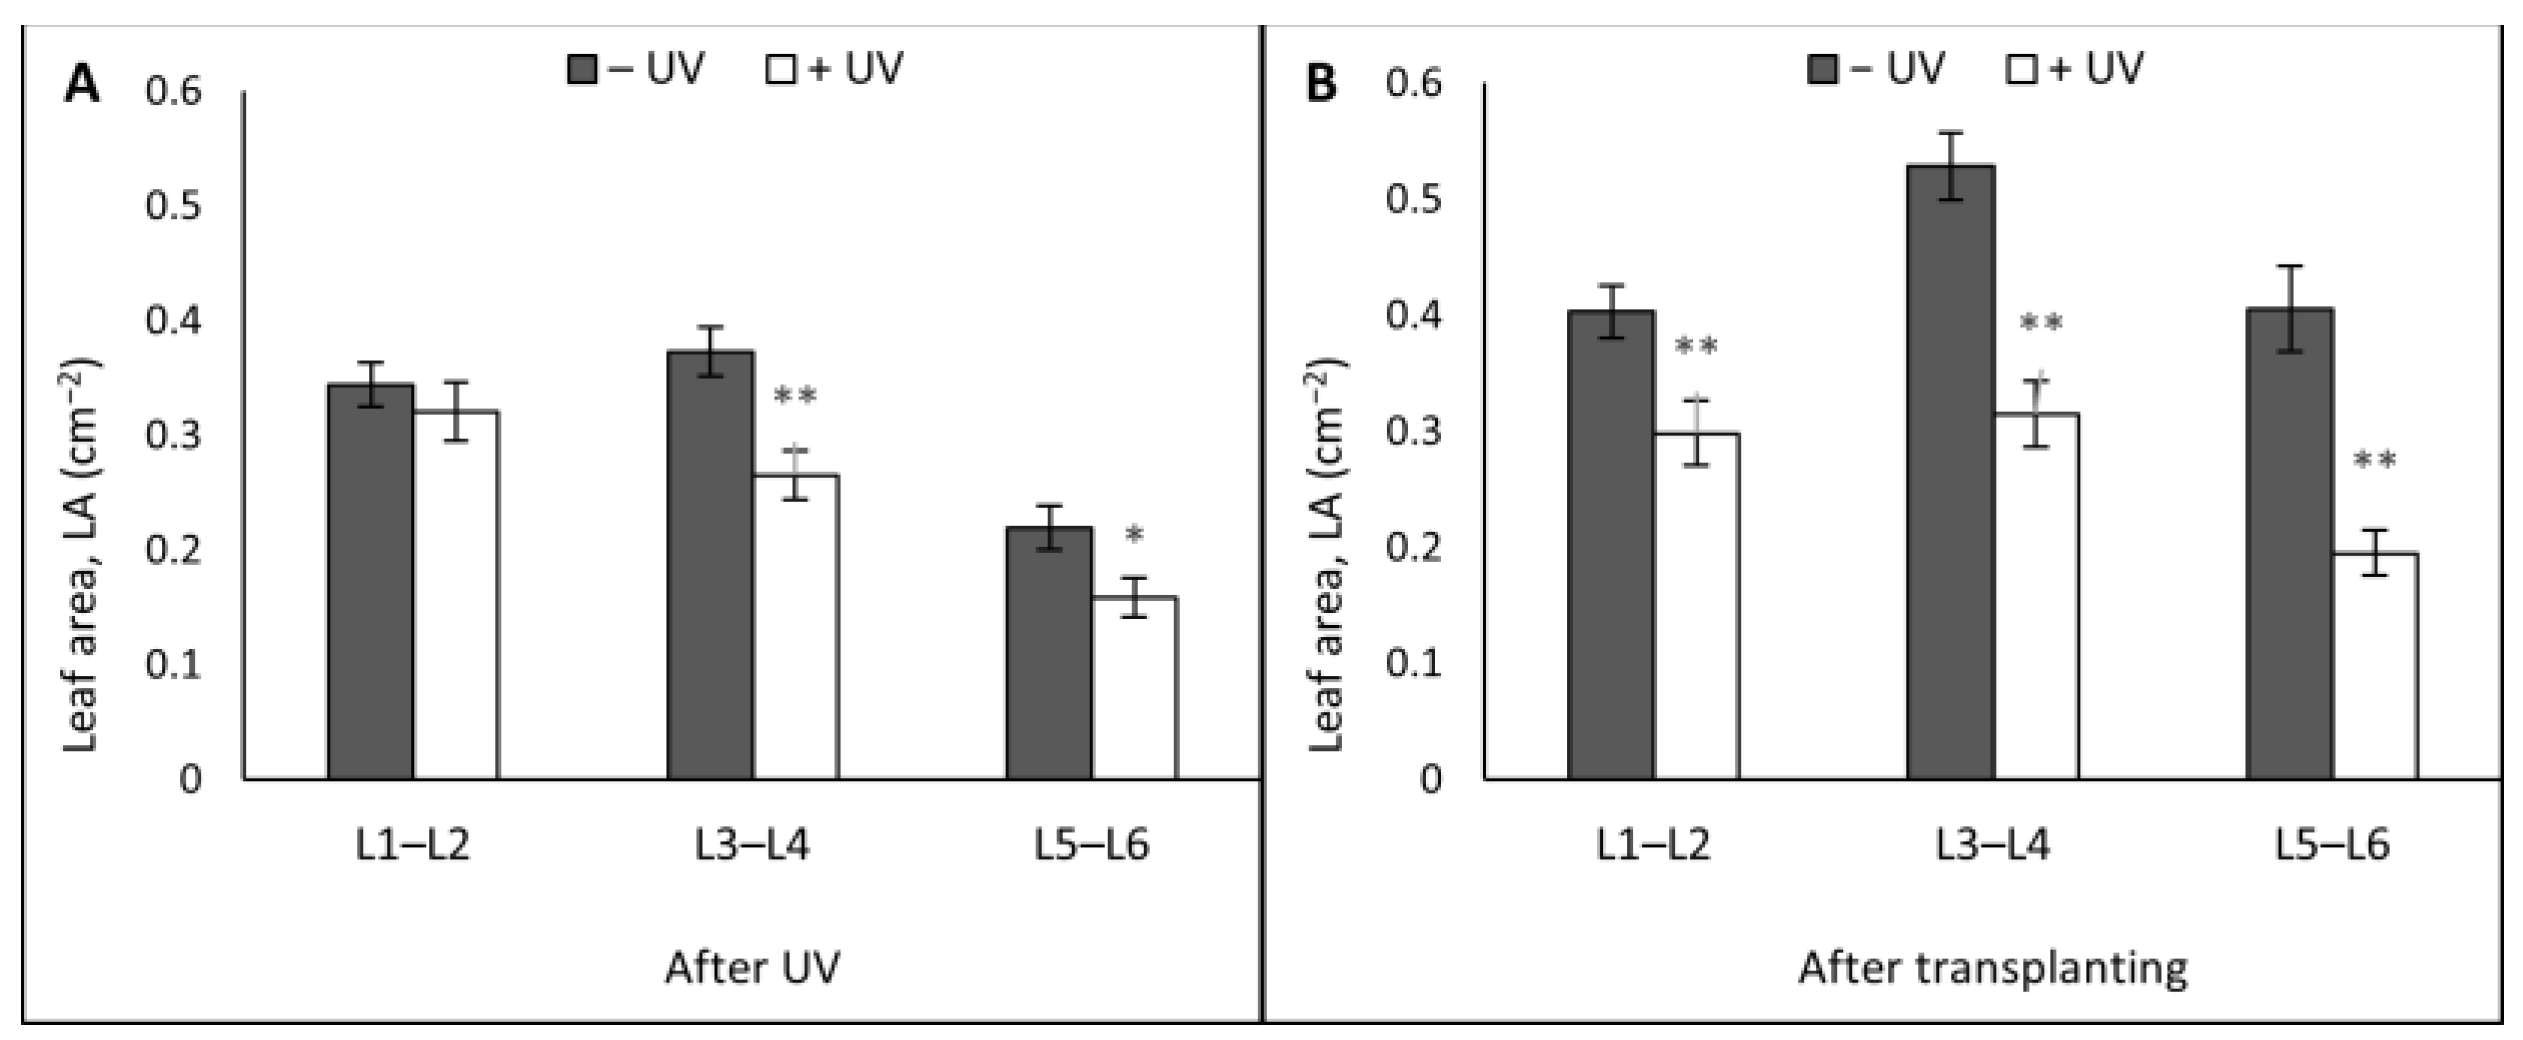
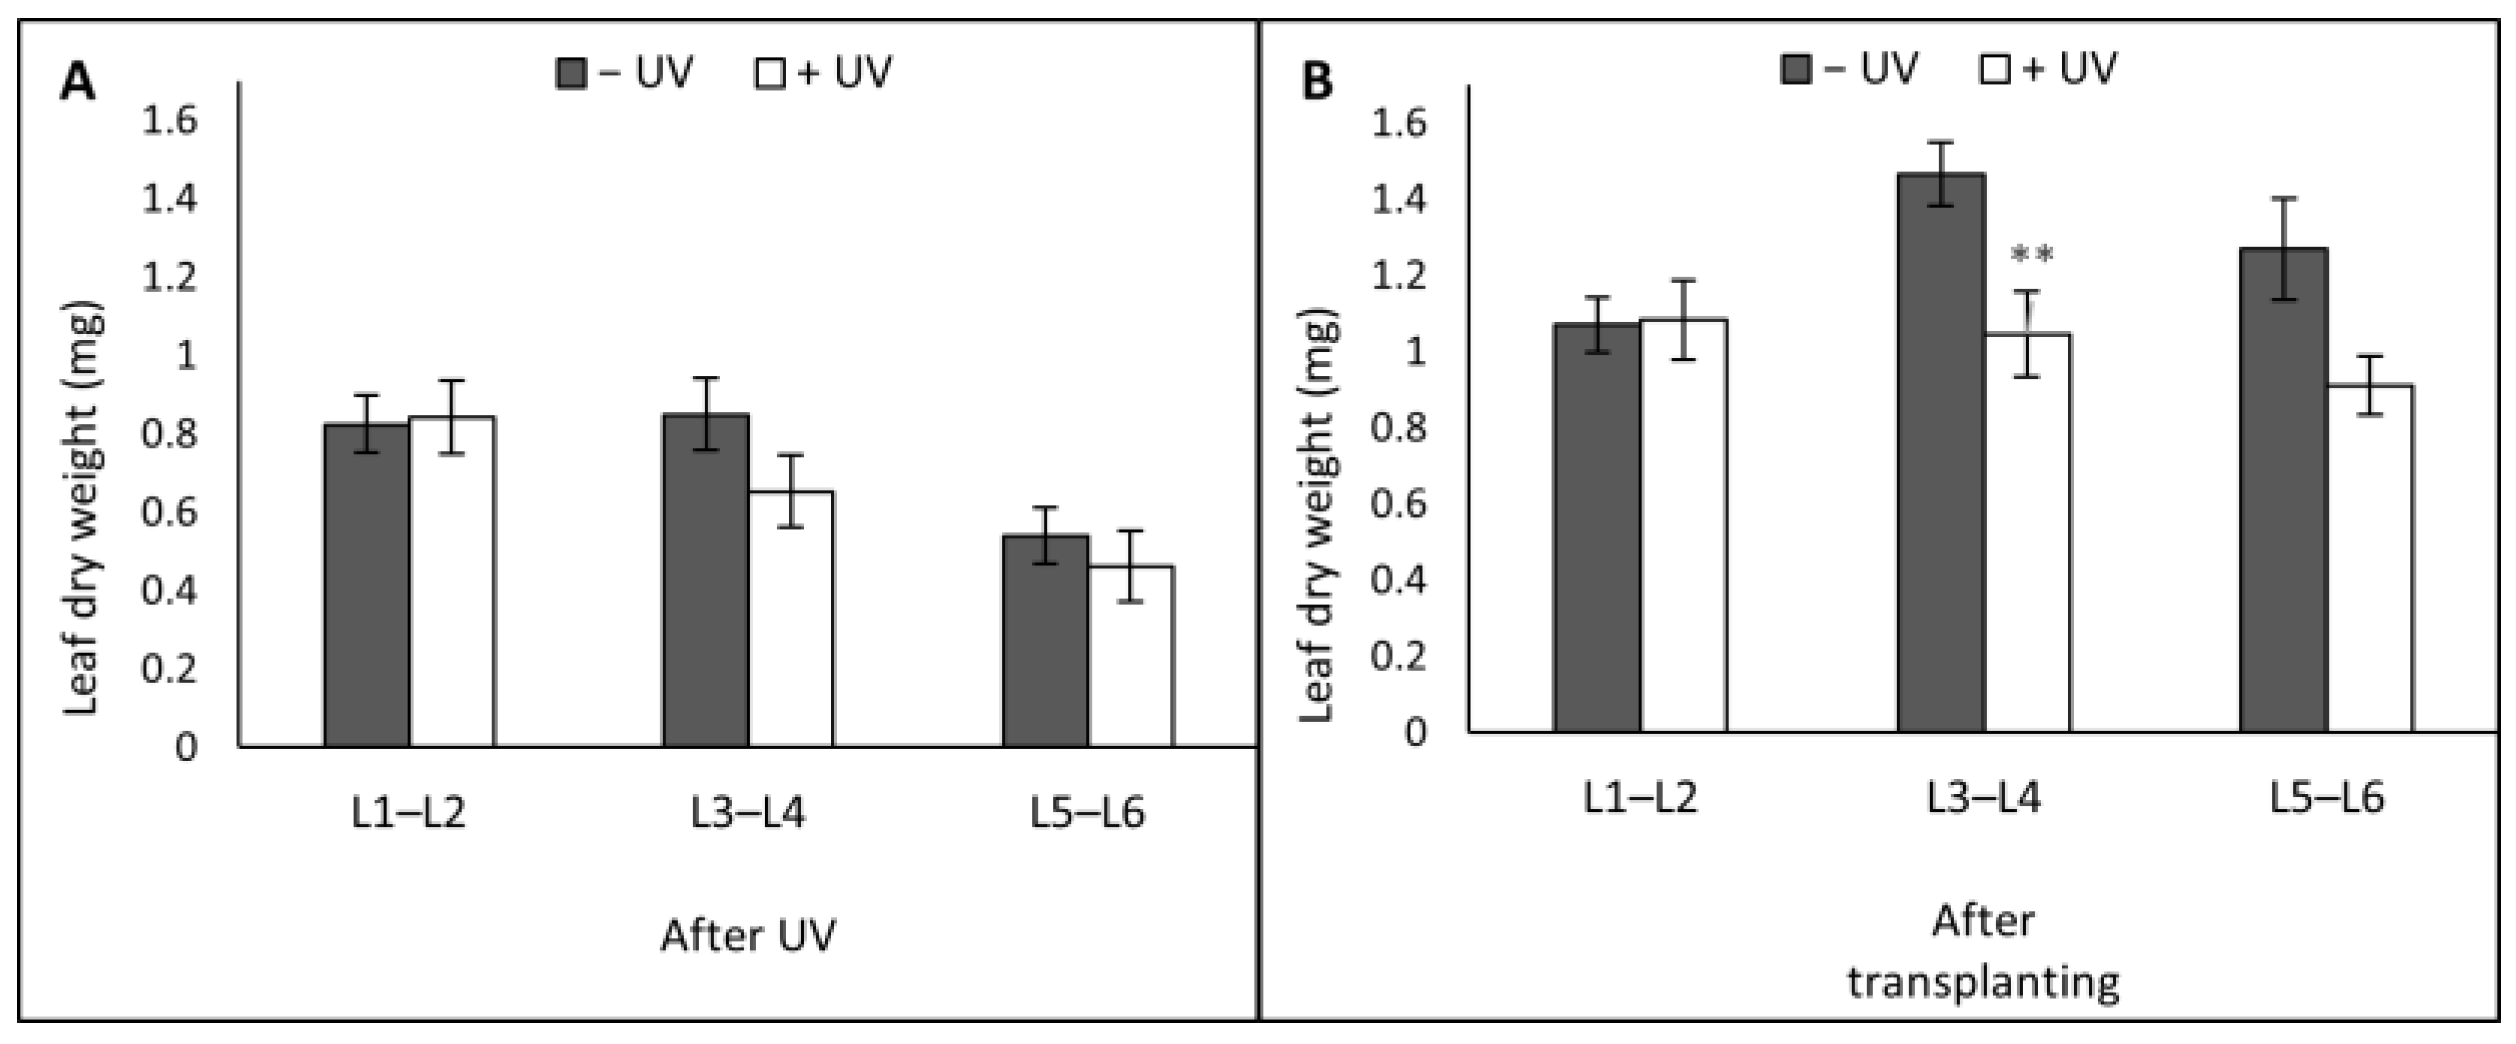
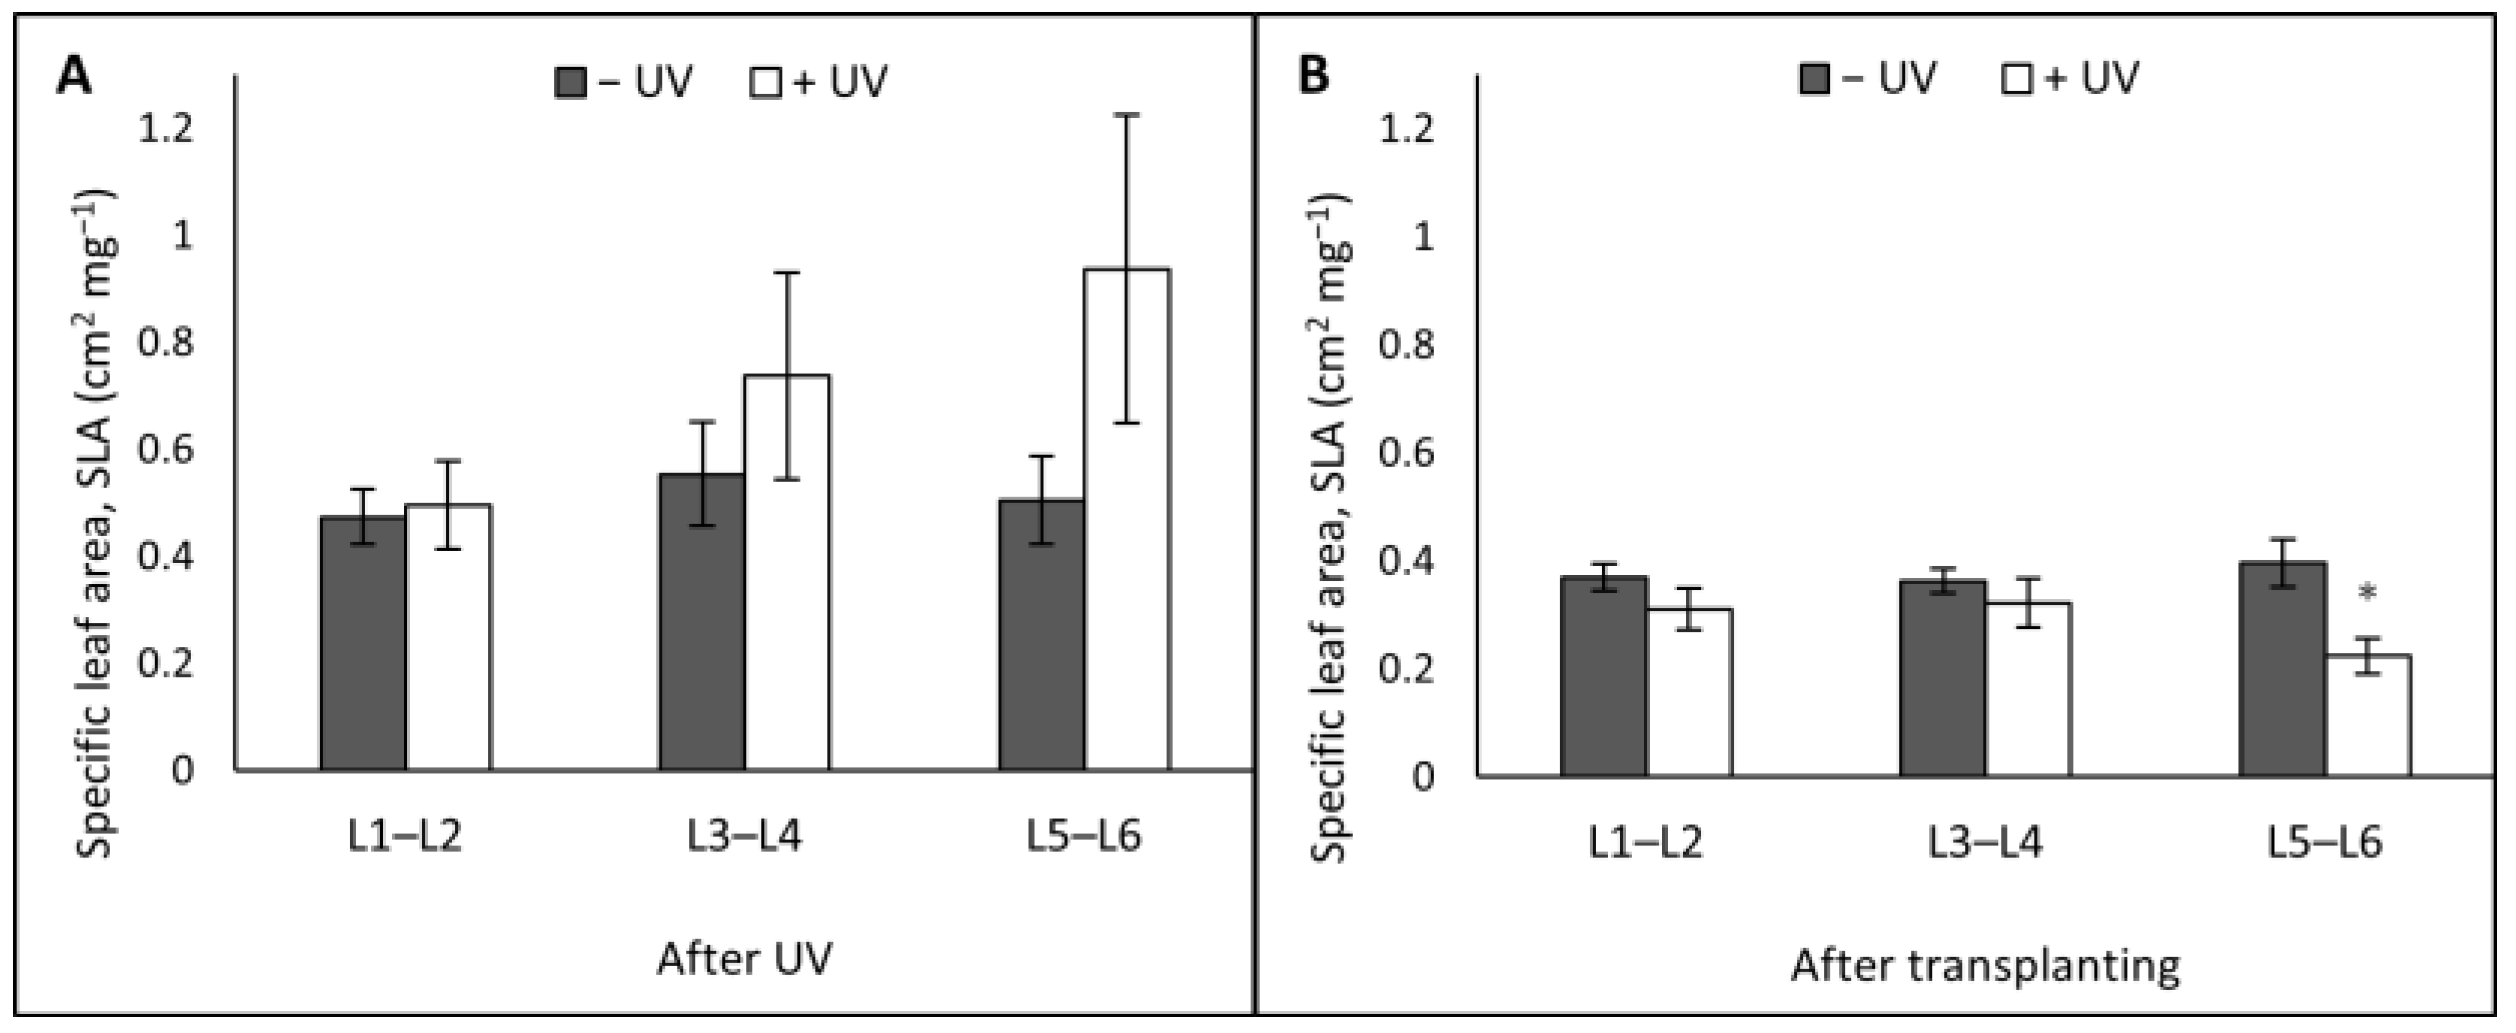
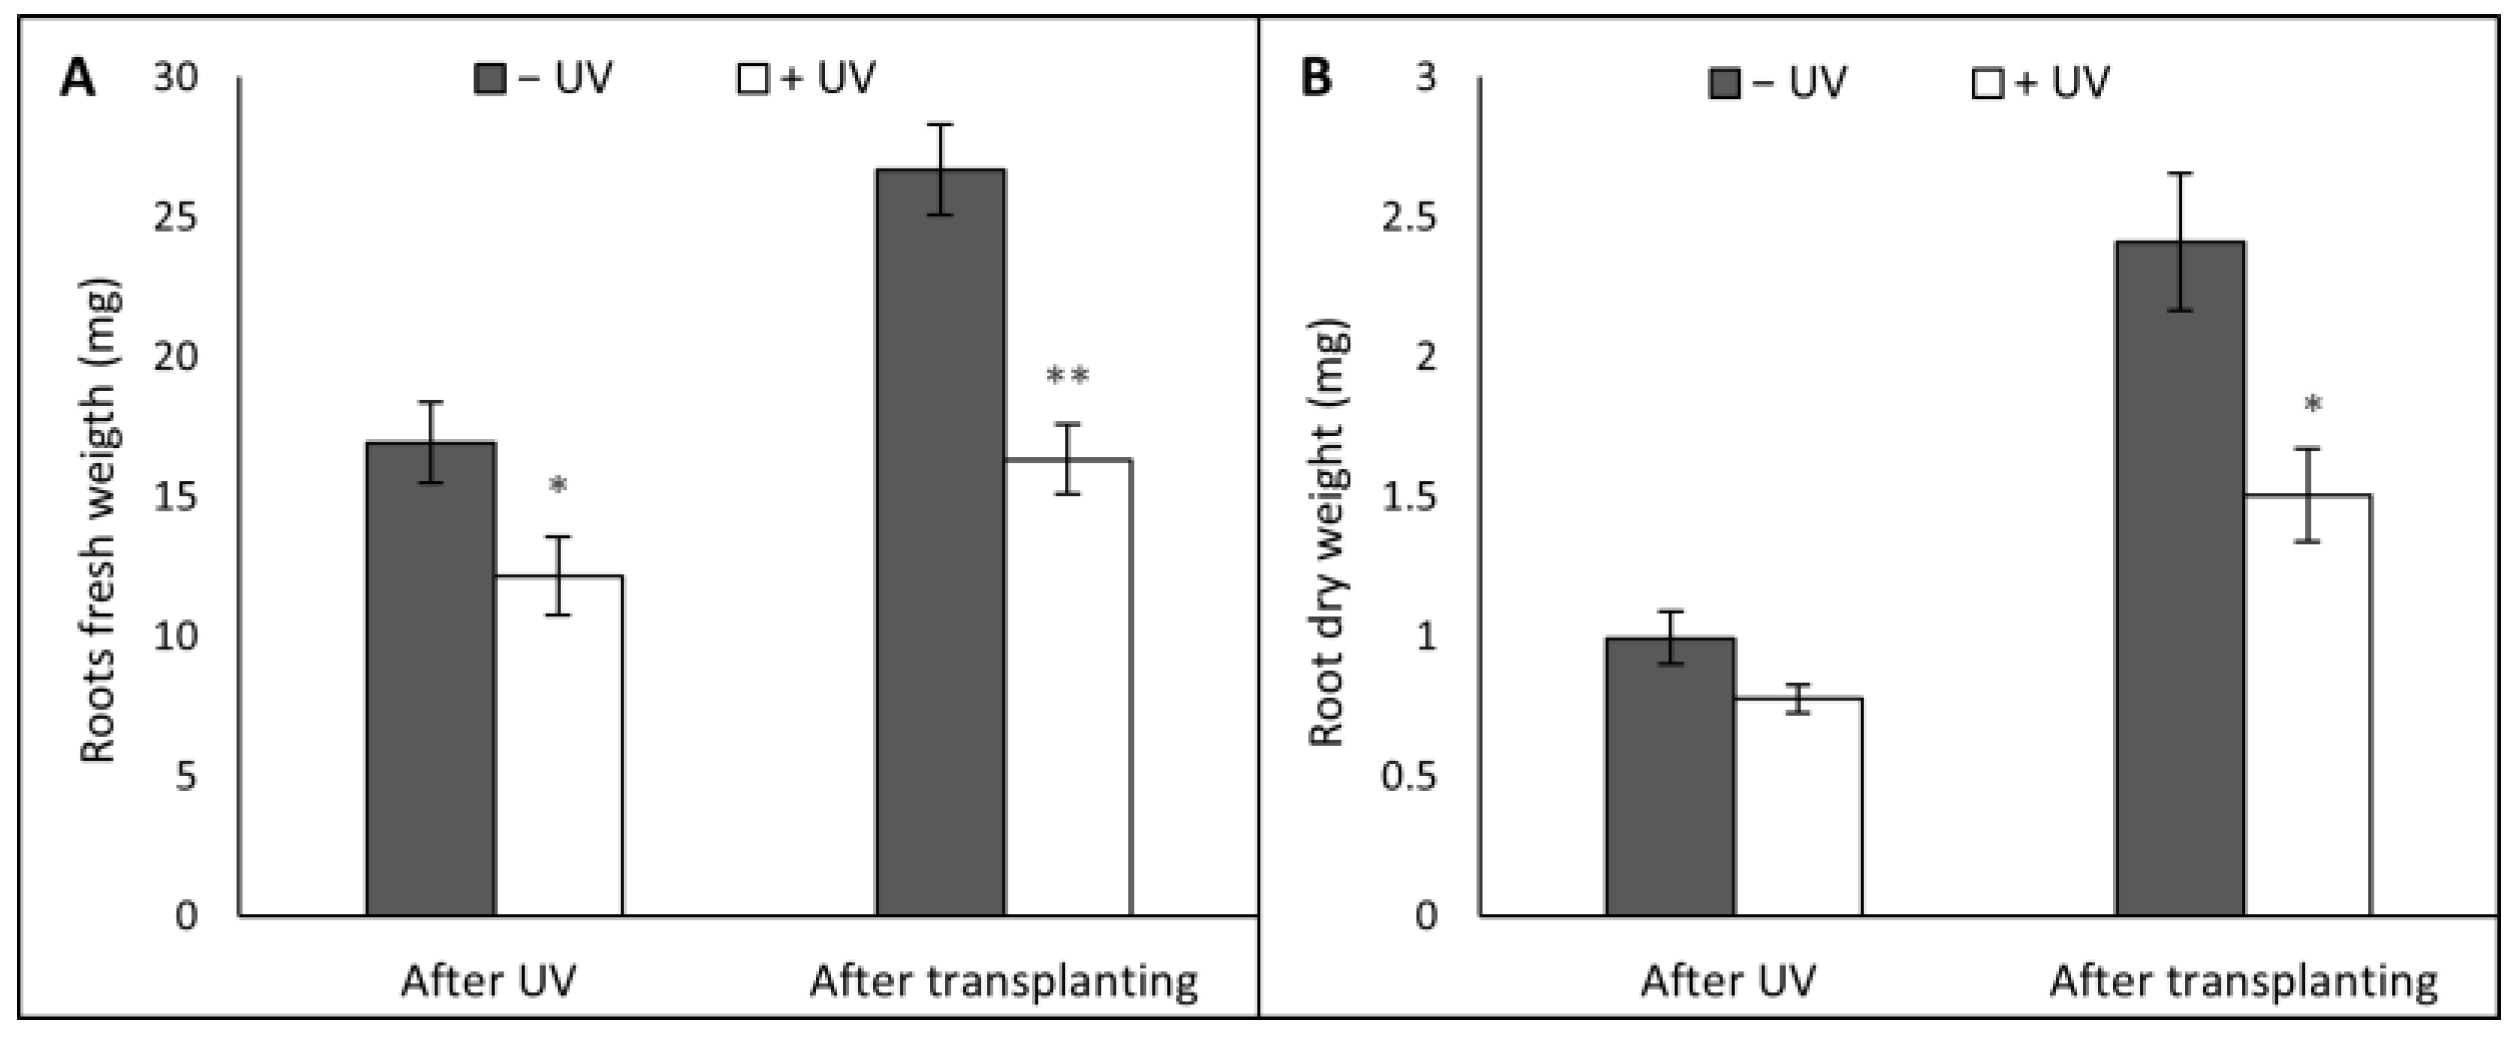
3.1. Plant Morphology
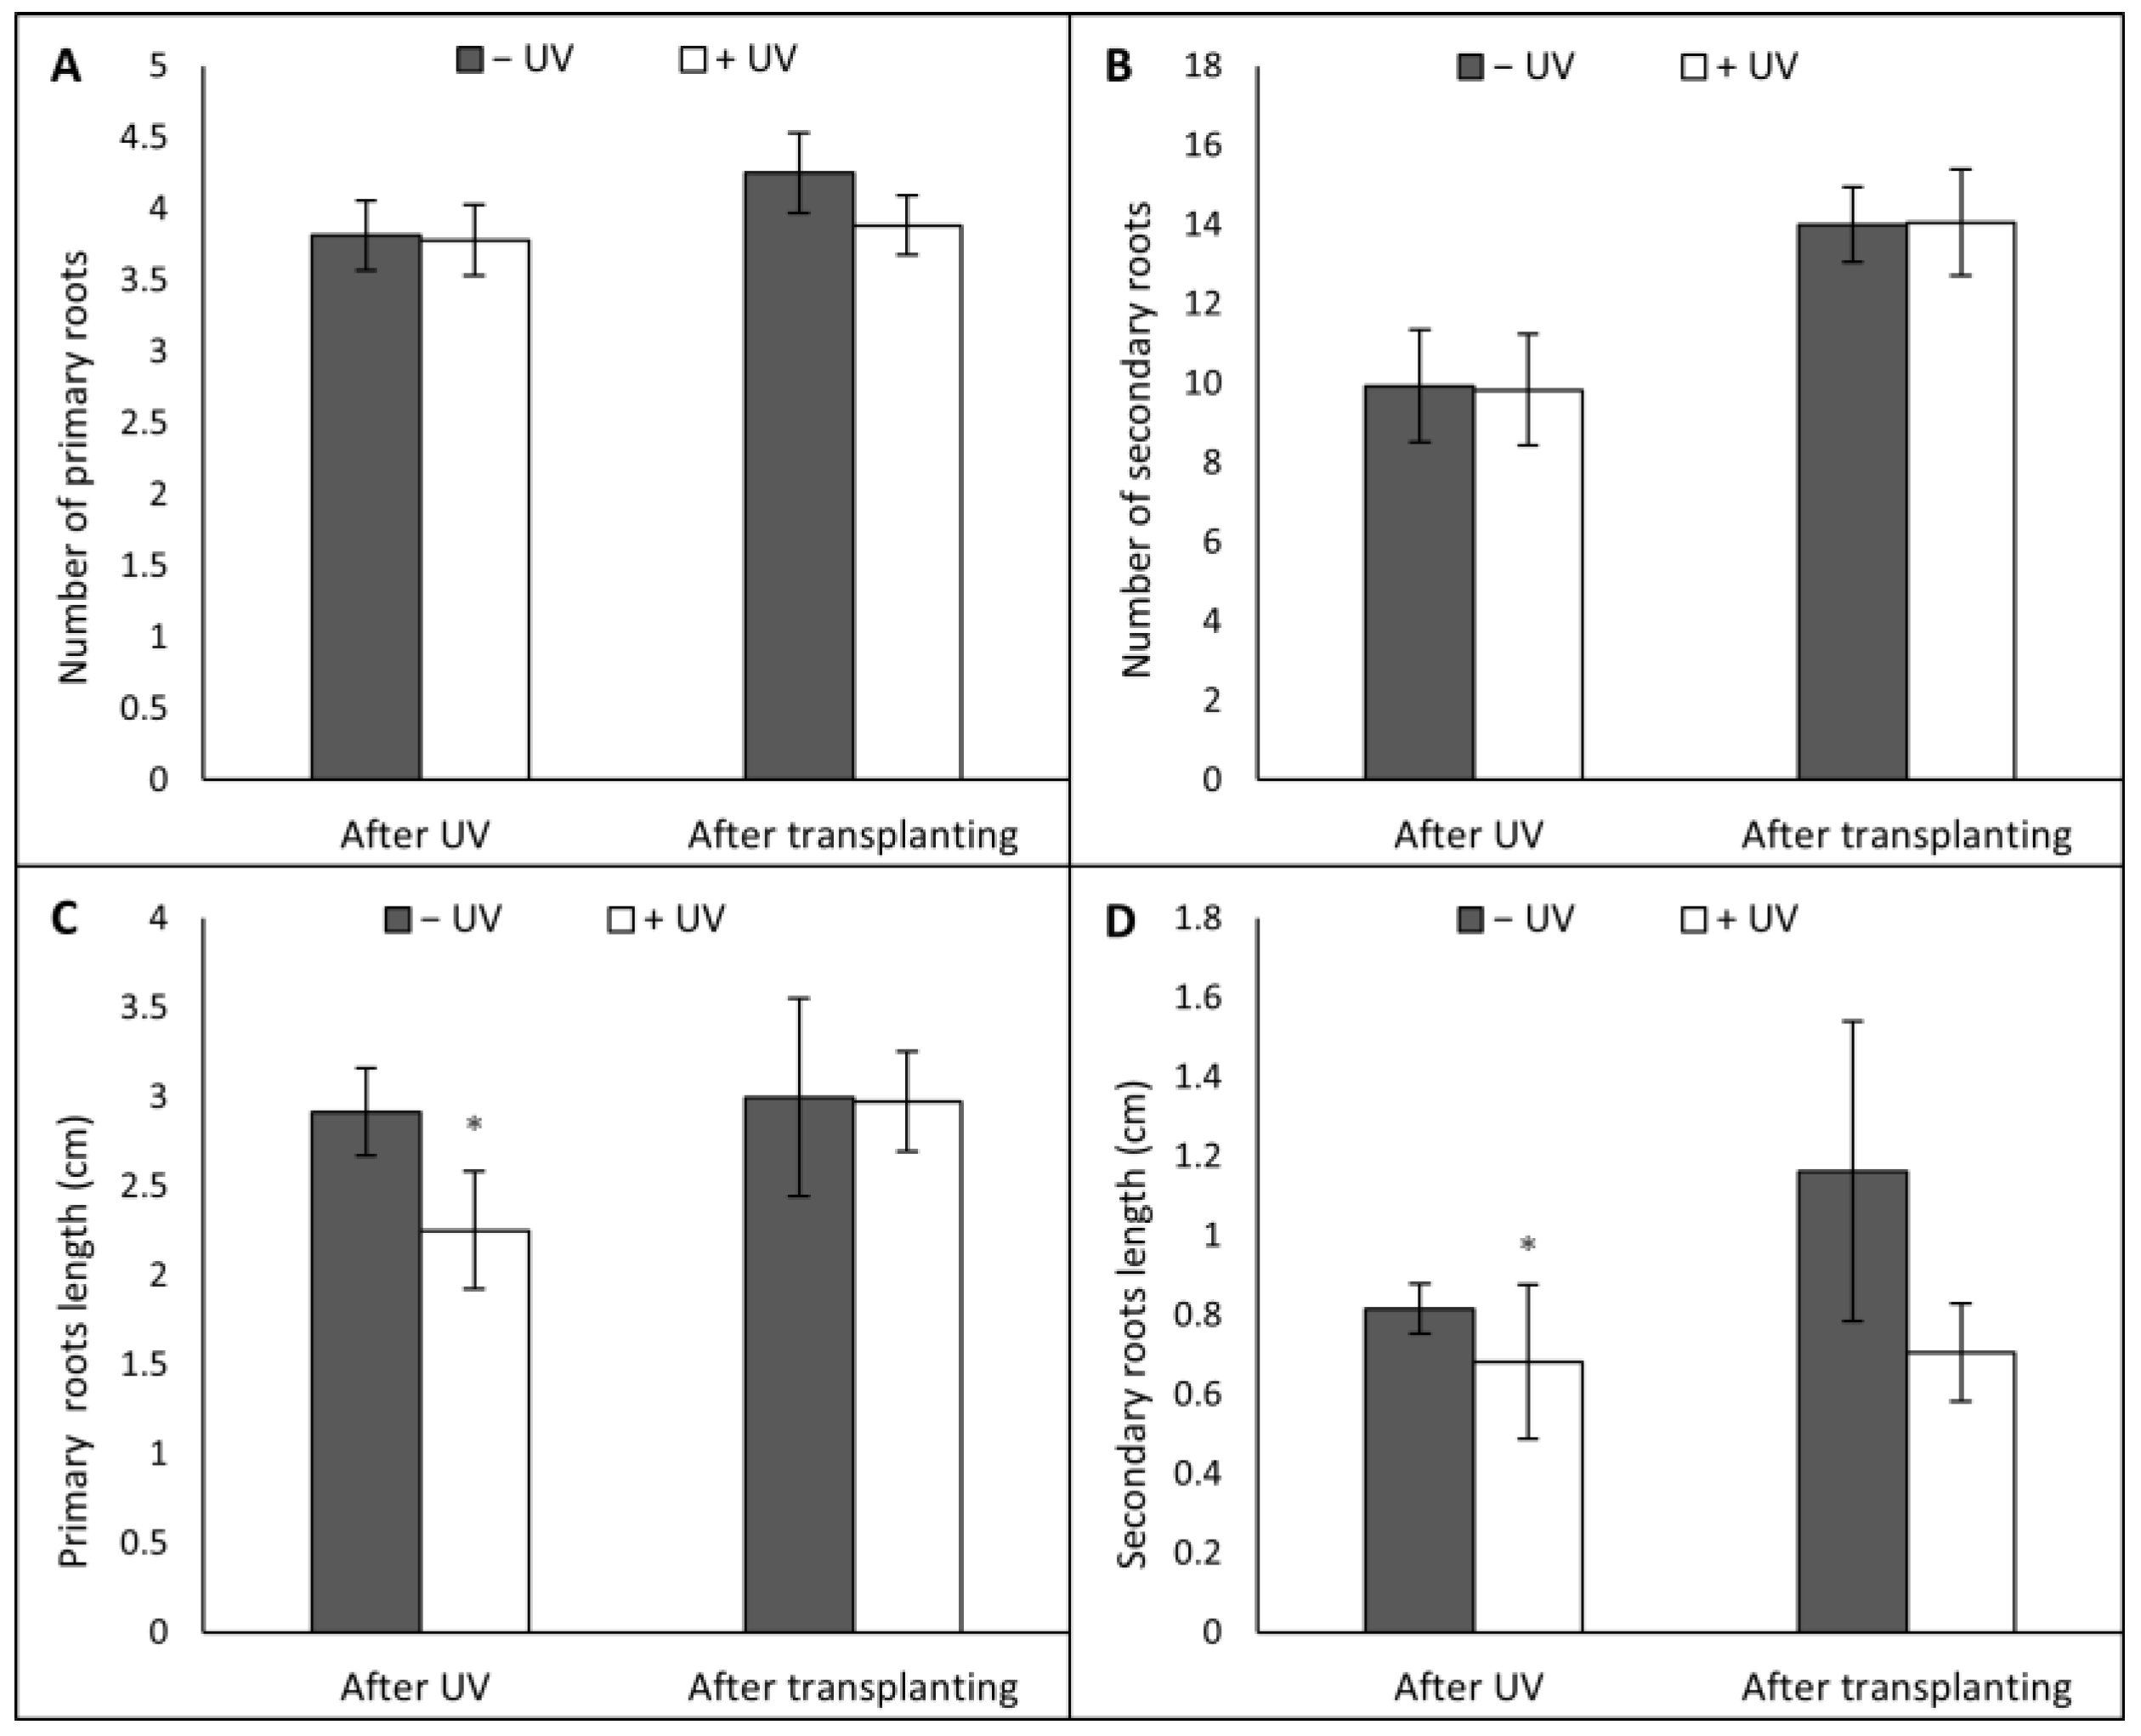
3.2. Root Morphology
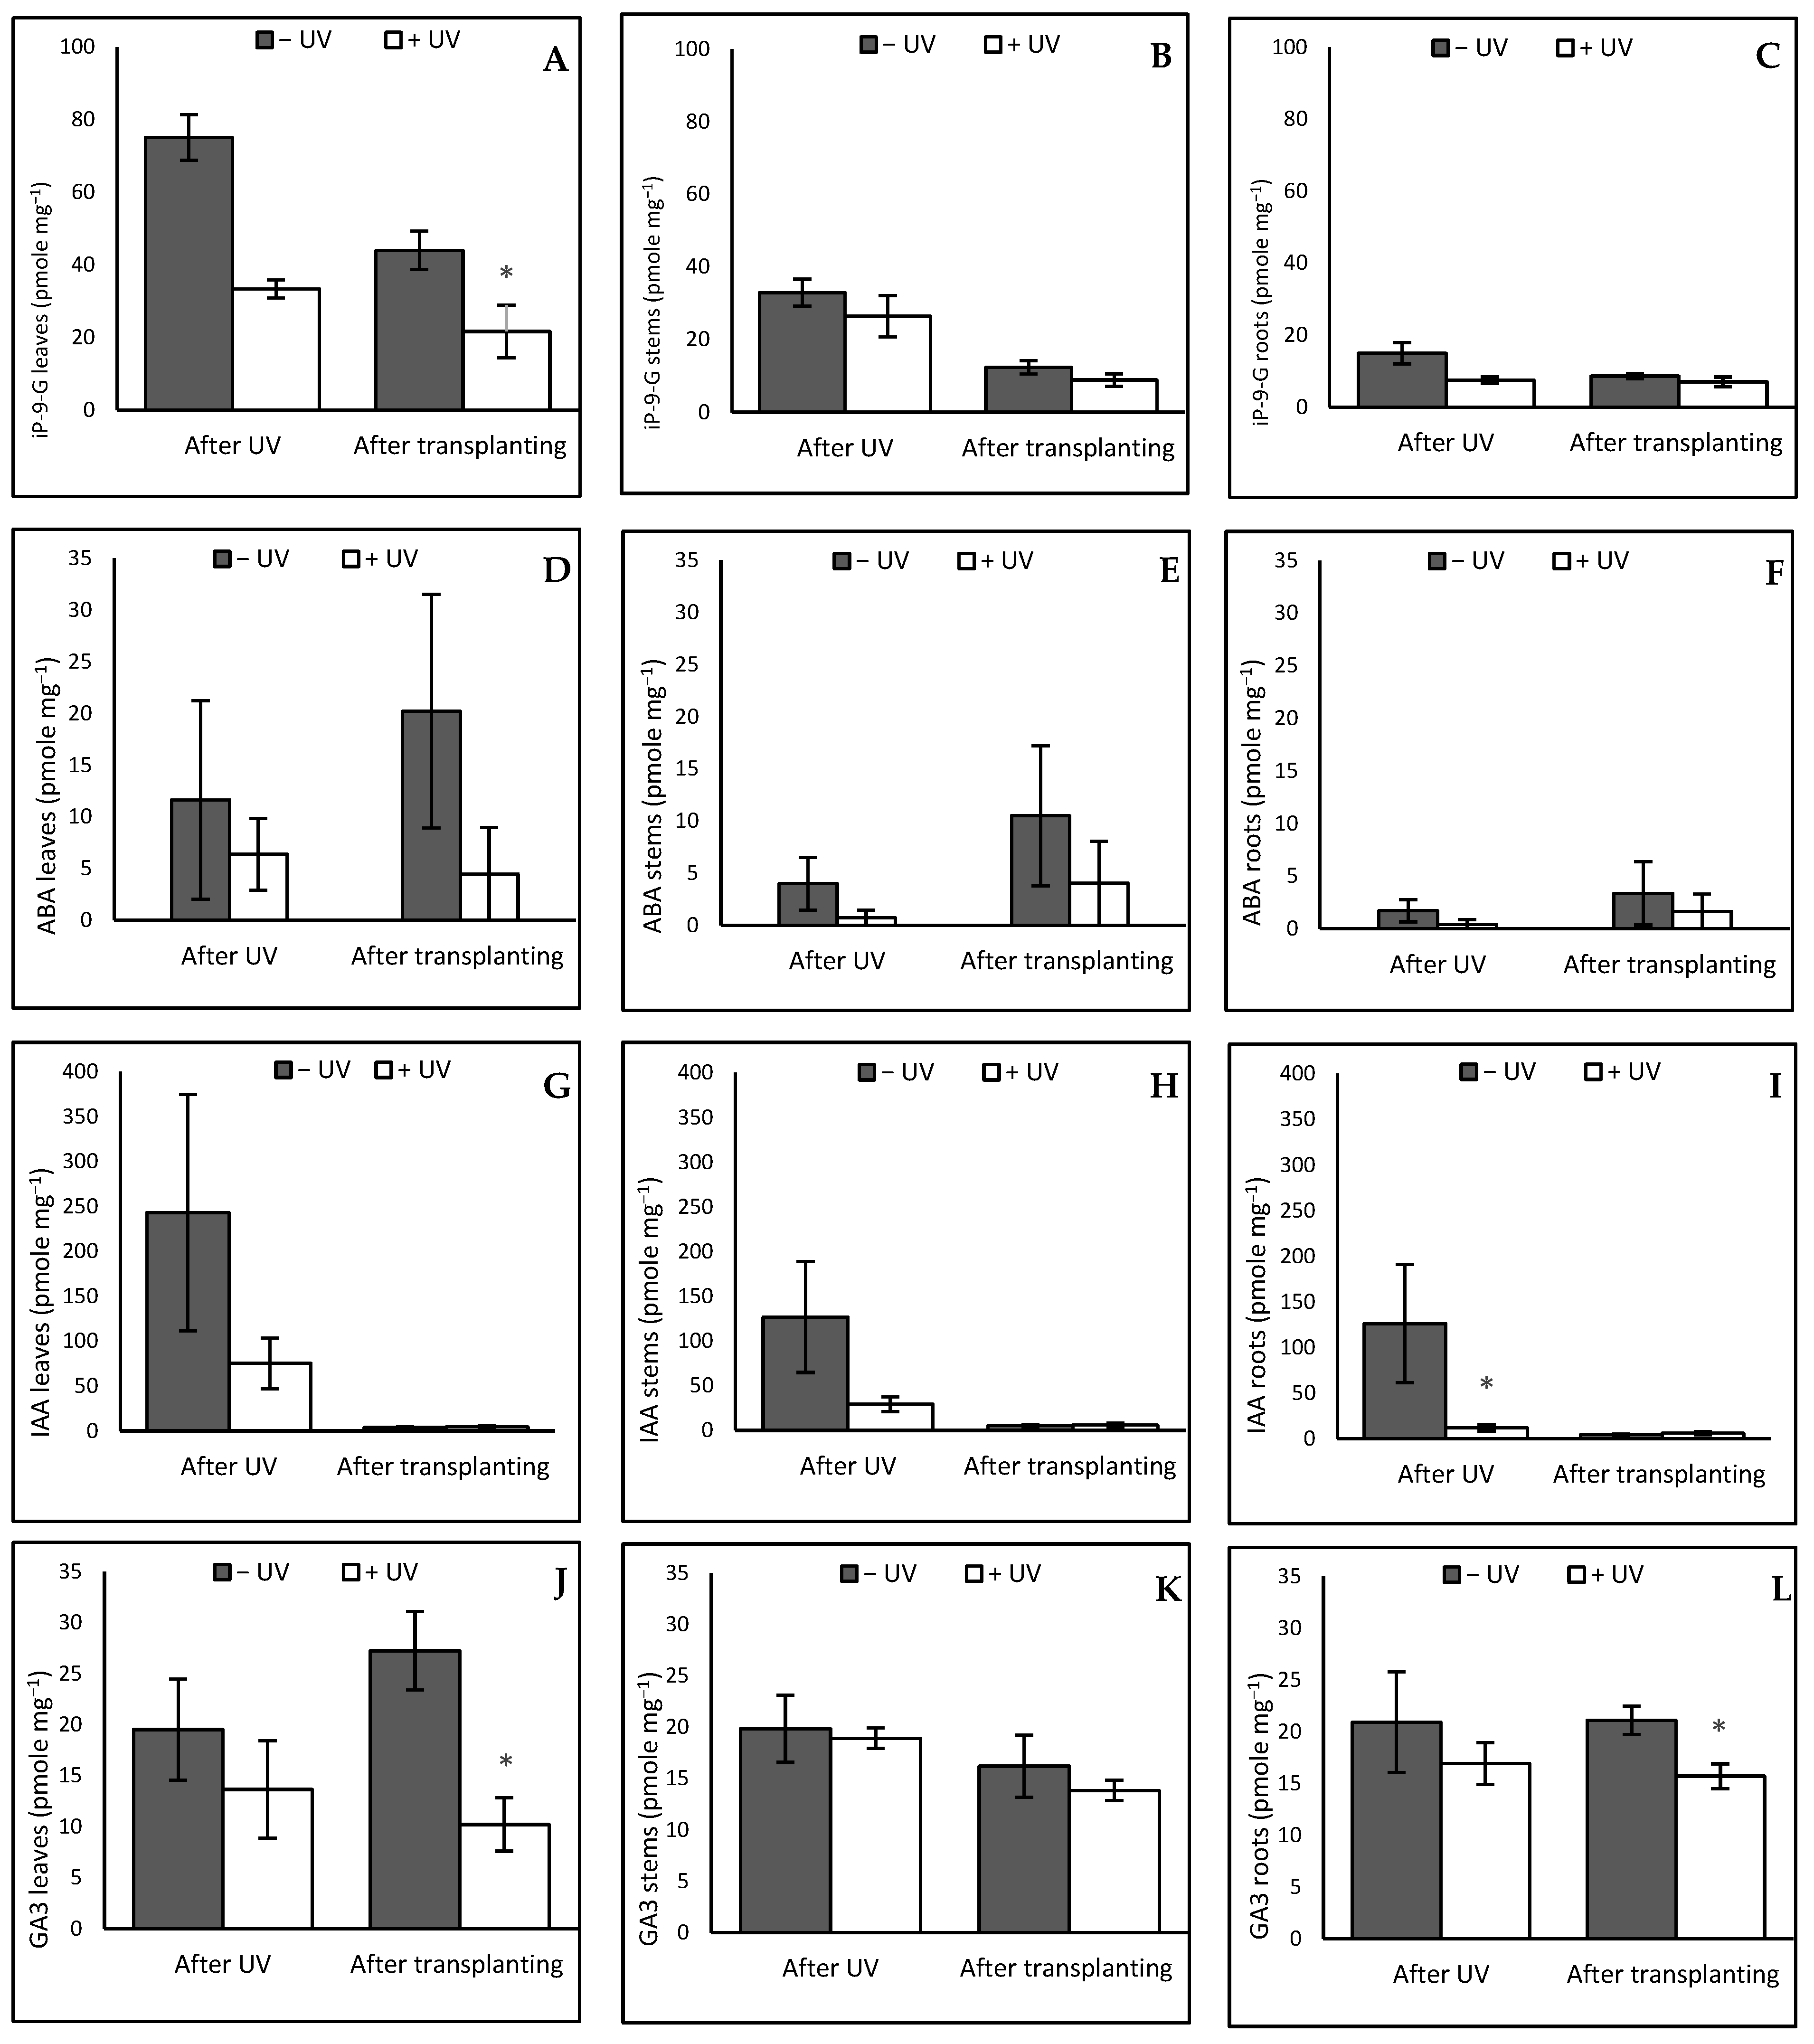
3.3. Hormone Profile
3.3.1. Leaves
3.3.2. Stems
3.3.3. Roots
4. Discussion
4.1. UV- Induced Changes in Morphology and Possible Applications for In Vitro Culturing
4.2. Link Hormone Changes to Morphological Changes
5. Conclusions
Supplementary Materials
Author Contributions
Funding
Data Availability Statement
Acknowledgments
Conflicts of Interest
References
- Thorpe, T.A. History of plant tissue culture. Mol. Biotechnol. 2007, 37, 169–180. [Google Scholar] [CrossRef] [PubMed]
- Da Silva, J.A.T.; Hossain, M.M.; Sharma, M.; Dobránszki, J.; Cardoso, J.C.; Zeng, S. Acclimatization of in Vitro-derived Dendrobium. Hortic. Plant J. 2017, 3, 110–124. [Google Scholar] [CrossRef]
- Pence, V.C. The possibilities and challenges of in vitro methods for plant conservation. Kew Bull. 2010, 65, 539–547. [Google Scholar] [CrossRef]
- Hazarika, B.N. Morpho-physiological disorders in in vitro culture of plants. Sci. Hortic. 2006, 108, 105–120. [Google Scholar] [CrossRef]
- Rodrigues, S.P.; de Oliveira, D.C. The effects of in vitro culture on the leaf anatomy of Jatropha curcas L. (Euphorbiaceae). Biosci. J. 2014, 30, 9. [Google Scholar]
- Chandra, S.; Bandopadhyay, R.; Kumar, V.; Chandra, R. Acclimatization of tissue cultured plantlets: From laboratory to land. Biotechnol. Lett. 2010, 32, 1199–1205. [Google Scholar] [CrossRef] [PubMed]
- Daffalla, H.H.; Abdellatef, E.; Elhadi, E.A.; Khalafalla, M.M. Effect of Growth Regulators on In Vitro Morphogenic Response of Boscia senegalensis (Pers.) Lam. Poir. Using Mature Zygotic Embryos Explants. Biotechnol. Res. Int. 2011, 2011, 1–8. [Google Scholar] [CrossRef] [Green Version]
- Jiménez, V.M. Involvement of Plant Hormones and Plant Growth Regulators on in vitro Somatic Embryogenesis. Plant Growth Regul. 2005, 47, 91–110. [Google Scholar] [CrossRef]
- Phillips, G.C.; Garda, M. Plant tissue culture media and practices: An overview. In Vitro Cell. Dev. Biol.-Plant 2019, 55, 242–257. [Google Scholar] [CrossRef]
- George, E.F.; Hall, M.A.; Klerk, G.-J.D. (Eds.) The Anatomy and Morphology of Tissue Cultured Plants. In Plant Propagation by Tissue Culture; Springer: Dordrecht, The Netherlands, 2007; pp. 465–477. [Google Scholar] [CrossRef]
- Clelland, M.T.M.; Smith, M.A.L.; Carothers, Z.B. The effects of in vitro and ex vitro root initiation on subsequent microcutting root quality in three woody plants. Plant Cell Tissue Organ Cult. 1990, 23, 115–123. [Google Scholar] [CrossRef]
- Batista, D.S.; Felipe, S.H.S.; Silva, T.D.; de Castro, K.M.; Mamedes-Rodrigues, T.C.; Miranda, N.A.; Ríos-Ríos, A.M.; Faria, D.V.; Fortini, E.A.; Chagas, K.; et al. Light quality in plant tissue culture: Does it matter? Vitr. Cell. Dev. Biol. 2018, 54, 195–215. [Google Scholar] [CrossRef]
- Barceló-Muñoz, A.; Barceló-Muñoz, M.; Gago-Calderon, A. Effect of LED Lighting on Physical Environment and Microenvironment on In Vitro Plant Growth and Morphogenesis: The Need to Standardize Lighting Conditions and Their Description. Plants 2021, 11, 60. [Google Scholar] [CrossRef] [PubMed]
- Podolec, R.; Demarsy, E.; Ulm, R. Perception and Signaling of Ultraviolet-B Radiation in Plants. Annu. Rev. Plant Biol. 2021, 72, 793–822. [Google Scholar] [CrossRef]
- Jansen, M.A.K.; Gaba, V.; Greenberg, B.M. Higher plants and UV-B radiation: Balancing damage, repair and acclimation. Trends Plant Sci. 1998, 3, 131–135. [Google Scholar] [CrossRef]
- Hayes, S.; Velanis, C.N.; Jenkins, G.I.; Franklin, K.A. UV-B Detected by the UVR8 Photoreceptor Antagonizes Auxin Signaling and Plant Shade Avoidance. Proc. Natl. Acad. Sci. USA 2014, 111, 11894–11899. [Google Scholar] [CrossRef] [PubMed] [Green Version]
- Köhler, H.; Contreras, R.A.; Pizarro, M.; Cortés-Antíquera, R.; Zúñiga, G.E. Antioxidant Responses Induced by UVB Radiation in Deschampsia Antarctica Desv. Front. Plant Sci. 2017, 8, 921. [Google Scholar] [CrossRef] [Green Version]
- Robson, T.M.; Klem, K.; Urban, O.; Jansen, M.A.K. Re-interpreting plant morphological responses to UV-B radiation. Plant Cell Environ. 2015, 38, 856–866. [Google Scholar] [CrossRef]
- Jansen, M.A.K. Ultraviolet-B radiation effects on plants: Induction of morphogenic responses. Physiol. Plant. 2002, 116, 423–429. [Google Scholar] [CrossRef]
- Kataria, S.; Jajoo, A.; Guruprasad, K.N. Impact of increasing Ultraviolet-B (UV-B) radiation on photosynthetic processes. J. Photochem. Photobiol. B Biol. 2014, 137, 55–66. [Google Scholar] [CrossRef]
- Qian, M.; Rosenqvist, E.; Prinsen, E.; Pescheck, F.; Flygare, A.M.; Kalbina, I.; Jansen, M.A.; Strid, Å. Downsizing in plants—UV light induces pronounced morphological changes in the absence of stress. Plant Physiol. 2021, 187, 378–395. [Google Scholar] [CrossRef]
- Wargent, J.J.; Moore, J.P.; Ennos, A.R.; Paul, N.D. Ultraviolet Radiation as a Limiting Factor in Leaf Expansion and Development. Photochem. Photobiol. 2009, 85, 279–286. [Google Scholar] [CrossRef] [PubMed]
- Vanhaelewyn, L.; Prinsen, E.; van der Straeten, D.; Vandenbussche, F. Hormone-controlled UV-B responses in plants. J. Exp. Bot. 2016, 67, 4469–4482. [Google Scholar] [CrossRef] [PubMed]
- Hronková, M.; Zahradníčková, H.; Šimková, M.; Šimek, P.; Heydová, A. The Role of Abscisic Acid in Acclimation of Plants Cultivated in vitro to ex vitro Conditions. Biol. Plant. 2003, 46, 535–541. [Google Scholar] [CrossRef]
- Flint, S.D.; Caldwell, M.M. A biological spectral weighting function for ozone depletion research with higher plants. Physiol. Plant. 2003, 117, 137–144. [Google Scholar] [CrossRef]
- Franklin, K.A.; Whitelam, G.C. Phytochromes and shade-avoidance responses in plants. Ann. Bot. 2005, 96, 169–175. [Google Scholar] [CrossRef] [Green Version]
- Lobet, G.; Pagès, L.; Draye, X. A Novel Image-Analysis Toolbox Enabling Quantitative Analysis of Root System Architecture. Plant Physiol. 2011, 157, 29–39. [Google Scholar] [CrossRef] [PubMed] [Green Version]
- Yadav, A.; Singh, D.; Lingwan, M.; Yadukrishnan, P.; Masakapalli, S.K.; Datta, S. Light signaling and UV-B-mediated plant growth regulation. J. Integr. Plant Biol. 2020, 62, 1270–1292. [Google Scholar] [CrossRef]
- Potters, G.; Pasternak, T.P.; Guisez, Y.; Palme, K.J.; Jansen, M.A.K. Stress-induced morphogenic responses: Growing out of trouble? Trends Plant Sci. 2007, 12, 98–105. [Google Scholar] [CrossRef]
- Metwally, S.A.; Shoaib, R.M.; Hashish, K.I.; El-Tayeb, T.A. In vitro ultraviolet radiation effects on growth, chemical constituents and molecular aspects of Spathiphyllum plant. Bull. Natl. Res. Cent. 2019, 43, 94. [Google Scholar] [CrossRef] [Green Version]
- Müller, D.; Leyser, O. Auxin, cytokinin and the control of shoot branching. Ann. Bot. 2011, 107, 1203–1212. [Google Scholar] [CrossRef]
- Zwack, P.J.; Rashotte, A.M. Interactions between cytokinin signalling and abiotic stress responses. J. Exp. Bot. 2015, 66, 4863–4871. [Google Scholar] [CrossRef] [PubMed] [Green Version]
- Kataria, S. Interaction of cytokinins with UV-B (280–315nm) on the expansion growth of cucumber cotyledons. Horticult. Int. J. 2018, 2, 45–53. [Google Scholar] [CrossRef] [Green Version]
- Hectors, K.; van Oevelen, S.; Guisez, Y.; Prinsen, E.; Jansen, M.A.K. The phytohormone auxin is a component of the regulatory system that controls UV-mediated accumulation of flavonoids and UV-induced morphogenesis. Physiol. Plant. 2012, 145, 594–603. [Google Scholar] [CrossRef] [PubMed]
- Ivanchenko, M.G.; Napsucialy-Mendivil, S.; Dubrovsky, J.G. Auxin-induced inhibition of lateral root initiation contributes to root system shaping in Arabidopsis thaliana. Plant J. 2010, 64, 740–752. [Google Scholar] [CrossRef] [PubMed]
- Xiong, Y.; Jiao, Y. The Diverse Roles of Auxin in Regulating Leaf Development. Plants 2019, 8, 243. [Google Scholar] [CrossRef] [Green Version]
- Ma, L.; Li, G. Auxin-Dependent Cell Elongation During the Shade Avoidance Response. Front. Plant Sci. 2019, 10, 914. [Google Scholar] [CrossRef] [Green Version]
- Bulgakov, V.P.; Wu, H.-C.; Jinn, T.-L. Coordination of ABA and Chaperone Signaling in Plant Stress Responses. Trends Plant Sci. 2019, 24, 636–651. [Google Scholar] [CrossRef]


Disclaimer/Publisher’s Note: The statements, opinions and data contained in all publications are solely those of the individual author(s) and contributor(s) and not of MDPI and/or the editor(s). MDPI and/or the editor(s) disclaim responsibility for any injury to people or property resulting from any ideas, methods, instructions or products referred to in the content. |
© 2022 by the authors. Licensee MDPI, Basel, Switzerland. This article is an open access article distributed under the terms and conditions of the Creative Commons Attribution (CC BY) license (https://creativecommons.org/licenses/by/4.0/).
Share and Cite
Crestani, G.; Cunningham, N.; Badmus, U.O.; Prinsen, E.; Jansen, M.A.K. UV-B Radiation as a Novel Tool to Modulate the Architecture of In Vitro Grown Mentha spicata (L.). Agronomy 2023, 13, 2. https://0-doi-org.brum.beds.ac.uk/10.3390/agronomy13010002
Crestani G, Cunningham N, Badmus UO, Prinsen E, Jansen MAK. UV-B Radiation as a Novel Tool to Modulate the Architecture of In Vitro Grown Mentha spicata (L.). Agronomy. 2023; 13(1):2. https://0-doi-org.brum.beds.ac.uk/10.3390/agronomy13010002
Chicago/Turabian StyleCrestani, Gaia, Natalie Cunningham, Uthman O. Badmus, Els Prinsen, and Marcel A. K. Jansen. 2023. "UV-B Radiation as a Novel Tool to Modulate the Architecture of In Vitro Grown Mentha spicata (L.)" Agronomy 13, no. 1: 2. https://0-doi-org.brum.beds.ac.uk/10.3390/agronomy13010002