Article

Optimization of an Aqueous Enzymatic Method and Supercritical Carbon Dioxide Extraction for Paeonia suffruticosa Andr. Seed Oil Production Using Response Surface Methodology (RSM)

1
School of Life Science and Bioengineering, Jining University, Jining 273155, China
2
Jining Key Laboratory of Bioresource Development and Utilization, Jining University, Jining 273155, China
3
Shandong Xiaoying Biotechnology Co., Ltd., Jinan 250003, China
4
Institute of Agro-Food Science and Technology, Shandong Academy of Agricultural Sciences, Jinan 250100, China
*
Author to whom correspondence should be addressed.
Submission received: 26 November 2022 / Revised: 13 February 2023 / Accepted: 14 February 2023 / Published: 15 February 2023
(This article belongs to the Topic Bioactives and Ingredients from Agri-Food Wastes)

Abstract

:
Peony seed oil, a type of tree nut oil, has attracted the attention of nutritionists for its rich nutritional content. The aim of this study was to extract oil from the peony seed utilizing green and efficient methods. Specifically, aqueous enzymatic extraction was optimized using the Plackett–Burman design combined with the mixture design to extract the optimal enzyme ratio of peony seed oil. When the dosage of enzymes was 10 mg protein/g peony seed, the optimal ratios of the dosages of papain, cellulase, and pectinase were 16.15%, 31.33%, and 52.53%, respectively. Subsequently, central composite design was adopted to optimize supercritical CO2 extraction to identify the process parameters of extracting residual oil from the residue of the aqueous enzymatic extraction. Almost 6.30% of peony seed oil could be obtained from the residue using continuous extraction for 1.58 h at 49.41 °C and 59.75 Mpa. After mixing the peony seed oil extracted by the two processes, its physicochemical indices were measured. Compared with commercial peony seed oil extracted based on the organic solvent leaching method, the elative density and iodine value were higher based on our approach, whereas the other indices showed no significant differences. Thus, the two-step strategy combining the aqueous enzymatic method and supercritical CO2 extraction can be effectively applied to peony seed oil production.

1. Introduction

Peony (Paeonia suffruticosa Andr.), which belongs to the family Paeoniaceae, is a deciduous shrub that is widely planted in China, especially in Heze and Luoyang [1,2]. Peony seeds are rich in resources, the annual production of which can reach tens of thousands of tons, and the industry shows considerable development potential. Peony seed contains 29–34% oil, 18–22% protein, and a higher unsaturated fatty acid content than other vegetable oils [3]. The unsaturated fatty acids in peony seed oil are mainly oleic acid, linoleic acid, and linolenic acid [4,5], which can delay aging and prevent the occurrence of obesity [6,7,8]. In 2011, the China Ministry of Health listed peony oil as a new food resource [3,8].
The traditional technique of oil extraction using organic solvents leads to health, safety, and environmental problems [9]. Among the modern extraction methods, green solvents such as water, ethanol, and carbon dioxide (CO2) are receiving increasing attention [10]. The aqueous enzymatic method has the advantages of simple operation and mild conditions, is a safe and non-polluting oil-extraction method, and can better ensure oil quality [11]. This is because the cell wall can undergo enzymatic hydrolysis under mild conditions, and thus enzyme-assisted extraction can improve oil yields [12,13]. Wei et al. [14] found that cellulase and hemicellulose help improve the yield of peony seed oil extraction via the aqueous enzymatic method. However, the industrial production scale of this approach is hindered due to enzyme costs. Specifically, enzyme composition and process conditions need to be optimized to obtain higher oil yields and lower production costs. We also previously found that peony seed oil is present in residues after extraction using the aqueous enzymatic method.
In comparison with enzymatic extraction, the supercritical CO2 extraction technique is considered efficient [15] and thus, can be used to continue extracting oil from aqueous enzymatic method residue (AER). For example, while supercritical extraction equipment is typically expensive, this can be overcome by applying supercritical CO2 extraction to low-volume AER, which avoids the need for large and expensive equipment. Currently, no studies have been published on the extraction of peony seed oil using a two-step strategy combining hydroenzymatic and supercritical CO2 extraction. Nevertheless, this strategy likely requires more control of the process condition parameters. To address this, the response surface methodology can be effectively employed. For example, the extraction conditions of olive oil, Lawsonia inermis essential oil, and hemp seed oil were optimized using the response surface methodology, enabling significant oil yield increases [16,17,18].
In this study, we adopt a two-step strategy of aqueous enzymatic method combined with supercritical CO2 extraction to extract peony seed oil. The Plackett–Burman design (PBD) [19] and mixture design [20] are used to optimize the composition of enzymes in the extraction process, and central composite design (CCD) [21] is used to optimize the conditions of supercritical extraction. We then compare the differences in fatty acid compositions of peony seed oil extracted using these two extraction methods, and also compare the physicochemical indices of commercial peony seed oil and the oil extracted using the aqueous enzymatic method. Our results provide a new strategy for the effective development and utilization of peony seeds as a new food resource.

2. Materials and Methods

2.1. Materials

Shelled peony seed kernels were collected from Heze, Shandong, and stored in a cold storage at 4 °C. They were crushed by hammer crusher into particles of less than 40 mesh before use. Enzymes including cellulase, β-glucanase, α-amylase, glucoamylase, pectinase, and xylanase were purchased from SUNSON Industry Group Co., Ltd. (Beijing, China), and papain was purchased from Pangbo Biotechnology Engineering Co., Ltd. (Nanning, China). The enzyme activities were re-tested.

2.2. Enzyme Assays

The required amounts of commercial cellulase, β-glucanase, α-amylase, glucoamylase, pectinase, xylanase, and papain enzyme powder were weighed and dissolved in the corresponding buffers with the respective optimal pH to prepare the enzyme solutions.
Cellulase, β-glucanase, xylanase, and pectinase were measured using filter paper, carboxymethyl cellulose, beech xylan, and pectin as the substrate, respectively [22,23,24,25]. The enzyme activities of both α-amylase and glucoamylase were measured using starch as a substrate, the only difference being the concentration, as described in the literature [26,27]. The dinitrosalicylic acid (DNS) method with glucose as the standard was used to determine the amount of reducing sugars released [28]. One enzyme activity unit (U) was defined as the amount of enzyme that liberates 1 μmol glucose, xylose, or galacturonic acid equivalent per minute under the assay conditions.
For the measurement of papain activity, 2 mL of enzyme solution and 2 mL of 1% concentration casein solution were mixed. After 10 min of reaction at 40 °C, 4 mL of trichloroacetic acid solution (0.4 M) was added to terminate the reaction. After shaking well, the sample was centrifuged at 300× g for 5 min. One unit of enzyme activity was defined as the amount of enzyme required to produce 1 μg of tyrosine by hydrolyzed casein in 1 min [29].

2.3. Determination of Protein Concentration

Protein concentrations were determined using the Bradford Protein Assay Kit (Sangon, Shanghai, China) according to the manufacturer’s instructions [30].

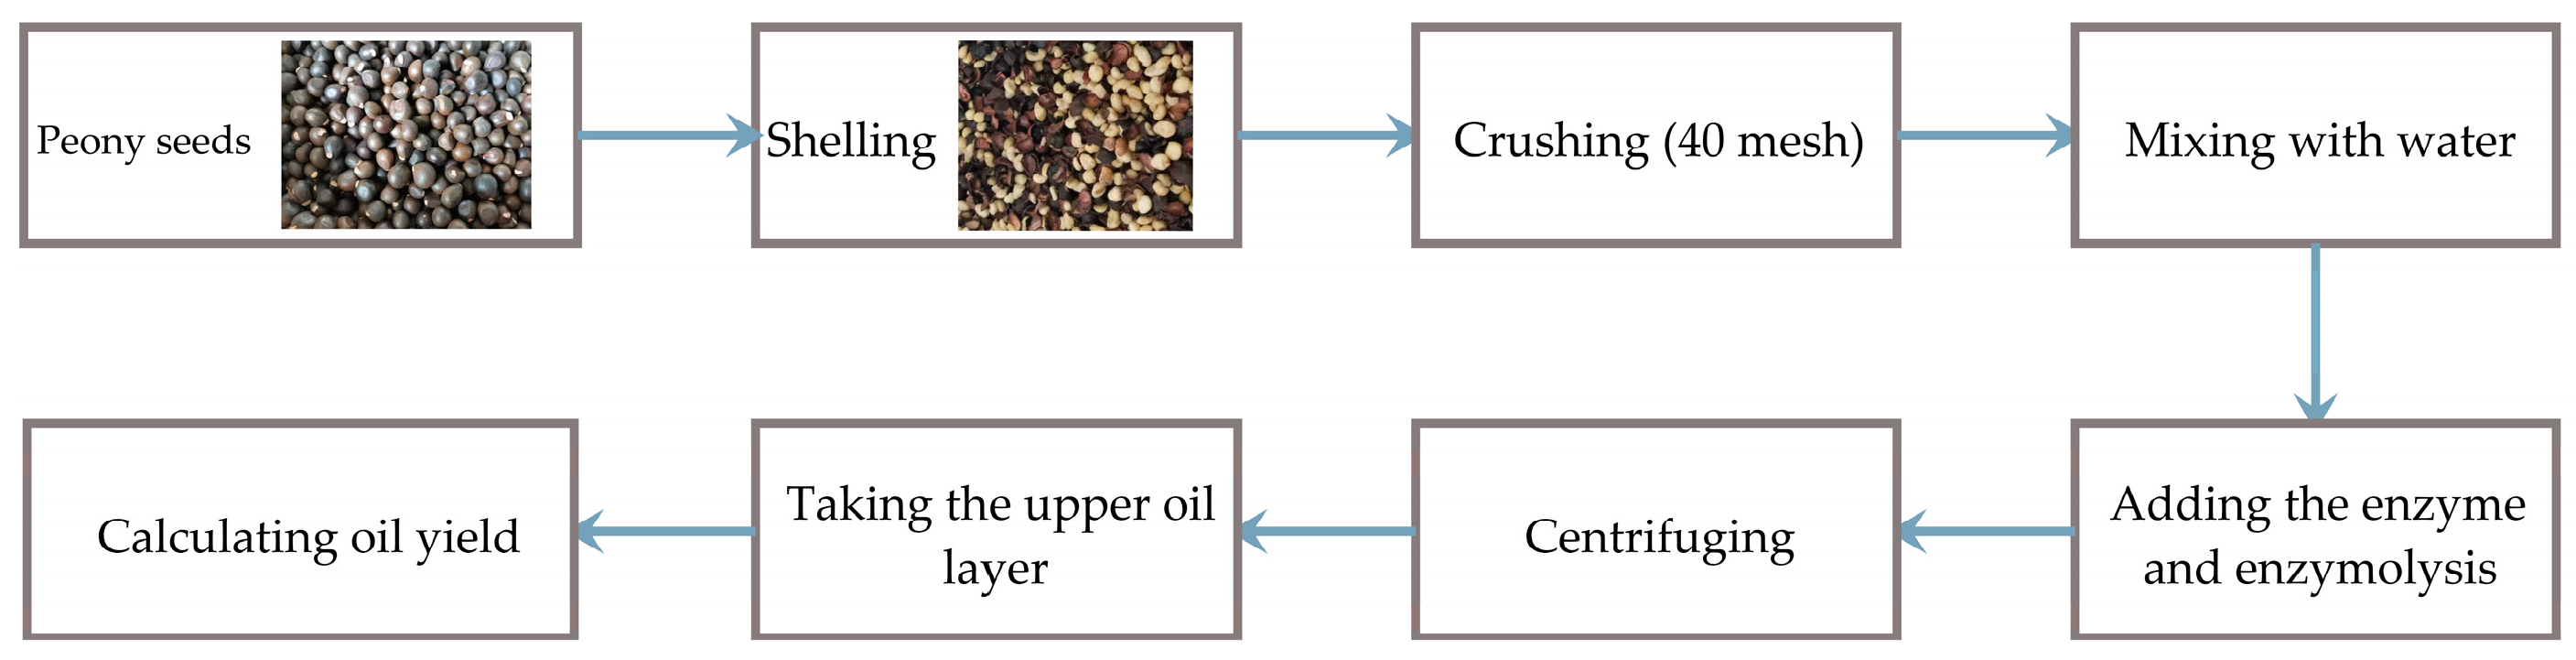
2.4. Extraction of Peony Seed Oil Using the Aqueous Enzymatic Method

We placed 30 g of crushed peony seeds (<40 mesh) in a jacketed beaker. The corresponding amount of enzyme and five times the volume of distilled water were added. The reaction solution underwent enzymolysis in a water bath at 55 °C for 3 h and was then heated to 90 °C to inactivate the enzyme. The enzymatic hydrolysate was centrifuged at 5000× g for 20 min, after which the solution was stratified. The upper oil layer was collected to calculate the yield of peony seed oil. Figure 1 illustrates the workflow relating to the aqueous enzymatic extraction method.
Finally, the oil yield was calculated according to the following formula:
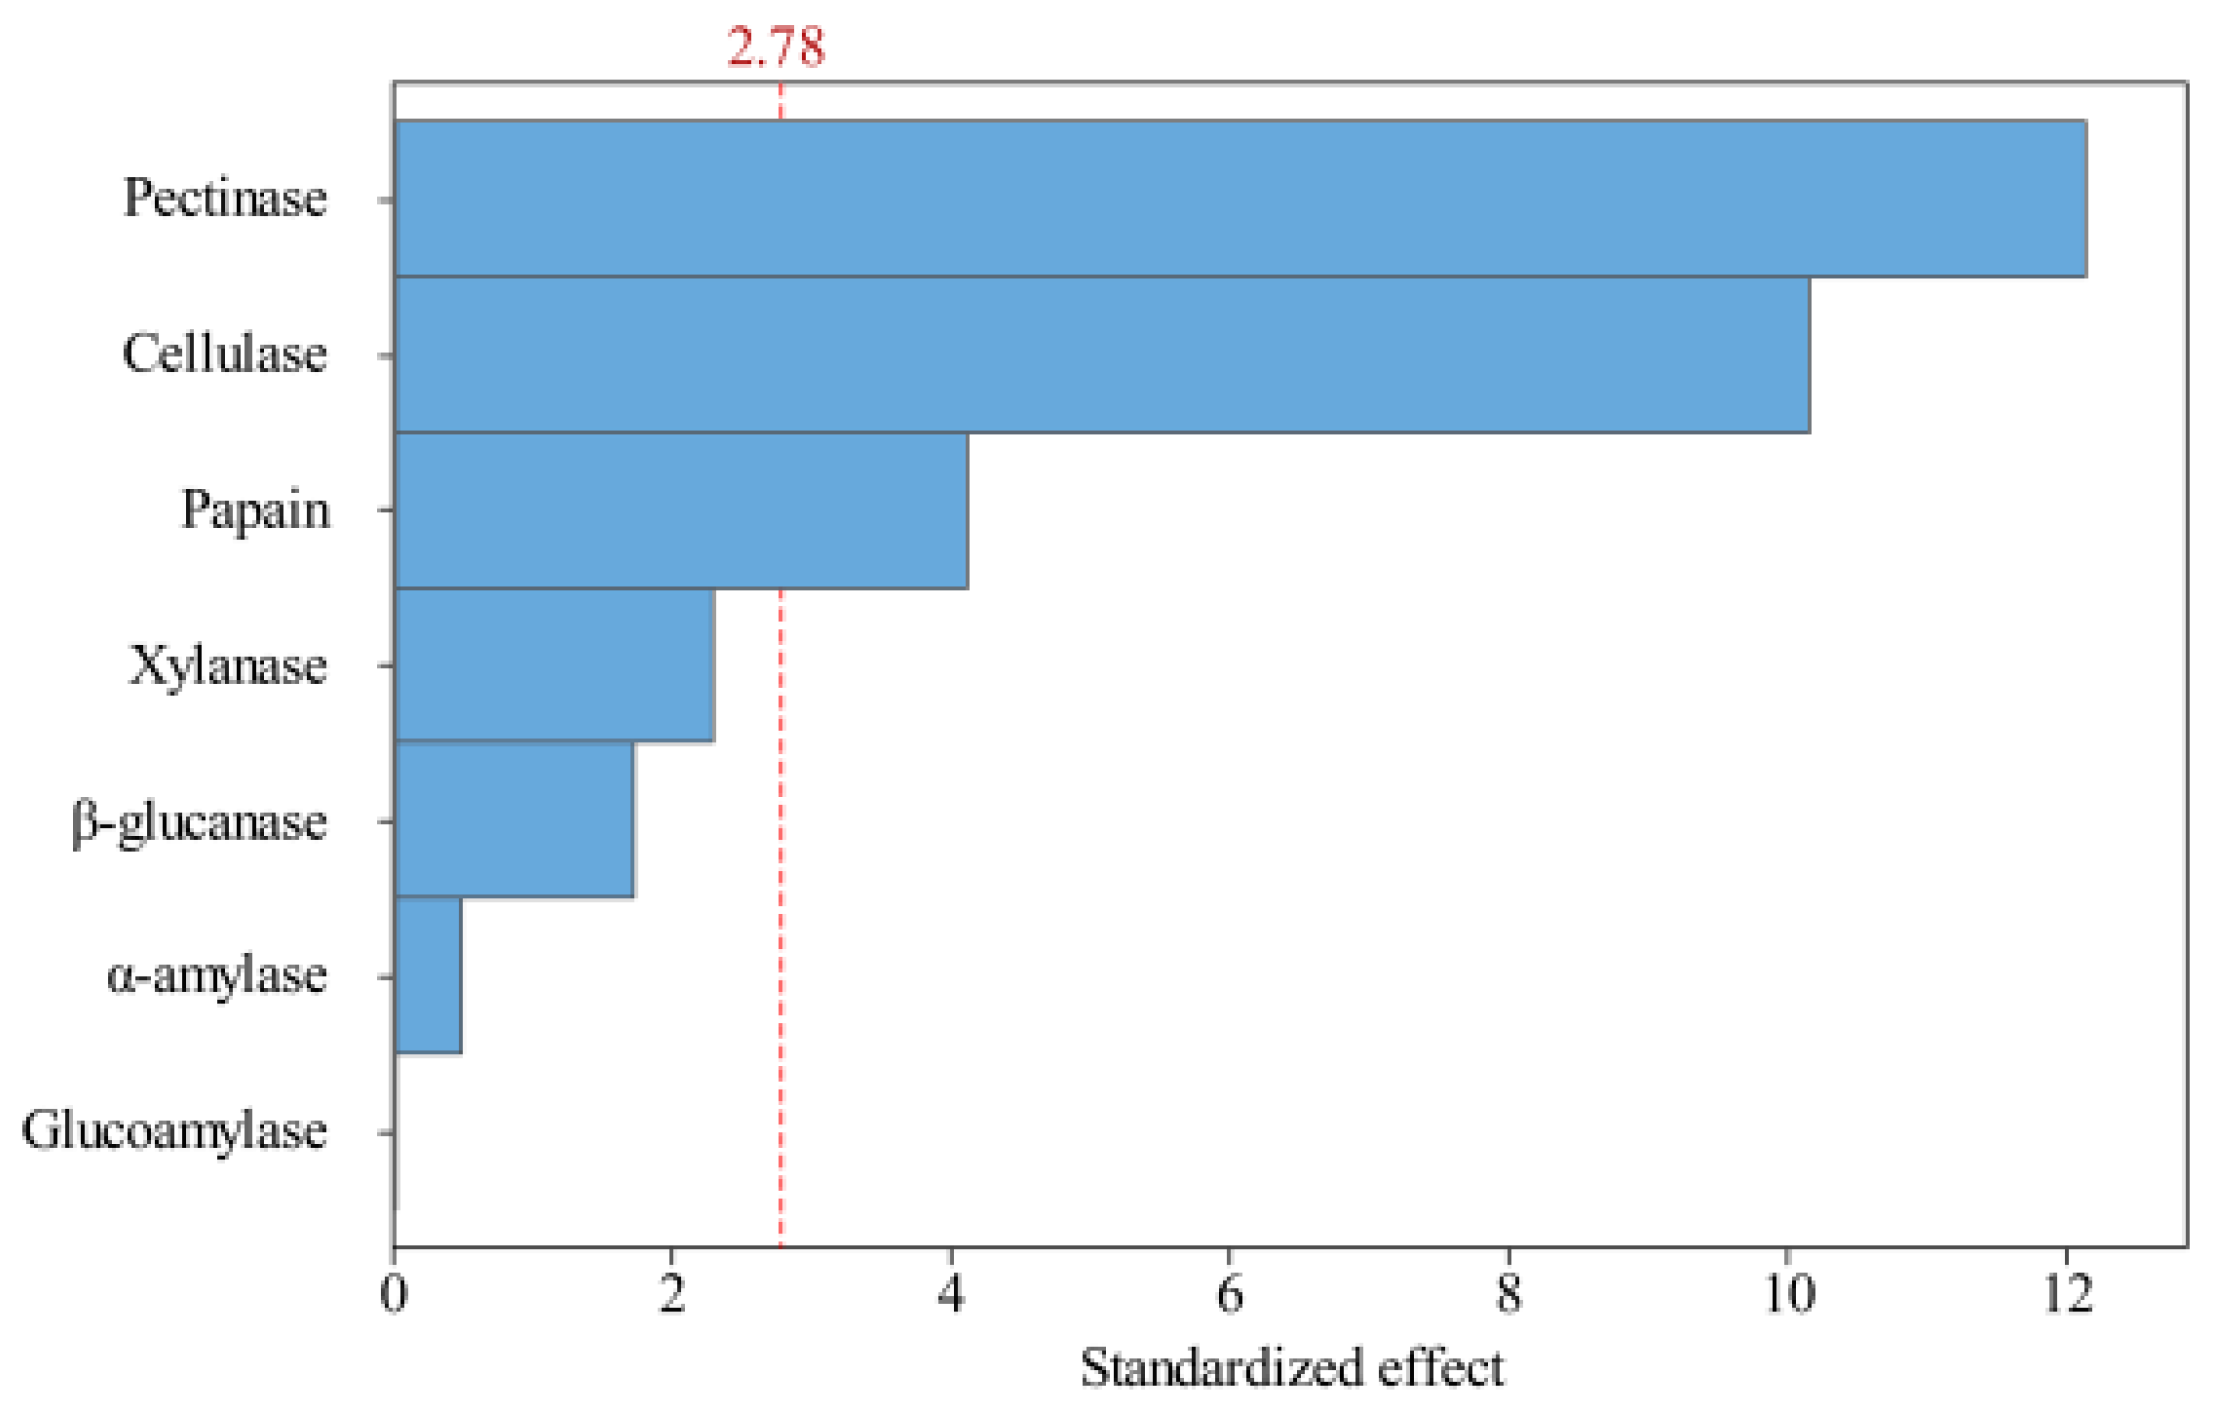
Oil   yield   ( % ) = m weight   of   oil   output m weight   of   raw   material × 100

2.4.1. PBD

The PBD can quickly and effectively identify the most important factors from multiple examined variables, thereby enabling subsequent optimization tests. Here, key enzyme components were screened for their major effects using PBD. The variables selected were the respective activities of cellulase, papain, β-glucanase, α-amylase, glucoamylase, pectinase, and xylanase. Table 1 shows the experimental design of the PDB analysis.
For mathematical modeling, the following first-order polynomial model was used:
Y = β0 + ∑βixi
where Y is the predicted oil yield, β0 is the model intercept, βi is the linear coefficient, and xi is the independent variable.

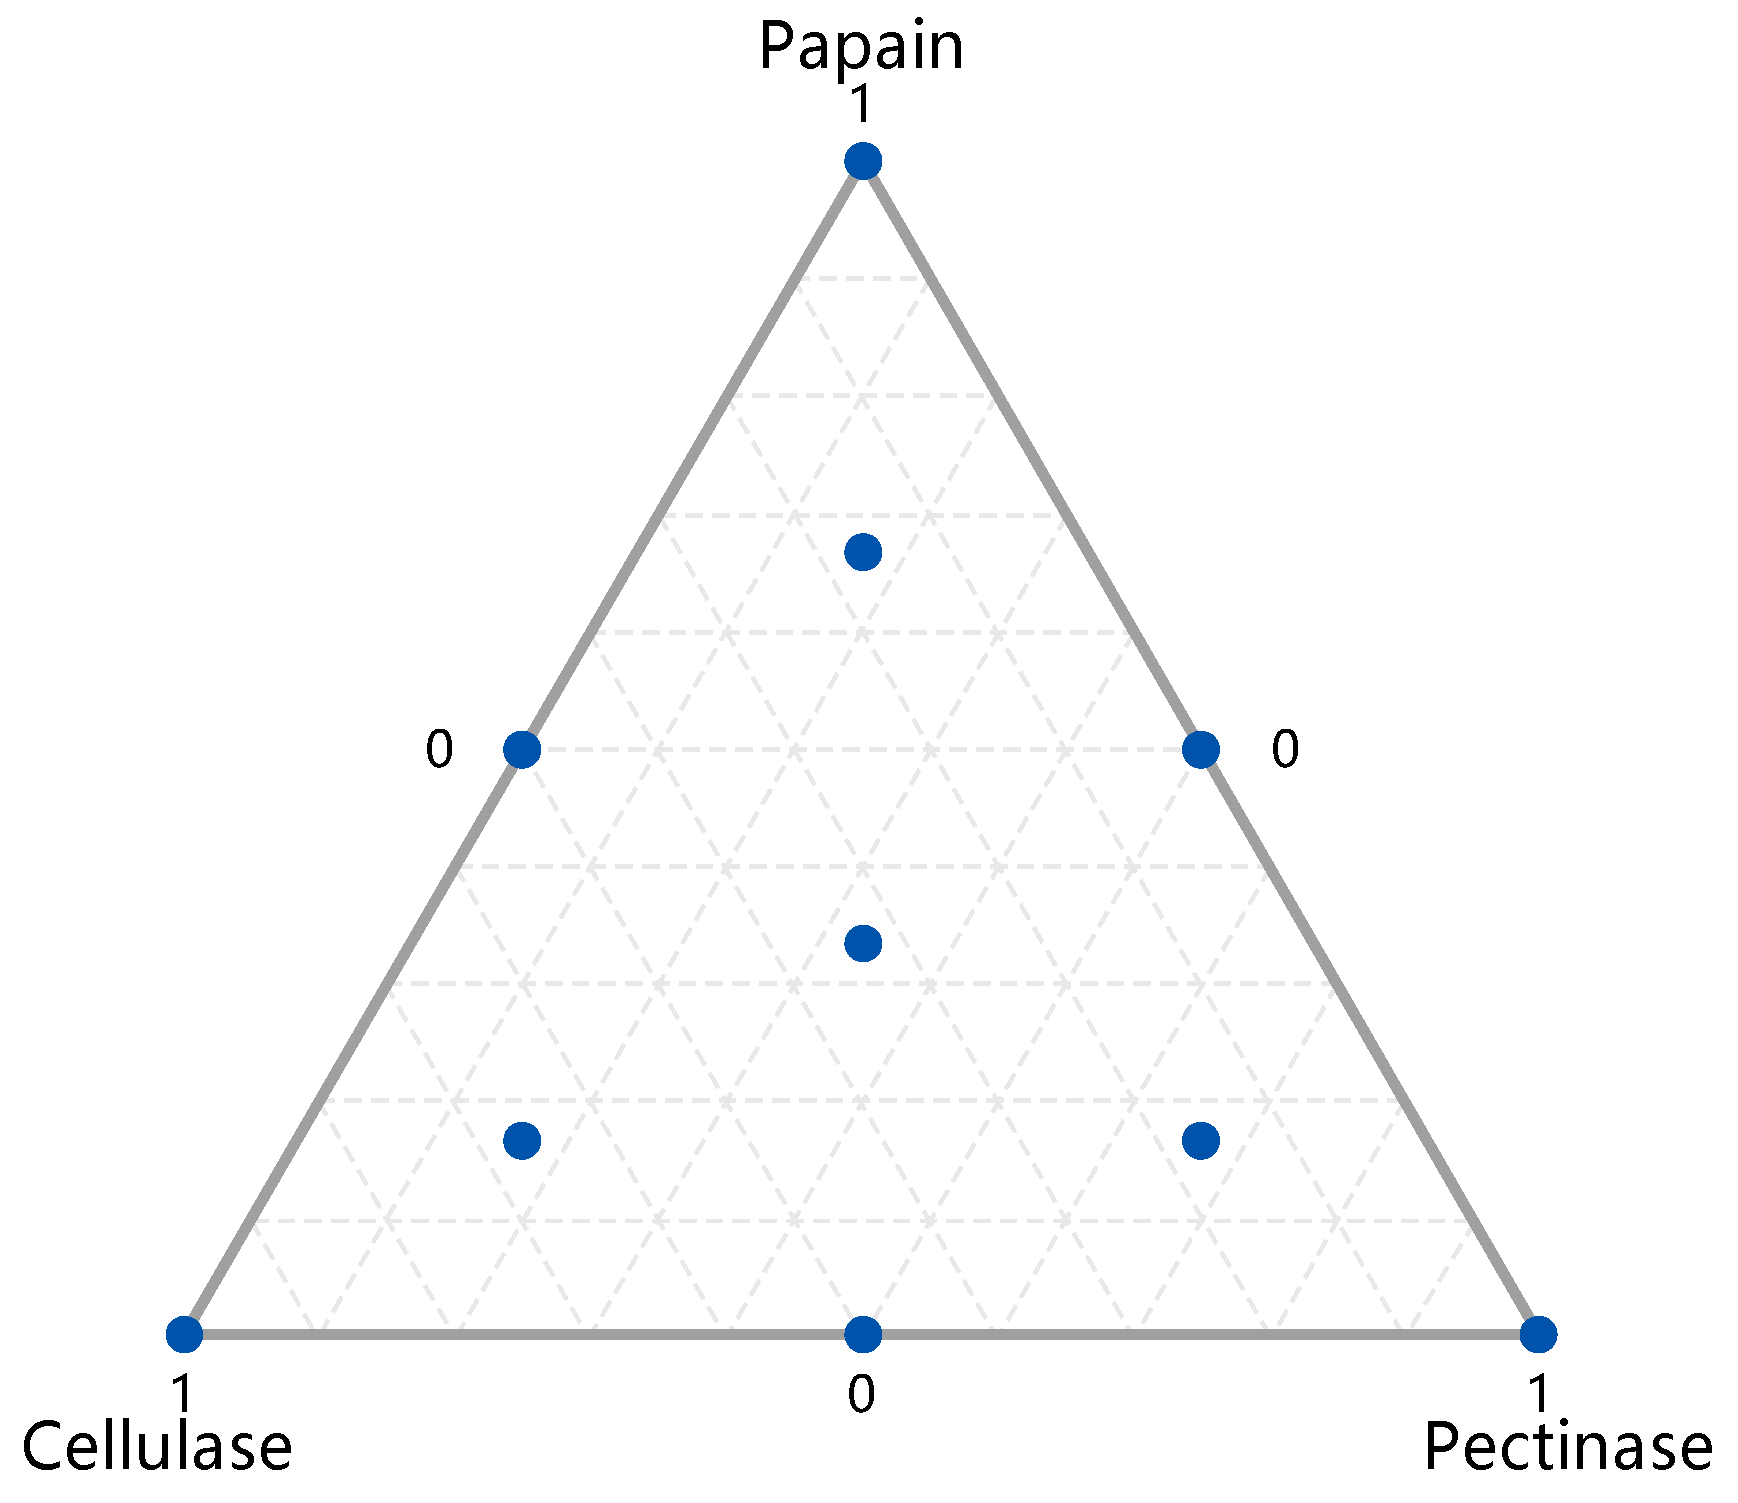
2.4.2. Mixture Design

The peony seeds were treated with pectinase, cellulase, and papain synergistically. The effects of formulations with different enzyme mixture ratios on the oil yield were investigated using the simplex centroid design method while considering cost as a prerequisite. The most suitable pre-treatment cocktail enzyme formulation for the extraction was screened with the aim of optimizing the oil yield. With reference to the experimental results of the PBD and considering economic cost (accepting that the more enzyme used, the better the yield), the dosage was limited to 10 mg enzyme protein/g peony seeds. The experimental design is shown in Figure 2, in which each point represents one formulation out of a total of ten tested). The specific schemes and results of the oil yield measurement are shown in Table 2.
The mathematical relationship of the oil yield (Y) to the significant independent variables (x1, x2 and x3) is provided by the following quadratic polynomial equation:
Y = β1X1 + β2x2 + β3x3 + β12x1x2 + β13x1x3 + β23x2x3
where Y is the response (oil yield); x1, x2, and x3 are significant independent variables corresponding to the ratio of pectinase, cellulase, and papain, respectively; β1, β2, and β3 are linear regression coefficients; and β12, β13, and β23 are interactive regression coefficients.

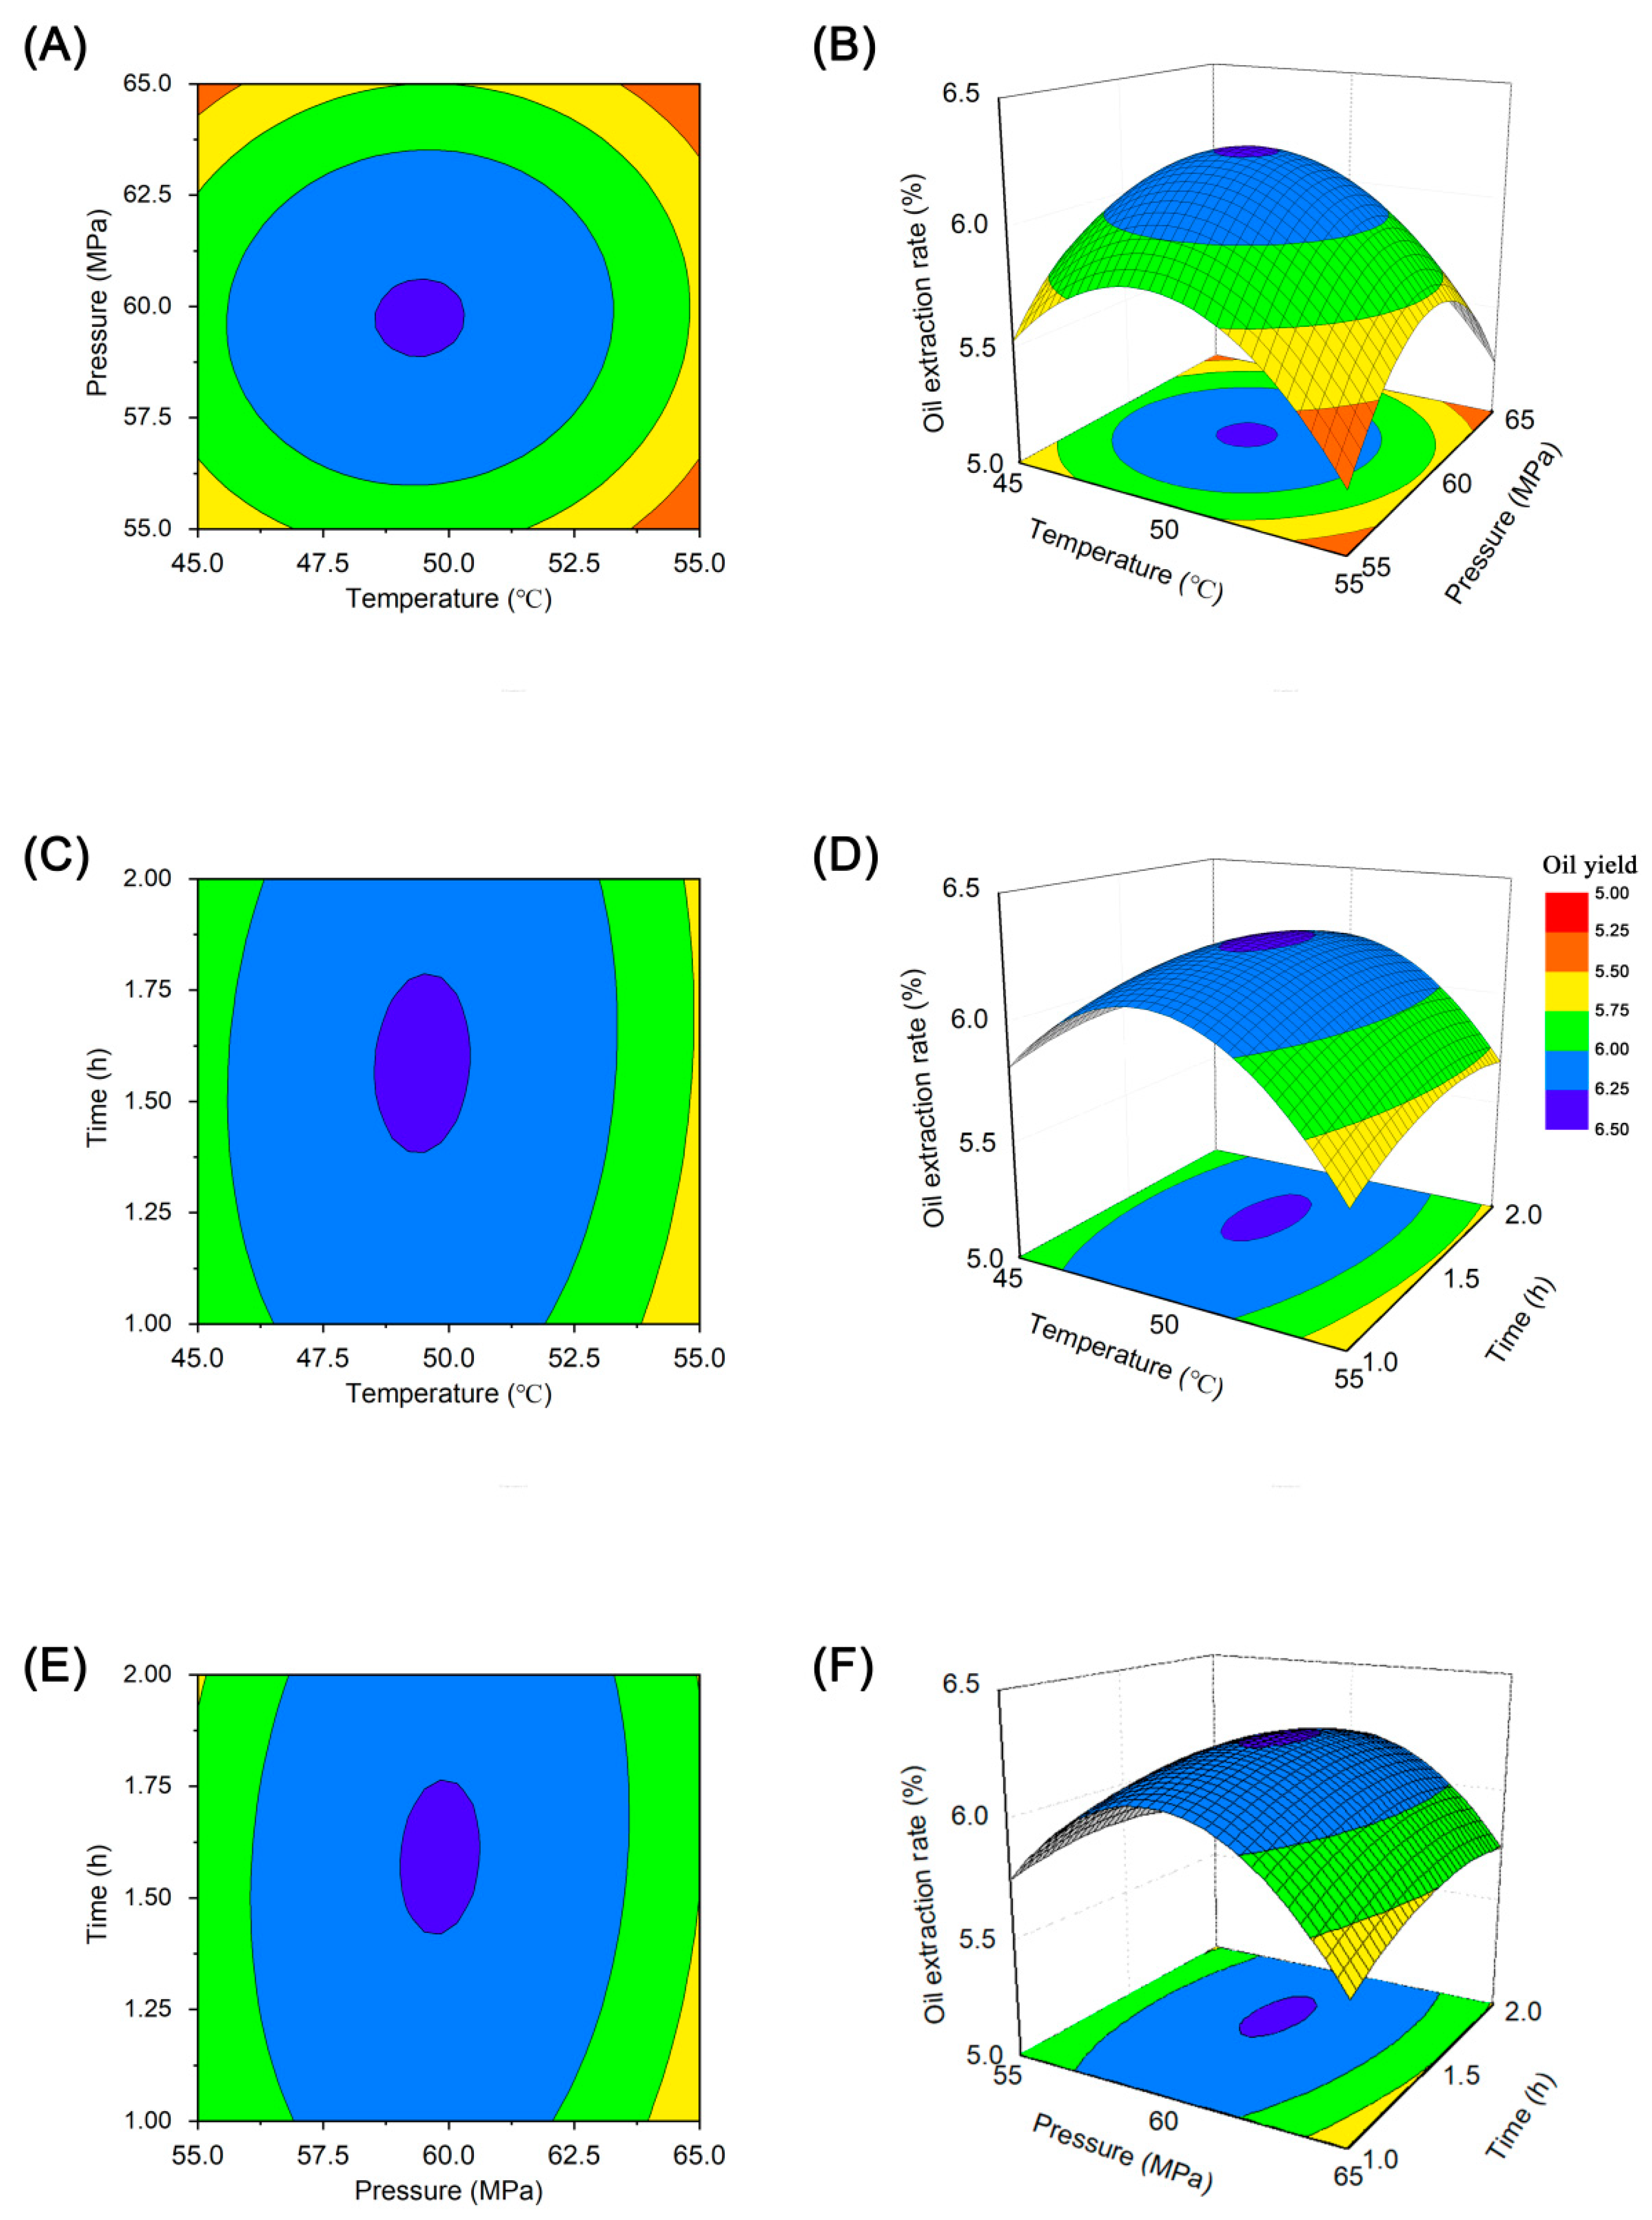
2.5. Optimization of Supercritical CO2 Extraction Using Response Surface Methodology

We weighed 25 g of peony seed AER (dried) after aqueous enzymatic extraction and placed the sample in a 100 mL extraction kettle for supercritical CO2 extraction. We adopted the process conditions of previous direct supercritical CO2 extraction of peony seed oil (unpublished data), with an extraction pressure of 55–65 MPa, extraction temperature of 45–55 °C, and extraction time of 60–120 min. The extracts were collected at regular intervals. The oil was collected, and the yield calculated.
Response surface methodology (RSM) can conveniently determine the best conditions for a process. CCD was employed to obtain information regarding the significant effects and interactions between the selected variables and identify the optimal values of each variable to maximize oil yield. The three factors selected for further optimization were temperature (°C), pressure (MPa), and time (h), which were denoted as x1, x2, and x3, respectively. Each factor was assessed at five different levels combining factorial points (−1, +1), axial points (−α, +α), and the central point (0) (Table 3).
Oil yield was analyzed using a second-order polynomial equation, and the data were fitted by multiple regression. The mathematical relationship of the response ( Y ) to the significant independent variables (x1, x2, and x3) is provided by the following quadratic equation:
Y = β0 + β1x1 + β2x2 + β3x311x12 + β22x22 + β33x32 + β12x1x2 + β13x1x3 + β23x2x3
where Y is the response (oil yield); x1, x2, and x3 are temperature, pressure, and time, respectively; β0 is a constant; β1, β2, and β3 are linear regression coefficients; β11, β22, and β33 are quadratic regression coefficients; and β12, β13, and β23 are interactive regression coefficients.

2.6. Analysis of the Fatty Acid Composition of Peony Seed Oil

Fatty acid analysis was slightly improved with reference to the method of Li et al. [31]. Agilent 7890 gas chromatography and Agilent 5975 mass spectrometry were performed to analyze the fatty acid composition of the peony seeds. The BF3-methanol solvent method was used for methyl esterification; 1 g of peony seed oil was placed in a round bottom flask, and 6 mL of 0.5 M potassium hydroxide-methanol solution was added for reflux saponification in a water bath at 60 °C for 30 min. After cooling, 12 mL of BF3-methanol solution with a 40% mass fraction was added for reflux methylation in a water bath at 60 °C for 5 min. After cooling, 4 mL of hexane and 4 mL of saturated sodium chloride were added, mixed thoroughly, centrifuged, and analyzed using gas chromatography-mass spectrometry (GC-MS) according to the following conditions: chromatographic column HP-88 quartz capillary column (100 mm × 0.25 mm, 0.2 μm); heating procedure: held at 80 °C for 5 min, increased to 150 °C at a rate of 10 °C min−1, held for 2 min, increased to 230 °C at a rate of 5 °C min−1, and held for 10 min. The injection volume was 1 μL, the inlet temperature was 250 °C, the split ratio was 10:1, the carrier gas was helium, the pre-column pressure was 100 kPa, the ionization voltage was 70 eV, and the mass scan range was 50–550 amu.

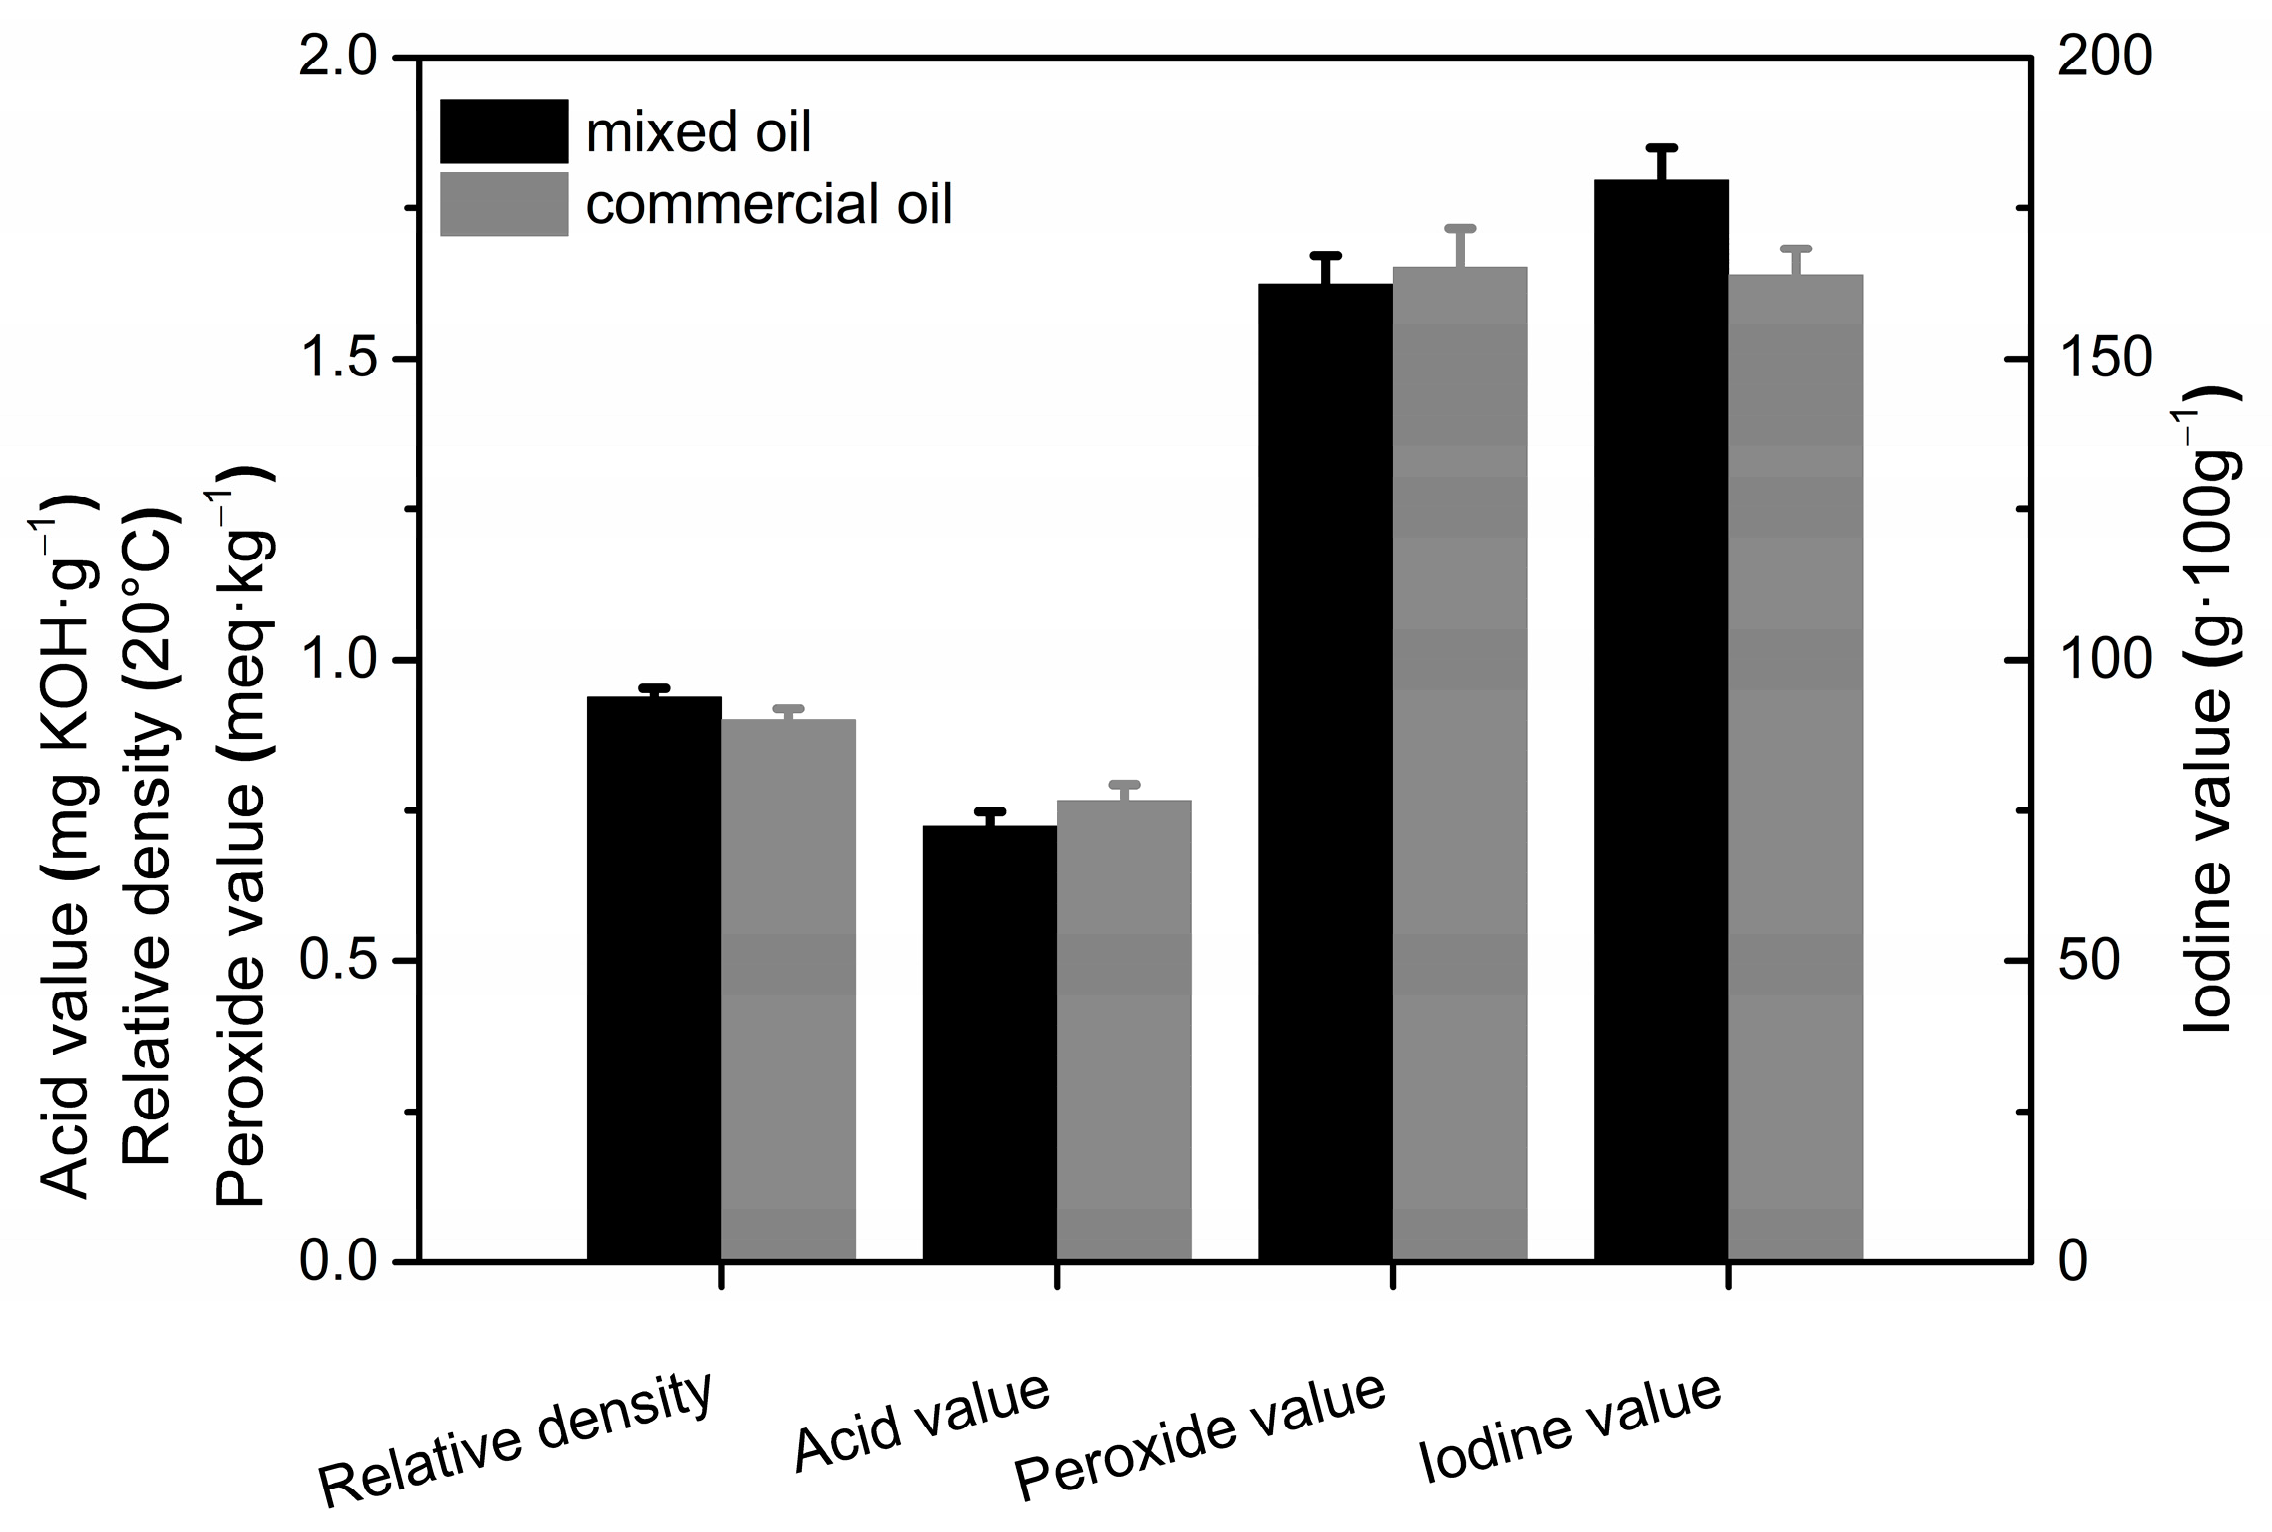
2.7. Analysis of Physicochemical Properties of Peony Seed Oil

The International Organization for Standardization (ISO) standards were used for the determination of oil relative density (ISO 3675, 1998), acid value (ISO 1242, 1999), peroxide value (ISO 3960, 2007), and iodine value (ISO 3961, 2013).

2.8. Statistical Analysis

Minitab® 17 (Minitab Inc, State College, PA, USA) software was employed for designing PBD, mixture design and CCD experiments as well as for regression analysis of the experimental data obtained. Statistical analysis of was performed using analysis of variance (ANOVA). All assays were performed in triplicate, and mean values were calculated.
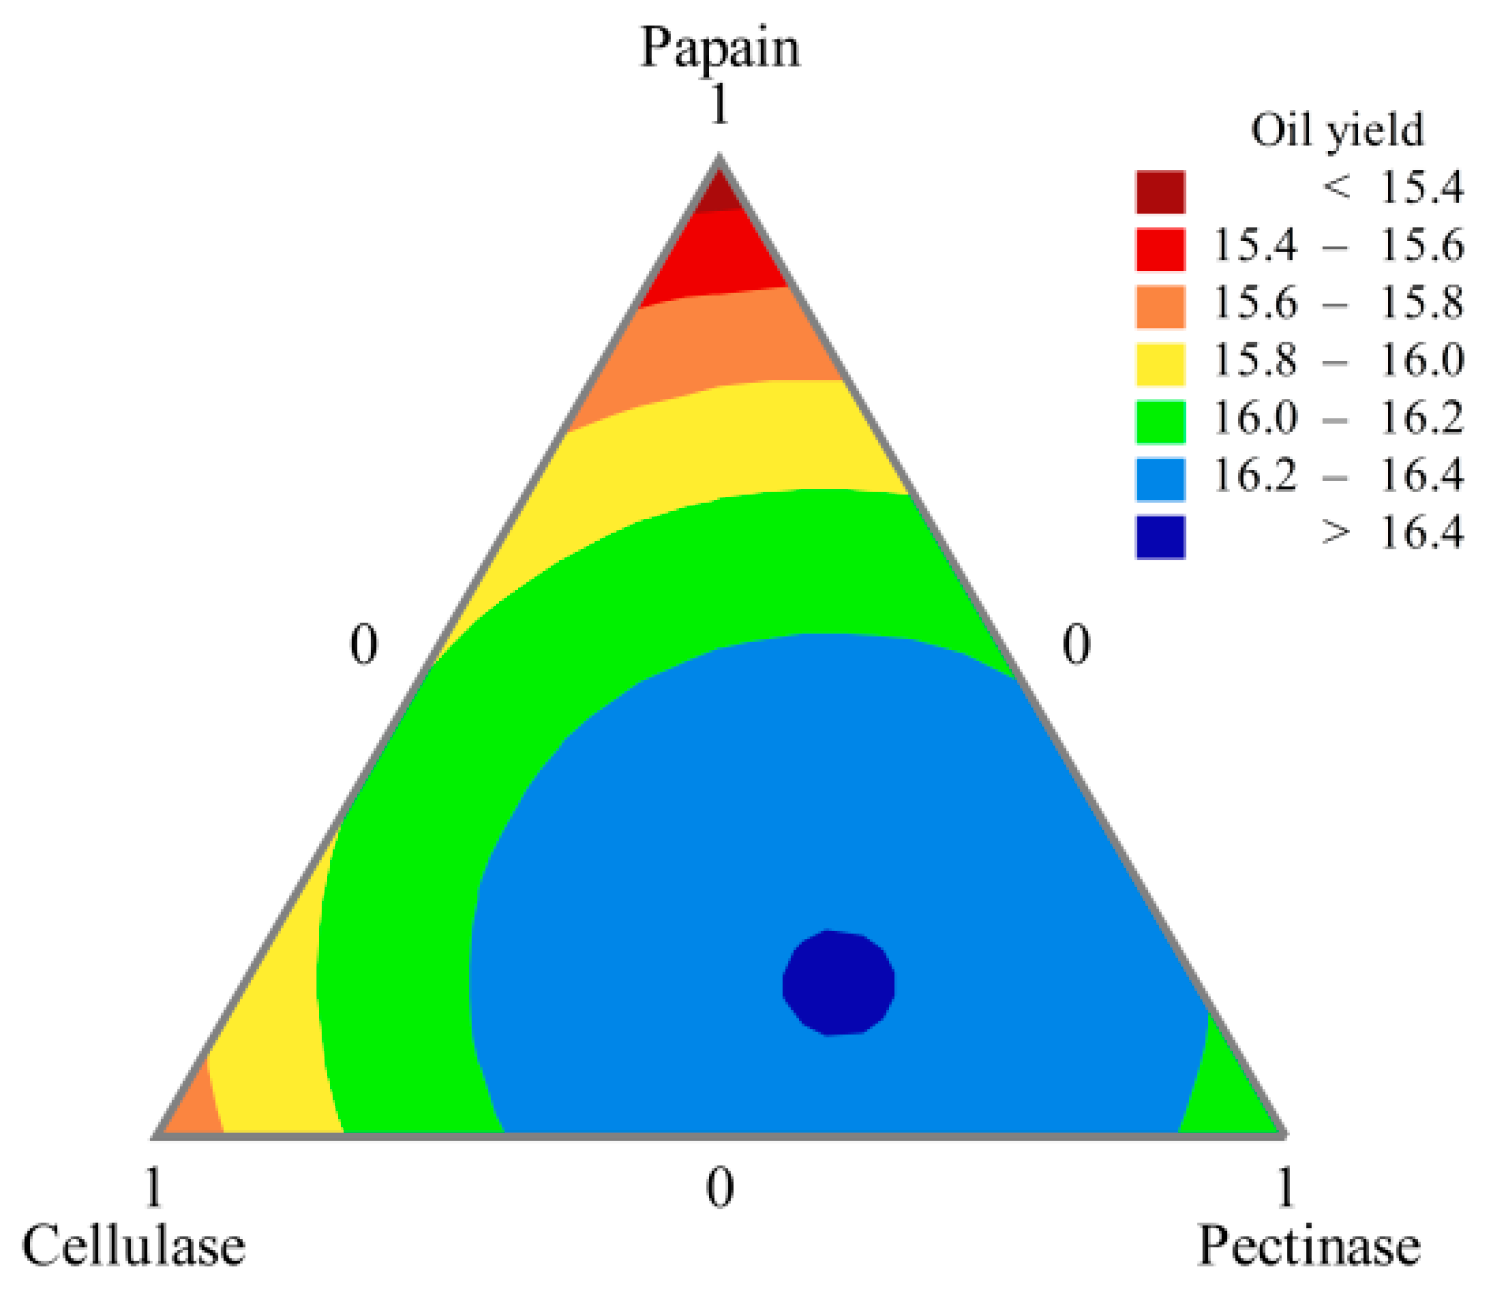
3. Results and Discussion

3.1. Screening of Significant Enzymes Affecting the Oil Yield of Peony Seeds Using PBD

In a first optimization stage, 12 experiments were performed to determine which enzymatic pre-treatment cocktail constituents significantly influenced oil yield of aqueous enzymatic extract from peony seed. The effects of cocktail enzyme components on the oil yield were evaluated (Table 1). Table 4 shows the results of the ANOVA performed to test the significance of the developed model. Significance of each enzyme was checked using p-value. The first-order model equation for predicted oil yield with the enzymes, regardless of their significance, was as follows:
Y = 13.7317 + 0.6233x1 + 0.2517x2 + 0.1050x3 + 0.0283x4 + 0.0000x5 + 0.7450x6 + 0.1400x7
where Y is the predicted oil yield; and x1, x2, x3, x4, x5, x6, and x7 are the activities of cellulase, papain, β-glucanase, α-amylase, glucoamylase, pectinase, and xylanase, respectively.
The magnitude of the effect on the test index Y (oil yield) was determined from the p-values shown in Table 4. The variables with confidence levels above 95% (p < 0.05) were considered to significantly influence the oil yield. The sequential effect of the factors was explained by a Pareto Chart (Figure 3). The ranking of the variables with the greatest to the least effect on the oil yield was pectinase, cellulase, papain, xylanase, β-glucanase, α-amylase, and glucoamylase. Among these, pectinase, cellulase, and papain had a significant effect on the oil yield, whereas xylanase, β-glucanase, α-amylase, and glucoamylase had no significant effects. Therefore, a mixture design was subsequently adopted to further optimize the ratio of papain, cellulase, and pectinase.

3.2. Mixture Design for Optimizing the Ratio of Enzyme Components

To explore the interaction between papain, cellulase, and pectinase while considering economic costs, the dosages were limited (10 mg/g peony seed). The sum of the mass fraction of these three enzymes was 100%. The mixture design was assessed using oil yield as a response value (evaluation index). The formulation designs and results are shown in Table 2; x1, x2, and x3 are the mass fractions of papain, cellulase, and pectinase, respectively. A quadratic regression was fitted to the experimental data to obtain the following mathematical model:
Y = 15.265x1 + 15.665x2 + 16.072x3 + 2.089x1x2 + 2.024x1x3 + 1.904x2x3
The validity of the regression model was verified through ANOVA, and the effect of interaction among the factors on the model was analyzed. The linear relationship between the dependent and independent variables of the equation was significant. The regression model was significant (p < 0.01), with a coefficient of determination (R2) of 0.9783 and an R2 Adj value of 0.9570. The differences between the two were small, indicating that the model fitted well with the experiment. From the regression equation (Equation (6)), the coefficients of the three primary and three quadratic terms were positive, indicating that both single-use and interactive-use of the three enzymes contributed to the yield of peony seed oil, with the relative magnitudes of contribution ordered pectinase > cellulase > papain. The p-values of the quadratic terms in the model were less than 0.05, indicating that papain, cellulase, and pectinase had significant interactions with each other.
The results in Table 5 were analyzed and contour plots drawn (Figure 4) to screen for the best formulation of the compound enzymes. When the amounts of papain, cellulase, and pectinase were 16.15%, 31.33%, and 52.53%, respectively, the oil yield reached 16.41%. Although the crushed peony seed particles could pass through the 40 mesh sieve, the particle size was large. At this time, the cell structure of peony seeds was intact, and the oleosomes were completely wrapped by the cell wall and cell membrane. Therefore, it was difficult for the oil to escape the plant cells, resulting in a low yield. The plant cell wall is mainly composed of polysaccharide polymers such as cellulose, hemicellulose, and pectin. After treatment with the compound enzyme solution, enzymes such as pectinase and cellulase hydrolyzed part of the cell wall, leading to cell rupture and release of oil [32]. However, it is difficult for β-glucanase, α-amylase and glucoamylase to hydrolyze the plant cell wall. Xylanase is usually in cooperation with xylosidase to be effective, so it is not effective alone. Papain enzyme treatment can lead to protein hydrolysis, which is probably involved in the breakdown of the protein network of the cotyledon cells and in the protein (oleosin)-based membranes that surround the lipid bodies, leading to a higher oil yield [33,34].

3.3. Supercritical CO2 Extraction for Further Oil Extraction from AER

The AER contains a certain amount of oil. Therefore, supercritical CO2 extraction was applied for further extraction. In supercritical CO2 extraction, the main factors affecting the extraction rate are pressure, temperature, and time of extraction [35]. Therefore, a five-coded level CCD for temperature, pressure, and time was employed to fully explore response surface sub-regions near the optimum. Table 3 shows the design matrix with different combinations of these variables and their corresponding experimental responses. The data were modeled with a second-order polynomial equation, and the following model equation using the coded factors was derived for oil yield:
Y =−97.30 − 1.646x1 + 2.123x2 − 0.78x3 − 0.01780x12 − 0.01865x22 − 0.401x32 + 0.00150x1x2 + 0.0160x1x3 + 0.0210x2x3
where Y is the predicted oil yield; and x1, x2, and x3 are actual values of temperature, pressure, and extraction time, respectively.
Table 6 shows the ANOVA results of the quadratic model from Equation (7). The model p-value is <0.001, which indicates that the relationship between Y and the regression equation is highly significant. The p-value corresponding to “the lack of fit” (0.235) is >0.05, which indicates that the obtained regression equation is a good fit, with high experimental confidence and accuracy. Thus, the regression equation provides an accurate simulation that can be used to analyze, predict, and optimize the experimental conditions for supercritical CO2 extraction.
In the RSM test analysis, three-dimensional (3D) response surface and two-dimensional (2D) contour line plots were used to characterize the regression functions among the different influencing factors [36]. The 3D response surface plots (Figure 5) depict visual interaction between the three variables. Figure 5a shows circularity, indicating that the interaction between temperature and pressure was insignificant [37]. The 3D response surface graph (Figure 5b) shows a convex response surface, which suggests that the oil yield increased with temperature and pressure until a certain point and then decreased. It is well-known that temperature has a dual effect on supercritical CO2 extraction [38]. Generally, a higher temperature accelerates mass transfer and increases the extraction rate; however, increasing the temperature can decrease the solvent density and reduce the yield within the critical pressure range [39]. Our results showed a larger effect of extraction temperature on yield, with a subsequent increase in oil yield observed with increasing extraction temperature, followed by a maximum value at approximately 49 °C.
Figure 5c,d show the 3D response surfaces and contour line plots of peony seed oil yields plotted under different extraction times and temperature conditions at a fixed pressure. The oil yield did not vary considerably within the extraction time of 1–2 h, which is similar to the results shown in Figure 5e,f. The effect of extraction time on oil yield was smaller, whereas the effect of pressure was greater, with the yield gradually increasing with increasing pressure. However, the oil yield did not continue to increase but slightly decreased after the pressure exceeded 60 MPa, indicating that a further increase in pressure did not increase the yield. According to the canonical analysis, the results predicted by the model showed that the maximum oil yield can be achieved when the temperature, pressure, and time were 49.41 °C, 59.75 Mpa, and 1.58 h, respectively. The maximum predicted oil yield was 6.30%.

3.4. Analysis of Fatty Acid Composition of Peony Seed Oil Extracted Using Different Methods

The fatty acid composition of peony seed oil obtained by the different methods was analyzed using GC-MS. The results are shown in Table 7.
Peony seed oil extracts obtained using the two different methods were rich in unsaturated fatty acids (approximately 90%), which are mainly α-linolenic acid (almost 40%) followed by linoleic acid and oleic acid. The oleic and linoleic acid contents of peony seed oil extracted using the aqueous enzymatic method were slightly lower, whereas the α-linolenic acid content was slightly higher than that of the oil extracted using the supercritical CO2 extraction method. Overall, the differences in the fatty acid composition of peony seed oil extracted using the two different methods were small. The proportion of α-linolenic acid in peony seed oil was more than 37%, and the ratio of α-linolenic acid to linoleic acid ranged 1:1.10–1:1.22. These ratios are easily absorbed by the human body, with a proven high nutritional value for the prevention of inflammation and obesity [40].

3.5. Comparison of Physicochemical Properties with Commercial Peony Seed Oil

Peony seed oil extracted by the two methods was mixed together, and its physicochemical properties were measured and compared with those of commercial peony seed oil (obtained using the organic solvent leaching method). The results are shown in Figure 6. The relative density and iodine value of the experimentally prepared blended oil were higher than the commercial oil, whereas the acid and peroxide values were slightly lower. The higher relative density of the blended oil indicates its higher content of unsaturated fatty acids [41]. The iodine value is an important indicator of the degree of unsaturation in vegetable oils [42]. Thus, the content of unsaturated fatty acids is higher in the blended oil than that of the commercial peony seed oil extracted using organic solvent leaching.
The extraction of peony seed oil using the optimized aqueous enzymatic method reduced the required dosage of enzymes, and the supercritical extraction technique can further extract oil from the AER. Compared with the work of Song et al. [5] the compounded enzyme solution significantly reduced the amount of required enzyme; however, it was necessary to dry the AER, which incurred some additional cost. Notably, some enzymes remain active and can function in supercritical fluids [43], indicating that the enzymatic reactions and extractions can be integrated into a single step, which warrants further investigation.

4. Conclusions

A two-step method was used to extract edible oil from peony seeds. First, peony seed oil was extracted using an aqueous enzymatic method. Pectinase, cellulase, and xylanase had positive effects on peony seed oil extraction using the aqueous enzymatic method with optimal proportions of 16.15%, 31.33%, and 52.53%, respectively, at an enzyme dosage of 10 mg/g peony seed. These conditions provided an oil yield of 16.41%. We subsequently extracted a further yield of 6.30% from the AER using supercritical CO2 extraction over 1.58 h at 49.41 °C and 59.75 Mpa. Notably, the fatty acid compositions of the oils extracted using the two methods were comparable. Compared with commercial peony seed oil extracted using organic solvent leaching, the oil prepared in this study also shows better relative density and iodine values.

Author Contributions

Conceptualization, H.Q., X.H. and J.S.; methodology, H.Q., Y.H. and F.L.; software D.C.; validation, F.L., X.H. and J.S.; formal analysis, Y.H. and D.C.; investigation, H.Q. and X.H.; resources, J.S. and H.Q.; data curation, Y.H. and X.H.; writing—original draft preparation, H.Q. and X.H.; writing—review and editing, J.S.; visualization, D.C. and X.H.; supervision, Y.H. and J.S.; project administration, Y.H.; funding acquisition, H.Q. and X.H. All authors have read and agreed to the published version of the manuscript.

Funding

This research was funded by the Jining Key Research and Development Plan (2019NYNS014, 2020NYNS017, 2020NYNS020) and the Shandong Provincial Natural Science Foundation (ZR2019MC066).

Data Availability Statement

Not applicable.

Acknowledgments

We would like to thank the Jining Key Laboratory of Bioresource Development and Utilization, Jining University, for the use of its facility.

Conflicts of Interest

The authors declare no conflict of interest.

References

  1. Peng, H.; Wang, D.; Peng, D.; Huang, L. Research and investigation on original plants of medicinal moutan. China J. Chin. Mater. Med. 2017, 42, 1632–1636. [Google Scholar]
  2. Yang, S.; Liu, X.; He, J.; Liu, M. Insight into seasonal change of phytochemicals, antioxidant, and anti-aging activities of root bark of Paeonia suffruticosa (cortex moutan) combined with multivariate statistical analysis. Molecules 2021, 26, 6102. [Google Scholar] [CrossRef] [PubMed]
  3. Xiu, Y.; Wu, G.; Tang, W.; Peng, Z.; Bu, X.; Chao, L.; Yin, X.; Xiong, J.; Zhang, H.; Zhao, X.; et al. Oil biosynthesis and transcriptome profiles in developing endosperm and oil characteristic analyses in Paeonia ostii var. Lishizhenii. J. Plant Physiol. 2018, 228, 121–133. [Google Scholar] [CrossRef] [PubMed]
  4. Gao, L.; Li, Y.; Wang, Z.; Sun, G.; Qi, X.; Mo, H. Physicochemical characteristics and functionality of tree peony (Paeonia suffruticosa Andr.) seed protein. Food Chem. 2018, 240, 980–988. [Google Scholar] [CrossRef] [PubMed]
  5. Song, Y.; Zhang, W.; Wu, J.; Admassu, H.; Liu, J.; Zhao, W.; Yang, R. Ethanol-assisted aqueous enzymatic extraction of peony seed oil. J. Am. Oil Chem. Soc. 2019, 96, 595–606. [Google Scholar] [CrossRef]
  6. Kwek, E.; Zhu, H.; Ding, H.; He, Z.; Hao, W.; Liu, J.; Ma, K.Y.; Chen, Z.Y. Peony seed oil decreases plasma cholesterol and favorably modulates gut microbiota in hypercholesterolemic hamsters. Eur. J. Nutr. 2022, 61, 2341–2356. [Google Scholar] [CrossRef] [PubMed]
  7. Li, H.; Kang, S.; Sun, L. A study on the evaluation of polyenoic vegetable oils and their female health benefits based on time series analysis model: The case of peony seed oil. J. Healthc. Eng. 2022, 2022, 3127698. [Google Scholar] [CrossRef]
  8. Su, J.; Ma, C.; Liu, C.; Gao, C.; Nie, R.; Wang, H. Hypolipidemic activity of peony seed oil rich in alpha-linolenic, is mediated through inhibition of lipogenesis and upregulation of fatty acid beta-oxidation. J. Food Sci. 2016, 81, H1001–H1009. [Google Scholar] [CrossRef] [PubMed]
  9. Rani, H.; Sharma, S.; Bala, M. Technologies for extraction of oil from oilseeds and other plant sources in retrospect and prospects: A review. J. Food Process Eng. 2021, 44, e13851. [Google Scholar] [CrossRef]
  10. Mwaurah, P.W.; Kumar, S.; Kumar, N.; Attkan, A.K.; Panghal, A.; Singh, V.K.; Garg, M.K. Novel oil extraction technologies: Process conditions, quality parameters, and optimization. Compr. Rev. Food Sci. Food Saf. 2020, 19, 3–20. [Google Scholar] [CrossRef] [PubMed] [Green Version]
  11. Liu, J.; Gasmalla, M.A.A.; Li, P.; Yang, R. Enzyme-assisted extraction processing from oilseeds: Principle, processing and application. Innov. Food Sci. Emerg. Technol. 2016, 35, 184–193. [Google Scholar] [CrossRef]
  12. Baby, K.C.; Ranganathan, T.V. Effect of enzyme pre-treatment on extraction yield and quality of cardamom (Elettaria cardamomum Maton.) volatile oil. Ind. Crop. Prod. 2016, 89, 200–206. [Google Scholar] [CrossRef]
  13. Rosenthal, A.; Pyle, D.L.; Niranjan, K. Aqueous and enzymatic processes for edible oil extraction. Enzym. Microb. Technol. 1996, 19, 402–420. [Google Scholar] [CrossRef]
  14. Wei, G.; Zhang, Z.; Fu, D.; Zhang, Y.; Zhang, W.; Zu, Y.; Zhang, L.; Zhang, Z. Enzyme-assisted solvent extraction of high-yield Paeonia suffruticosa Andr. Seed oil and fatty acid composition and anti-alzheimer’s disease activity. J. Oleo Sci. 2021, 70, 1133–1146. [Google Scholar] [CrossRef] [PubMed]
  15. Pourmortazavi, S.M.; Hajimirsadeghi, S.S. Supercritical fluid extraction in plant essential and volatile oil analysis. J. Chromatogr. A 2007, 1163, 2–24. [Google Scholar] [CrossRef]
  16. Durante, M.; Ferramosca, A.; Treppiccione, L.; Di Giacomo, M.; Zara, V.; Montefusco, A.; Piro, G.; Mita, G.; Bergamo, P.; Lenucci, M.S. Application of response surface methodology (rsm) for the optimization of supercritical CO2 extraction of oil from pate olive cake: Yield, content of bioactive molecules and biological effects in vivo. Food Chem. 2020, 332, 127405. [Google Scholar] [CrossRef]
  17. Elaguel, A.; Kallel, I.; Gargouri, B.; Ben Amor, I.; Hadrich, B.; Ben Messaoud, E.; Gdoura, R.; Lassoued, S.; Gargouri, A. Lawsonia inermis essential oil: Extraction optimization by rsm, antioxidant activity, lipid peroxydation and antiproliferative effects. Lipids Health Dis. 2019, 18, 196. [Google Scholar] [CrossRef] [PubMed] [Green Version]
  18. Esmaeilzadeh Kenari, R.; Dehghan, B. Optimization of ultrasound-assisted solvent extraction of hemp (Cannabis sativa L.) seed oil using rsm: Evaluation of oxidative stability and physicochemical properties of oil. Food Sci. Nutr. 2020, 8, 4976–4986. [Google Scholar] [CrossRef]
  19. Plackett, R.L.; Burman, J.P. The design of optimum multifactorial experiments. Biometrika 1946, 33, 305–325. [Google Scholar] [CrossRef]
  20. Scheffé, H. Experiments with mixtures. J. R. Stat. Soc. Ser. B Stat. Methodol. 1958, 20, 344–360. [Google Scholar] [CrossRef]
  21. Box, G.E.P.; Wilson, K.B. On the experimental attainment of optimum conditions. J. R. Stat. Soc. Series B Stat. Methodol. 1951, 13, 1–45. [Google Scholar] [CrossRef]
  22. El-Shora, H.M.; El-Sharkawy, R.M.; Khateb, A.M.; Darwish, D.B. Production and immobilization of beta-glucanase from Aspergillus niger with its applications in bioethanol production and biocontrol of phytopathogenic fungi. Sci. Rep. 2021, 11, 21000. [Google Scholar] [CrossRef]
  23. Mandels, M.; Andreotti, R.; Roche, C. Measurement of saccharifying cellulase. Biotechnol. Bioeng. Symp. 1976, 6, 21–33. [Google Scholar]
  24. Zarafeta, D.; Galanopoulou, A.P.; Leni, M.E.; Kaili, S.I.; Chegkazi, M.S.; Chrysina, E.D.; Kolisis, F.N.; Hatzinikolaou, D.G.; Skretas, G. Xyndz5: A new thermostable gh10 xylanase. Front. Microbiol. 2020, 11, 545. [Google Scholar] [CrossRef] [Green Version]
  25. El Enshasy, H.A.; Elsayed, E.A.; Suhaimi, N.; Malek, R.A.; Esawy, M. Bioprocess optimization for pectinase production using Aspergillus niger in a submerged cultivation system. BMC Biotechnol. 2018, 18, 71. [Google Scholar] [CrossRef] [Green Version]
  26. Okolo, B.N.; Ezeogu, L.I.; Mba, C.N. Production of raw starch digesting amylase by Aspergillus niger grown on native starch sources. J. Sci. Food Agric. 1995, 69, 109–115. [Google Scholar] [CrossRef]
  27. Nayab, D.E.; Akhtar, S.; Bangash, N.; Nisa, W.U.; Hayat, M.T.; Zulfiqar, A.; Niaz, M.; Qayyum, A.; Syed, A.; Bahkali, A.H.; et al. Production of glucoamylase from novel strain of Alternaria alternata under solid state fermentation. Biomed Res. Int. 2022, 2022, 2943790. [Google Scholar] [CrossRef] [PubMed]
  28. Miller, G.L. Use of dinitrosalicylic acid reagent for determination of reducing sugar. Anal. Chem. 1959, 31, 426–428. [Google Scholar] [CrossRef]
  29. Khaparde, S.S.; Singhal, R.S. Chemically modified papain for applications in detergent formulations. Bioresour. Technol. 2001, 78, 1–4. [Google Scholar] [CrossRef]
  30. Bradford, M.M. A rapid and sensitive method for the quantitation of microgram quantities of protein utilizing the principle of protein-dye binding. Anal. Biochem. 1976, 72, 248–254. [Google Scholar] [CrossRef] [PubMed]
  31. Li, S.; Yuan, R.; Chen, L.; Wang, L.; Hao, X.; Wang, L.; Zheng, X.; Du, H. Systematic qualitative and quantitative assessment of fatty acids in the seeds of 60 tree peony (Paeonia section Moutan DC.) cultivars by gc-ms. Food Chem. 2015, 173, 133–140. [Google Scholar] [CrossRef] [PubMed]
  32. De Leo, P.; Traversi, D.; Miceli, A. Synergic effects of cellulase, pectinase and hemicellulase on cell wall hydrolysis. Food Hydrocoll. 1991, 5, 223–224. [Google Scholar] [CrossRef]
  33. Latif, S.; Anwar, F. Aqueous enzymatic sesame oil and protein extraction. Food Chem. 2011, 125, 679–684. [Google Scholar] [CrossRef]
  34. Latif, S.; Anwar, F. Effect of aqueous enzymatic processes on sunflower oil quality. J. Am. Oil Chem. Soc. 2009, 86, 393–400. [Google Scholar] [CrossRef]
  35. Sahena, F.; Zaidul, I.S.M.; Jinap, S.; Karim, A.A.; Abbas, K.A.; Norulaini, N.A.N.; Omar, A.K.M. Application of supercritical CO2 in lipid extraction—A review. J. Food Eng. 2009, 95, 240–253. [Google Scholar] [CrossRef]
  36. Ye, C.; Jiang, C. Optimization of extraction process of crude polysaccharides from Plantago asiatica L. By response surface methodology. Carbohydr. Polym. 2011, 84, 495–502. [Google Scholar] [CrossRef]
  37. Muralidhar, R.V.; Chirumamila, R.R.; Marchant, R.; Nigam, P. A response surface approach for the comparison of lipase production by Candida cylindracea using two different carbon sources. Biochem. Eng. J. 2001, 9, 17–23. [Google Scholar] [CrossRef]
  38. Wang, L.; Yang, B.; Du, X.; Yi, C. Optimisation of supercritical fluid extraction of flavonoids from Pueraria lobata. Food Chem. 2008, 108, 737–741. [Google Scholar] [CrossRef]
  39. Liu, J.; Lin, S.; Wang, Z.; Wang, C.; Wang, E.; Zhang, Y.; Liu, J. Supercritical fluid extraction of flavonoids from Maydis stigma and its nitrite-scavenging ability. Food Bioprod. Process. 2011, 89, 333–339. [Google Scholar] [CrossRef]
  40. Simopoulos, A.P. An increase in the omega-6/omega-3 fatty acid ratio increases the risk for obesity. Nutrients 2016, 8, 128. [Google Scholar] [CrossRef] [PubMed] [Green Version]
  41. Haraldsson, G. Separation of saturated/unsaturated fatty acids. J. Am. Oil Chem. Soc. 1984, 61, 219–222. [Google Scholar] [CrossRef]
  42. Ackman, R.G. Empirical relationships between iodine value and polyunsaturated fatty acid content in marine oils and lipids. J. Am. Oil Chem. Soc. 1966, 43, 385–389. [Google Scholar] [CrossRef]
  43. Knez, Ž. Enzymatic reactions in subcritical and supercritical fluids. J. Supercrit. Fluids 2018, 134, 133–140. [Google Scholar] [CrossRef]
Figure 1. Workflow for aqueous enzymatic extraction of peony seed oil.
Agronomy 13 00555 g001
Figure 2. Simplex design plot in amounts.
Agronomy 13 00555 g002
Figure 3. Pareto graph showing the effects of variables (different enzymes) on the peony seed oil extraction rate (alpha = 0.05).
Agronomy 13 00555 g003
Figure 4. Hybrid contour line plot of oil yield (%).
Agronomy 13 00555 g004
Figure 5. Two-dimensional contour plots (A,C,D) and surface three-dimensional diagrams (B,D,F) showing the interaction between temperature, pressure, and time on oil yield.
Agronomy 13 00555 g005
Figure 6. Comparison of physicochemical properties of peony seed oil obtained using different methods.
Agronomy 13 00555 g006
Table 1. Plackett–Burman design (PBD) for screening key enzyme components affecting peony seed oil yield from enzymatic extraction.
Std.x1x2x3x4x5x6x7 Y
CellulasePapainβ-Glucanaseα-AmylaseGlucoamylasePectinaseXylanaseOil Yield
(U/g)(U/g)(U/g)(U/g)(U/g)(U/g)(U/g)(%)
11.5 (+1)400 (−1)600 (+1)10 (−1)100 (−1)6 (−1)300 (+1)13.54
21.5 (+1)600 (+1)400 (−1)15 (+1)100 (−1)6 (−1)200 (−1)13.69
31.0 (−1)600 (+1)600 (+1)10 (−1)150 (+1)6 (−1)200 (−1)12.61
41.5 (+1)400 (−1)600 (+1)15 (+1)100 (−1)9 (+1)200 (−1)14.75
51.5 (+1)600 (+1)400 (−1)15 (+1)150 (+1)6 (−1)300 (+1)13.88
61.5 (+1)600 (+1)600 (+1)10 (−1)150 (+1)9 (+1)200 (−1)15.23
71.0 (−1)600 (+1)600 (+1)15 (+1)100 (−1)9 (+1)300 (+1)14.61
81.0 (−1)400 (−1)600 (+1)15 (+1)150 (+1)6 (−1)300 (+1)12.28
91.0 (−1)400 (−1)400 (−1)15 (+1)150 (+1)9 (+1)200 (−1)13.35
101.5 (+1)400 (−1)400 (−1)10 (−1)150 (+1)9 (+1)300 (+1)15.04
111.0 (−1)600 (+1)400 (−1)10 (−1)100 (−1)9 (+1)300 (+1)13.88
121.0 (−1)400 (−1)400 (−1)10 (−1)100 (−1)6 (−1)200 (−1)11.92
Table 2. Mixtures of three enzymes used for aqueous enzymatic extraction with their corresponding oil yields.
Std.x1x2x3 Y
Papain CellulasePectinaseOil Yield
(%)(%)(%)(%)
11000015.26
20100015.66
30010016.08
45050015.92
55005016.12
60505016.29
733.3333.3333.3316.33
866.6716.6716.6716.05
916.6766.6716.6716.24
1016.6716.6766.6716.40
Table 3. CCD design for three factors affecting supercritical CO2 extraction with assay results.
Std.x1x2x3 Y
TemperaturePressureTimeOil Yield
(°C)(MPa)(h)(%)
145 (−1)55 (−1)1 (−1)5.44
255 (+1)55 (−1)1 (−1)5.16
345 (−1)65 (+1)1 (−1)5.22
455 (+1)651 (−1)4.93
545 (−1)55 (−1)2 (+1)5.41
655 (+1)55 (−1)2 (+1)5.13
745 (−1)65 (+1)2 (+1)5.24
855 (+1)65 (+1)2 (+1)5.27
941.591 (−α)60 (0)1.5 (0)5.26
1058.409 (+α)60 (0)1.5 (0)4.95
1150 (0)51.591 (−α)1.5 (0)5.07
1250 (0)68.409 (+α)1.5 (0)5.02
1350 (0)60 (0)0.6591 (−α)6.02
1450 (0)60 (0)2.3409 (+α)6.14
1550 (0)60 (0)1.5 (0)6.37
1650 (0)60 (0)1.5 (0)6.27
1750 (0)60 (0)1.5 (0)6.41
1850 (0)60 (0)1.5 (0)6.22
1950 (0)60 (0)1.5 (0)6.24
2050 (0)60 (0)1.5 (0)6.20
Table 4. ANOVA for PBD model based on oil yield.
TermEffectCoef.Se Coef.T-Valuep-Value
Constant 13.73170.0614223.640.000
Cellulase1.24670.62330.061410.150.001
Papain0.50330.25170.06144.10.015
β-glucanase0.21000.10500.06141.710.162
α-amylase0.05670.02830.06140.460.668
Glucoamylase0.00000.00000.06140.001.000
Pectinase1.49000.74500.061412.130.000
Xylanase0.28000.14000.06142.280.085
Table 5. ANOVA results of the enzyme mixture designs.
SourceDFSeq SSAdj SSAdj MSF-Valuep-Value
Regression51.068421.0684170.21368337.430.002
Linear20.464180.3584390.17921931.40.004
Quadratic30.604240.6042390.20141335.280.002
Papain × Cellulase10.215890.2209140.22091438.70.003
Papain × Pectinase10.204910.2072880.20728836.310.004
Cellulas × Pectinase10.183430.1834340.18343432.130.005
Residual Error40.022830.0228330.005708
Total91.09125
Table 6. Analysis of estimated regression coefficients for the CCD model equation.
SourceDf.Sum of SquareMean SquareF-Valuep-Value
Model9114.51212.723555.93<0.001
Temperature12.682.680311.780.006
Pressure10.4510.45111.980.189
Time10.3840.38391.690.223
Temperature × Temperature157.86957.8692254.38<0.001
Pressure × Pressure162.99162.9909276.9<0.001
Time × Time12.8752.875112.640.005
Temperature × Pressure10.2410.24121.060.327
Temperature × Time10.2480.24821.090.321
Pressure × Time10.4660.46612.050.183
Lake of fit51.5120.30241.980.235
Pure error50.7630.1525
Cor total19116.786
Table 7. Comparison of the fatty acid content peony seed oil extracted using different methods.
Serial NumberName of Fatty AcidAbbreviation of Fatty AcidAqueous Enzymatic Oil Extraction %Supercritical Oil Extraction %
1Palmitic acid (hexadecanoic acid)Palm acid (C16:0)6.88 ± 0.076.81 ± 0.22
2Stearic acid (octadecanoic acid)Stearic acid (C18:0)2.1 ± 0.022.11 ± 0.02
3Oleic acid (cis-9-octadecenoic acid)Oleic acid (C18:1n9c)25.09 ± 1.1825.26 ± 0.61
4Linoleic acid (cis-9,12-octadecadienoic acid)Linoleic acid (C18:2n6c)25.46 ± 1.2225.48 ± 0.79
5α -linolenic acidLinoleic acid (C18:3n3)39.29 ± 2.1239.16 ± 0.59
6cis-11-eicosenoic acidcis-11-Eicosenoic acid (C20:1)0.34 ± 0.010.32 ± 0.01
Disclaimer/Publisher’s Note: The statements, opinions and data contained in all publications are solely those of the individual author(s) and contributor(s) and not of MDPI and/or the editor(s). MDPI and/or the editor(s) disclaim responsibility for any injury to people or property resulting from any ideas, methods, instructions or products referred to in the content.

