Article

Analysis of Cross-Influence of Microclimate, Lighting, and Soil Parameters in the Vertical Farm

Federal Research Centre “Fundamentals of Biotechnology” of the Russian Academy of Sciences, Leninsky Prospect, 33, Build. 2, 119071 Moscow, Russia
*
Author to whom correspondence should be addressed.
Submission received: 14 July 2023 / Revised: 11 August 2023 / Accepted: 12 August 2023 / Published: 19 August 2023
(This article belongs to the Special Issue Smart Farming Technologies for Sustainable Agriculture)

Abstract

:
Urban vertical farming is an innovative solution to address the increasing demand for food in densely populated cities. With advanced technology and precise monitoring, closed urban vertical farms can optimize growing conditions for plants, resulting in higher yields and improved crop quality. However, to fully optimize closed urban vertical farming systems, research is needed to enhance crop yields and reduce the growing season. The present study is focused on the research of the mutual influence of microclimate parameters, such as temperature, humidity, and carbon dioxide concentration, as well as the spectral composition of light, humidity, and amount of peat in the substrate. The research was conducted within the cultivation of the “Innovator” potato variety at the experimental automated vertical farm of the “Fundamentals of Biotechnology” of the Russian Academy of Sciences. Based on the correlation and Fourier analysis of the dependences of soil moisture and carbon dioxide concentration on time, it is shown that after watering potatoes, there is a 56 h delayed decrease in the concentration of carbon dioxide in the cultivation room, which can be explained by a delayed increase in the intensity of the photosynthesis process. Moreover, a comparison of CO2 dependence on time with the lighting dynamics at the scale of one day indicates the presence of the intrinsic daily biological rhythm of the CO2 absorption rate that does not depend on the external lighting conditions. In addition, by analyzing the dependencies of microclimate parameters and the spectral composition of the lighting over time, it was found that switching on lighting influences the microclimate parameters, which can be explained by the heating of LEDs used for lighting. Moreover, the multiple regression analysis of microclimate parameters and soil moisture showed that an increase in peat content in the substrate leads to a transition from the decisive influence of air humidity on soil moisture to the dominant influence of air temperature. The obtained results reveal the complex mutual influence of the parameters determining the growing conditions within automated closed vertical farms. Consideration of this influence is necessary when optimizing the conditions of vegetation and the development of intelligent plant-growing systems.

1. Introduction

According to the United Nations (UN), on November 15, 2022, the world’s population reached 8 billion people [1]. Now, the world’s population is more than three times larger than in the middle of the twentieth century. Since 1950, about 37 years passed before the human population doubled, exceeding 5 billion inhabitants in 1987. After that, according to experts, it will take more than 70 years for the world’s population to double again, reaching more than 10 billion people by 2059. Thus, steady population growth is currently observed and predicted [2]. There is a significant increase in the urban population. So, according to the UN, in the period from 1950 to 2018, the world’s urban population has more than quadrupled. Experts predict that by 2050, 68 percent of the world’s population will live in cities [3].
The rapid growth of the urban population places new demands on urban food supply systems. The observed effect of urban polarization leads to a reduction in fertile land; since settlements are often surrounded by fertile arable lands, the expansion of built-up areas mainly occurs at the expense of agricultural lands, and it is expected that this process will continue in the near future [4]. In addition, the lands closest to cities, including fertile ones, are being built up for the needs of this city, and the distances between large cities and the remaining fertile agricultural lands are increasing, and, as a result, the delivery time of freshly grown products is also increasing. The observed climate variability also has an impact on crop production. Thus, global warming in the short term has a beneficial effect on the increase in the growing season [5,6]. At the same time, there is a significant negative impact of temperature rise in the long term, such as crop reduction [7,8,9,10]. Also, climate change can prolong the pest development season and change the synchronization between the crop and the pest [11].
Therefore, the variability of climate and other environmental factors makes traditional agriculture a high-risk economic activity, which in turn can lead to a food shortage crisis. In this regard, urban agriculture is a good solution to overcome this crisis.
Vertical farms (city farms) [12] are one of the directions of development in modern urban agriculture. Autonomous urban agricultural production (city farm) is a complex of technologies and means of production of food raw materials in a closed environment with agroclimatic parameters controlled in a fully automatic mode [13]. The closed environment of the city farm allows you to create the most favorable conditions for growing different plant crops, depending on the needs of each species. Such controlled favorable conditions include soil moisture, an optimal temperature regime for the growth and development of the plant, and lighting with different spectral compositions that affect the processes occurring within the vegetation of the plant. As a result, the entire process of plant culture growth becomes fully controllable, which can reduce the time of harvesting and guarantee a stable yield year-round [14]. Such microclimate conditions can be established for a particular type of cultivated plant. The products grown in this type of agricultural production are considered eco-friendly, high-quality, and nutritious because vertical cultivation in closed rooms with a special microclimate allows for avoiding the use of pesticides and chemicals that are used in traditional agriculture and also reduces the time of delivery of products from the garden to the counter because the shelf life and quality of products deteriorate during long-term transportation [15]. An important feature of vertical urban farms is the possibility of obtaining a large amount of harvest year-round, as multi-level cultivation increases yield per unit area, reducing the need for additional land.
However, many costs of city farms—for example, electricity costs—are too high; the opening of vertical farms requires significant investment and is also fraught with a long payback period, which raises the question of the need to identify the optimal scenarios for growing plants that use a minimum amount of expensive resources. Such work requires extensive analysis of the data obtained during the cultivation of the plants. Moreover, an analysis of the obtained results based on biological aspects is required, which is required for the determination of the crop features and the selection of the corresponding optimal conditions for its cultivation within the city farm.
Potatoes are one of the most widely consumed and versatile vegetables in the world. In the 18th and 19th centuries, potatoes became the main source of food across most of Europe [16]. Over the past 60 years, potato production in Asia has increased sixfold, and some countries in Northwest Europe have increased or at least maintained their potato cultivation areas and production over the past decade [17]. Currently, more than one billion people rely on this crop for sustenance, with production exceeding 350 million tons per year [18]. The popularity of this culture is due to the high content of carbohydrates and various nutritional properties [19].
Various external factors affect the growth and yield of potatoes. Potatoes are one of the most sensitive crops to water stress, whether it is a deficit or excess of soil moisture [20]. A short-term water deficit negatively impacts the growth and development of potatoes, especially during sprouting and tuber enlargement, and also leads to stomatal closure, which raises leaf temperature and reduces carbon dioxide diffusion in leaves, consequently decreasing photosynthesis [21]. Another factor, carbon dioxide (CO2), is beneficial for potatoes as it increases the rate of photosynthesis, accelerating tuber swelling [22]. Furthermore, simultaneous and appropriate increases in CO2 levels and temperature can promote the balanced development of source and sink organs and have a positive effect on the yield and quality of potatoes [23]. An increase in air temperature during the vegetative phase can lead to physiological wilting and a decrease in photosynthetic activity, while an increase in temperature during the reproductive phase can result in a decrease in tuber size and a slower rate of tuber formation [24]. As for lighting, the blue light spectrum increases leaf thickness and the thickening of the upper epidermis, palisade tissue, and spongy tissue. Both red and blue light spectra lead to a reduction in overall photosynthetic rates and soluble sugar content, but the starch content slightly increased in the red light treatment and decreased in the blue light treatment [25]. Other studies stated that increasing light intensity and the percentage of far-red light in the spectrum increased the number of tubers [26], and 100% blue LED lights improves the dry weight of the largest tuber but reduces the number of tubers per seedling [27]. White light contributes to the shift of biomass from tubers to leaves, increasing the leaf fresh/dry weight of the leaf matter and reducing the tuber fresh/dry mass of tuber matter compared to blue and red light [28].
The substrate employed significantly influences the plant growth process as well. It facilitates the acquisition of essential mineral nutrition [29] by plants through a variety of components [30], while also regulating the appropriate levels of moisture and air exchange. One of the frequently used organic components in substrate is peat, which enhances the soil’s structural and physiological properties [31]. This, in turn, improves its water and air permeability, leading to better nutrient uptake by plants as dissolved nutrients in water become available.
In connection with this, the present paper presents an analysis of the mutual influence of microclimate, lighting, and soil parameters in the automated closed city farm. The analysis data were recorded during the growing season of potatoes of the “Innovator” variety, cultivated in the innovative city farm of the research center “Fundamentals of Biotechnology” of the Russian Academy of Sciences. Below the article is a description of the growing conditions on the city farm, as well as the results of the analysis. The scientific novelty of this research consists of the analysis of the influence of microclimatic parameters on humidity, especially with the use of the regression analysis method, which has not been carried out before.

2. Materials and Methods

The experimental data were collected at the city farm of the Research Center “Fundamental Biotechnology Foundations” of the Russian Academy of Sciences. From 20 September to 9 December 2021, potato (variety “Innovator”) was cultivated. The potato cultivation took place on the city farm, which consisted of 5 levels of shelves. Each shelf held 24 containers (a volume of 18 L with a tray of 9 L), where each container had 15 minitubers planted. Minituber sizes were 15–20 mm, and their weights were 1.5–3 g. Figure 1 shows the structure of part of the city farm.
During the vegetation period, capacitance moisture sensors calibrated for air (0%) and tap water (100%) were installed in the substrate of each container to measure the relative humidity with 3% accuracy. Furthermore, sensors installed in city agricultural facilities monitor microclimate conditions, including carbon dioxide concentration, air humidity, and temperature.
Containers were filled with a substrate consisting of a mixture of universal soil (high peat, low peat, sand, dolomite flour, complex mineral fertilizer with microelements: nitrogen—350 mg/kg; phosphorus—400 mg/kg; potassium—500 mg/kg; pH—6–7), neutralized high peat (ash content—not exceeding 30%; moisture—not exceeding 65%; degree of peat decomposition—not exceeding 35%; pH less than 5.5), and expanded vermiculite (BBF-4 according to GOST 12865-67) with a total volume of 16 L. The experiment involved different amounts of peat in the substrate. Table 1 presents the volumetric ratio of the substrate component depending on the amount of peat used. The substrate base for cultivation was chosen based on the purpose of using a composition that is similar to natural. The amounts of 1, 2, 4, and 8 L of peat in the substrate were selected to provide a logarithmic scale of dependencies on the volume of peat in the experiment, which allows observation of the effect of the peat volume in a wide range. The volume ratios of the substrate components shown in Table 1 were chosen so that the total volume of the substrate in each container was the same under all selected volumes of peat. This was important because the vertical farm geometry was designed in such a way as to use a certain volume of peat (16 L).
The containers were equipped with a controllable LED lighting system that allows the adjustment of intensity, spectrum, duration, and automatic reproduction of the corresponding lighting algorithm. In order to create the desired light spectrum, a set of three types of LEDs was used: blue (420–480 nm), white (420–740 nm), and red (620–680 nm). During the experiment, five different lighting scenarios were implemented by varying the power combinations of these LEDs. The intensity of the blue LEDs was 30% of the total light intensity of PAR, the intensity of the white LEDs was 70% of the total light intensity of PAR and the intensity of the red LEDs was 50% of the total light intensity of PAR, which remains relatively uniform (220–300 µmol/(m2⋅s)) during cultivation. The lighting conditions are presented in Table 2.
As a result, sensors recorded data on soil moisture, air humidity, temperature, and carbon dioxide. One of the options to detect correlations between two or more indices is the Fourier transformation. This mathematical operation transforms a time domain function into a frequency component. Hence, the same pattern of frequency growth and decline can be detected during the same period. The first part of this study applied the fast Fourier transform, represented by Equation (1) to each of these dependencies [32]:
X k = n = 0 N 1 x n e j 2 π k n N ,   ( k = 0,1 , ,   N 1 )
After detecting matches in dependencies with the same period as the analyzed dependencies, next step applied the cross-correlation function (2) [33]:
R x y τ = 1 T 0 T x t τ y t d t
The second part of the study describes the results of regression analysis. Random forest regression implemented in the Python library Scikit-learn was chosen as a regression model, and 100 trees were trained with different subsets of the dataset and averaged. The division quality was measured with the mean square error function, which serves as a feature selection criterion and minimizes the loss of L2 using the average of each terminal node. Measurements such as R2 (3), MAE (4), MSE (5), and MAPE (6) were used to evaluate the quality of trained regression models [34].
R 2 = 1 i = 1 m X i Y i 2 i = 1 m Y ¯ Y i 2 ,
M A E = 1 m i = 1 m X i Y i ,
M S E = 1 m i = 1 m X i Y i 2 ,
M A P E = 1 m i = 1 m Y X i Y i .

3. Results and Discussion

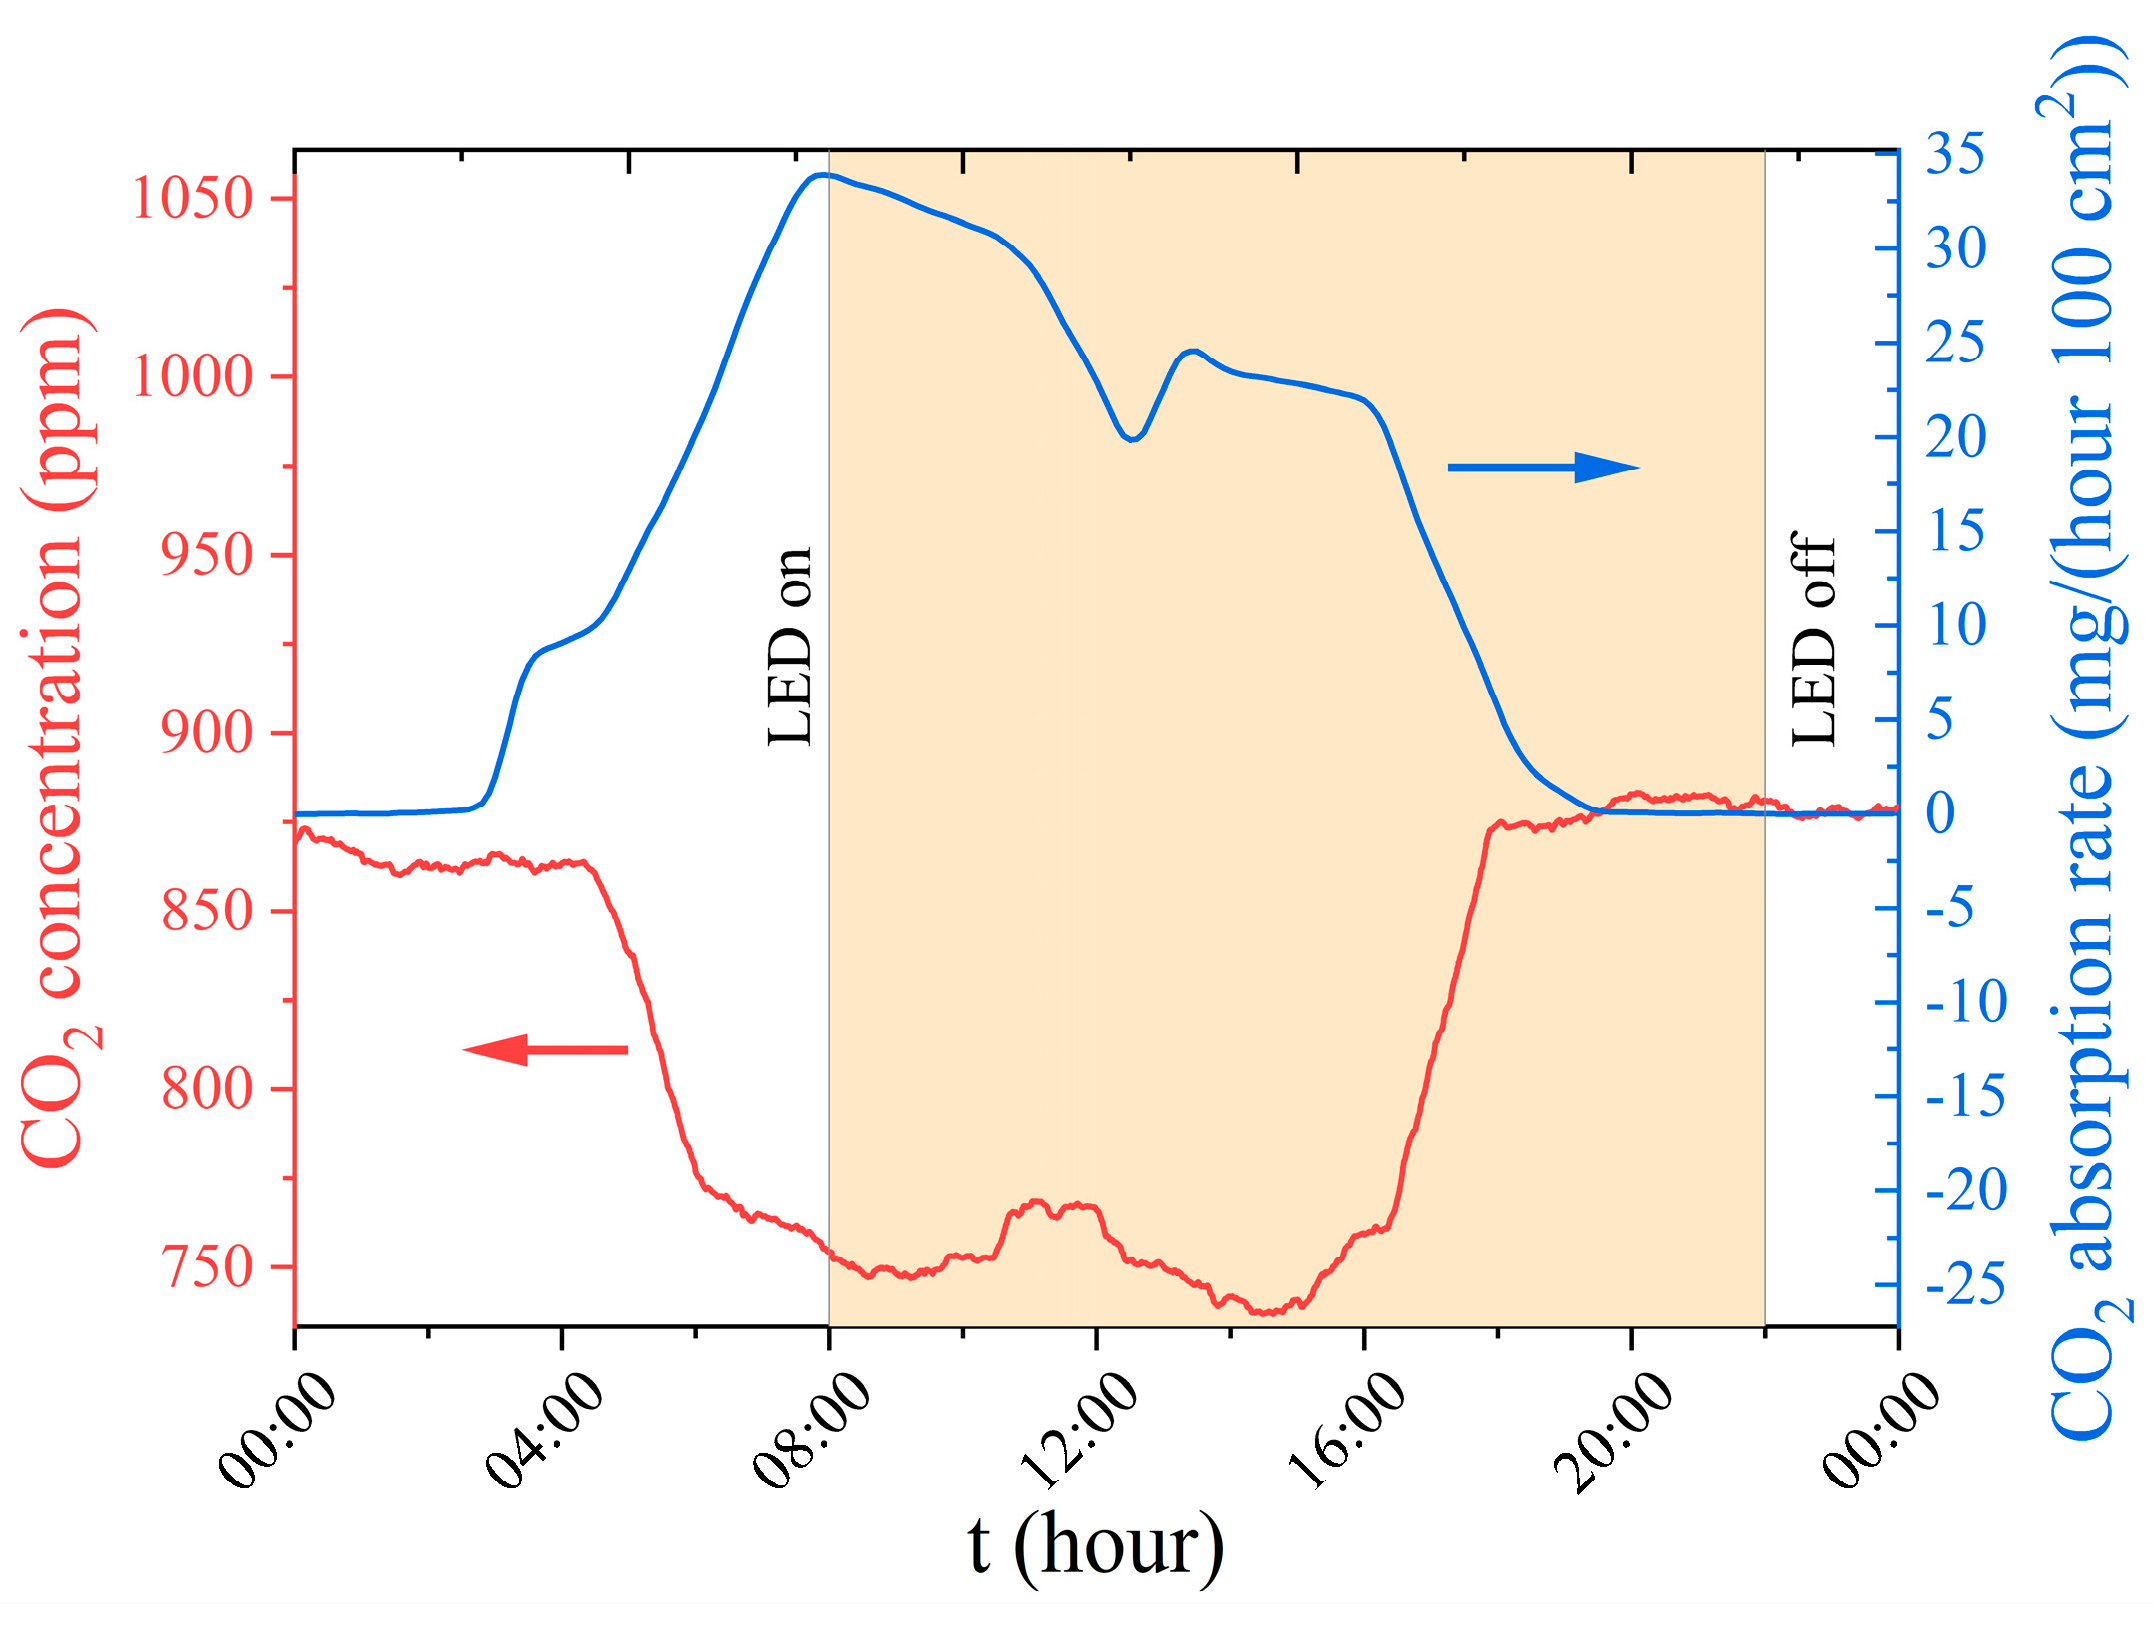
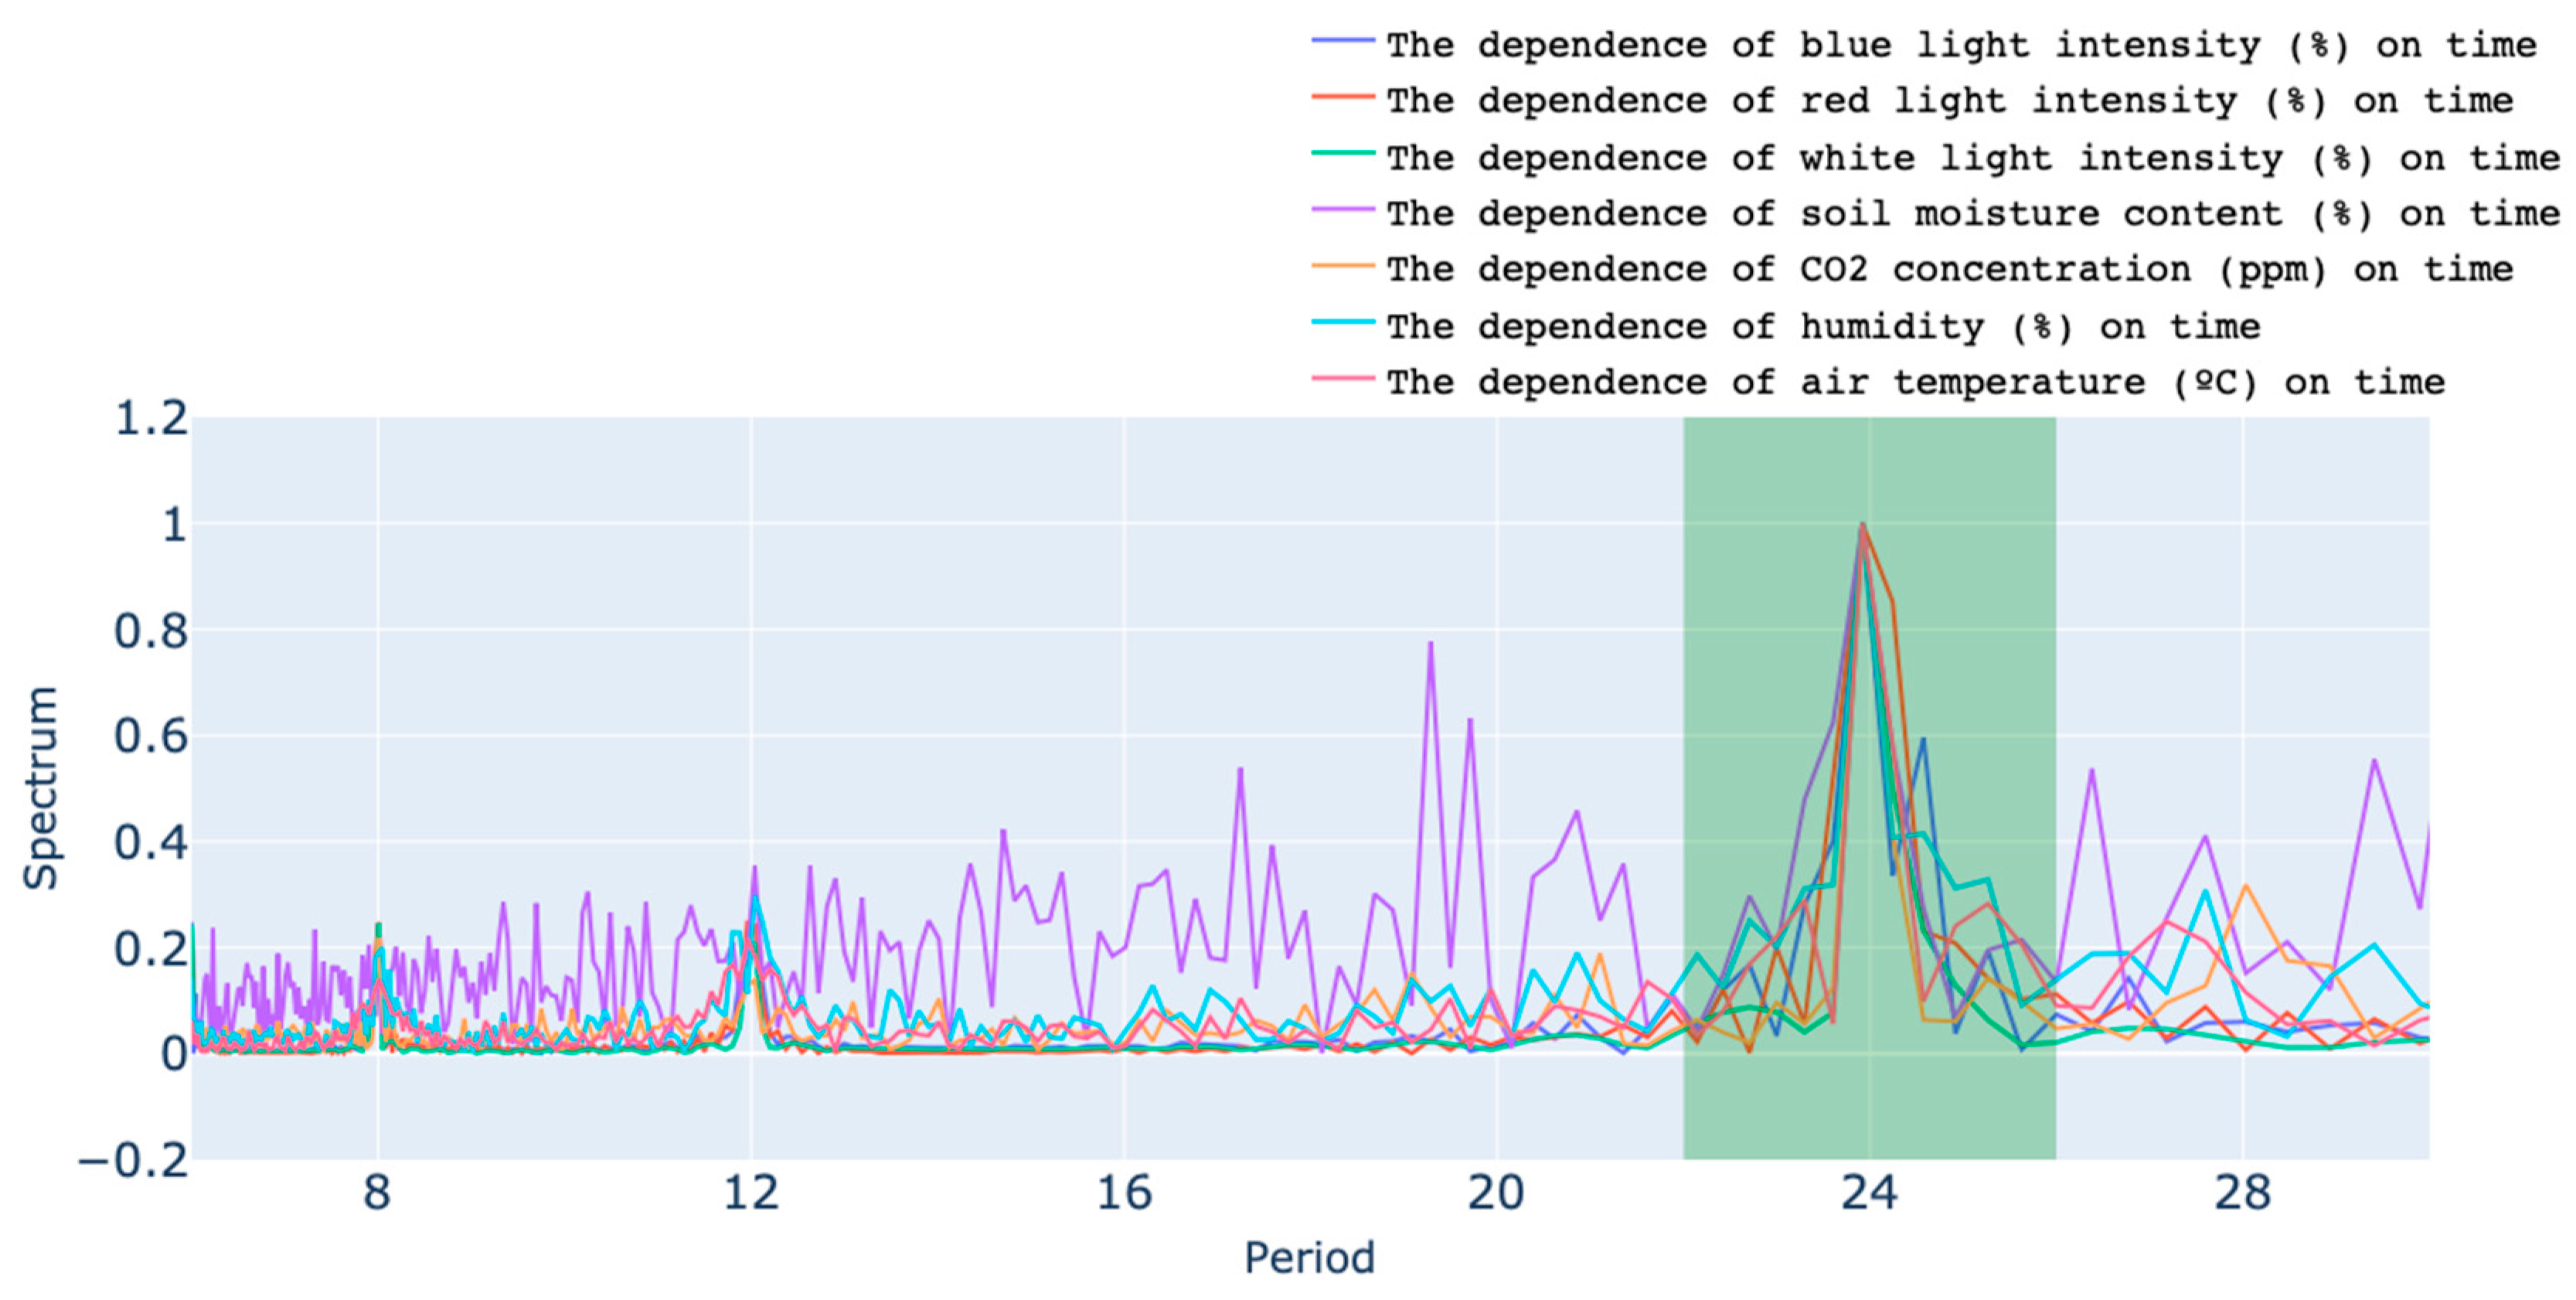
3.1. Analysis of the Dependence of Soil Moisture Content and Carbon Dioxide Concentration on Time

The dependence of soil moisture on time is reflected in plant irrigation and water absorption processes, and the dependence of atmospheric carbon dioxide concentrations on time is influenced by plant CO2 absorption processes in the context of other factors. Since H2O and CO2 are involved in the photosynthesis process, soil moisture and CO2 concentrations in the air should be linked. Consequently, the aim of the analysis is to reveal the correlation between soil moisture content and time dependence on carbon dioxide concentrations.
Figure 2a depicts the dependence of soil humidity on time. This dependence shows a series of almost equidistant extremes. The maximum local dependence corresponds to the moment of plant irrigation. After irrigation, soil moisture decreases, indicating the process of plant water absorption. Therefore, the relationship between soil moisture and time reflects the irrigation process and plant absorption of soil water. Water and carbon dioxide, the concentration of which is shown in Figure 2b, are involved in the photosynthesis process. This suggests that there should be a correlation between the dependence of these two quantities on time.
The experimental dependencies shown in Figure 2 reflect the dynamics of soil humidity content and CO2 concentrations, and because they are influenced by other factors (temperature and air humidity fluctuation, exchange of CO2 with the outer environment), band-pass Fourier filters are applied to the dependencies obtained before correlation analysis, leaving only a part of the dependencies associated with photosynthesis.
The Fourier spectrum of the dependence on soil moisture content and CO2 concentrations over time is shown in Figure 3a. As shown in the figure, the spectrum shows peaks indicating the existence of periodic processes that affect considered dependency. Each peak corresponds to a specific factor. The most prominent peak in the 24 h period is explained by daily changes in the temperature, humidity, and CO2 emissions outside the farm.
A band-pass Fourier filter was carried out in the range of 74 to 217 h to select a signal related to plant irrigation and the associated activation of the photosynthesis process. This range was chosen because when counting the distance between the peak of the plant irrigation (Figure 2a), the minimum time between the irrigation was about 74 h and the maximum time between the irrigation was about 217 h. The comparison of the initial moisture dependence with filtered soil over time is shown in Figure 3b, confirming that the Fourier filter actually left peaks that matched watering. Both dependences of soil moisture content and CO2 concentration on time were filtered in the obtained range (the figure is presented in Appendix A (Figure A1)).
The cross-correlation function was used to reflect the relationship between soil moisture content and CO2 concentration, and to determine delay values more accurately. The best match of the filtered signals occurs with a 55.8 h shift (see Appendix A, Figure A2). The correlation coefficient, in this case, is 0.42, which indicates moderate correlation based on the Chaddock scale [35]. Figure 4 demonstrates that there is an overlap of nine peaks of the two dependencies on one another at the discovered delay value when the time axis is shifted.
The process of photosynthesis in plants [36], which is represented by the reaction (7), can account for the observed concurrence of peaks in Figure 4 when the dependence of CO2 concentration is shifted by 56 h to the left.
s u n l i g h t + n H 2 O + n C O 2 C H 2 O n + n O 2 .
Since the peaks indicated in Figure 4 considering the time shift correspond to the maximum values of the variables considered, the dependencies presented in Figure 4 actually show an increase in carbon dioxide concentration in the room, lagging behind the watering moments. Plant watering that corresponds to a rise in soil moisture causes a subsequent reduction in CO2 concentration (as shown by the peaks matching under shifting by 55.8 h in Appendix A, Figure A1). The process of photosynthesis then slows down as the water absorption process comes to an end, and the amount of carbon dioxide in the atmosphere rises. The experimental data show alternating peaks in soil moisture and CO2 concentration as the watering cycles are repeated (see Figure 4).
Other factors also influence the process of photosynthesis, which could partially account for the imperfect correlation of the experimental dependencies under consideration such as intensity of light, which leads to the formation of organic substances in tissues containing chloroplasts [37], the temperature in the environment [37], and plant’s mineral nutrition [38].
The correlation between soil moisture and carbon dioxide concentration was thus established during the analysis of their dependencies and was determined to have a coefficient of 0.42. The mechanism of photosynthesis can account for this correlation. The intensity of photosynthesis is specifically increased by plant irrigation, which is accompanied by an increase in soil moisture. This causes a delayed 56 h increase in carbon dioxide absorption intensity and a corresponding decrease in its concentration in the cultivation environment.

3.2. Analysis of the Results of Training Predictive Models

A regression analysis was performed to determine the effects of microclimate and lighting parameters on substrate moisture at four different peat contents (1, 2, 4, and 8 L). Four models corresponding to four values of peat quantity were trained using RandomForestRegression: Model No 1 was trained to predict substrate moisture on 1 L of peat, Model No 2 predicted substrate moisture at 2 L of peat, Model No 3 predicted substrate moisture at 4 L of peat, and Model No 4 predicted substrate moisture in 8 L of peat.
Three quality metrics were used to evaluate the performance of the trained models:
  • R2 coefficient of determination (adjusted);
  • Mean Absolute Error (MAE);
  • Mean Absolute Percentage Error (MAPE).
Three performance metrics were used to evaluate the performance of the trained model (see Table 3). Based on these measurements, model No 1 was the most accurate. The mean absolute error for each model does not exceed 5.2% of soil moisture content (highest observed for model No 3) and the highest mean absolute percent error is 1.8% (highest for model No 4. observed).
Parameters considered to be the most important in terms of impact on soil moisture were identified using the feature importance method, which implements the Permutation Importance method. This method calculates the feature importance percentage for each trained model (Figure 5).
Based on the feature importance results, the following patterns can be observed. Increasing peat content in soil reduces the effect of air humidity on soil water content and increases the effect of temperature and CO2 concentration. Compared to Model No 1, the reduction in humidity effect on soil moisture content was about 4% for Model No 2, about 12% for Model No 3, and about 20% for Model No 4. Compared to Model No 1, the increase in temperature effect on soil moisture was about 2% for Model No 2, about 6% for Model No 3, and about 12% for Model No 4.
The results obtained on the importance of temperature and humidity in urban agriculture can be explained by substrate properties [39]. In other words, peat has a water capacity, i.e., the ability to absorb and store a certain amount of water; and heat capacity, i.e., the ability to retain heat [40]. Due to its porous structure, peat retains moisture particles longer. However, water evaporates faster in porous and loose soils. Therefore, increasing the peat content within the substrate increases the temperature dependence of soil moisture and accelerates the evaporation process.
The slight increase in the concentration of CO2 could indicate the acceleration of photosynthesis during the expansion of peat volume in the soil, which is more favorable for plant nutrition. Peat serves as a vital resource for the transport of carbon dioxide from air to earth material [41], influencing nutrient cycling and the rate of photosynthesis [42].
Thus, the analysis of the four models for predicting the moisture of the substrate based on microclimate indicators discovered that an increase in the volumetric fraction of peat in the substrate shifted the dominant influence of the humidity of the air on the moisture of the substrate to the dominant influence of the temperature of the air on the moisture of the substrate. This can be explained by the increase in the efficiency of the evaporation process by the increase in the actual porosity of the substrate when a tar is added.
Figure 5 shows that the lighting slightly affected the results of the model. However, adding lighting parameters to the regression analysis improved the results of model prediction. This may be due to the presence of internal biorhythms of plants, thereby accelerating or slowing down the process of photosynthesis (the analysis is presented in Appendix B).
The surface area for heat exchange with the air proportionally increases with an increase in peat concentration in the substrate, which increases the influence of air temperature on substrate temperature and, consequently, the influence of air temperature on substrate moisture. A slight increase in the significance of CO2 concentration may confirm the acceleration of photosynthesis during an increase in peat volume in the soil, which is more favorable for the plant.

4. Conclusions

Within the framework of the research, based on measured microclimatic indicators and data on the water consumption of potatoes grown at the closed vertical farm of the Federal Research Center “Fundamentals of Biotechnology” of the Russian Academy of Sciences, an analysis of the factors influencing the process of potato photosynthesis was conducted.
  • Based on the correlation and Fourier analysis of the dependencies of soil moisture and carbon dioxide concentration on time, the correlation of these parameters was revealed with a correlation coefficient of 0.42. The best correlation was observed by shifting the CO2 concentration dependence relative to the soil moisture content dependence by 56 h. This effect can be explained by the increased intensity of the photosynthesis process when water is supplied to the plant, which leads to a delayed increase in carbon dioxide absorption intensity.
  • Applying multiple regression analysis to identify the factors that influence the intensity of photosynthesis in potatoes and thus the intensity of tuber formation, the following pattern was discovered: increasing peat content within the substrate shifts the focus from the dominant effect of atmospheric humidity on substrate moisture to the effect of air temperature on substrate moisture. Moreover, the effect of lighting on soil moisture content is relatively negligible compared to the effects of temperature and humidity.
The obtained results reveal the complex mutual influence of the parameters determining the growing conditions within automated closed vertical farms. Managing the described factors within the conditions of the city farm allows the determination of the optimal values and dynamics of these parameters at the scale of the vegetation process. Taking into account the revealed mutual influence of the studied parameters is necessary when optimizing vegetation conditions and developing intelligent plant-growing systems [12].
Further research requires several experiments with other lighting scenarios; that is, a more detailed study of different lighting spectra for soil moisture. It is also necessary to test the setting of different temperature values, which are stationary throughout the experiment. It is necessary to minimize human influence on the concentration of carbon dioxide in the city farm in order to obtain a more detailed picture of the consumption of CO2 by the plant.

Author Contributions

Conceptualization, V.K. and B.R.; methodology, V.K. and B.R.; software, V.K.; validation, V.K., B.R. and A.K.; formal analysis, V.K. and B.R.; investigation, V.K.; resources, E.S. and A.K.; data curation, V.K. and S.D.; writing—original draft preparation, V.K.; writing—review and editing, B.R., S.D., E.S. and A.K.; visualization, V.K.; supervision, A.K.; project administration, E.S. and A.K.; funding acquisition, E.S. and A.K. All authors have read and agreed to the published version of the manuscript.

Funding

This research received no external funding.

Data Availability Statement

Data are available from the authors under reasonable request.

Conflicts of Interest

The authors declare no conflict of interest.

Appendix A

Figure A1 shows the result of Fourier filtering of the dependencies of soil moisture content and CO2 concentration on time. Filtration aims to remove frequencies from the Fourier spectrum that are not directly related to irrigation. The obtained figure indicates 13 peaks of soil moisture dependence on time and 11 peaks of carbon dioxide concentration dependence on time. One peak coincides in location (within the 500–600 h range), while nine peaks reflecting high CO2 values occur consecutively after the soil moisture peaks, with a delay of approximately 50 h.
Figure A1. The filtered dependencies of soil moisture content and CO2 concentration on time with the range [1/217, 1/74].
Agronomy 13 02174 g0a1
Figure A2 shows the value of the correlation coefficients when the dependence of carbon dioxide on time is shifted relative to the dependence of soil moisture content. The highest positive peak is at 55.8 h to the left of the axis “time shift”.
Figure A2. Cross-correlation function of the filtered dependencies of soil moisture content and CO2 concentration on time.
Agronomy 13 02174 g0a2

Appendix B

Figure A3 presents the dependence of CO2 concentration and light intensity on time. It indicates that during the weekdays, peak values of carbon dioxide concentration are established toward the middle of the light period, while minimum values are recorded during the night, i.e., when the lighting is off. Meanwhile, a reverse dynamic is observed during weekends—minimal CO2 concentration is set during the daytime period, while maximum values are set during the night. The difference is explained by the lack of airtightness in the room. The circulating air in the cultivation room is connected to the air from other rooms. On workdays, the concentration of carbon dioxide is higher due to the working staff from other offices. In addition, the increase in carbon dioxide during daytime hours may be directly linked to the arrival of researchers in adjacent rooms. On weekends, however, a smaller influence of the human factor is expected. Therefore, for the study of the relationship between light and carbon dioxide concentration for plant growth, it is preferable to consider the interconnection obtained on weekends, as they more clearly reflect the respiration of the plant itself and the ongoing process of photosynthesis within it and are less influenced by external factors.
Figure A3. The dependencies of light intensity and CO2 concentration on time with highlighting period from 30 September to 14 October 2021.
Agronomy 13 02174 g0a3
Figure A4 demonstrates the dependence of the CO2 concentration in the cultivation room on the scale of one weekend day (Sunday) together with the dynamics of the CO2 absorption rate for the field-grown potato (in accordance with [43]). As indicated by Figure A4, the decrease in CO2 concentration can be explained by the absorption of CO2 molecules by the plant, which is independent of the light activation period from 8:00 to 22:00 (highlighted area in Figure A4). This fact indicates the presence of an intrinsic daily biological rhythm of the plant that does not depend on external lighting conditions.
Figure A4. Dependence of CO2 concentration in the cultivation room during the period from October 3 to October 4, 2021 (red curve) and CO2 absorption rate dynamics (blue curve, in accordance with [44]). The highlighted area depicts the photoperiod from 8:00 to 22:00 (see Table 2).
Agronomy 13 02174 g0a4
For the analysis of the relationships between lighting intensity, soil moisture, CO2 concentration, temperature, and air humidity, the Fourier transform method was used (Figure A5). As a result, simultaneous dependency peaks were discovered. With additional coincidences at 12 and 8 h, the most noticeable peak appears at 24 h.
Figure A5. The amplitude spectrum for microclimate, light, and soil moisture content depends on time dependencies.
Agronomy 13 02174 g0a5
Pearson’s correlation coefficient was used as a method to quantitatively reflect the relationships between lighting, soil moisture content, carbon dioxide content, humidity, and air temperature in the city farm (the results are presented in Table A1). The most significant correlation is between CO2 concentration and red light (correlation coefficient—0.4), while the smallest is between CO2 concentration and blue light (correlation coefficient—0.2). Similar coefficients are observed for temperature and humidity, although there is a stronger relationship between the red zone and temperature (coefficient of correlation—0.5).
Table A1. Pearson correlation coefficients for microclimate parameters.
Title 1Blue LightBlue LightRed Light
Correlation of light spectrum areas and CO2 concentration0.180.340.39
Correlation of light spectrum areas and soil moisture0.280.340.30
Correlation of light spectrum areas and air moisture−0.07−0.340.56
Correlation of light spectrum areas and air temperature0.170.440.50
Predictably, the correlation coefficients of the dependencies of humidity and lighting are negative; temperatures rise during daylight, including periods of lamp operation, thereby reducing relative air humidity. In contrast, during the nighttime, air temperature decreases and relative air humidity increases. Moreover, the influence of the red region of the light spectrum is the most significant (the correlation coefficient is −0.6). The influence of the blue region of the spectrum, on the other hand, can be considered insignificant (the correlation coefficient is −0.07).
However, it is necessary to consider the interconnection between air humidity and temperature in the present case (see Figure A6). The correlation coefficient of these two dependences is 0.7. When the temperature increases sharply, the air humidity decreases rapidly. Thus, it can be assumed that the correlation between lighting and humidity indicates a heating of the air by LEDs. The obtained result can be explained by the fact that the light output of LEDs can reach 10–20% of the consumed power, while the remaining 80–90% of energy is converted into thermal energy [44].
Figure A6. Dependencies of air moisture content and air temperature on time.
Agronomy 13 02174 g0a6
There is no significant difference between the values of the coefficients in terms of soil moisture; the indicators differ by 2–4%. However, a stronger interconnection is observed in the white area of the light spectrum (correlation coefficient –0.34). Such correlation coefficient values may be associated with the chosen proportions of light intensity during the experiment: lamps emitting white light accounted for 70% of the total lighting intensity, lamps emitting red light accounted for 50%, and lamps emitting blue light accounted for 30%. Eventually, the observed dependency in the correlation analysis of soil moisture content is not related to the light spectrum but rather to the intensity of the utilized lighting and the corresponding emitted thermal power.
Therefore, correlation analysis of the interconnection between soil moisture content and air humidity, air temperature, and lighting has shown that light activation affects the microclimate in the growing area. Specifically, the activation of light increases air temperature and soil moisture content and decreases relative air humidity. This result can be explained by air heating by heat transfer from LEDs, which accompanied a corresponding decrease in relative humidity in the air.

References

  1. Nations, U. Day of 8 Billion. Available online: https://www.un.org/dayof8billion (accessed on 14 July 2023).
  2. World Population Prospects 2022: Summary of Results | Population Division. Available online: https://www.un.org/development/desa/pd/content/World-Population-Prospects-2022 (accessed on 14 July 2023).
  3. Nations, U. 2018 Revision of World Urbanization Prospects. Available online: https://www.un.org/en/desa/2018-revision-world-urbanization-prospects (accessed on 14 July 2023).
  4. Li, M.; Verburg, P.H.; van Vliet, J. Global trends and local variations in land take per person. Landsc. Urban Plan. 2022, 218, 104308. [Google Scholar] [CrossRef]
  5. Anderson, R.; Bayer, P.E.; Edwards, D. Climate Change and the Need for Agricultural Adaptation. Curr. Opin. Plant Biol. 2020, 56, 197–202. [Google Scholar] [CrossRef] [PubMed]
  6. Fanin, N.; Mooshammer, M.; Sauvadet, M.; Meng, C.; Alvarez, G.; Bernard, L.; Bertrand, I.; Blagodatskaya, E.; Bon, L.; Fontaine, S.; et al. Soil enzymes in response to climate warming: Mechanisms and feedbacks. Funct. Ecol. 2022, 36, 1378–1395. [Google Scholar] [CrossRef]
  7. Nikolaou, G.; Neocleous, D.; Christou, A.; Kitta, E.; Katsoulas, N. Implementing Sustainable Irrigation in Water-Scarce Regions under the Impact of Climate Change. Agronomy 2020, 10, 1120. [Google Scholar] [CrossRef]
  8. Abbas, S. Climate change and major crop production: Evidence from Pakistan. Environ. Sci. Pollut. Res. 2022, 29, 5406–5414. [Google Scholar] [CrossRef] [PubMed]
  9. Song, Y.; Wang, C.; Linderholm, H.W.; Fu, Y.; Cai, W.; Xu, J.; Zhuang, L.; Wu, M.; Shi, Y.; Wang, G.; et al. The negative impact of increasing temperatures on rice yields in southern China. Sci. Total Environ. 2022, 820, 153262. [Google Scholar] [CrossRef] [PubMed]
  10. He, W.; Chen, W.; Chandio, A.A.; Zhang, B.; Jiang, Y. Does Agricultural Credit Mitigate the Effect of Climate Change on Cereal Production? Evidence from Sichuan Province, China. Atmosphere 2022, 13, 336. [Google Scholar] [CrossRef]
  11. Malhi, G.S.; Kaur, M.; Kaushik, P. Impact of Climate Change on Agriculture and Its Mitigation Strategies: A Review. Sustainability 2021, 13, 1318. [Google Scholar] [CrossRef]
  12. Siregar, R.R.A.; Seminar, K.B.; Wahjuni, S.; Santosa, E. Vertical Farming Perspectives in Support of Precision Agriculture Using Artificial Intelligence: A Review. Computers 2022, 11, 135. [Google Scholar] [CrossRef]
  13. Watawana, B.; Isaksson, M. Design and Simulations of a Self-Assembling Autonomous Vertical Farm for Urban Farming. Agriculture 2022, 13, 112. [Google Scholar] [CrossRef]
  14. Rumiantsev, B.; Dzhatdoeva, S.; Zotov, V.; Kochkarov, A. Analysis of the Potato Vegetation Stages Based on the Dynamics of Water Consumption in the Closed Urban Vertical Farm with Automated Microclimate Control. Agronomy 2023, 13, 954. [Google Scholar] [CrossRef]
  15. Grochulska-Salak, M.; Nowysz, A.; Tofiluk, A. Sustainable Urban Agriculture as Functional Hybrid Unit—Issues of Urban Resilience. Buildings 2021, 11, 462. [Google Scholar] [CrossRef]
  16. Wang, Z.J.; Liu, H.; Zeng, F.K.; Yang, Y.C.; Xu, D.; Zhao, Y.C.; Liu, X.F.; Lovedeep, K.; Liu, G.; Singh, J. Potato processing industry in China: Current scenario, future trends and global impact. Potato Res. 2023, 66, 543–562. [Google Scholar] [CrossRef] [PubMed]
  17. Tang, D.; Jia, Y.; Zhang, J.; Li, H.; Cheng, L.; Wang, P.; Bao, Z.; Liu, Z.; Feng, X.Z.; Li, D.; et al. Genome evolution and diversity of wild and cultivated potatoes. Nature 2022, 606, 535–541. [Google Scholar] [CrossRef] [PubMed]
  18. Bvenura, C.; Witbooi, H.; Kambizi, L. Pigmented Potatoes: A Potential Panacea for Food and Nutrition Security and Health? Foods 2022, 11, 175. [Google Scholar] [CrossRef]
  19. Khorramifar, A.; Rasekh, M.; Karami, H.; Covington, J.A.; Derakhshani, S.M.; Ramos, J.; Gancarz, M. Application of MOS gas sensors coupled with chemometrics methods to predict the amount of sugar and carbohydrates in potatoes. Molecules 2022, 27, 3508. [Google Scholar] [CrossRef]
  20. Danielescu, S.; MacQuarrie, K.T.B.; Zebarth, B.; Nyiraneza, J.; Grimmett, M.; Levesque, M. Crop Water Deficit and Supplemental Irrigation Requirements for Potato Production in a Temperate Humid Region (Prince Edward Island, Canada). Water 2022, 14, 2748. [Google Scholar] [CrossRef]
  21. Xing, Y.; Zhang, T.; Jiang, W.; Li, P.; Shi, P.; Xu, G.; Cheng, S.; Cheng, Y.; Zhang, F.; Wang, X. Effects of irrigation and fertilization on different potato varieties growth, yield and resources use efficiency in the Northwest China. Agric. Water Manag. 2022, 261, 107351. [Google Scholar]
  22. Adekanmbi, T.; Wang, X.; Basheer, S.; Nawaz, R.A.; Pang, T.; Hu, Y.; Liu, S. Assessing Future Climate Change Impacts on Potato Yields—A Case Study for Prince Edward Island, Canada. Foods 2023, 12, 1176. [Google Scholar] [CrossRef] [PubMed]
  23. Lee, Y.H.; Sang, W.G.; Baek, J.K.; Kim, J.H.; Shin, P.; Seo, M.C.; Cho, J.I. The effect of concurrent elevation in CO2 and temperature on the growth, photosynthesis, and yield of potato crops. PLoS ONE 2020, 15, e0241081. [Google Scholar] [CrossRef]
  24. Nasir, M.W.; Toth, Z. Effect of Drought Stress on Potato Production: A Review. Agronomy 2022, 12, 635. [Google Scholar] [CrossRef]
  25. Xu, J.M.; Liu, Y.; Liu, M.X.; Xu, Z.G. Proteomic, Physiological, and Anatomical Analyses Reveal the Effects of Red, Blue, and White Light on the Growth of Potato Plantlets under In Vitro Culture. Russ. J. Plant Physiol. 2022, 69, 139. [Google Scholar] [CrossRef]
  26. Stockem, J.E.; de Vries, M.E.; Struik, P.C. Shedding light on a hot topic: Tuberisationin potato. Ann. Appl. Biol. 2023, 183, 170–180. [Google Scholar] [CrossRef]
  27. Chen, L.L.; Zhang, K.; Gong, X.C.; Wang, H.Y.; Gao, Y.H.; Wang, X.Q.; Zeng, Z.H.; Hu, Y.G. Effects of different LEDs light spectrum on the growth, leaf anatomy, and chloroplast ultrastructure of potato plantlets in vitro and minituber production after transplanting in the greenhouse. J. Integr. Agric. 2020, 19, 108–119. [Google Scholar] [CrossRef]
  28. Xu, J.; Yan, Z.; Xu, Z.; Wang, Y.; Xie, Z. Transcriptome analysis and physiological responses of the potato plantlets in vitro under red, blue, and white light conditions. 3 Biotech. 2018, 8, 394. [Google Scholar] [CrossRef] [PubMed]
  29. Gruda, N.S. Increasing Sustainability of Growing Media Constituents and Stand-Alone Substrates in Soilless Culture Systems. Agronomy 2019, 9, 298. [Google Scholar] [CrossRef]
  30. Brown, P.H.; Zhao, F.-J.; Dobermann, A. What is a plant nutrient? Changing definitions to advance science and innovation in plant nutrition. Plant Soil 2022, 476, 11–23. [Google Scholar] [CrossRef]
  31. Choi, J.M.; Lee, C.W.; Chun, J.-P. Optimization of substrate formulation and mineral nutrition during the production of vegetable seedling grafts. Hortic. Environ. Biotechnol. 2012, 53, 212–221. [Google Scholar] [CrossRef]
  32. Liu, W.; Liu, X.; Di, X.; Qi, H. A novel network intrusion detection algorithm based on Fast Fourier Transformation. In Proceedings of the 2019 1st International Conference on Industrial Artificial Intelligence (IAI), Shenyang, China, 23–27 July 2019. [Google Scholar] [CrossRef]
  33. Beck, M.S. Correlation in instruments: Cross correlation flowmeters. J. Phys. E Sci. Instrum. 1981, 14, 7. [Google Scholar] [CrossRef]
  34. Chicco, D.; Warrens, M.J.; Jurman, G. The coefficient of determination R-squared is more informative than SMAPE, MAE, MAPE, MSE and RMSE in regression analysis evaluation. PeerJ Comput. Sci. 2021, 7, e623. [Google Scholar] [CrossRef]
  35. Chaddock, R.E. Principles and Methods of Statistics; Houghton Mifflin: Boston, MA, USA, 1925. [Google Scholar]
  36. Dogutan, D.K.; Nocera, D.G. Artificial Photosynthesis at Efficiencies Greatly Exceeding That of Natural Photosynthesis. Acc. Chem. Res. 2019, 52, 3143–3148. [Google Scholar] [CrossRef] [PubMed]
  37. Zhou, J.; Li, P.; Wang, J. Effects of Light Intensity and Temperature on the Photosynthesis Characteristics and Yield of Lettuce. Horticulturae 2022, 8, 178. [Google Scholar] [CrossRef]
  38. Therby-Vale, R.; Lacombe, B.; Rhee, S.Y.; Nussaume, L.; Rouached, H. Mineral Nutrient Signaling Controls Photosynthesis: Focus on Iron Deficiency-Induced Chlorosis. Trends Plant Sci. 2022, 27, 502–509. [Google Scholar] [CrossRef] [PubMed]
  39. Lennartz, B.; Liu, H. Hydraulic functions of peat soils and ecosystem service. Front. Environ. Sci. 2019, 7, 92. [Google Scholar] [CrossRef]
  40. Gnatowski, T.; Ostrowska-Ligęza, E.; Kechavarzi, C.; Kurzawski, G.; Szatyłowicz, J. Heat Capacity of Drained Peat Soils. Appl. Sci. 2022, 12, 1579. [Google Scholar] [CrossRef]
  41. Monteverde, S.; Healy, M.G.; O’Leary, D.; Daly, E.; Callery, O. Management and rehabilitation of peatlands: The role of water chemistry, hydrology, policy, and emerging monitoring methods to ensure informed decision making. Ecol. Inform. 2022, 69, 101638. [Google Scholar] [CrossRef]
  42. Liu, H.; Rezanezhad, F.; Lennartz, B. Impact of land management on available water capacity and water storage of peatlands. Geoderma 2022, 406, 115521. [Google Scholar] [CrossRef]
  43. Chapman, H.W. Absorption of CO2 by Leaves of the Potato. Am. Potato J. 1951, 28, 602–615. [Google Scholar] [CrossRef]
  44. Tan, L.; Liu, P.; She, C.; Xu, P.; Yan, L.; Quan, H. Research on Heat Dissipation of Multi-Chip LED Filament Package. Micromachines 2021, 13, 77. [Google Scholar] [CrossRef]
Figure 1. Structure of a part of the vertical farm of the Federal Research Center “Fundamentals of Biotechnology” of the Russian Academy of Sciences involved in the study.
Agronomy 13 02174 g001
Figure 2. (a)The dependence of soil moisture content on time; (b) The dependence of CO2 concentration on time.
Agronomy 13 02174 g002
Figure 3. (a) The amplitude spectrum of the dependences of soil moisture content and CO2 concentration on time with a selected range for filtration—from 74 to 217 h; (b) Initial and filtered dependences of soil moisture on time with the range [1/217, 1/74].
Agronomy 13 02174 g003
Figure 4. Filtered dependencies of the soil moisture content and shifted CO2 concentration on time.
Agronomy 13 02174 g004
Figure 5. Permutation importance for four trained models: (a) for model No 1; (b) for model No 2; (c) for model No 3, (d) for model No 4.
Agronomy 13 02174 g005
Table 1. Volume ratio of substrate components: neutralized peat, swollen vermiculite, universal soil.
Neutralized Peat Content, LiterSubstrate Components Content (Swollen Vermiculite: Universal Soil), Liter
113:2
212:2
410:2
86:2
Table 2. The lighting conditions used for potato cultivation.
CropVarietyStepDuration, DaysBlue, %White,%Red, %Turn-On TimeTurn-Off TimePAR, µmol/(s·m2)
PotatoInnovator1Sep 20–Sep 290000:000:000
2Sep 30–Oct 24307008:0022:00220
3Oct 25–Nov 8070508:0022:00232
4Nov 9–Nov 283070508:0022:00299
5Nov 29–Dec 9307008:0022:00220
Table 3. Performance metrics of the four trained models.
Performance MetricModel No 1
“1 L of Peat”
Model No 2
“2 L of Peat”
Model No 3
“4 L of Peat”
Model No 4
“8 L of Peat”
R20.8210.7880.7710.749
MAE4.674.905.194.86
MAPE0.460.560.791.78
Training time1 min. 19 s.1 min. 20 s.1 min. 25 s.1 min. 21 s.
Disclaimer/Publisher’s Note: The statements, opinions and data contained in all publications are solely those of the individual author(s) and contributor(s) and not of MDPI and/or the editor(s). MDPI and/or the editor(s) disclaim responsibility for any injury to people or property resulting from any ideas, methods, instructions or products referred to in the content.

