
Sequential Acid/Alkali Pretreatment for an Olive Tree Pruning Biorefinery


1
Department of Chemical Engineering and Food Technology, Faculty of Sciences, Agrifood Campus of International Excellence (CeiA3), University of Cádiz, 11510 Puerto Real, Spain
2
Department of Chemical, Environmental and Materials Engineering, Centre for Advanced Studies in Earth Sciences, Energy and Environment (CEACTEMA), University of Jaén, 23071 Jaén, Spain
*
Author to whom correspondence should be addressed.
Agronomy 2023, 13(11), 2682; https://0-doi-org.brum.beds.ac.uk/10.3390/agronomy13112682
Submission received: 24 September 2023
/
Revised: 18 October 2023
/
Accepted: 24 October 2023
/
Published: 25 October 2023
(This article belongs to the Special Issue Pretreatment and Bioconversion of Crop Residues II)
Abstract
:Olive tree pruning is an abundant and renewable lignocellulosic residue, which is generally burned in the fields, causing economic costs and environmental problems. This lignocellulosic residue can be considered a suitable raw material for the production of a wide range of byproducts in a biorefinery context due to its high content of potentially fermentable carbohydrates. To take advantage of its sugar content, pretreatment is necessary to enhance the accessibility of the enzymes to the cellulosic fraction. The aim of this work is to obtain sugars contained in olive tree pruning as a substrate for the production of bioethanol by fermentation. Specifically, the production of fermentable sugars by sequential pretreatment with sulfuric acid and sodium hydroxide is studied. A two-factor rotatable composite central design temperature and catalyst concentration (H2SO4 and NaOH) has been generated, and response surface methodology has been used to discuss and optimize the responses. This work shows that under optimal pretreatment conditions (130 °C, 1.90% w/v H2SO4 and 130 °C, 1.49% w/v NaOH) of 1 kg of olive tree pruning, a solution rich in sugars (102 g of glucose and 61 g of xylose) and a solid residue generating 99 g of glucose by enzymatic hydrolysis is obtained. Moreover, applying the combined severity to the acid pretreatment, it has been determined that 20% of the olive tree pruning is fast solubilization, and it was also found that the apparent activation energy of the acid hydrolysis reaction is 85.07 kJ/mol.
1. Introduction
Currently, 10.3 million ha of olive trees are cultivated worldwide [1]. Pruning is an essential stage of the crop after fruit harvesting, with the aim of removing old branches and increase the production. The amount of pruning produced ranges from 1 to 3 t·ha−1·year−1, depending on diverse agronomic factors [2,3,4,5], making olive tree pruning (OTP) one of the most available lignocellulosic biomasses, especially in Mediterranean region. The OTP generated is spread over the field or eliminated by burning to prevent the propagation of plant diseases, which generates economic costs and environmental concerns. Nevertheless, this type of biomass contains cellulose, hemicellulose, lignin, and extractives. OTP has been considered a raw material for the biorefinery industry due to its potential for the production of bioethanol and a wide range of bioproducts [6]. Despite its lignocellulosic nature, it has a highly recalcitrant structure that limits the biotechnological conversion of potentially fermentable carbohydrates.
In order to break down this structure and make the carbohydrates more accessible to subsequent processes, the lignocellulosic biomass must be pretreated. Therefore, this first step is key to improve the accessibility of enzymes and fermenting microorganisms to the cellulose and hemicellulose fraction. It is well known that each type of raw material requires an appropriate pretreatment and conditions to maximize the overall sugar yield and to minimize the degradation of resulting sugars [7]. Thus, several pretreatments have been tested and studied with OTP, e.g., hydrothermal (liquid hot water [8,9]), physical and extrusion process [10]), chemical (dilute acid [11], inorganic salts [12], organosolvent [13], and alkaline medium [14]), or physicochemical (steam explosion [15,16,17]).
Specifically, the use of dilute acid pretreatment aims to solubilize the hemicellulosic fraction and improve cellulose digestion by enzymes, being a promising technology for the production of lignocellulosic sugars at a relatively low cost and at commercially relevant scales [18]. High hydrolysis yields have been reported when pretreating lignocellulosic materials with diluted sulfuric acid, which is the most studied [19]. On the other hand, as a consequence of the hydrolysis reactions in acidic media, potentially inhibitory compounds are released by the degradation of cellulose and hemicellulose, which can lead to a lower fermentation yield [20]. The amount and type of these compounds, with adverse effects on the fermenting microorganism, depend on different variables, such as temperature, residence time, and acid concentration. Variables that can be grouped in the combined severity factor [21].
Within chemical pretreatments, other catalyst substances and conditions have been assayed. Thus, an alkali treatment is reported to break hydrolyzable linkages in the lignin and glycosidic bonds of carbohydrates [10]. As a result, a swelling of the fibers occurs, leading to an increase in the internal surface area and a reduction in the degree of polymerization and crystallinity of the cellulose. Moreover, an alkaline saponification of the acetyl and uronic ester bonds also occurs, improving the subsequent enzymatic digestibility of the pretreated material [22]. Specifically, NaOH causes swelling, increases the internal surface of cellulose, and decreases the degree of polymerization and crystallinity, which provokes lignin structure disruption [19]. However, alkali-pretreated biomass must be washed several times to remove inhibitors and alkalis in order to achieve a high bioconversion yield, which consumes a lot of water and generates a large amount of wastewater [23]. The operating variables for alkaline pretreatment are usually temperature, time, and alkali concentration and, as for acid pretreatment, can be grouped into a combined severity factor [21,24].
In this context, the combination of acid and alkaline pretreatment of OTP could allow the separation of hemicellulosic sugars and lignin from the lignocellulosic structure in order to improve their enzymatic digestibility and the fermentability of the recovered sugars. This pretreatment strategy, which combines the effects of both types of chemical processes, could be a promising alternative for application in the biorefinery industry in an attempt to achieve the full valorization of OTP biomass. Some researchers have studied sequential or combined acid and alkaline pretreatment of lignocellulosic biomasses, such as fibers from empty oil palm bunches [25], Miscanthus [26], sugarcane bagasse, or corn stover [27]. Many types of pretreatments have been studied individually with OTP [8,9,10,11,12,13,14,15,16,17], but there are few studies on sequential pretreatment with OTP as raw material. Thus, Martínez-Patiño et al. [28] performed a sequential pretreatment with sulfuric acid and a subsequent delignification with hydrogen peroxide in an alkaline medium with NaOH.
Therefore, the present work was aimed to obtain sugars contained in the OTP, mainly glucose and xylose, like a substrate to bioethanol production by fermentation. Specifically, sequential acid/alkali pretreatment will be studied to obtain a sugary liquid with the lowest degree of toxicity, and a solid rich in cellulose easily accessible to enzymatic hydrolysis (EH). The design of experiments (DOE) methodology will be applied, and a rotatable composite central design (RCCD) will be generated, which will be applied to both pretreatments. The response surface methodology (RSM) will be used to discuss and optimize the responses obtained from both pretreatments. The factors to be studied are as follows: concentration (H2SO4 and NaOH) and temperature, keeping constant the pretreatment time and the solid/liquid ratio (S/L). In addition, the influence of the factors in obtaining sugars by EH will be determined. Finally, fermentation in bioethanol tests will be carried out for the optimal conditions of sequential pretreatment.
2. Materials and Methods
2.1. Raw Material
The OTP was collected in an olive plantation after the olive harvest season in March. Once in the laboratory, this material was dried at room temperature, reaching 8% moisture. Subsequently, the pruning was grinded using a blade mill (Retsch, SM 100, Haan, Germany) until obtaining a particle size below 1 cm, which was stored until its use. The composition of the raw material was determined according to the standard procedures of the NREL of USA [29].
2.2. Pretreatment
The OTP was subjected to a sequential pretreatment, first stage with dilute sulfuric acid and second stage with sodium hydroxide. Both pretreatment stages were carried out according to the experimental design described in Section 2.2.1.
The pretreatment was performed in a laboratory scale stirred bench top reactor (Parr, model 4520, Moline, IL, USA). The reactor had a total volume of 2 L, with an electric heater and mechanic agitation. The temperature/speed controller was a combination of furnace power control and motor speed control with tachometer. In total, 150 g of OTP (dry base) and 1 L of sulfuric acid (S/L = 15% w/v), with the appropriate concentration for each test were used. According to previous studies [30] the agitation rate was kept at 350 rpm and the residence time was established in 20 min once the desired temperature was reached.
The water-insoluble solid residue (WIS) obtained by cake filtration of the slurry after acid pretreatment under optimum conditions (WISA) was treated with sodium hydroxide solutions in a second stage. Thus, the WISA was introduced into the Parr reactor described above. The test time was pre-set in 20 min with 350 rpm of agitation and the S/L ratio was maintained in 15% w/v, whereby 75 g of WISA in 0.5 L of sodium hydroxide of appropriate concentration. Finally, after alkaline treatment a WIS was obtained by cake filtration (WISB).
For all tests, a typical temperature profile is shown in Figure 1. Where the number 1 corresponds to the heating curve, 2 to the period at operating temperature, and 3 to the cooling curve.
2.2.1. Experimental Design
RSM was used for the execution of the pretreatment tests and the subsequent discussion of the results. DOE was used to carry out the trials. A two-factor (temperature and acid or alkali concentration) RCCD was performed, with five levels per factor, five center points, 4 factorial, and 4 axials (Table 1), where A and B were the coded factors, respectively. The software used for the experimental design and discussion of the results was Design Expert 8.0.7.1® (Stat-Ease, Inc., Minneapolis, MN, USA), specific DOE software.
The experimental results were fitted to the quadratic model of Equation (1), in coded factors ().

Table 1.
Experimental design. Actual and coded factors.
| Run | 1 | 2 | 3 | 4 | 5 | 6 | 7 | 8 | 9 | 10 | 11 | 12 | 13 | |
|---|---|---|---|---|---|---|---|---|---|---|---|---|---|---|
| Factor | T (°C) | 150 | 130 | 150 | 178.28 | 150 | 170 | 150 | 150 | 150 | 121.72 | 150 | 170 | 130 |
| A | 0 | −1 | 0 | 1.414 | 0 | 1 | 0 | 0 | 0 | −1.414 | 0 | 1 | −1 | |
| C (%) | 2 | 1 | 2 | 2 | 3.41 | 3 | 0.59 | 2 | 2 | 2 | 2 | 1 | 3 | |
| B | 0 | −1 | 0 | 0 | 1.414 | 1 | −1.414 | 0 | 0 | 0 | 0 | −1 | 1 | |
In Equation (1), subscript 1 corresponds to coded factor A and subscript 2 to coded factor B. Y is the response, β0 is the independent term, or value of the response at the center point of the experimental interval, β1 and β2 the coefficients of the linear, or first level, terms, β12 the coefficient indicative of the interaction between factors, and β11 and β22 are the coefficients of the quadratic terms. The last term in Equation (1) corresponds to the standard deviation of the model (ε). All the models, obtained for the different responses, are hierarchical, significant (p-value < 0.05) and there is no lack of fit (p-value > 0.1). The coefficient of determination (R2) and the coefficient of variation (CV) or relative model error are used as model statistics.
The design in Table 1 was applied to the acid and alkaline treatments of OTP. For the acid treatment, the factors studied were the experimental temperature (real factor T and coded A) and the percentage of sulfuric acid (real factor CA and coded B). T was modified in the range 130–170 °C and CA between 1 and 3% (w/v). In the alkaline treatment, of the WISA, the sodium hydroxide concentration (actual factor CB and coded B) was varied between 1 and 3% (w/v) and the temperature (actual factor T and coded A) in the same range used for the acid tests.
To determine the coded factors in Equations (1) and (2) has been applied.
where x is the real factor to be coded and a and b are the limits of the experimental interval (a, b) for each real factor.
2.2.2. Combined Severity Factor
To determine the severity factor, the equation proposed by Overend and Chornet in 1987 was used. Assuming a reaction order 1 for the degradation of lignocellulosic waste fibers and determining an apparent activation energy of 101.6 kJ/mol, for an average hydrolytic treatment temperature of 220 °C [31]. This equation, applied to a non-isothermal treatment, becomes Equation (3).
where R0 is the reaction ordinate (min), or severity, tf the total treatment time (min), T the temperature (°C), 100 is the base temperature, at which hydrolysis of the lignocellulosic residue is considered to begin (see Figure 1), and ω is a characteristic parameter dependent on the experimental mean temperature (°C) (Equation (4)).
where Tf corresponds to the experimental mean temperature (K), R is the ideal gas constant [kJ/(mol K)], and Ea is the apparent activation energy (kJ/mol) [32].
In order to consider the catalytic action of the acid or alkaline treatment, Equation (3) can be modified by including a term related to the molar concentration of the hydrolytic solution [21].
where CS is the combined severity , C is the acid or alkaline concentration in the sequential pretreatments (mol/L), and n is a constant indicating the influence of the acid, or alkali, on the hydrolysis process. The decimal logarithm of CS allows the determination of the combined severity factor (CSF).
2.3. Composition of Pretreated Material
The slurry obtained after each pretreatment test was filtered for solid and liquid separation by cake filtration. The solids (WIS) were washed with water, and, after oven drying at 40 °C, were used as substrate in the EH tests described in Section 2.4. On the other hand, the liquid fraction (prehydrolyzate) was used in fermentation tests as described in Section 2.5.
Prehydrolyzate and WIS was made to determine the sugar content and other components as acid-insoluble lignin in solids and inhibitory compounds in the prehydrolyzates as described in Section 2.6.
2.4. Enzymatic Hydrolysis Tests
The WIS obtained after each test were used as substrate for EH to evaluate the effect of the different pretreatment conditions on their enzymatic digestibility. Cellulolytic complex used was kindly provided by Novozymes A/S (Bagsværd, Denmark) and cellulase enzyme (Cellic Ctec2, Bagsvaerd, Denmark) loading was 15 Filter Paper Units (FPU)/g substrate. Additionally, fungal β-glucosidase (Novozym 50010, Novozymes A/S) was used at an enzyme loading of 15 International Unit (IU)/g substrate. EH was performed in 0.05 M sodium citrate buffer (pH 4.8) at 50 °C on a rotary shaker (B-Braun, Certomat-R, Melsungen, Germany) at 150 rpm for 72 h and at 5% w/v pretreated material concentration. Samples were taken every 24 h for glucose concentration determination in the HPLC (see Section 2.6). After the EH tests, cake filtration was performed to separate solids from liquids rich in glucose (hydrolyzates).
2.5. Fermentation Tests
The fermentation tests of the prehydrolyzate produced under optimal conditions were carried out according to the following conditions.
2.5.1. Detoxification
The solution was detoxified by the addition of ammonium hydroxide (NH4OH, 5 M) until pH 9 was reached, keeping identical requirements (agitation, time, and temperature) to those described in previous works [33]. The concentrated ammonium hydroxide solution favored minimal changes to the final volumes. Finally, the detoxified liquids were centrifuged for 5 min at 5000 rpm to remove precipitated solids. Ammonium hydroxide was chosen for detoxification because it has been shown in previous studies to be an effective method for detoxifying sulfuric acid OTP prehydrolyzates for subsequent fermentation [34].
2.5.2. Microorganism and Growth Conditions
A microorganism able to ferment pentoses and hexoses was used due to composition of OTP; specifically, bioethanologenic bacterium Escherichia coli SL100. Inocula were prepared in AM1 medium following the composition described previously [35], composed of (in g/L) xylose (16), glucose (10), (NH4)2HPO4 (2.63), NH4H2PO4 (0.87), MgSO4·7H2O (0.246), KCl (0.149), betaine (0.117), citric acid (0.1), and trace elements (different concentrations). The growth conditions were 37 °C and 200 rpm for 24 h on a rotary shaker (AG CH-4103 Ecotron, Infors HT, Bottmingen, Switzerland).
2.5.3. Fermentation Conditions
For fermentation test Dasgip Bioblock equipment (Eppendorf AG, Hamburg, Germany) was used. This instrument was equipped with four fermenters of 1 L capacity, whose system control and operating parameters have been described in a previous study [34]. Specifically, the fermentation tests were carried out in duplicate, and the working volume was 0.5 L and the initial concentration of E. coli SL100 was 0.25 g/L. Before inoculation, the components of the AM1 medium, excluding the ammonium salts, and 1.5 M sodium metabisulfite (in a ratio of 1 mL/L sample) were added and the pH was adjusted to 6.5. The conditions fixed were as follows: 37 °C, 150 rpm, pH 6.5.
An automatic pH adjustment system with 2 M potassium hydroxide was used. For sampling, 1 mL of sample was taken from each fermenter and centrifuged at 10,500 rpm for 10 min and then passed through 0.45 μm filters. The composition was then determined by HPLC analysis as described in Section 2.6.
2.5.4. Calculation of Yields
The fermentation yield (%) was calculated using Equation (6):
where [E] was the concentration of bioethanol (g/L) and [G] is the glucose consumed (g/L) in the fermentation broth.
Additionally, the bioethanol yield was calculated according to Equation (7), as a percentage of the maximum attainable ethanol yield:
where 51.1 (g bioethanol per 100 g sugars) is the stoichiometric coefficient in the bioethanol fermentation process.
2.6. Analytical Methods
The raw material and the WISA and WISB obtained after each pretreatment test were characterized by the NREL procedure for the determination of cellulosic and hemicellulosic sugars and lignin content [29].
HPLC (Waters, Milford, CO, USA) was used to determine the sugar content (glucose, xylose, arabinose, mannose, and galactose) of the raw material, and with the WIS and prehydrolyzates obtained from the pretreatments. The HPLC was equipped with a refractive index detector (model 2414) and a column CARBOSep CHO-782 Pb (Transgenomic, Inc., Omaha, NE, USA) working with ultrapure water as the mobile phase at a flow of 0.6 mL/min and at constant temperature of 70 °C. In addition, the prehydrolyzates were also analyzed for the following inhibitory compounds: acetic acid, formic acid, furfural, and hydroxymethylfurfural (HMF). For samples of prehydrolyzate, enzymatic hydrolyzates and the fermentation test, the measurement of inhibitors and bioethanol, was performed with an HPLC system (Agilent Technologies 1260 model, Santa Clara, CA, USA) with a refractive index detector and an Aminex HPX-87H column (Bio-Rad, Hercules, CA, USA), operating at 65 °C with 5 mM H2SO4 solution as eluent at a flow of 0.6 mL/min.
3. Results and Discussion
3.1. Composition of Raw Material
The composition of the OTP used in the present study is shown in Table 2. According to the carbohydrate analysis carried out, the total sugar fraction of the dry biomass is 46% of which 70% corresponds to glucose and 24% corresponds to xylose, the main component of hemicellulose. The composition of the raw material used in this study is very similar to those reported by other authors in previous works [36].
The glucose content determined for this residue is higher than that reported for other olive-derived biomasses, such as olive stones, which, unlike pruning, have a higher hemicellulose than cellulose content [37,38]. It is worth mentioning that the OTP has a high content of extractives (non-structural compounds), 29.50%, of which 6.34% is glucose found in the aqueous extract. This extractive content found can be considered a high value compared to other agricultural wastes such as rapeseed straw [39], wheat straw [40], barley straw [41], or sunflower stalks [42]. The high extractives content in OTP is mainly derived from its amount of olive leaves. It should be noted the high proportion of extractives (about 30%), a value within the range normally found for olive pruning biomass, which, according to previous studies, can be between 14 and 31% depending on the concentration of leaves [16]. However, higher extractive content has been reported for other olive-derived wastes, such as olive leaves with 39% [43] and defatted olive pomace with 42% [44]. Other compounds present in the OTP to be considered are complex compounds, such as lignin (17.43%), and inorganic fractions, such as ash (3.47%).
The composition shown, 40% are structural sugars, indicates that OTP is a raw material for sugars obtaining and potentially for second generation bioethanol production due to its lignocellulosic nature; however, the extractive and lignin fractions present can hinder the conversion of sugars to bioethanol. An efficient pretreatment strategy should lower these barriers, improving enzyme accessibility and the digestibility of the cellulosic component.
3.2. Acid Pretreatment
Table 3 shows the experimental results obtained after acid treatment of OTP. Where SRA indicates the percentage of raw material (OTP) that is recovered as a solid (WISA) after acid treatment, GS and XS refer to the percentage of cellulose, as glucose, and hemicellulose, as xylose, recovered in that residue, AIL and Ash are the recovered amounts of lignin and ash. CS is the combined severity and GE is the percentage of WISA that is recovered, as glucose in solution, by EH.
First, the SRA results were fitted with Equation (1), obtaining the model shown in Table 4. This model has a coefficient of determination of 0.994 and a coefficient of variation of 2%. It follows from this model that there was no interaction between the factors (β12 = 0), and the temperature exerts a hydrolytic action higher than the acid concentration. Using the SRA model, the response at each experimental point was recalculated and the results were adjusted with the combined severity factor (CSF).
Through an iterative process, in which the parameters n and ω of Equation (5) were modified, the best linear fit of the values calculated with the SRA versus CSF model (SRA = 80.03–16.46·CSF, R2 = 0.9897), for n = 1 and ω = 17.5 °C, was determined. This equation indicates the existence of 20% of the residue whose solubilization is very fast, and the rest whose hydrolysis increases at a rate of 16.5% for each unit increase in CSF. Knowing the parameter ω, and considering Equation (4), the apparent activation energy of this residue can be determined (Ea = 85.07 kJ/mol), for the average experimental temperature of 150 °C. The value is in agreement with those shown by Belkacemi et al. [45] and by Ruiz et al. [46], for different average operating temperatures and different residues.
The experimentally obtained CS data for n = 1 and ω = 17.5 °C were fitted to Equation (1) and resulted in the model shown in Table 4. This shows the good fit obtained (R2 = 0.998), as well as the low relative error (CV = 3.61%). To obtain the best statistics, it was necessary to transform the response, so the fit was performed using the square root of CS as the dependent variable. This model shows the greater influence on severity, almost double, of temperature with respect to acid concentration, as well as the interaction between the factors. The CS model in Table 4 was used to recalculate the CS and CSF values corresponding to the different experimental factors, which were used for the subsequent discussion of the results.
3.2.1. Recovery of Glucose, Xylose, Lignin, and Ash in the Solid after Acid Pretreatment
The experimental data for glucose (GS), xylose (XS), lignin (AIL), and ash (Ash) in Table 3, as a percentage in grams of the WISA, were modified with SRA, calculated using the model in Table 4, to refer to the dry raw material from the acid pretreatment, and divided by the composition of each component in this residue. In such a way that they represent the percentage of that component that has been recovered in the WISA, out of the total existing in the OTP. These data were named with the same call sign as in Table 3 with the addition of the R, of recovered, at the end; thus, they are GSR, XSR, AILR, and AshR.
The fit models obtained for the recoveries of glucose, xylose, lignin, and ash, in solids, are shown in Table 4. From the statistical point of view, all models are significant and without lack of fit, and present good coefficients of determination and/or variation. From the glucose model it can be deduced that the influence of temperature is much greater than the influence of acid concentration, and it presents a high interaction between the factors, which, by the value of the coefficients, is not very significant for the influence of temperature and very significant for the action of acid. Thus, for high temperature values the action of the acid is quite significant on glucose dissolution (GSR = 44.31% for 1% acid and 28.28% for 3%), while for low temperature values this action disappears (GSR = 58.47% for 1% acid and 60.21% for 3% acid).
For the percentage of xylose recovered in the solids was necessary to transform the experimental data in order to obtain a model that could represent them. The software proposed to make the square root of the experimental data after adding the constant 0.04. As for glucose, the hydrolytic action is especially affected by the experimental temperature and less by the acid concentration used. In this model, there is no interaction between factors, but there is curvature with positive influence, indicating that the response surface curves upward at the extremes of the experimental intervals (Appendix A, Figure A1a). This is especially significant at the lower limits of the intervals because it indicates that small increases in the factor lead to an appreciable decrease in xylose recovery in the WISA, which is not observed at the upper limits. Thus, the model predicted that at 130 °C and 1% acid, the XSR value would be 34.77%, 19.88% if the acid concentration is increased to 3%, or 2.61% if only the temperature is raised to 170 °C. For an acid concentration of 1% and 140 °C, temperature XSR = 13.56%. On the other hand, if 130 °C is maintained and the acid concentration is increased to 1.5%, the value of XSR = 20.67%. So, it is convenient, in order to hydrolyze more hemicellulose, to increase a little the temperature than to add more acid to the hydrolytic medium.
Regarding the recovery of lignin in the solids, the model in Table 4 shows a higher percentage of lignin than the raw material initially had, so it could be stated that, during the pretreatment process, the generation of lignin (lignin-like structures) would have occurred [16]. The model shows a positive linear dependence with temperature and acid concentration, somewhat greater with the latter factor. The increase of both factors increased the lignin content of the WISA. For the ash content, both factors had a very significant negative influence, with the influence of acid being slightly greater with a positive curvature of the response surface, although without marking a minimum in the experimental range, and a small interaction between factors that is not very significant. The model predicted an ash content of 53% at the lower limit of both factors and 0% for the upper limits.
By combining the models for glucose and xylose with the CS model, the dependence of both monomers on CS could be determined. Assuming that the solubilization of the fibers, cellulose, and hemicellulose took place according to an order 1 reaction, and that both were constituted by two fractions with different reaction rates (fast and slow), the amount of each fraction could be determined by adjusting GSR and XSR with CS [46]. Thus, the representation of GSR and XSR versus CS yields the following equations.
Equation (8), with good statistical fit, which allowed the determination of the fast and slow fractions of cellulose and hemicellulose solubilization, as well as their kinetic constant. Thus, for cellulose, a fast solubilization fraction of 37.68% and a slow solubilization fraction of 62.32% and a reaction rate kinetic constant of 10−3 L/(mol min) were determined. For hemicellulose, 55.74% is susceptible to rapid solubilization and 44.26% is hydrolyzed more slowly, with a kinetic constant of 9.7 × 10⁻³ L/(mol min). Observing both kinetic constants it can be indicated that hemicellulose solubilizes 10 times faster than cellulose.
3.2.2. Enzymatic Hydrolysis of the Solid after Acid Pretreatment
To determine the glucose recovery potential of the pretreated residues, GE in Table 3, EH of WISA was carried out. GE, as a percentage in grams of the pretreated residue, was modified with SRA, calculated by the model in Table 4, to refer to the initial dry raw material and divided by the structural glucose in the raw material. Thus, the results (GER) represent the percentage of glucose that has been recovered in solution by EH of the pretreated residue, referred to as structural glucose in the raw material, slow solubilization fraction. The GER data were fitted to the model shown in Table 4, where the high degree of fit obtained (R2) and the small relative error (CV) can be observed. According to the linear terms of the model, the coefficient corresponding to the acid concentration is almost double that of the temperature, so its influence is also double. On the other hand, there are no quadratic terms, but there is an interaction term between factors with a negative coefficient of very high value, which caused a deep twisting of the response surface. Some results predicted by the model are as follows: GER = 18.31% at 130 °C and 1% acid, 34.04% at 130 °C and 3% acid, 30.76% at 170 °C and 1% acid, and 29.47% at 170 °C and 3% acid. From the point of view of EH performance, it is better to increase the acid dose than to increase the temperature.
3.2.3. Prehydrolyzate Obtained after Acid Pretreatment
Table 5 shows the results of analysis of the liquids obtained after acid treatment of OTP. It shows the concentration of the hexoses glucose (GL), galactose (Gal), and mannose (Man), and of the pentoses xylose (XL) and arabinose (Ara), and of the bioethanolic fermentation inhibitor compounds acetic acid (Ace), formic acid (For), HMF, and furfural (Fur).
All the monosaccharide data in Table 5 were modified by considering the solid/liquid ratio (15% w/v) in the pretreatment reactor and the composition of each of the sugars in the dry raw material. Thus, the results obtained represent the percentage of each monosaccharide dissolved due to acid pretreatment. The nomenclature used for the dissolved sugar fraction has been the following: GLR, GalR, ManR, XLR, and AraR.
Table 4 shows the fitting models obtained for the percentage of each sugar recovered in the liquid phases. For the model of glucose recovery in prehydrolyzate, a low and positive influence is observed for both factors, somewhat higher for the action of acid. A really important aspect of this model is that the quadratic term of the acid concentration is highly significant, and with a negative sign; thus, the response decreased at the extremes of the experimental interval. This quadratic term marked a variable response maxima due to the interaction with the temperature, between 2.5 and 3% acid for low temperatures (GLR ≈ 32.5%) and around 2% for high temperatures (GLR ≈ 33.2%). This occurs because first, the glucose in the solid is solubilized and then, under the most extreme conditions, it is degraded to HMF and this to the formic and levulinic acids [20]. The maximum glucose recovery in liquids (GLR = 33.24%) is obtained at T = 166.2 °C and CA = 2.2%.
Regarding the xylose model in liquids, the negative influence of both factors is observed, although this is low compared to the interaction between factors and, above all, to the quadratic dependence of the temperature. The negative interaction allowed the response surface to be twisted so that the influence of one factor could be positive or negative depending on whether the other factor had low or high values, respectively. If, as can be seen, the main terms are negative, they decreased the influence on the response when it is positive and made it more negative when it is negative. Thus, at 170 °C and 1%, the percentage of xylose in solution is 69.31% and at 3% it is 19.63%, on the other hand, at 130 °C and 1% acid, the xylose is 48.83% and at 3% it is 63.67%. To finish drawing the response surface of the model, one must consider the high quadratic term, which, being negative, draws a concave surface with maxima at 1% acid between 150 and 160 °C (XLR ≈ 83%) and between 135 and 145 °C for 3% acid (XLR ≈ 70%) (Appendix A, Figure A1b). For the rest of the sugars, the experimental results obtained have not allowed the obtaining significant models for hexoses and, although it had been obtained for pentose, it cannot be considered significant because it predicted that more sugar is obtained than that initially contained in the raw material.
Table 4 also includes the models obtained for the concentration of the main bioethanolic fermentation inhibitors, the experimental results of which are shown in Table 5. All models showed good statistics and acceptable CVs. It is observed that the concentration of acetic acid increased with temperature and, above all, with the concentration of sulfuric acid. Although the quadratic terms tend to curve the response surface, they are insignificant and, only with temperature, a small maximum is shown at 160 °C and 3% acid (3.26 g/L). The HMF model, glucose degradation product, indicated a linear increase with temperature and showed a small maximum with acid concentration at its central point (β22 >> β2) (HMF = 0.44 g/L at 170 °C and 2% acid). For the concentration of formic acid, HMF degradation product [20], it is observed that the main factor that increased it is the temperature and somewhat less the acid. The maximum is determined at the upper limits of both factors since the curvature with acid is not very significant and did not show a maximum within the experimental range. With respect to furfural, there is also a greater influence of temperature than of concentration, although both factors are positive. The interaction term is important because it is positive and has a coefficient similar to that of the main acid level. Thus, at low levels of both factors, the influence of temperature on the response is reduced by half and that of acid is practically nullified; on the other hand, at higher levels, the influence of temperature is increased by one-third and that of acid is doubled. The furfural concentration at the extremes of the experimental ranges of both factors are as follows: 0.08 g/L at 130 °C and 1%, 0.21 g/L at 130 °C and 3%, 0.98 g/L at 170 °C and 1%, and 2.77 g/L at 170 °C and 3%.
3.2.4. Optimization of the Models
To maximize glucose and xylose in the prehydrolyzate, and glucose in WISA, the fraction of each of them that is degraded by the hydrolytic action of the acid pretreatment was determined by means of material balances. The response surface models obtained for total glucose degradation (TGD) and total xylose degradation (TXD) are shown in Table 4.
Considering the model for TGD, Table 4, it is observed that the temperature increase is the factor that degraded glucose the most, approximately five times more than the increase in acid concentration. The coefficients of the quadratic terms of each factor are half that of its linear term, so the surface had a small positive curvature at the extremes of both factors (Appendix A, Figure A1c). Regarding the interaction term, its positive sign indicated that both factors increased their glucose degrading action with the increase of the other factor. However, the fact that the coefficient of this term is larger than that of the linear term of the acid caused the degrading action of the acid to increase greatly with increasing temperature. In contrast, the degrading action of temperature is little influenced by increasing acid concentration since the coefficient of the linear term of the temperature factor is much larger than the coefficient of the interaction term. In fact, the influence of acid is negative at low temperatures and very high at high temperatures due to the interaction between factors. The TGD model predicted the following values at the extremes of the factors: 12.44% at 130 °C and 1%, 7.38% at 130 °C and 3%, 23.91% at 170 °C and 1%, and 39.39% at 170 °C and 3%.
Table 4 also shows the model obtained for total xylose degradation (TXD). In this model it is observed that the coefficient of the linear term of temperature is higher than that of acid so that its influence on xylose degradation is greater. Although the interaction term makes the influence on degradation low at low acid doses and quite high at high doses. As for the action of the acid, its influence is almost nil at low temperatures and very high at high temperatures. At the extremes of the experimental ranges the model predicted the following TXD values: 16.18% at 130 °C and 1%, 15.83% at 130 °C and 3%, 28.73% at 170 °C and 1%, and 80.62% at 170 °C and 3%.
Since the objective of the work is to maximize glucose production in solution and recovery in WISA, maximize acid prehydrolyzate fermentation, and recover a sufficient amount of WISA that could be subjected to the experimental design with NaOH, the set of models in Table 4 was optimized. The following conditions were defined to determine the optimal factors to achieve the above objective: Glucose and xylose content in the prehydrolyzate (GLR and XLR) and glucose content in WISA (GSR) were maximized, and glucose and xylose degradation (TGD and TXD) and fermentation inhibitor concentration were minimized. Table 6 shows the responses of the models at the optimal point, determined using the Design Expert® software, and the actual values of the factors.
The amount of each component recovered in solids and liquids can be determined from Table 6. Thus, if 100 g of dry raw material is used as a basis for calculation, the following results are obtained: 19.06 g of glucose and 1.70 g of xylose, plus 19.81 g of lignin and 1.17 g of ash, in 51.27 g of solid, and, in a liquid solution 10.20 g of glucose and 6.10 g of xylose, plus 1.17 g of acetic acid, 0.49 g of formic acid, 0.11 g of HMF, and 0.10 g of furfural. Due to the acid pretreatment, 2.90 g of glucose and 2.24 g of xylose are degraded. The composition of the solid at the optimum point (Table 6) is 37.17% glucose as cellulose, 3.32% xylose as hemicellulose, 38.63% lignin, and 2.28% ash.
On the other hand, and as a comparison of the process, the models have also been optimized to obtain the maximum sugars in the solution and their minimum degradation, the maximum yield of enzymatic hydrolysis, and the minimum concentration of fermentation inhibitors. In this case, only the acid pretreatment and subsequent EH of the solids would be performed without alkaline pretreatment (see Section 3.4).
3.3. Alkaline Pretreatment
Once the optimum acid pretreatment conditions were determined, the necessary tests were carried out under these conditions to obtain sufficient WISA to apply the design in Table 1 to the NaOH pretreatment. After analyzing this residue, it was determined that 53.22% of the initial raw material had been recovered and its composition was 38.61% glucose as cellulose, 2.32% xylose as hemicellulose, 39.07% lignin, and 2.85% ash. As can be seen, these results are very close and within the margins of error to those predicted by the models at the optimum point of acid pretreatment (Section 3.2.4).
For the alkaline pretreatment, the experimental design of Table 1 was also applied to the WISA recovered after pretreatment at 130 °C with 1.9% sulfuric acid. As preset operating variables, an S/L ratio of 15% w/v and 20 min of pretreatment at the experimental temperature were used. Table 7 shows the experimental results obtained after alkaline pretreatment of the WISA obtained under optimum conditions. Where SRB indicates the percentage of raw material (WISA) that is recovered as a solid (WISB) after alkaline treatment, GSB is the percentage of cellulose, as glucose, recovered in these residues, and AILB and AshB are the amounts of lignin and ash. CSB is the combined severity and GEB is the percentage of WISB recovered, as glucose in solution, by EH.
The SRB data in Table 7 were fitted with Equation (1), resulting in the model shown in Table 8. The model shows small curvatures with the factors, although it is of little importance with respect to its linear terms. The dependence of the response on the factors is basically linear, and more than five times higher for the influence of sodium hydroxide concentration than for the influence of temperature. The fit statistics obtained for this model, as shown in Table 8, are very good.
For the different points of the experimental design (Table 1), the results predicted by the SRB model were plotted against the combined severity factor (CSBF), defined as the decimal logarithm of the combined severity (CSB in Equation (5)). By iteration, modifying the power of NaOH concentration (n) and the parameter ω, the best coefficient of determination for the representation of SRB versus CSBF was determined (R2 = 0.991). Obtained for n = 2 and ω = 130 °C, and the linear equation SRB = 79.78–22.49·CSBF. This indicates that, as for the acid treatment, in the alkaline treatment there is also about 20% of very fast solubilization residue and the rest at a rate of 22.5% per unit of CSBF increase. The value of n indicates a dependence of order 2 for the solubilization of the residue with the NaOH concentration. This agrees with the model obtained for SRB, where concentration is the most influential factor in the response. With the parameter ω, for an average experimental temperature of 150 °C and Equation (4), the apparent activation energy for the alkaline treatment of this residue can be calculated (Ea = 11.45 kJ/mol). Ea has a very low value, indicating that temperature has little influence on the solubilization of the residue.
The CSB values (Table 7) were adjusted with Equation (1), determining the model shown in Table 8, which shows very good fit statistics, for which it was necessary to transform the response by applying the square root. As can be seen, the model is basically linear with a small interaction between factors that, by the value of the coefficient, affects a little of the influence of the temperature on the response and practically nothing of the action of NaOH. As the coefficient of the interaction term is positive, the influence of temperature is somewhat higher at high NaOH concentrations than at low concentrations. In any case, the influence of NaOH concentration is more than four times higher than the influence of temperature. The SRB and CSB models have been used in the subsequent transformation and discussion of the experimental results in Table 7.
3.3.1. Recovery of Glucose, Lignin, and Ash in the Solid after Alkaline Pretreatment
The alkaline pretreatment results for glucose (GSB), lignin (AILB), and ash (AshB) content in solids, as shown in Table 7, were modified with SRB using the model in Table 8, and with the composition of each component in WISA (Section 3.3) in such a way that the results represented the percentage of each component recovered in the solid residue, referred to as the total existing in WISA. These data were named with the same callsign as in Table 7 with the addition of the R, meaning recovered, at the end; thus, they are GSBR, AILBR, and AshBR. For glucose recovered by EH, the experimental results (GEB) in Table 7 were modified to represent the percentage of solubilized glucose of the total glucose contained in the raw material (WISB) in each hydrolysis test (GEBR). Table 8 shows the models obtained for fitting these data. It should be noted that all models are significant and without lack of fit and with very good statistical coefficients.
As can be seen in Table 8, the models obtained for glucose and lignin are very similar, with linear and negative influences for both factors. From the value of the coefficients, it could be seen that the NaOH concentration influences the responses much more than the temperature, and that the influence of alkali is higher for lignin. These models were used to recalculate the percentages of glucose and lignin recovered in the solids, which were plotted against CSB, and the following equations were obtained.
Equation (9) indicates order 1 kinetics for hydrolytic action in an alkaline medium, with kinetic constants of 0.015 and 0.034 L2/(mol2 min), for cellulose and lignin, respectively. From Equation (9) it can be deduced that about 5% of the cellulose corresponds to a fast-solubilizing fraction and the rest is slow solubilizing. On the other hand, about 23% of the lignin is rapidly solubilized and the rest is slowly solubilized.
For ash recovery in solids, the model shown in Table 7 was determined, in which a linear dependence of the response on the factors is observed. β2 is higher, in absolute value, than β1, indicating a greater influence of the concentration factor than that of temperature. With an increasing temperature, the response decreases, while with an increasing NaOH concentration the response increases. It should be noted that exceeding 100% of the response indicates that there is ash generation, so it can be considered that with the increase in NaOH concentration, mineralization of the residue occurs. It should be noted that there is a strong positive interaction between factors, which modifies the influences of the linear terms of the model. Thus, for low NaOH concentrations the influence of temperature becomes more negative, and, on the other hand, the influence became slightly positive for high concentrations. On the other hand, for low temperatures, the influence of NaOH concentration is reduced and became slightly negative and is very positive for elevated temperatures. As an example, at 130 °C and 1% NaOH the ash content (AshBR) is 130.85%, 72.21% at 170 °C and 1%, 125.36 at 130 °C and 3%, and 142.20% at 170 °C and 3%.
3.3.2. Enzymatic Hydrolysis of the Solid after Alkaline Pretreatment
Table 8 shows the model of glucose dissolved by EH (GEBR), in which it can be seen that only the concentration of NaOH positively influences the response. Thus, the higher the concentration of the reagent, the more easily the cellulose remaining in the residue is enzymatically hydrolyzed. Combining the GEBR and GSBR models, the data of glucose obtained by EH, referred to as glucose in WISA (GEBRR), were calculated. The model for GEBRR is shown in Table 8, without statistics, because it is a combination of other models. In this model, a large positive influence of NaOH concentration is observed, and a smaller and negative influence of temperature. Thus, the increase of CB increased the yield of glucose obtained but not the increase of temperature. The interaction and quadratic terms are not very significant, and the response surface showed only a small concave curvature in the experimental range. According to the model, the maximum glucose is obtained at the highest NaOH concentration and lowest temperature. At this point, 52.92% (20.43 g glucose/100 g WISA) of the potential glucose content of the residue subjected to EH would be recovered, and 50% (50 g) of the solid residue would remain. On the other hand, the minimum of glucose, 42.46% (16.39 g glucose/100 g WISA), would be obtained at the temperature of 170 °C and 1% NaOH, and 68.82% (68.82 g) would be recovered as solid residue. Considering the EH models of glucose and solids recovery discussed in the previous sentence, different optima can be considered depending on whether maximum glucose, maximum solids, or an intermediate optimum that maximizes both responses is desired. For 100 g of WISA, maximizing glucose gives 4 g more glucose than maximizing solids, but 18.82 g less solids and a very concentrated black liquor would have to be treated. By maximizing the solids, the previous 4 g of glucose would be lost, but the black liquors would be diluted, and more solids would be obtained that could be valorized in the context of a biorefinery or for thermal and/or electrical generation. The joint optimization of both models would allow the obtaining of intermediate values of glucose and solids.
3.3.3. Maximum of Glucose and Solid after Alkaline Pretreatment
The optimum for the alkaline treatment was determined by considering the joint maximum of the SRB and GEBR models (Table 8). Table 9 shows the actual factors and the different responses obtained at the optimum point.
From the results in Table 9, the amount of each component recovered in the solid and in the solution could be determined. Thus, if 100 g of dry raw material for the alkaline treatment (WISA) is used as a basis for calculation, the following results are obtained: 66.79 g of dry residue, with a content of 34.44 g of glucose, as cellulose, 25.59 g of lignin, and 3.69 g of ash; therefore, 10.80% of cellulose (4.2 g of glucose) and 34.50% of lignin are degraded, and 29.51% of ash is generated. By EH, 18.60 g of glucose in solution are recovered, corresponding to 48.16% of the cellulose in WISA. After EH 48.19 g of residue would remain, of which 15.84 g correspond to glucose, as cellulose.
For comparison, if only the maximum glucose is to be obtained, the operating conditions would be 130 °C and 3% NaOH, to obtain 20.43 g of glucose by EH (52.92% of glucose in WISA), and 11.76 g would be degraded (30.45% of the initial glucose). From the initial 100 g of raw material only 50 g of solids would be recovered, with 26.85 g of glucose, as cellulose, 14.57 g of lignin, and 3.57 g of ash. After EH, 29.6 g of solid residue would remain, of which 6.42 g would correspond to glucose, as cellulose. In this case, a slightly higher amount of glucose would be obtained than in the previous case, but the black liquors from the basic treatment would have an extreme pH and a very high content of degradation products.
3.4. Comparison between Sequential Acid–Alkali or Acid-Only Pretreatment and Material Balances
Given that the models of all the responses have been determined for the acid pretreatment and the alkaline pretreatment, and each one of them has been optimized with the objective of obtaining the maximum fermentable sugars and final solid residue, Section 3.3.3, a comparison can be made between this sequential treatment and another in which only acid pretreatment is carried out. Thus, simultaneously optimizing the models in Table 4 to maximize fermentable sugars in solution (GLR and XLR) and enzymatic hydrolysis of WISA (GER) and minimizing inhibitors, the results in Table 10 are obtained.
As in Table 6, the amount of each component recovered in the solid and liquid can be determined from the data in Table 10. Thus, for 100 g of raw material, 19.37 g of glucose, 2.18 g of xylose, 20.23 g of lignin, and 1.12 g of ash are obtained in 48.89 g of pretreated solids. And, in the liquid, 10.42 g of glucose and 6.99 g of xylose, plus 1.59 g of acetic acid, 0.52 g of formic acid, 0.07 g of HMF, and 0.14 g of furfural. At 130 °C and 3% sulfuric acid, 2.38 g of glucose, and 1.74 g of xylose are degraded, slightly lower amounts than those degraded with 1.9% acid, which seems to indicate that increasing the acid concentration at 130 °C somewhat preserves the sugars from degradation. The composition of the solids under these conditions is 39.61% glucose, 4.46% xylose, 41.38% lignin, and 2.28% ash.
Once the results of each process, sequential or just acid pretreatment, are known, they can be compared to determine which one is more profitable industrially. Assuming, as a basis for calculation, 1000 g of dry olive pruning, the results shown in Table 11 are obtained, in which it has been considered that for every 1000 g of raw material, the alkaline pretreatment is carried out with only 532.20 g of acid pretreated solid.
As can be seen in Table 11, with the acid pretreatment, 192.08 g of glucose are obtained between prehydrolyzate and enzymatic hydrolysis, plus 69.91 g of xylose, and with the sequential treatment 201.02 g of glucose, plus 60.96 g of xylose. With the latter pretreatment, 9 g more glucose is obtained than with the acid, but 9 g less xylose. On the other hand, the final solid residue, after EH, is 401.02 g in the individual pretreatment and 256.48 g in the sequential one, with a higher sugar content in the first residue. At this point, several ways of valorizing the raw material can be considered. It is possible to use only the acid pretreatment, which recovers the same sugars as the sequential one and, at the end, the amount of residue is higher, but it is necessary to neutralize the acid and eliminate the greater number of inhibitors in the prehydrolyzate; otherwise, the sequential one is used where the alkaline prehydrolyzate could be used to partially neutralize the acidic prehydrolyzate. This last stage of the sequential process should be studied since the characteristics of the solution that would be obtained after mixing the two prehydrolyzates are unknown.
3.5. Fermentation of Prehydrolyzate Detoxified
The prehydrolyzate obtained after the first pretreatment, dilute acid, under optimal conditions, maximum of glucose and xylose and minimum inhibitors in solution, was used as fermentation substrate. A control fermentation was carried directly, without detoxification step, in which no sugars were consumed by bacterium E. coli SL100 and therefore no bioethanol was produced.
Specific detoxification methods can be developed for the efficient removal of inhibitors prior to the fermentation of the strongly inhibiting prehydrolyzates [20]. Previous works has shown that this detoxification is an advantageous way to improve the fermentation of OTP prehydrolyzate [34]. Therefore, the detoxification step was performed to be able to ferment the prehydrolyzate, specifically, ammonium hydroxide was the method applied. Thus, after ammonium hydroxide detoxification, the resulting prehydrolyzate was fermented by duplicate.
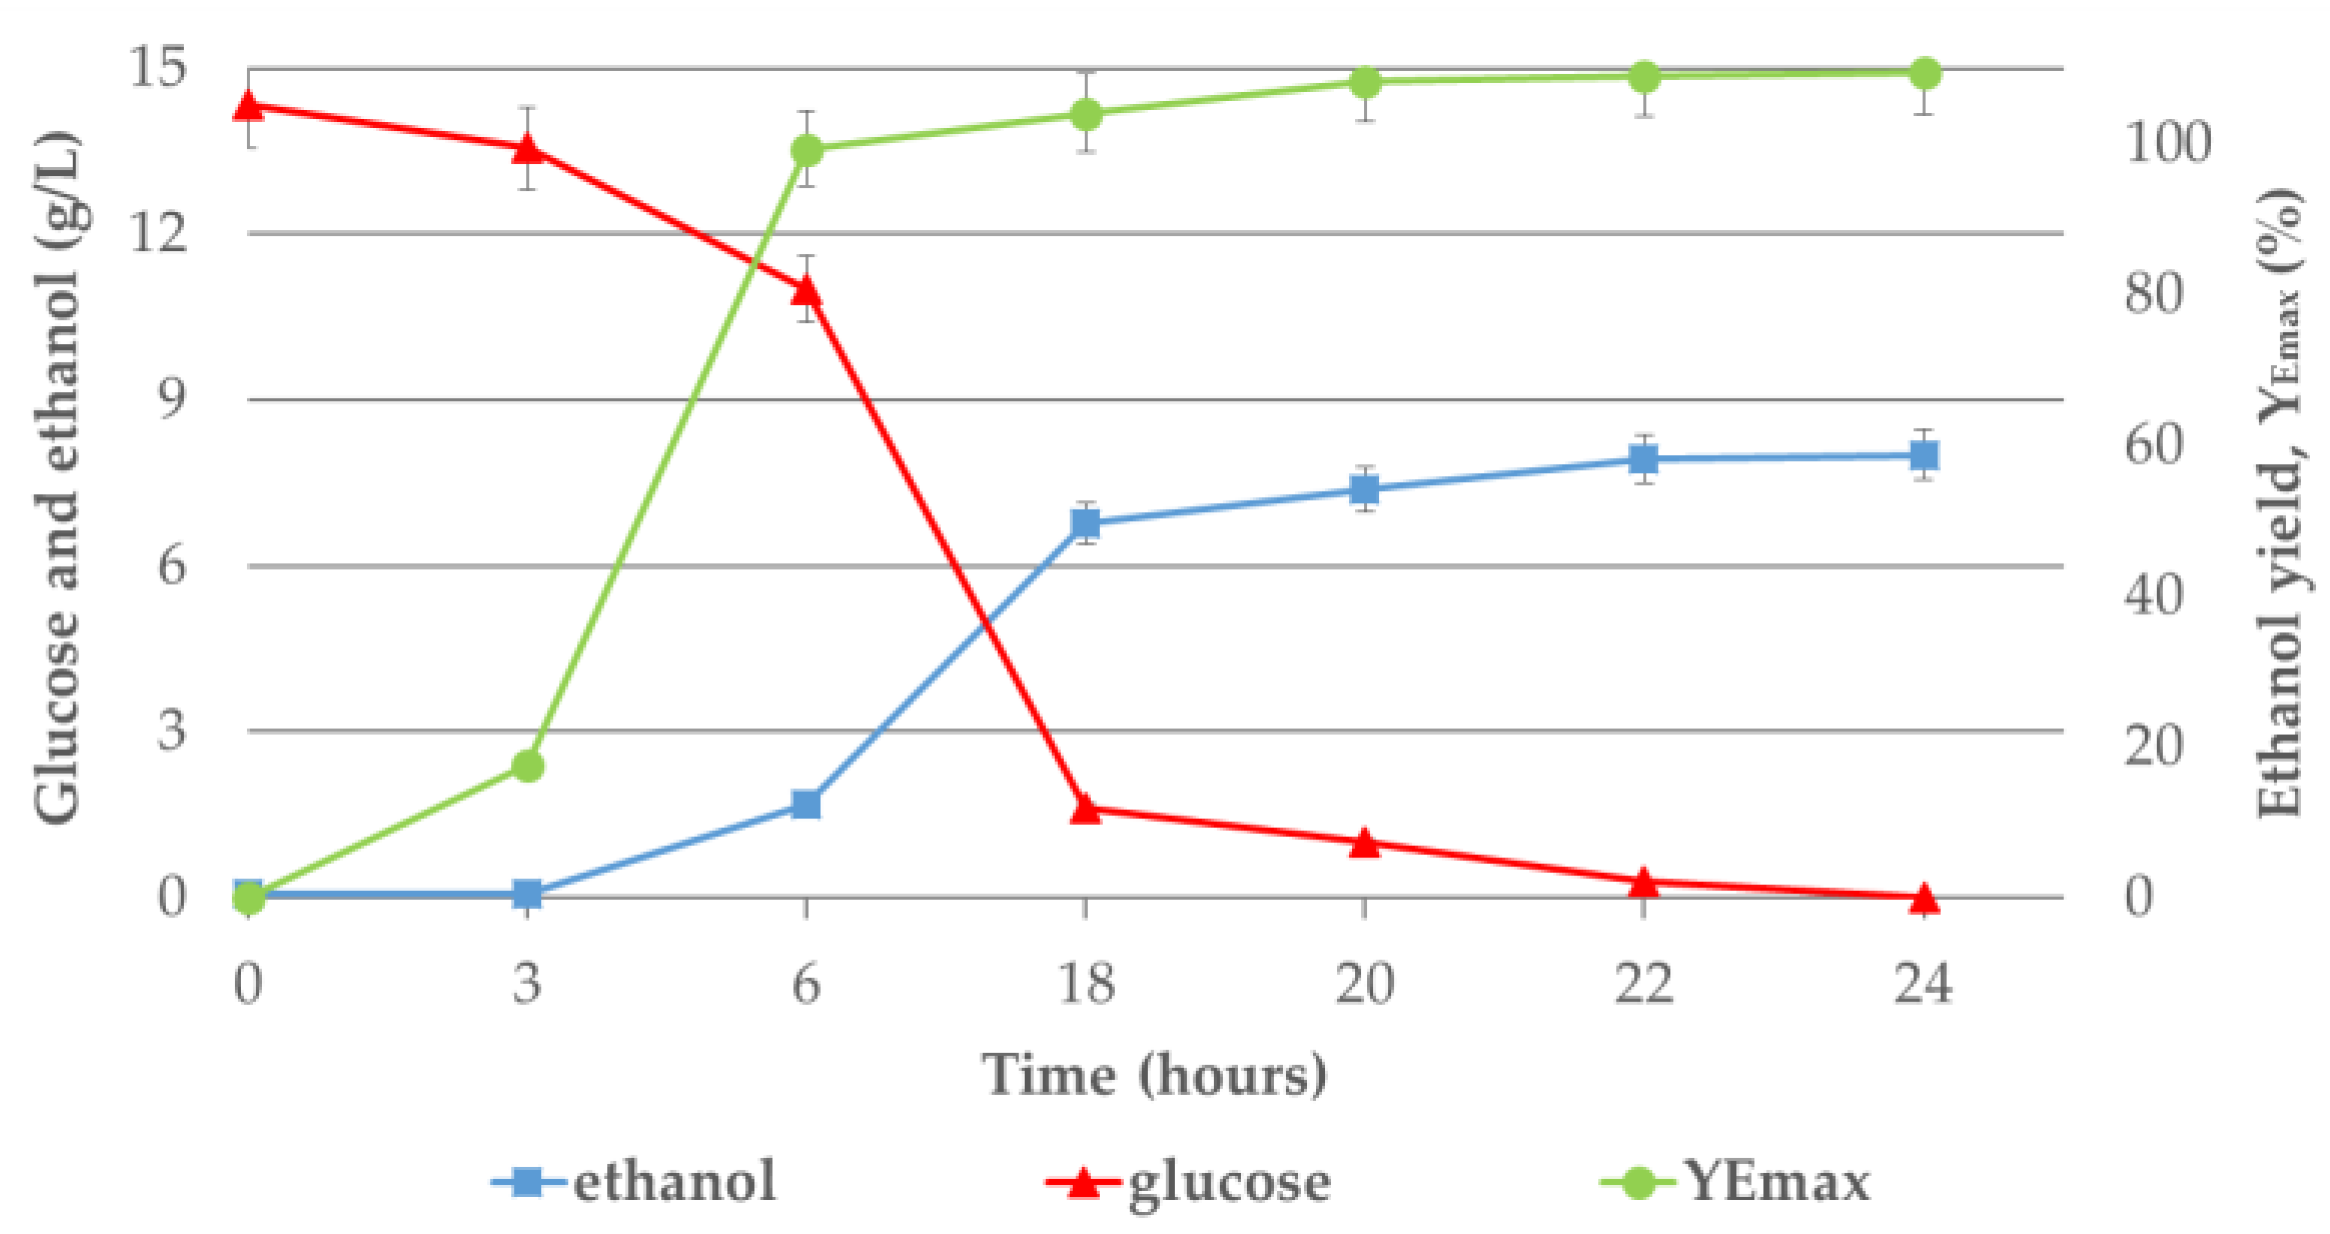
E. coli SL100 was able to carry out the fermentation process, producing a bioethanol concentration of 8 g/L within 24 h (Figure 2). In the beginning hours of fermentation, ethanol yields were low, which is in accordance with the lag phase of E. coli SL100 [47]. Thus, the yield of bioethanol achieved (YE) was 55%, which is close to 109% of the theoretical maximum (YEmax). It is well known that the maximum stoichiometric fermentation yield is 51.1%, which has been slightly exceeded. This may be due to the fact that other sugars apart from glucose were initially found in the prehydrolyzate, such as xylose, galactose, and mannose, which can also be fermented by E. coli SL100 although in smaller amounts and in a lower order of consumption than glucose [33]. The fermentation tests were also extended to 168 h to observe this fact, which was corroborated. After this time, the ethanol concentration was 10 g/L, with a total sugar consumption of 20.5 g/L.
The high yield obtained after the first 24 h of fermentation is according to those found in other authors that also studied the bioethanol fermentation from different OTP acid prehydrolyzates (Table 12).
3.6. Fermentation of Enzymatic Hydrolyzate
The objective of sequential pretreatment and the EH stage is to release as much glucose as possible that can be fermented to bioethanol. Obviously, the number of monomeric sugars generated during the EH process largely determines the amount of bioethanol produced in the fermentation. Thus, the solid residue, WISB, obtained in the present study after the optimal sequential pretreatment, and the subsequent EH was rich in glucose (30% of the initial glucose).
The fermentation tests of these hydrolysates have not been carried out in this work but, considering the results obtained by other authors who have studied the fermentation of OTP hydrolysates after pretreatment and EH, the bioethanol yields in the range of 69–100% of the theoretical maximum could be obtained (Table 13).
4. Conclusions
The sequential treatment of OTP using sulfuric acid, followed by sodium hydroxide as a pretreatment strategy, has been studied with the objective of recovering the maximum of soluble sugars in the context of a biorefinery. A rotatable composite central design (RCCD) was generated by the statistical design of experiments (DOE), and the response surface methodology (RSM) was applied to discuss and optimize the responses obtained for the following factors: temperature pretreatment (130–170 °C) and catalyst concentration (1–3% w/v).
After applying the combined severity to the acid pretreatment, it has been determined that 20% of the OTP is fast solubilization, and the rest is slow solubilization. Specifically, for the recovery of cellulose and hemicellulose, it has been calculated that 37.68% of cellulose and 55.74% of hemicellulose were susceptible to fast solubilization, with a hydrolysis 10 times faster for hemicellulose. In addition, it has been determined that the apparent activation energy of the acid hydrolysis reaction is 85.07 kJ/mol (referred to the average working temperature of 150 °C). Conditions have been determined to maximize glucose and xylose content in the prehydrolyzates (GLR and XLR) and glucose content in the WISA (GSR) and to minimize glucose and xylose degradation (TGD and TXD) and inhibitor concentration in the prehydrolyzates. The optimum conditions determined are as follows: 130 °C and 1.90% of H2SO4 (w/v). On the other hand, the optimum conditions for the second treatment, the alkaline, were determined by considering the maximum solid residue recovery (SRB) and the highest amount of glucose by EH (GEBR); thus, the best alkaline pretreatment is 130 °C and 1.49% of NaOH (w/v).
The pretreatment step was also studied as a single dilute acid pretreatment without a subsequent alkaline step. Thus, for the optimum conditions determined, 130 °C and 3% of H2SO4 w/v, similar sugar recoveries are obtained, and a greater amount of residue is recovered, but it is necessary to neutralize the acid and eliminate the greater number of inhibitors generated in the prehydrolyzate. This fact was corroborated in the fermentation tests performed, in which E. coli SL100 was only able to ferment the acidic prehydrolyzate after detoxification with ammonium hydroxide.
Finally, further research is needed to study the liquids generated after sequential pretreatment as the characteristics of the solution and the neutralization action, which would be obtained after mixing the two prehydrolyzates (acid and alkaline), are unknown. In addition, the use of a sequential pretreatment strategy would affect the economics of the process, so it is necessary to study the costs by optimizing the flows between stages.
Author Contributions
Conceptualization, M.J.D. and M.M.; methodology, P.M.F.; writing—original draft preparation, M.J.D. and M.M.; review and editing, M.J.D. and M.M. All authors have read and agreed to the published version of the manuscript.
Funding
This research received no external funding.
Data Availability Statement
Data available from the authors.
Conflicts of Interest
The authors declare no conflict of interest.
Appendix A
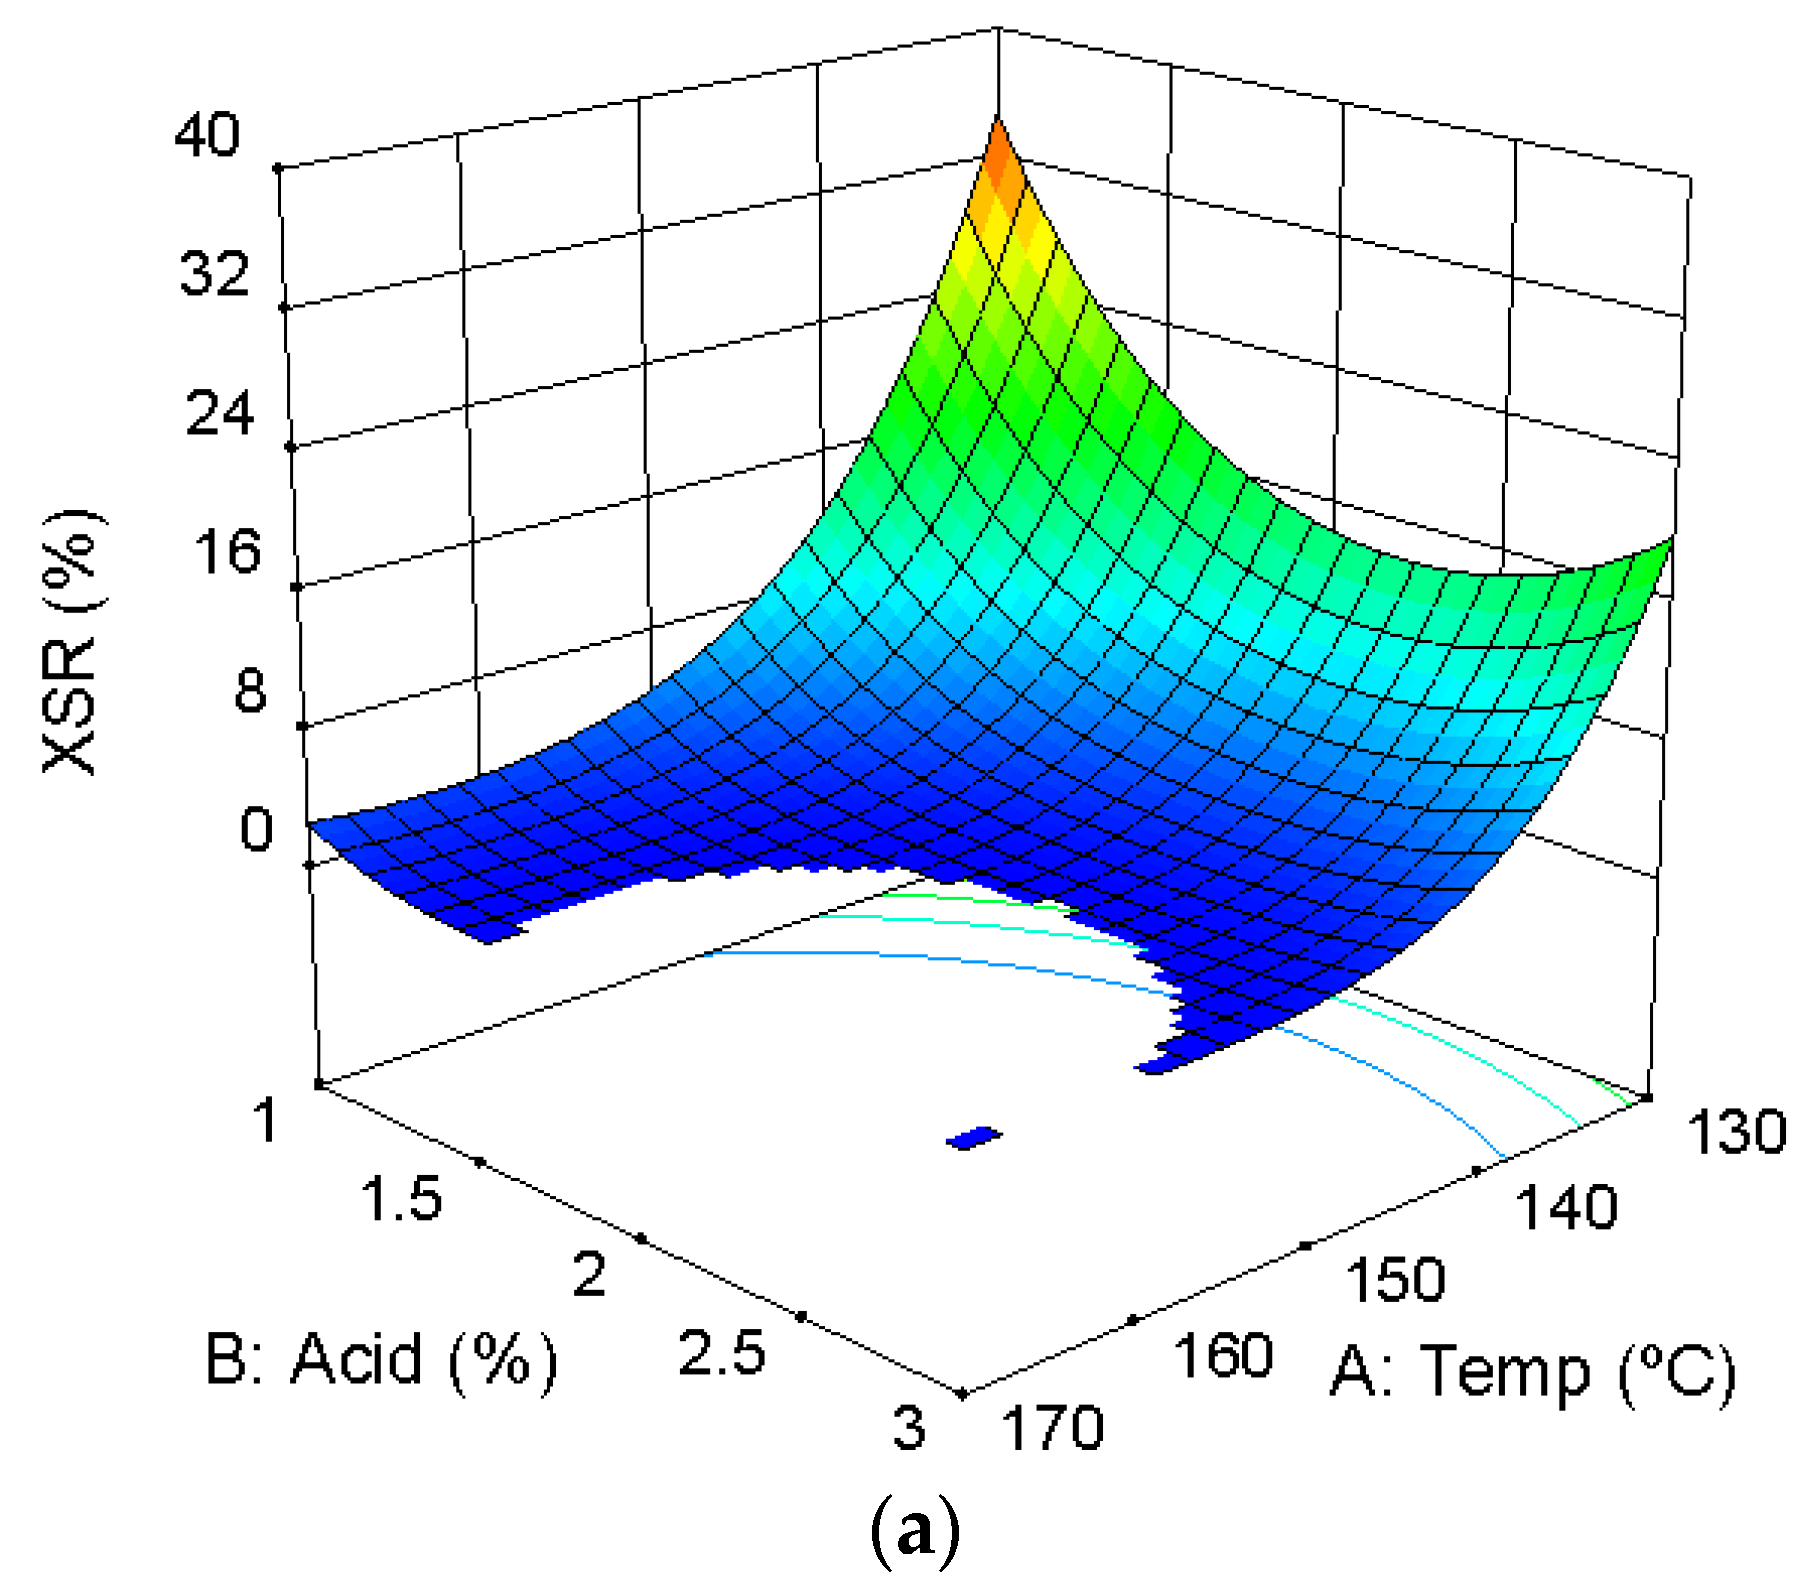
Figure A1.
Response surface plot. (a) Percentage of xylose recovered in WISA; (b) percentage of xylose recovered in acid prehydrolyzate; (c) percentage of glucose degradation in WISA.
Figure A1.
Response surface plot. (a) Percentage of xylose recovered in WISA; (b) percentage of xylose recovered in acid prehydrolyzate; (c) percentage of glucose degradation in WISA.


References
- FAOSTAT. Available online: http://faostat3.fao.org/ (accessed on 13 July 2023).
- Cara, C.; Ruiz, E.; Ballesteros, I.; Negro, M.J.; Castro, E. Enhanced enzymatic hydrolysis of olive tree wood by steam explosion and alkaline peroxide delignification. Process Biochem. 2006, 41, 423–429. [Google Scholar] [CrossRef]
- Spinelli, R.; Picchi, G. Industrial harvesting of olive tree pruning residue for energy biomass. Bioresour. Technol. 2010, 101, 730–735. [Google Scholar] [CrossRef]
- Romero-García, J.M.; Niño, L.; Martínez-Patiño, J.C.; Álvarez, C.; Castro, E.; Negro, M.J. Biorefinery based on olive biomass. State of the art and future trends. Bioresour. Technolol. 2014, 159, 421–432. [Google Scholar] [CrossRef]
- Garcia-Maraver, A.; Zamorano, M.; Ramos-Ridao, A.; Díaz, L.F. Analysis of olive grove residual biomass potential for electric and thermal energy generation in Andalusia (Spain). Renew. Sustain. Energy Rev. 2012, 16, 745–751. [Google Scholar] [CrossRef]
- Ruiz, E.; Romero-García, J.M.; Romero, I.; Manzanares, P.; Negro, M.J.; Castro, E. Olive-derived biomass as a source of energy and chemicals. Biofuels Bioprod. Biorefin. 2017, 11, 1077–1094. [Google Scholar] [CrossRef]
- Manzanares, P.; Negro, M.J.; Oliva, J.M.; Sáez, F.; Ballesteros, I.; Ballesteros, M.; Cara, C.; Castro, E.; Ruiz, E. Different process configurations for bioethanol production from pretreated olive pruning biomass. J. Chem. Technol. Biotechnol. 2011, 86, 881–887. [Google Scholar] [CrossRef]
- Buruiana, C.T.; Vizireanu, C.; Garrote, G.; Parajó, J.C. Bioethanol production from hydrothermally pretreated and delignified corn stover by fed-batch simultaneous saccharification and fermentation. Energy Fuels 2014, 28, 1158–1165. [Google Scholar] [CrossRef]
- Cara, C.; Romero, I.; Oliva, J.M.; Sáez, F.; Castro, E. Liquid hot water pretreatment of olive tree pruning residues. Appl. Biochem. Biotechnol. 2007, 137, 379–394. [Google Scholar] [CrossRef] [PubMed]
- Negro, M.J.; Duque, A.; Manzanares, P.; Sáez, F.; Oliva, J.M.; Ballesteros, I.; Ballesteros, M. Alkaline twin-screw extrusion fractionation of olive-tree pruning biomass. Ind. Crop. Prod. 2015, 74, 336–341. [Google Scholar] [CrossRef]
- Cara, C.; Ruiz, E.; Oliva, J.M.; Sáez, F.; Castro, E. Conversion of olive tree biomass into fermentable sugars by dilute acid pretreatment and enzymatic saccharification. Bioresour. Technol. 2008, 99, 1869–1876. [Google Scholar] [CrossRef] [PubMed]
- López-Linares, J.C.; Romero, I.; Moya, M.; Cara, C.; Ruiz, E.; Castro, E. Pretreatment of olive tree biomass with FeCl3 prior enzymatic hydrolysis. Bioresour. Technol. 2013, 128, 180–187. [Google Scholar] [CrossRef] [PubMed]
- Toledano, A.; Serrano, L.; Labidi, J. Process for olive tree pruning lignin revalorisation. Chem. Eng. J. 2012, 193–194, 396–403. [Google Scholar] [CrossRef]
- Mamaní, A.; Maturano, Y.; Mestre, V.; Montoro, L.; Gassa, L.; Deiana, C.; Sardella, F. Valorization of olive tree pruning. Application for energy storage and biofuel production. Ind. Crops Prod. 2021, 173, 114082. [Google Scholar] [CrossRef]
- Negro, M.J.; Álvarez, C.; Ballesteros, I.; Romero, I.; Ballesteros, M.; Castro, E.; Manzanares, P.; Moya, M.; Oliva, J.M. Ethanol production from glucose and xylose obtained from steam exploded water-extracted olive tree pruning using phosphoric acid as catalyst. Bioresour. Technol. 2014, 153, 101–107. [Google Scholar] [CrossRef] [PubMed]
- Ballesteros, I.; Ballesteros, M.; Cara, C.; Sáez, F.; Castro, C.; Manzanares, P.; Negro, M.J.; Oliva, J.M. Effect of water on sugars recovery from steam exploded olive tree pruning. Bioresour. Technol. 2010, 101, 730–735. [Google Scholar] [CrossRef]
- Cara, C.; Ruiz, E.; Ballesteros, M.; Manzanares, P.; Negro, M.J.; Castro, E. Production of fuel bioethanol from steam-explosion pretreated olive tree pruning. Fuel 2008, 87, 692–700. [Google Scholar] [CrossRef]
- Chen, X.; Shekiro, J.; Pschorn, T.; Sabourin, M.; Tao, L.; Elander, R.; Park, S.; Jennings, E.; Nelson, R.; Trass, O.; et al. A highly efficient dilute alkali deacetylation and mechanical (disc) refining process for the conversion of renewable biomass to lower cost sugars. Biotechnol. Biofuels 2014, 7, 98. [Google Scholar] [CrossRef]
- Alvira, P.; Tomás-Pejó, E.; Ballesteros, M.; Negro, M.J. Pretreatment technologies for an efficient bioethanol production process based on enzymatic hydrolysis: A review. Bioresour. Technol. 2010, 101, 4851–4861. [Google Scholar] [CrossRef] [PubMed]
- Palmqvist, E.; Hahn-Hägerdal, B. Fermentation of lignocellulosic hydrolysates. II: Inhibitors and mechanisms of inhibition. Bioresour. Technol. 2000, 74, 25–33. [Google Scholar] [CrossRef]
- Silverstein, R.A.; Chen, Y.; Sharma-Shivappa, R.R.; Boyette, M.D.; Osborne, J. A comparison of chemical pretreatment methods for improving saccharification of cotton stalks. Bioresour. Technol. 2007, 98, 3000–3011. [Google Scholar] [CrossRef]
- Chen, Y.; Stevens, M.A.; Zhu, Y.; Holmes, J.; Xu, H. Understanding of alkaline pretreatment parameters for corn stover enzymatic saccharification. Biotechnol. Biofuels 2013, 6, 8. [Google Scholar] [CrossRef] [PubMed]
- Wang, C.; Wei, Q.; Liang, C.; Wang, Q.; Wang, W.; Wang, Z.; Yuan, Z. Impact of Alkaline Pretreatment Condition on Enzymatic Hydrolysis of Sugarcane Bagasse and Pretreatment Cost. Appl. Biochem. Biotechnol. 2021, 193, 2087–2097. [Google Scholar] [CrossRef] [PubMed]
- Júnior, A.D.N.F.; Etchelet, M.I.; Braga, A.F.M.; Clavijo, L.; Loaces, I.; Noya, F.; Etchebehere, C. Alkaline pretreatment of yerba mate (Ilex paraguariensis) waste for unlocking low-cost cellulosic biofuel. Fuel 2020, 266, 117068. [Google Scholar] [CrossRef]
- Kim, S.; Kim, C.H. Bioethanol production using the sequential acid/alkali pretreated empty palm fruit bunch fiber. Renew. Energy 2013, 54, 150–155. [Google Scholar] [CrossRef]
- Guo, B.; Zhang, Y.; Yu, G.; Lee, W.H.; Jin, Y.S.; Morgenroth, E. Two-stage acidic–alkaline hydrothermal pretreatment of lignocellulose for the high recovery of cellulose and hemicellulose sugars. Appl. Biochem. Biotechnol. 2013, 169, 1069–1087. [Google Scholar] [CrossRef]
- Jose, D.; Kitiborwornkul, N.; Sriariyanun, M.A. Review on Chemical Pretreatment Methods of Lignocellulosic Biomass: Recent Advances and Progress. Appl. Sci. Eng. Prog. 2022, 15, 6210. [Google Scholar] [CrossRef]
- Martínez-Patiño, J.C.; Ruiz, E.; Romero, I.; Cara, C.; López-Linares, J.C.; Castro, E. Combined acid/alkaline-peroxide pretreatment of olive tree biomass for bioethanol production. Bioresour. Technolol. 2017, 239, 326–335. [Google Scholar] [CrossRef]
- Sluiter, A.; Hames, B.; Ruiz, R.; Scarlata, C.; Sluiter, J.; Templeton, D.; Crocker, D. Determination of Structural Carbohydrates and Lignin in Biomass; Revised August 2012; National Renewable Energy Laboratory: Golden, CO, USA, 2012. [Google Scholar]
- Martínez-Patiño, J.C.; Romero-García, J.M.; Ruiz, E.; Oliva, J.M.; Álvarez, C.; Romero, I.; Negro, M.J.; Castro, E. High Solids Loading Pretreatment of Olive Tree Pruning with Dilute Phosphoric Acid for Bioethanol Production by Escherichia coli. Energy Fuels 2015, 29, 1735–1742. [Google Scholar] [CrossRef]
- Montané, D.; Overend, R.P.; Chornet, E. Kinetic Models for Non-Homogeneous Complex Systems with a Time-Dependent Rate Constant. Can. J. Chem. Eng. 1998, 76, 58–68. [Google Scholar] [CrossRef]
- Chen, S.F.; Mowery, R.A.; Chambliss, C.K.; van Walsum, G.P. Pseudo Reaction Kinetics of Organic Degradation Products in Dilute-Acid-Catalyzed Corn Stover Pretreatment Hydrolysates. Biotechnol. Bioeng. 2007, 98, 1135–1145. [Google Scholar] [CrossRef]
- Geddes, C.C.; Mullinnix, M.T.; Nieves, I.U.; Hoffman, R.W.; Sagues, W.J.; York, S.W.; Shanmugam, K.T.; Erickson, J.E.; Vermerris, W.E.; Ingram, L.O. Seed train development for the fermentation of bagasse from sweet sorghum and sugarcane using a simplified fermentation process. Bioresour. Technol. 2013, 128, 716–724. [Google Scholar] [CrossRef]
- Fernandes-Klajn, F.; Romero-García, J.M.; Díaz, M.J.; Castro, E. Comparison of fermentation strategies for ethanol production from olive tree pruning biomass. Ind. Crops Prod. 2018, 122, 98–106. [Google Scholar] [CrossRef]
- Martínez, A.; Grabar, T.B.; Shanmugam, K.T.; Yomano, L.P.; York, S.W.; Ingram, L.O. Low salt medium for lactate and ethanol production by recombinant Escherichia coli B. Biotechnol. Lett. 2007, 29, 397–404. [Google Scholar] [CrossRef] [PubMed]
- Romero-García, J.M.; López-Linares, J.C.; Contreras, M.M.; Romero, I.; Castro, E. Exploitation of olive tree pruning biomass through hydrothermal pretreatments. Ind. Crops Prod. 2022, 176, 114425. [Google Scholar] [CrossRef]
- Doménech, P.; Duque, A.; Higueras, I.; Fernández, J.L.; Manzanares, P. Analytical characterization of water-soluble constituents in olive-derived by-products. Foods 2021, 10, 1299. [Google Scholar] [CrossRef]
- Padilla-Rascón, C.; Ruiz, E.; Romero, I.; Castro, E.; Oliva, J.M.; Ballesteros, I.; Manzanares, P. Valorisation of olive stone by-product for sugar production using a sequential acid/steam explosion pretreatment. Ind. Crops Prod. 2020, 148, 112279. [Google Scholar] [CrossRef]
- López-Linares, J.C.; Ballesteros, I.; Tourán, J.; Cara, C.; Castro, E.; Ballesteros, M.; Romero, I. Optimization of uncatalyzed steam explosion pretreatment of rapeseed straw for biofuel production. Bioresour. Technol. 2015, 190, 97–105. [Google Scholar] [CrossRef]
- Lavergne, S.; Larsson, S.H.; Da Silva Perez, D.; Marchand, M.; Campargue, M.; Dupont, C. Effect of process parameters and biomass composition on flat-die pellet production from underexploited forest and agricultural biomass. Fuel 2021, 302, 121076. [Google Scholar] [CrossRef]
- Vargas, F.; Domínguez, E.; Vila, C.; Rodríguez, A.; Garrote, G. Agricultural residue valorization using a hydrothermal process for second generation bioethanol and oligosaccharides production. Bioresour. Technol. 2015, 191, 263–270. [Google Scholar] [CrossRef] [PubMed]
- Caparrós, S.; Ariza, J.; López, F.; Nacimiento, J.A.; Garrote, G.; Jiménez, L. Hydrothermal treatment and ethanol pulping of su flower stalks. Bioresour. Technol. 2008, 99, 1369–1372. [Google Scholar] [CrossRef]
- Lama-Muñoz, A.; Contreras, M.M.; Espínola, F.; Moya, M.; Romero, I.; Castro, E. Characterization of the lignocellulosic and sugars composition of different olive leaves cultivars. Food Chem. 2020, 329, 127153. [Google Scholar] [CrossRef]
- Gómez-Cruz, I.; Contreras, M.M.; Romero, I.; Castro, E. A biorefinery approach to obtain antioxidants, lignin and sugars from exhausted olive pomace. J. Ind. Eng. Chem. 2021, 96, 356–363. [Google Scholar] [CrossRef]
- Belkacemi, K.; Abatzoglou, V.N.; Overend, R.P.; Chornet, E. Phenomenological Kinetics of Complex Systems: Mechanistic Considerations in the Solubilization of Hemicelluloses following Aqueous/Steam Treatments. Ind. Eng. Chem. 1991, 30, 2416–2425. [Google Scholar] [CrossRef]
- Ruiz, H.E.; Galbe, M.; Garrote, G.; Ramirez-Gutierrez, D.M.; Ximenes, E.; Sun, S.N.; Lachos-Perez, D.; Rodríguez-Jasso, R.M.; Sun, R.C.; Yang, B.; et al. Severity factor kinetic model as a strategic parameter of hydrothermal processing (steam explosion and liquid hot water) for biomass fractionation under biorefinery concept. Bioresour. Technol. 2021, 342, 125961. [Google Scholar] [CrossRef] [PubMed]
- Wua, W.; Rondona, V.; Weeks, K.; Pullammanappallil, P.; Ingrama, L.O.; Shanmugam, K.T. Phosphoric acid based pretreatment of switchgrass and fermentation of entire slurry to ethanol using a simplified process. Bioresour. Technol. 2018, 251, 171–180. [Google Scholar] [CrossRef] [PubMed]
- Díaz-Villanueva, M.J.; Cara-Corpas, C.; Ruiz-Ramos, E.; Romero-Pulido, I.; Castro-Galiano, E. Olive tree pruning as an agricultural residue for bioethanol production. Fermentation of hydrolysates from dilute acid pretreatment. Span. J. Agric. Res. 2012, 10, 643–648. [Google Scholar] [CrossRef]
- Martínez-Patiño, J.C.; Romero, I.; Ruiz, E.; Cara, C.; Romero-García, J.M.; Castro, E. Design and Optimization of Sulfuric Acid Pretreatment of Extracted Olive Tree Biomass Using Response Surface Methodology. BioResources 2017, 12, 1779–1797. [Google Scholar] [CrossRef]
- Larsen, U.S.; Bruun, S.; Lindedam, J. Fermentation strategies for the efficient use of olive tree pruning biomass from a flexible biorefinery approach. Straw yield and saccharification potential for ethanol in cereal species and wheat cultivars. Biomass Bioenergy 2012, 45, 239–250. [Google Scholar] [CrossRef]
- Mamaní, A.; Maturano, Y.; Herrero, L.; Montoro, L.; Sardella, F. Increase in Fermentable Sugars of Olive Tree Pruning Biomass for Bioethanol Production: Application of an Experimental Design for Optimization of Alkaline Pretreatment. Period. Polytech. Chem. Eng. 2022, 66, 269–278. [Google Scholar] [CrossRef]
Figure 1.
Temperature profile during pretreatment in reactor.

Figure 2.
Glucose consumption and bioethanol yield of the detoxified prehydrolyzate.

Table 2.
Composition of OTP (raw material).
| Compounds | % Dry Weight | Compounds | % Dry Weight |
|---|---|---|---|
| Cellulose | 29.24 ± 0.05 | Lignin | 17.43 ± 0.43 |
| as glucose | 25.82 ± 0.05 | as AIL 1 | 15.03 ± 0.40 |
| Hemicellulose | 12.68 ± 0.48 | as ASL 2 | 2.40 ± 0.03 |
| as xylose | 10.98 ± 0.43 | Extractives | 29.50 ± 0.13 |
| as arabinose | 1.35 ± 0.16 | as aqueous (glucose free) | 26.19 (6.34) ± 0.41 (0.04) |
| as galactose | 1.34 ± 0.13 | as ethanolic | 3.31 ± 0.35 |
| as mannose | 0.60 ± 0.04 | Ash | 3.47 ± 0.26 |
| Acetyl groups | 2.00 ± 0.04 |
Mean values and standard deviations of three determinations. 1 AIL = acid-insoluble lignin. 2 ASL = acid-soluble lignin.
Table 3.
Experimental results of acid pretreatment.
| Run | SRA (%) | CS (min mol/L) | GS (%) | XS (%) | AIL (%) | Ash (%) | GE (%) |
|---|---|---|---|---|---|---|---|
| 1 | 41.30 | 200.26 | 40.26 | 0.22 | 49.77 | 1.07 | 17.02 |
| 2 | 56.40 | 30.59 | 33.15 | 5.56 | 34.05 | 3.27 | 8.28 |
| 3 | 41.05 | 202.09 | 35.32 | 0 | 52.05 | 1.15 | 17.64 |
| 4 | 31.83 | 827.12 | 26.08 | 0 | 61.33 | 1.13 | 24.39 |
| 5 | 39.83 | 318.27 | 40.07 | 0 | 51.65 | 0.45 | 21.01 |
| 6 | 33.48 | 832.76 | 26.49 | 0 | 62.64 | 0.67 | 23.32 |
| 7 | 51.71 | 50.92 | 32.72 | 3.11 | 39.25 | 3.74 | 11.22 |
| 8 | 45.09 | 174.38 | 41.14 | 0 | 48.43 | 1.25 | 17.95 |
| 9 | 51.76 | 181.39 | 47.59 | 0.05 | 45.54 | 0.84 | 17.20 |
| 10 | 55.93 | 34.26 | 34.05 | 7.81 | 35.45 | 2.73 | 12.00 |
| 11 | 42.57 | 165.53 | 41.71 | 0 | 46.38 | 1.33 | 17.59 |
| 12 | 42.01 | 244.46 | 41.43 | 0.73 | 48.76 | 3.41 | 19.46 |
| 13 | 52.25 | 79.84 | 39.10 | 4.46 | 38.77 | 2.31 | 17.99 |
SRA: solid recovered after acid pretreatment. CS: combined severity. GS: cellulose, as glucose, in solid residue. XS: hemicellulose, as xylose, in solid residue. AIL: lignin in solid residue. Ash: ash in solid residue. GE: dissolved solid residue per EH.
Table 4.
Models obtained for the analyzed responses after acid pretreatment (%).
| Response | β0 | β1 | β2 | β12 | β11 | β22 | ε | R2 | CV (%) |
|---|---|---|---|---|---|---|---|---|---|
| SRA | 41.64 | −7.99 | −4.11 | 1.21 | 2.16 | 0.920 | 0.994 | 2.11 | |
| Sqrt(CS) | 13.58 | 7.99 | 3.78 | 2.08 | 1.92 | −0.49 | 0.514 | 0.998 | 3.61 |
| GSR | 53.42 | −11.52 | −3.57 | −4.44 | −5.61 | 1.350 | 0.995 | 2.77 | |
| Sqrt(XSR + 0.04) | 0.200 | −2.14 | −0.72 | 1.53 | 1.32 | 0.027 | 1.000 | 1.42 | |
| AILR | 133.42 | 1.39 | 2.57 | 1.270 | 0.892 | 0.95 | |||
| AshR | 14.40 | −11.73 | −15.52 | −5.13 | 6.53 | 10.07 | 1.340 | 0.998 | 4.54 |
| GER | 28.14 | 1.97 | 3.61 | −4.25 | 0.561 | 0.989 | 1.81 | ||
| GLR | 32.89 | 0.65 | 0.96 | −0.69 | −0.33 | −1.16 | 0.144 | 0.997 | 0.45 |
| GalR | 204.84 | 40.62 | 19.8 | ||||||
| MalR | 109.12 | 43.01 | 39.4 | ||||||
| XLR | 73.14 | −5.89 | −8.71 | −16.13 | −22.78 | 3.290 | 0.989 | 5.91 | |
| AraR | 221.58 | −96.10 | −85.39 | −9.52 | 86.42 | 4.190 | 1.000 | 1.67 | |
| Ace | 2.620 | 0.40 | 0.90 | −0.38 | −0.36 | 0.086 | 0.994 | 3.84 | |
| HMF | 0.310 | 0.14 | −0.01 | −0.06 | 0.022 | 0.976 | 7.89 | ||
| For | 1.470 | 0.71 | 0.18 | −0.15 | 0.100 | 0.970 | 9.15 | ||
| Fur | 0.790 | 0.86 | 0.48 | 0.42 | 0.22 | 0.083 | 0.994 | 8.99 | |
| TGD | 13.69 | 10.87 | 2.61 | 5.14 | 5.94 | 1.16 | 0.002 | 1.000 | 0.008 |
| TXD | 26.86 | 19.34 | 12.89 | 13.06 | 12.94 | −4.47 | 0.511 | 1.000 | 1.59 |
Table 5.
Composition of acid prehydrolyzate (g/L).
| Run | GL | Gal | Man | XL | Ara | Ace | HMF | For | Fur |
|---|---|---|---|---|---|---|---|---|---|
| 1 | 15.24 | 5.39 | 1.19 | 12.27 | 5.41 | 2.55 | 0.28 | 1.39 | 0.72 |
| 2 | 14.07 | 3.14 | 0.43 | 8.09 | 4.65 | 0.17 | 0.10 | 0.36 | 0.06 |
| 3 | 14.24 | 3.58 | 0.98 | 10.53 | 4.50 | 2.06 | 0.29 | 1.38 | 0.71 |
| 4 | 15.94 | 3.22 | 0.40 | 3.11 | 1.45 | 2.41 | 0.51 | 1.35 | 2.39 |
| 5 | 15.41 | 6.83 | 2.90 | 10.12 | 5.57 | 3.12 | 0.19 | 1.46 | 1.52 |
| 6 | 15.63 | 4.06 | 0.93 | 3.25 | 2.31 | 3.24 | 0.36 | 2.63 | 2.81 |
| 7 | 14.04 | 5.08 | 1.82 | 9.28 | 10.48 | 0.64 | 0.21 | 0.94 | 0.15 |
| 8 | 14.16 | 3.53 | 0.99 | 10.52 | 4.45 | 2.55 | 0.33 | 1.53 | 0.76 |
| 9 | 15.89 | 5.02 | 1.55 | 12.56 | 6.17 | 2.76 | 0.33 | 1.54 | 0.94 |
| 10 | 14.44 | 5.11 | 1.55 | 8.57 | 6.84 | 1.30 | 0.12 | 0.57 | 0.06 |
| 11 | 15.85 | 3.71 | 1.03 | 11.13 | 4.51 | 2.16 | 0.31 | 1.32 | 0.73 |
| 12 | 15.41 | 5.19 | 1.13 | 11.51 | 5.73 | 1.36 | 0.55 | 1.43 | 1.03 |
| 13 | 15.62 | 3.65 | 0.61 | 10.46 | 4.86 | 2.40 | 0.25 | 0.69 | 0.17 |
GL: glucose. Gal: galactose. Man: mannose. XL: xylose. Ara: arabinose. Ace: acetic acid. HMF: hydroxymethylfurfural. For: formic acid. Fur: furfural.
Table 6.
Optimal conditions for maximizing glucose and xylose and minimizing inhibitors, and model results for the different responses.
Table 6.
Optimal conditions for maximizing glucose and xylose and minimizing inhibitors, and model results for the different responses.
| T = 130 °C, CA = 1.90% w/v | |||
|---|---|---|---|
| SRA (%) | 51.27 | GLR (%) | 31.73 |
| CS (min mol/L) | 53.80 | XLR (%) | 55.52 |
| GSR (%) | 59.25 | Ace (g/L) | 1.75 |
| XSR (%) | 15.52 | For (g/L) | 0.74 |
| AILR (%) | 131.78 | HMF (g/L) | 0.17 |
| AshR (%) | 33.71 | Fur (g/L) | 0.14 |
| GER (%) | 25.39 | ||
| TGD (%) | 9.02 | TXD (%) | 20.44 |
SRA: solid recovered after acid pretreatment. CS: combined severity. GSR, XSR, AILR, and AshR: glucose, xylose, lignin, and ash recovered in solids. GLR, XLR: glucose and xylose recovered in liquids. Ace: acetic acid. For: formic acid. HMF: hydroxymethylfurfural. Fur: furfural. GER: glucose recovered by EH. TGD: total glucose degraded. TXD: total xylose degraded.
Table 7.
Experimental results of alkaline pretreatment.
| Run | SRB (%) | CSB (min mol2/L2) | GSB (%) | AILB (%) | AshB (%) | GEB (%) |
|---|---|---|---|---|---|---|
| 1 | 57.47 | 9.96 | 51.60 | 37.38 | 4.8 | 31.31 |
| 2 | 74.95 | 2.07 | 49.52 | 38.75 | 3.75 | 19.69 |
| 3 | 57.42 | 9.96 | 54.45 | 37.63 | 5.86 | 31.63 |
| 4 | 53.44 | 14.95 | 46.68 | 36.46 | 12.79 | 39.29 |
| 5 | 46.39 | 32.49 | 53.18 | 28.08 | 7.88 | 41.62 |
| 6 | 47.37 | 28.73 | 69.80 | 21.81 | 8.98 | 40.45 |
| 7 | 79.44 | 0.87 | 49.03 | 39.5 | 3.23 | 19.89 |
| 8 | 57.63 | 10.29 | 51.82 | 36.12 | 5.81 | 39.03 |
| 9 | 59.52 | 9.96 | 50.47 | 35.55 | 6.09 | 39.23 |
| 10 | 60.17 | 7.25 | 52.61 | 36.66 | 6.31 | 34.79 |
| 11 | 57.91 | 10.10 | 55.96 | 36.51 | 5.73 | 33.77 |
| 12 | 69.06 | 3.13 | 52.25 | 39.68 | 3.04 | 23.52 |
| 13 | 50.03 | 18.17 | 56.33 | 29.05 | 7.43 | 41.59 |
Table 8.
Models obtained for the studied responses after alkaline pretreatment.
| Response | β0 | β1 | β2 | β12 | β11 | β22 | ε | R2 | CV (%) |
|---|---|---|---|---|---|---|---|---|---|
| SRB | 57.39 | −2.26 | −11.67 | 0.81 | 2.83 | 0.42 | 0.999 | 0.71 | |
| Sqrt(CSB) | 3.189 | 0.355 | 1.601 | 0.192 | 0.027 | 1.000 | 0.928 | ||
| GSBR | 80.06 | −2.48 | −12.99 | 3.36 | 0.934 | 4.10 | |||
| AILBR | 53.73 | −2.20 | −18.65 | 0.92 | 0.996 | 1.58 | |||
| AshBR | 117.65 | −10.45 | 16.13 | 18.87 | 6.56 | 0.939 | 5.57 | ||
| GEBR | 61.49 | 14.60 | 2.35 | 0.974 | 3.73 | ||||
| GEBRR | 49.22 | −1.52 | 3.70 | −0.36 | −1.90 |
Table 9.
Optimum to maximize glucose and solid residue, and value of responses.
| T = 130 °C, CB = 1.49% w/v | |||
|---|---|---|---|
| SRB (%) | 66.79 | AshBR (%) | 129.51 |
| CSB (min mol2/L2) | 4.46 | GEBR (%) | 54.00 |
| GSBR(%) | 89.20 | GEBRR (%) | 48.16 |
| AILBR (%) | 65.50 | TGDB (%) | 10.80 |
SRB: solid recovered after alkali pretreatment. CSB: combined severity. GSBR, AILBR, and AshBR: glucose, lignin, and ash recovered in solids. GEBR: glucose recovered by EH. GEBRR: glucose recovered by EH referred to WISA. TGDB: total glucose degraded.
Table 10.
Optimal conditions for maximizing glucose and xylose in solution and enzymatic hydrolysis and minimizing inhibitors.
Table 10.
Optimal conditions for maximizing glucose and xylose in solution and enzymatic hydrolysis and minimizing inhibitors.
| T = 130 °C, CA = 3% w/v | |||
|---|---|---|---|
| SRA (%) | 48.89 | GLR (%) | 32.40 |
| CS(min mol/L) | 76.02 | XLR (%) | 63.67 |
| GSR (%) | 60.22 | Ace(g/L) | 2.38 |
| XSR (%) | 19.88 | For(g/L) | 0.78 |
| AILR (%) | 134.60 | HMF(g/L) | 0.10 |
| AshR (%) | 32.17 | Fur(g/L) | 0.21 |
| GER (%) | 34.04 | ||
| TGD (%) | 7.39 | TXD (%) | 15.83 |
Table 11.
Comparison between acid pretreatment and sequential acid–alkali pretreatment, at their optimum operating conditions, for 1 kg of raw material (OTP).
Table 11.
Comparison between acid pretreatment and sequential acid–alkali pretreatment, at their optimum operating conditions, for 1 kg of raw material (OTP).
| Acid Pretr. | Sequential Pretr. | |||
|---|---|---|---|---|
| WISA (g) | 488.90 | 532.20 | ||
| Glucose (g) | 104.20 | 102.05 | ||
| Xylose (g) | 69.91 | 60.96 | ||
| WISB (g) | 355.45 | |||
| Glucose by EH (g) | 87.88 | 98.97 | ||
| WISA after EH (g) | 401.02 | |||
| WISB after EH (g) | 256.48 | |||
| Glucose (g) | 105.77 | 26.38% | 84.32 | 32.88% |
| Xylose (g) | 21.83 | 5.44% | 0.00% | |
| Lignin (g) | 202.31 | 50.45% | 136.20 | 53.10% |
| Ash (g) | 11.16 | 2.78% | 19.64 | 7.66% |
Table 12.
Concentration and bioethanol yield from OTP prehydrolyzates found in other studies.
| Reference | Raw Material | Pretreatments Conditions | Prehydrolyzate Detoxification | Microorganism | Bioethanol (g/L) | YEmax% (Time) |
|---|---|---|---|---|---|---|
| [48] | OTP | 20% S/L, 180 °C, 10 min [H2SO4] 1% w/v | Overliming | P. tannophilus | 11.16 | 80 (24 h) |
| P. stipitis | 13.90 | 78 (24 h) | ||||
| [34] | Alkaline extracted OTP | 15% S/L, 164 °C, 10 min [H2SO4] 0.9% w/v | Ammonium hydroxide | E. coli SL100 | 21.6 | 80 (24 h) |
| [49] | Water extracted OTP | 15% S/L, 160 °C, 10 min [H2SO4] 4% w/v | Overliming | E. coli MM160 | 14.5 | 88 (48 h) |
| [30] | Water extracted OTP | 30% S/L, 170 °C, 10 min [H3PO4] 0.5% w/v | Overliming | E. coli MS04 | 23 | 90 (72 h) |
| [15] | Water extracted OTP | 60% S/L, 175 °C, 10 min [H3PO4] 1% w/v | Alkali | P. stipitis CBS 6054 | 6 | 57 (48 h) |
| 60% S/L, 195 °C, 10 min [H3PO4] 1% w/v | Ion-exchange resin | 6.5 | 61 (28 h) | |||
| [17] | Water extracted OTP | Steam explosion 200 °C, 40 min | None | S. cerevisiae | 18 | 88 (48 h) |
| [50] | Water extracted OTP | Steam explosion 195 °C, 10 min impregnated with H3PO4 | Ion-exchange resin | S. cerevisiae F12 | 7.5 | 63 (40 h) |
Table 13.
Bioethanol yield from hydrolyzates of OTP obtained by separate EH and fermentation process.
Table 13.
Bioethanol yield from hydrolyzates of OTP obtained by separate EH and fermentation process.
| Reference | Raw Material | Pretreatment | Microorganism | YEmax% (Time) |
|---|---|---|---|---|
| [7] | OTP | Liquid Hot Water | S. cerevisiae | 90 (24 h) |
| Dilute Acid (H2SO4) | 86 (24 h) | |||
| [14] | OTP | Alkaline Ca(OH)2 | D. vanrijiae BDv151 | 80 (72 h) |
| S. cerevisiae BSc114 | 76 (72 h) | |||
| S. cerevisiae | 100 (72 h) | |||
| [51] | OTP | Alkaline Ca(OH)2 | S. cerevisiae BSc114 | 69 (72 h) |
| [30] | Water extracted OTP | Dilute Acid (H3PO4) | E. coli MS04 | 90 (24 h) |
Disclaimer/Publisher’s Note: The statements, opinions and data contained in all publications are solely those of the individual author(s) and contributor(s) and not of MDPI and/or the editor(s). MDPI and/or the editor(s) disclaim responsibility for any injury to people or property resulting from any ideas, methods, instructions or products referred to in the content. |
© 2023 by the authors. Licensee MDPI, Basel, Switzerland. This article is an open access article distributed under the terms and conditions of the Creative Commons Attribution (CC BY) license (https://creativecommons.org/licenses/by/4.0/).
Share and Cite
MDPI and ACS Style
Díaz, M.J.; Ferrero, P.M.; Moya, M. Sequential Acid/Alkali Pretreatment for an Olive Tree Pruning Biorefinery. Agronomy 2023, 13, 2682. https://0-doi-org.brum.beds.ac.uk/10.3390/agronomy13112682
AMA Style
Díaz MJ, Ferrero PM, Moya M. Sequential Acid/Alkali Pretreatment for an Olive Tree Pruning Biorefinery. Agronomy. 2023; 13(11):2682. https://0-doi-org.brum.beds.ac.uk/10.3390/agronomy13112682
Chicago/Turabian StyleDíaz, Manuel J., Pedro M. Ferrero, and Manuel Moya. 2023. "Sequential Acid/Alkali Pretreatment for an Olive Tree Pruning Biorefinery" Agronomy 13, no. 11: 2682. https://0-doi-org.brum.beds.ac.uk/10.3390/agronomy13112682
Note that from the first issue of 2016, this journal uses article numbers instead of page numbers. See further details here.