1. Introduction
Common dry bean (
Phaseolus vulgaris L.) is a sustainable crop, as it can be grown with less irrigation and fertilizer than many other crops, is a good rotation crop due to its nitrogen fixing capabilities (up to 44 kg∙ha
−1) and can break some common disease cycles (such as Verticillium wilt caused by
Verticillium dahliae Kleb.) [
1,
2,
3,
4]. Dry bean is also important in the human diet and is a good source of protein (18%–22%), dietary fiber, minerals (such as potassium, zinc and iron) and B vitamins (such as folic acid and B
12) [
5]. Dry bean is one of a few pulse crops (other pulse crops include common dry pea (
Pisum sativum), garbanzo bean or chickpea (
Cicer arietinum) and lentil (
Lens culinaris)) that can be grown successfully in relatively cool regions, such as northwest Washington.
In Washington, most dry beans are grown on a large scale in the Columbia Basin of eastern Washington, which accounted for 1.5% (9300 ha) of the dry beans produced in the U.S. in 2013 [
6]. However, there is small-scale production of dry beans in every region of Washington, including northwest Washington, where dry beans have been grown organically on a small scale for over 100 years [
7,
8]. Regional heirloom dry bean varieties include a wide diversity of market classes, including navy, black, pinto and unique color-patterned types. Currently, in northwest Washington, organic heirloom and color-patterned varieties are sold at regional farmer’s markets for $10–$30 per kg [
9].
Grower experience suggests that local heirloom dry bean varieties are well adapted to the northwest Washington climate; however, available varieties have not been previously evaluated in systematic trials. Skagit County is the largest agricultural production region in northwest Washington and accounted for 19% of Washington State’s vegetable production in 2012 [
6]. The region has a cool, maritime climate with coastal influences from the Puget Sound (mean maximum of 23 °C in July and 24 °C in August at Mount Vernon, situated in the center of the Skagit Valley), with approximately 1300 growing degree days (GDD) (base 10 °C) during the dry bean growing period (mid-May–mid-September) [
10,
11]. In contrast, there are 1800–2800 GDD in the major dry bean growing regions in eastern Washington. The mean annual rainfall at Mount Vernon is 840 mm, with 110 mm occurring in June, 75 mm in July and 90 mm in August [
11]. It is common practice for farmers in this region to not irrigate dry beans, as the presence of heavy dew, combined with precipitation and relatively low temperatures during the summer months, provides adequate moisture for crop production most years [
12].
Heirloom dry bean varieties are an important crop genetic resource and are valued for local adaption, distinct colors and patterns, their use in traditional cooking and for providing a sense of self-sufficiency [
13,
14,
15,
16]. Dry beans were moved from their centers of origin, Central and South America, to North America through the migration of peoples up through Mexico, and they were moved to Europe, Africa and Asia by European explorers beginning in the 1500s [
17,
18,
19,
20]. Dry beans are a unique crop in that the bean is both the food and the seed crop, and they can be stored for several years with minimal processing. While dry beans remain an important component of sustainable farming systems worldwide, there is limited information regarding the performance of heirloom dry bean varieties, especially in modern organic production systems in the U.S. In Michigan, two heirloom varieties (“Michelite”, a navy bean released in 1938, and “T-39”, a 1970s “Black Turtle Soup” selection from California) and 30 newer varieties were compared in an organic field study [
21]. The yields of “Michelite” (1514 kg·ha
−1) and “T-39” (yield not stated) were less than the overall mean (1909 kg·ha
−1), and the authors concluded that modern varieties appeared to be better suited to organic production due to improved disease resistance, plant architecture that keeps pods off the ground for better mechanical harvest and less pod mold and better allocation of biomass to the seed.
Irrigation is an important consideration for sustainable production systems. Dry bean yield and days to harvest (DTH) have been investigated in several regions of the U.S. under both irrigated and non-irrigated conditions. An irrigated field trial of 25 great northern, pink, pinto and red dry bean varieties from three locations in southern Idaho found a mean yield of 3465 kg·ha
−1, and the mean DTH was 93 [
22]. In a comparison of irrigated and non-irrigated production systems in North Dakota, the mean yield of 20 dry bean varieties was 3069 kg·ha
−1 with irrigation and 2642 kg·ha
−1 without irrigation [
23]. DTH was 87 under dryland and 100 under irrigation. In Michigan, two irrigated trials with 36 dry bean varieties were evaluated under organic and conventional production practices, and the mean yield was 2455 kg·ha
−1 for the organic system and 2700 kg·ha
−1 for the conventional system [
24].
There is high demand for local organic crops throughout the U.S., and demand for organic and nutritious staple crops has opened a market opportunity for dry beans [
25]. In western Washington, locally-grown dry beans are sold at farmers’ markets, as well as to institutions (schools, hospitals,
etc.) [
9]. Cooking time is important to consumers who are purchasing beans in the dry form, especially for institutions, such as schools, that are preparing large quantities of beans. While several studies have investigated the influence of storage on cooking qualities, no studies have evaluated the cooking time of heirloom varieties [
26,
27]. The protein content of heirloom dry bean varieties is also generally unknown in comparison to newer varieties [
28]. In a study in northwest Spain, an heirloom dry bean “Ganxet” had a higher protein level (28%) than the newer standard white kidney, navy and Tolosa black varieties (25% mean) [
13].
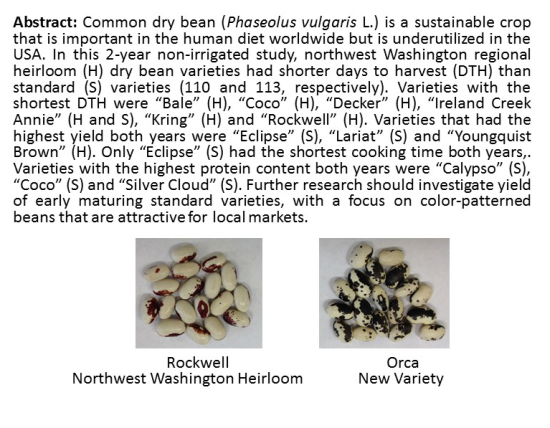
In this study, dry bean varieties that have been grown in northwest Washington for 20–130 years were compared to standard varieties (seed grown outside the region) in the same market class, to determine which may be best suited for organic production in this region. Varieties were also measured for cooking time and protein content, as these are important considerations for consumers.
2. Materials and Methods
The experiment was carried out at Washington State University (WSU) Northwestern Washington Research and Extension Center (NWREC) at Mount Vernon. The field site was transitioned to certified organic during the study and was eligible for organic certification in fall 2014. The soil type is a silt loam, recently developed from alluvium and volcanic ash [
29]. The field elevation was approximately 9 m above sea level and situated in the flood plains of the Skagit River, with a water table at 90–120 cm below the surface during the summer season.
Experimental design: The experiment utilized a randomized complete block design with four replications and was repeated 2 years (2013 and 2014). Plots were four rows wide and 3 m in length. Heirloom varieties were collected from growers in five counties (Clallam, Island, San Juan, Skagit and Whatcom) in northwest Washington, where they had been grown at each site as early as 1880 and as recently as 1990 [
8]. A total of 13 heirloom (H) varieties were collected and planted in the first study year, each matched as closely as possible with a standard (S) variety in the same market class (
Table 1); however, four heirloom varieties did not germinate well or had a climbing growth habit in the field plots and, so, were dropped from the study. A total of 20 dry bean varieties were included both years: 9 heirloom and 11 standard varieties.
Table 1.
Heirloom dry bean varieties collected from counties in northwest Washington, USA, the date each heirloom variety was first grown in the region and standard varieties in the same market classes.
Table 1.
Heirloom dry bean varieties collected from counties in northwest Washington, USA, the date each heirloom variety was first grown in the region and standard varieties in the same market classes.
| Heirloom | County Collected | Date Introduction | Standard Variety | Market Class |
|---|
| Bale | Skagit | 1920s | Etna | Cranberry |
| Decker | Skagit | 1990 | Etna | Cranberry |
| Kring’s Cranberry | San Juan | 1900s | Etna | Cranberry |
| Price’s Soldier 1 | Skagit | 1920s | Soldier | Soldier |
| Wally’s Soldier 1 | Clallam | 1940s | Soldier | Soldier |
| Rockwell | Island | 1880s | Soldier 2 | White with Partial Color |
| Hutterite | Skagit | 1990 | Hutterite | Yellow |
| Ireland Creek Annie | Skagit | 1990 | Ireland Creek Annie | Yellow |
| Youngquist Swedish Brown | Skagit | 1880s | Swedish Brown | Brown |
| Coco | Skagit | 1980 | Coco | Black |
| Skyriver Black | San Juan | 1990 | Eclipse | Black |
| Cannellinni 1 | San Juan | 1990 | Silver Cloud 3 | White Kidney |
| Calypso 1 | Skagit | 1990 | Calypso | Black and White |
| | | | Orca 3 | White with Partial Color |
| | | | Lariat 3 | Pinto |
Planting and field maintenance: Beans were direct-seeded by hand 22 May 2013 and 15 May 2014. Both years, spacing in the row was 5 cm, and seeding depth was 5 cm. Rows were spaced 76 cm center-to-center in 2013 and 86 cm in 2014; spacing between rows was increased in the second year to provide better tractor access for cultivation to control weeds. Both years, the seed was inoculated with a granular Rhizobium spp. blend (Guard-N; Johnny’s Select Seeds, Winslow, ME, USA). Plots were side dressed with organic fertilizer (Proganic 8N-0.9P-3.3K; Wilbur-Ellis, Mount Vernon, WA, USA) 21 days after planting (DAP) at a rate of 51 kg N·ha−1 in 2013 and 60 kg N·ha−1 in 2014. For weed control, tractor cultivation was done between rows with a 2-headed rototiller 6 and 21 DAP in 2013 and 14 and 36 DAP in 2014. In 2014, to reduce in-row weed pressure, plants were hilled (5–8 cm) 41 DAP with 25-cm discs mounted on a cultivation tractor (Allis-Chalmers G; Briggs and Stratton, Wauwatosa, WI, USA). Hand weeding was done within rows 42 and 75 DAP in 2013 and 53 DAP in 2014. The study was not irrigated either year, following common grower practices in the region.
Plant growth, flowering and yield: Data were collected from the center 1.5 m of the center 2 rows of each plot. Each year, emergence was measured twice weekly in each plot until 85% of seeds emerged. Fifty percent flowering was recorded for each plot when half of the plants had one flower (55 DAP in 2013 and 66 DAP in 2014); plant height was measured for 10 randomly-selected plants when all varieties had reached 50% flowering. Height was measured from the base of the plant to the top node by straightening the plant.
The center 1.5 m of the center 2 rows in each plot was harvested by hand when beans in the plot were dry, but before pod shatter. Plants from each plot were placed in a burlap sack and dried at 41 °C for 36 h or until the stems snapped and bean seed moisture content was approximately 12%. Whole dry plants were fed through a chipper-mulcher (Model 500; Roto-Hoe, Newbury, OH, USA) that had been converted to a small-scale standing thresher [
30]. The large debris was removed, and beans were separated from small debris with a small-scale standing cleaner [
31]. Beans were then sorted by hand, and moldy, split and immature beans were removed. The marketable yield and weight of 100 representative beans were recorded for each plot.
Bean cooking time, firmness and protein content: Six months after harvest in 2013 and 2014, bean cooking time was measured using a Mattson Bean Cooker (MBC) (Canadian Grain Commission, Vancouver, British Columbia, Canada). Bean varieties with a sufficient number of beans in at least three replicates were included in this measurement and included four heirloom and four standard varieties in the same market class, as well as one heirloom and seven standard varieties in different market classes (16 varieties total). For each replicate sample, 55 g of beans were placed in a separate 250-mL plastic bottle with 125 mL deionized (DI) water and soaked at room temperature for 12 h; the beans were then strained and patted dry. Beans that had absorbed water were selected and placed on the MBC cooking rack, with one “pin” placed on top of each bean. The MBC was placed into an electric cooking pot (Model DCP-6; Dazey Products Co., Industry Airport, KS, USA) filled within 5 cm from the top with boiling (205 °C) DI water; the temperature was immediately reduced to 150 °C (boiling point). For each sample, when 80% of the pins pierced the beans, this time was recorded as the cooking time for that sample [
32]. The MBC was then removed immediately from the water, the beans were placed into a plastic weighing dish, which was inserted into a small plastic bag and placed in the freezer (0 °C) for approximately three minutes to prevent further cooking. Firmness of all 25 beans per sample was measured with a mechanical force gauge (L-500; Ametek, Hunter Spring Division, Hatfield, PA, USA) using a needle sharp tip (FG-M6PUNCTURE-ST; Shimpo, Kyoto, Japan) mounted on a drill press (Craftsmen Model 9-25921; Sears, Roebuck, and Co., Chicago, IL, USA). Firmness was recorded in units of gram force, averaged for each sample, and converted to Newtons (N) by multiplying by 9.807 × 10
−3.
Percent protein (g protein per 100 g uncooked dry beans) was measured for three replicates of the same 16 bean varieties as were evaluated for cooking time. Samples (175 g) of whole uncooked dry beans from each plot were analyzed by a commercial laboratory (Soiltest Farm Consultants, Inc., Moses Lake, WA, USA) eight months after harvest.
Statistical analysis: All data were analyzed using JMP (JMP v. 11.2.0, SAS Institute Inc., Cary, NC, USA) with α = 0.05. Means were separated using the least significant difference test. When data violated the assumptions of ANOVA, a transformation was used for analysis following the range method outlined by Kirk [
33].
3. Results
There were significant differences due to variety type (heirloom (H) and standard (S) varieties) for some parameters measured and due to variety and year for most parameters. Except for plant height, there were no significant interactions between type and year but there were many significant interactions between year and variety (
Table 2).
Table 2.
ANOVA tests and means for days after planting (DAP) to 50% flower, plant height (cm) at 50% flowering, days to harvest (DTH), yield (kg·ha−1), cooking time with a Mattson bean cooker (MBC), bean firmness after cooking with MBC and protein content (%) of five heirloom and 11 standard dry bean varieties grown at Washington State University Northwestern Washington Research and Extension Center, Mount Vernon, WA, USA, in 2013 and 2014.
| Effect | DAP to 50% Flower y | Plant Height (cm) | DTH | Yield (kg ha−1) | MBC Time (min) | MBC Firmness (N) | Protein (%) |
|---|
| | p-value z |
| Type | 0.0570 | 0.0398 | 0.0353 | 0.7049 | 0.4593 | 0.3510 | 0.0893 |
| Variety | <0.0001 | <0.0001 | <0.0001 | <0.0001 | 0.008 | 0.0005 | <0.0001 |
| Year | <0.0001 | 0.3889 | 0.0097 | <0.0001 | <0.0001 | <0.0001 | 0.0058 |
| Type × Year | 0.8375 | 0.0025 | 0.3341 | 0.5794 | 0.2146 | 0.7262 | 0.0973 |
| Year × Variety | 0.0002 | <0.0001 | 0.0968 | 0.0158 | <0.0001 | 0.0330 | <0.0001 |
| Type | Mean x |
| Heirloom | 51 | 35 | 110 y | 1852 | 25.9 | 8.0 | 20.3 |
| Standard | 54 | 36 | 113 | 1983 | 21.7 | 7.4 | 20.7 |
| Year | Mean x |
| 2013 | 54 | 36 | 113 y | 2268 | 19.7 | 8.6 | 21.2 |
| 2014 | 52 | 35 | 110 | 1625 | 26.3 | 6.6 | 20.0 |
Plant Emergence and Growth: In 2013, the mean emergence for all varieties at 12 DAP was 13% with a range of 0%–31%, and all varieties reached 85% emergence by 26 DAP. In 2014, almost all varieties reached 85% emergence by 12 DAP; Hutterite (H) reached only 50% emergence at 12 DAP and did not reach 85% emergence. Although soil temperature (5-cm depth) was above the recommended level for beans (13 °C) both years, soil temperature was lower at planting in 2013 (14 °C) than in 2014 (19 °C). There was no difference between heirloom and standard varieties in DAP to 50% flowering (
p = 0.06), but standard varieties were slightly taller at 50% flowering than heirloom varieties (
p = 0.04) (
Table 2). There was a significant difference in mean days to 50% flower due to year (54 DAP and 36 cm, respectively;
p < 0.0001), but not in plant height. Varieties differed in DAP to 50% flowering and in plant height (
p < 0.0001, both), and there was a significant interaction between year and variety for both (
p = 0.0002 and
p < 0.0001, respectively). In 2013 the range in DAP to 50% flower was 50–62, and the range in plant height was 27–45 cm (
p < 0.0001) (
Table 3). In 2014, the range in DAP to 50% flower was 49–61, and the range in plant height was 22–57 cm (
p < 0.0001) (
Table 3). The overall mean air temperature was similar for May, June and July both years (16 °C in 2013 and 17 °C in 2014), and the growing degree days (GDD; base 10 °C) were slightly less for this time period in 2013 (822 GDD) as compared to 2014 (895 GDD).
Table 3.
Mean days after planting (DAP) to 50% flower, plant height (cm) at 50% flowering and protein content (%) of nine heirloom and 11 standard dry bean varieties grown at Washington State University Northwestern Washington Research and Extension Center, Mount Vernon, WA, USA, in 2013 and 2014. H, heirloom varieties; S, standard varieties.
| Variety | 50% Flowering (DAP) z,y | Height (cm) | Protein (%) |
|---|
| 2013 | 2014 | 2013 | 2014 | 2013 | 2014 |
|---|
| Bale (H) | 50 e x | 49 c | 42.4 ab | 28.0 de | 19.47 efg | 20.43 de |
| Calypso (S) | 50 e | 49 c | 36.3 cdefg | 24.2 bc | 25.46 ab | 23.41 a |
| Coco (H) | 51 cde | 49 c | 34.3 defgh | 34.3 fgh | 24.57 abc | 22.71 ab |
| Coco (S) | 50 e | 49 c | 33.5 fgh | 33.7 fgh | -- w | -- |
| Decker (H) | 51 cde | 49 c | 36.4 bcdefgh | 21.6 a | -- | -- |
| Eclipse (S) | 62 a | 61 a | 26.5 i | 45.1 jk | 21.26 de | 17.24 h |
| Etna (S) | 59 b | 49 c | 37.3 bcdef | 26.7 cd | 18.24 gh | 19.23 f |
| Hutterite (H) | 51 cde | 49 c | 26.5 i | 30.5 def | -- | -- |
| Hutterite (S) | 55 bcd | 52 b | 36.0 defg | 43.2 ij | 18.89 fgh | 16.98 h |
| Ireland Creek Annie (H) | 50 e | 49 c | 38.6 abcdef | 30.5 def | -- | -- |
| Ireland Creek Annie (S) | 50 e | 50 bc | 39.8 bcde | 27.9 de | 19.42 efg | 18.78 fg |
| Kring (H) | 51 de | 49 c | 37.3 bcdef | 23.5 ab | 20.81 def | 21.31 cd |
| Lariat (S) | 57 bc | 61 a | 41.8 abc | 73.7 l | 17.11 h | 17.63 gh |
| Orca (S) | 62 a | 61 a | 28.3 hi | 34.3 fgh | 21.24 de | 21.88 bc |
| Rockwell (H) | 50 e | 49 c | 39.5 bcde | 29.8 def | 20.20 efg | 21.63 bc |
| Silver Cloud (S) | 51 de | 52 b | 31.5 ghi | 36.2 ghi | 26.36 a | 23.26 a |
| Skyriver (H) | 51 de | 49 c | 40.3 abcd | 38.1 hij | 22.83 cd | 21.41 cd |
| Soldier (S) | 51 de | 49 c | 34.3 efg | 36.2 ghi | 23.86 bc | 19.60 ef |
| Swedish Brown (S) | 53 bcd | 49 c | 30.8 ghi | 31.8 efg | 20.87 def | 17.74 gh |
| Youngquist Brown (H) | 62 a | 61 a | 45.4 a | 56.6 kl | 18.35 gh | 17.08 h |
| Mean of Response | 54 | 52 | 36 | 35.3 | 21.15 | 20.02 |
| p Value | <0.0001 | <0.0001 | <0.0001 | <0.0001 | <0.0001 | <0.0001 |
| Transformation | Rank | Rank | None | Reciprocal | None | None |
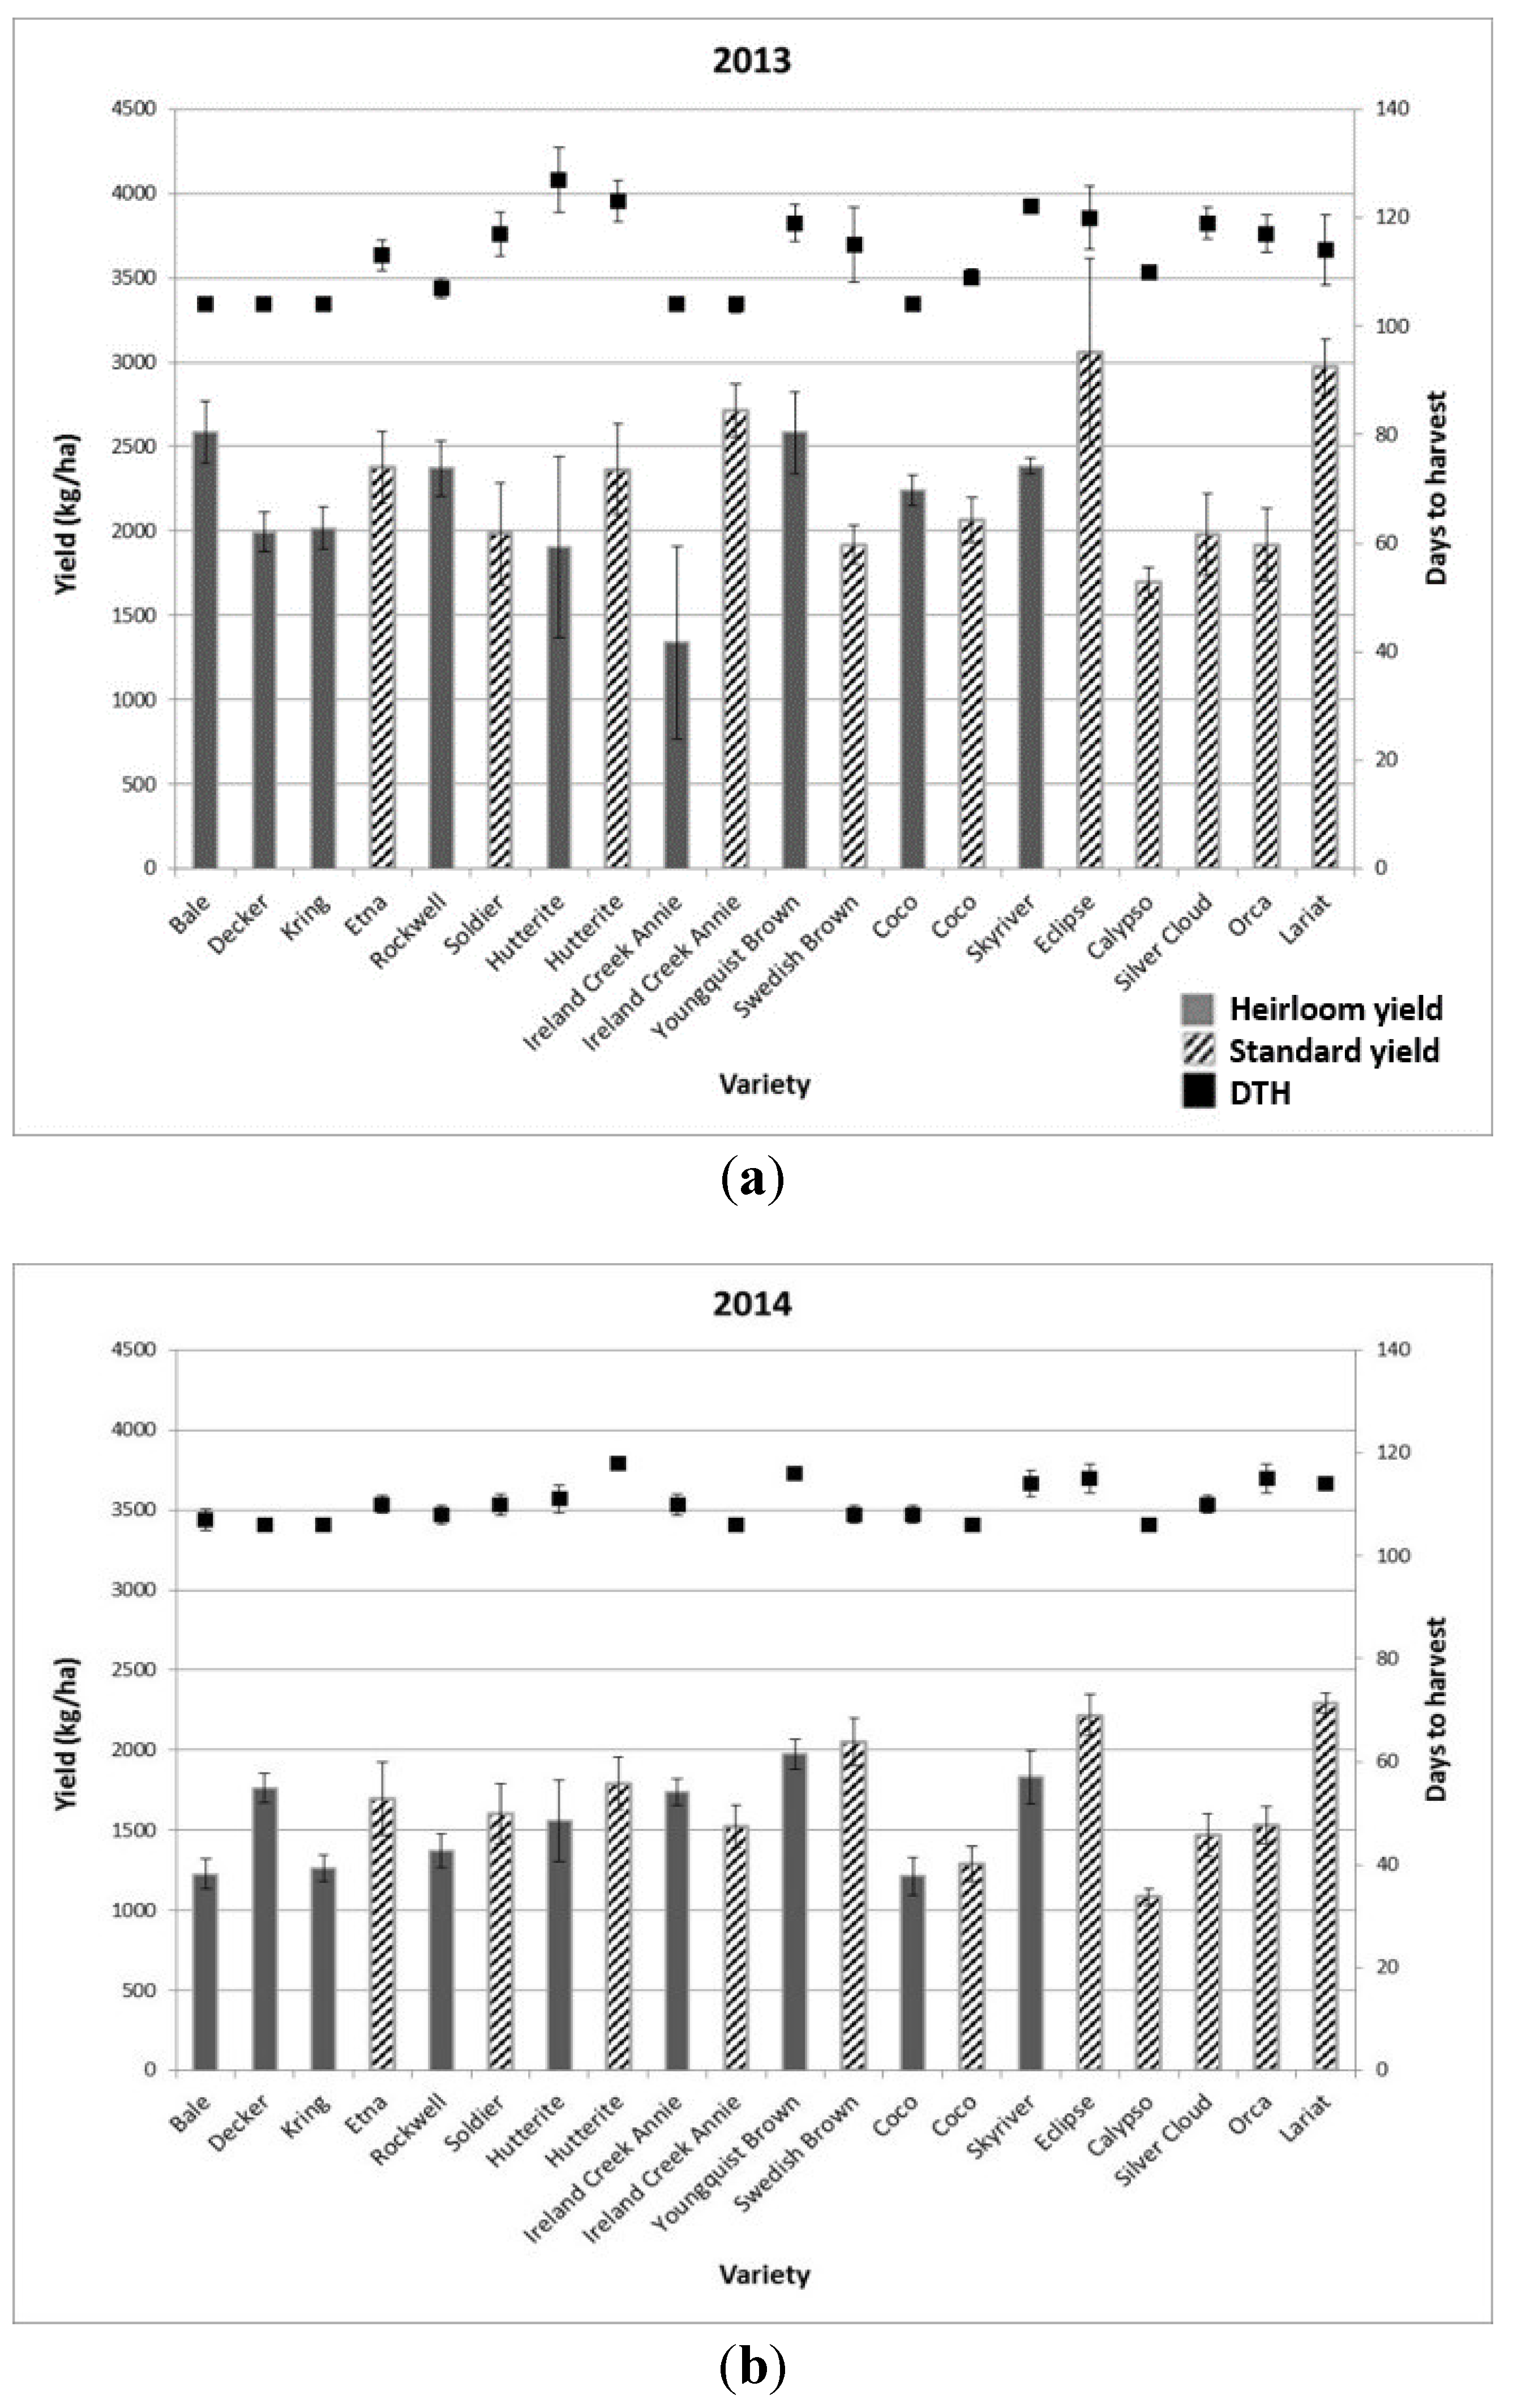
Days to harvest and yield: Overall for both years, heirloom varieties were harvested three days earlier than standard varieties (110 DTH and 113 DTH, respectively;
p = 0.04) (
Table 2). The average for all varieties was 113 DTH (13 September) in 2013 with a range of 104–127 DTH, as compared to 110 DTH (2 September) in 2014 with a range of 106–118 DTH (
p < 0.0001 both) (
Figure 1). While the overall mean air temperature for the growing season was similar both years (16 °C in 2013 and 17 °C in 2014), accumulated GDD for the growing season were slightly lower in 2013 (1490 GDD) as compared to 2014 (1524 GDD). There was no significant interaction for DTH between variety and year (
p = 0.10;
Table 2). Varieties with the shortest DTH both years were “Bale” (H), “Coco” (H), “Decker” (H), “Ireland Creek Annie” (H), “Ireland Creek Annie” (S), “Kring” (H) and “Rockwell” (H); while varieties with the longest DTH both years were “Eclipse” (S), “Hutterite” (S) “Skyriver” (H), “Youngquist Brown” (H) and “Orca” (S) (
Figure 1).
Figure 1.
Days to harvest and mean yield of heirloom and standard dry bean varieties at Washington State University Northwestern Washington Research and Extension Center, Mount Vernon, WA, USA in 2013 (
a) and 2014 (
b); varieties differed significantly both years (
p < 0.0001 for all). All data were analyzed using JMP (JMP v. 11.2.0, SAS Institute Inc., Cary, NC, USA) with α = 0.05. When data violated the assumptions of ANOVA, a transformation was used for analysis following the range method outlined by Kirk [
33]. All means are non-transformed. Error bars are based on the standard deviation.
Overall yield of heirloom varieties (1852 kg·ha
−1) did not differ significantly from standard varieties (1983 kg·ha
−1) (
p = 0.70); there was no significant difference between type either year (
p = 0.75 and
p = 0.20, respectively); and there was no interaction between type and year (
p = 0.58) (
Table 2). Mean yield for all varieties was significantly greater in 2013 (2268 kg·ha
−1) than in 2014 (1625 kg·ha
−1) (
p < 0.0001); yield differed significantly among varieties each year (
p = 0.002 and
p < 0.0001, respectively); and there was a significant interaction between variety and year (
p = 0.02) (
Table 2 and
Figure 1). Varieties that were high yielding both years were “Eclipse” (S), “Lariat” (S) and “Youngquist Brown” (H); while only “Calypso” (S) was low yielding both years. While there were 11% more plants per hectare in 2013 than in 2014 (approximately 263,000 and 233,000 plants per hectare, respectively), due to different between-row spacing each year (76 cm and 86 cm, respectively), yield was 30% greater in 2013. There was little difference in mean temperature for the growing season both years (16 °C and 17 °C, respectively), and while precipitation was essentially equal both years (232 mm and 249 mm, respectively), there was no rainfall in July 2013, while there was 32 mm of rainfall in July 2014. Other studies have found that dry bean yield did not increase when plant populations increased from 168,000–240,000 plants per ha
−1 [
34] or from 222,000–296,000 plants per ha
−1 [
35]. The result from this study suggests that optimal planting density needs to be determined in northwest Washington; however, in organic production systems row spacing must be adequate to allow for mechanical weed control, and thus, plant population is likely to be determined by equipment needs and not yield optimization.
Bean cooking time, firmness and protein content. Cooking time measured with the MBC for heirloom varieties (26 min) did not differ significantly from standard varieties (22 min) (
p = 0.46); there was no significant difference between type either year (
p = 0.13 both years); and there was no significant interaction between type and year (
p = 0.21) (
Table 2). There was a significant difference in mean cooking time for all varieties (
p = 0.008); mean cooking time was faster in 2013 (20 min) than 2014 (26 min) (
p < 0.0001); and there was a significant interaction between variety and year (
p < 0.0001) (
Table 2). Only “Eclipse” (S) had the shortest cooking time both years, while “Rockwell” (H), “Silver Cloud” (S) and “Soldier” (S) had short cooking time in 2013, and “Orca” (S) and “Youngquist Brown” (H) had short cooking times in 2014 (
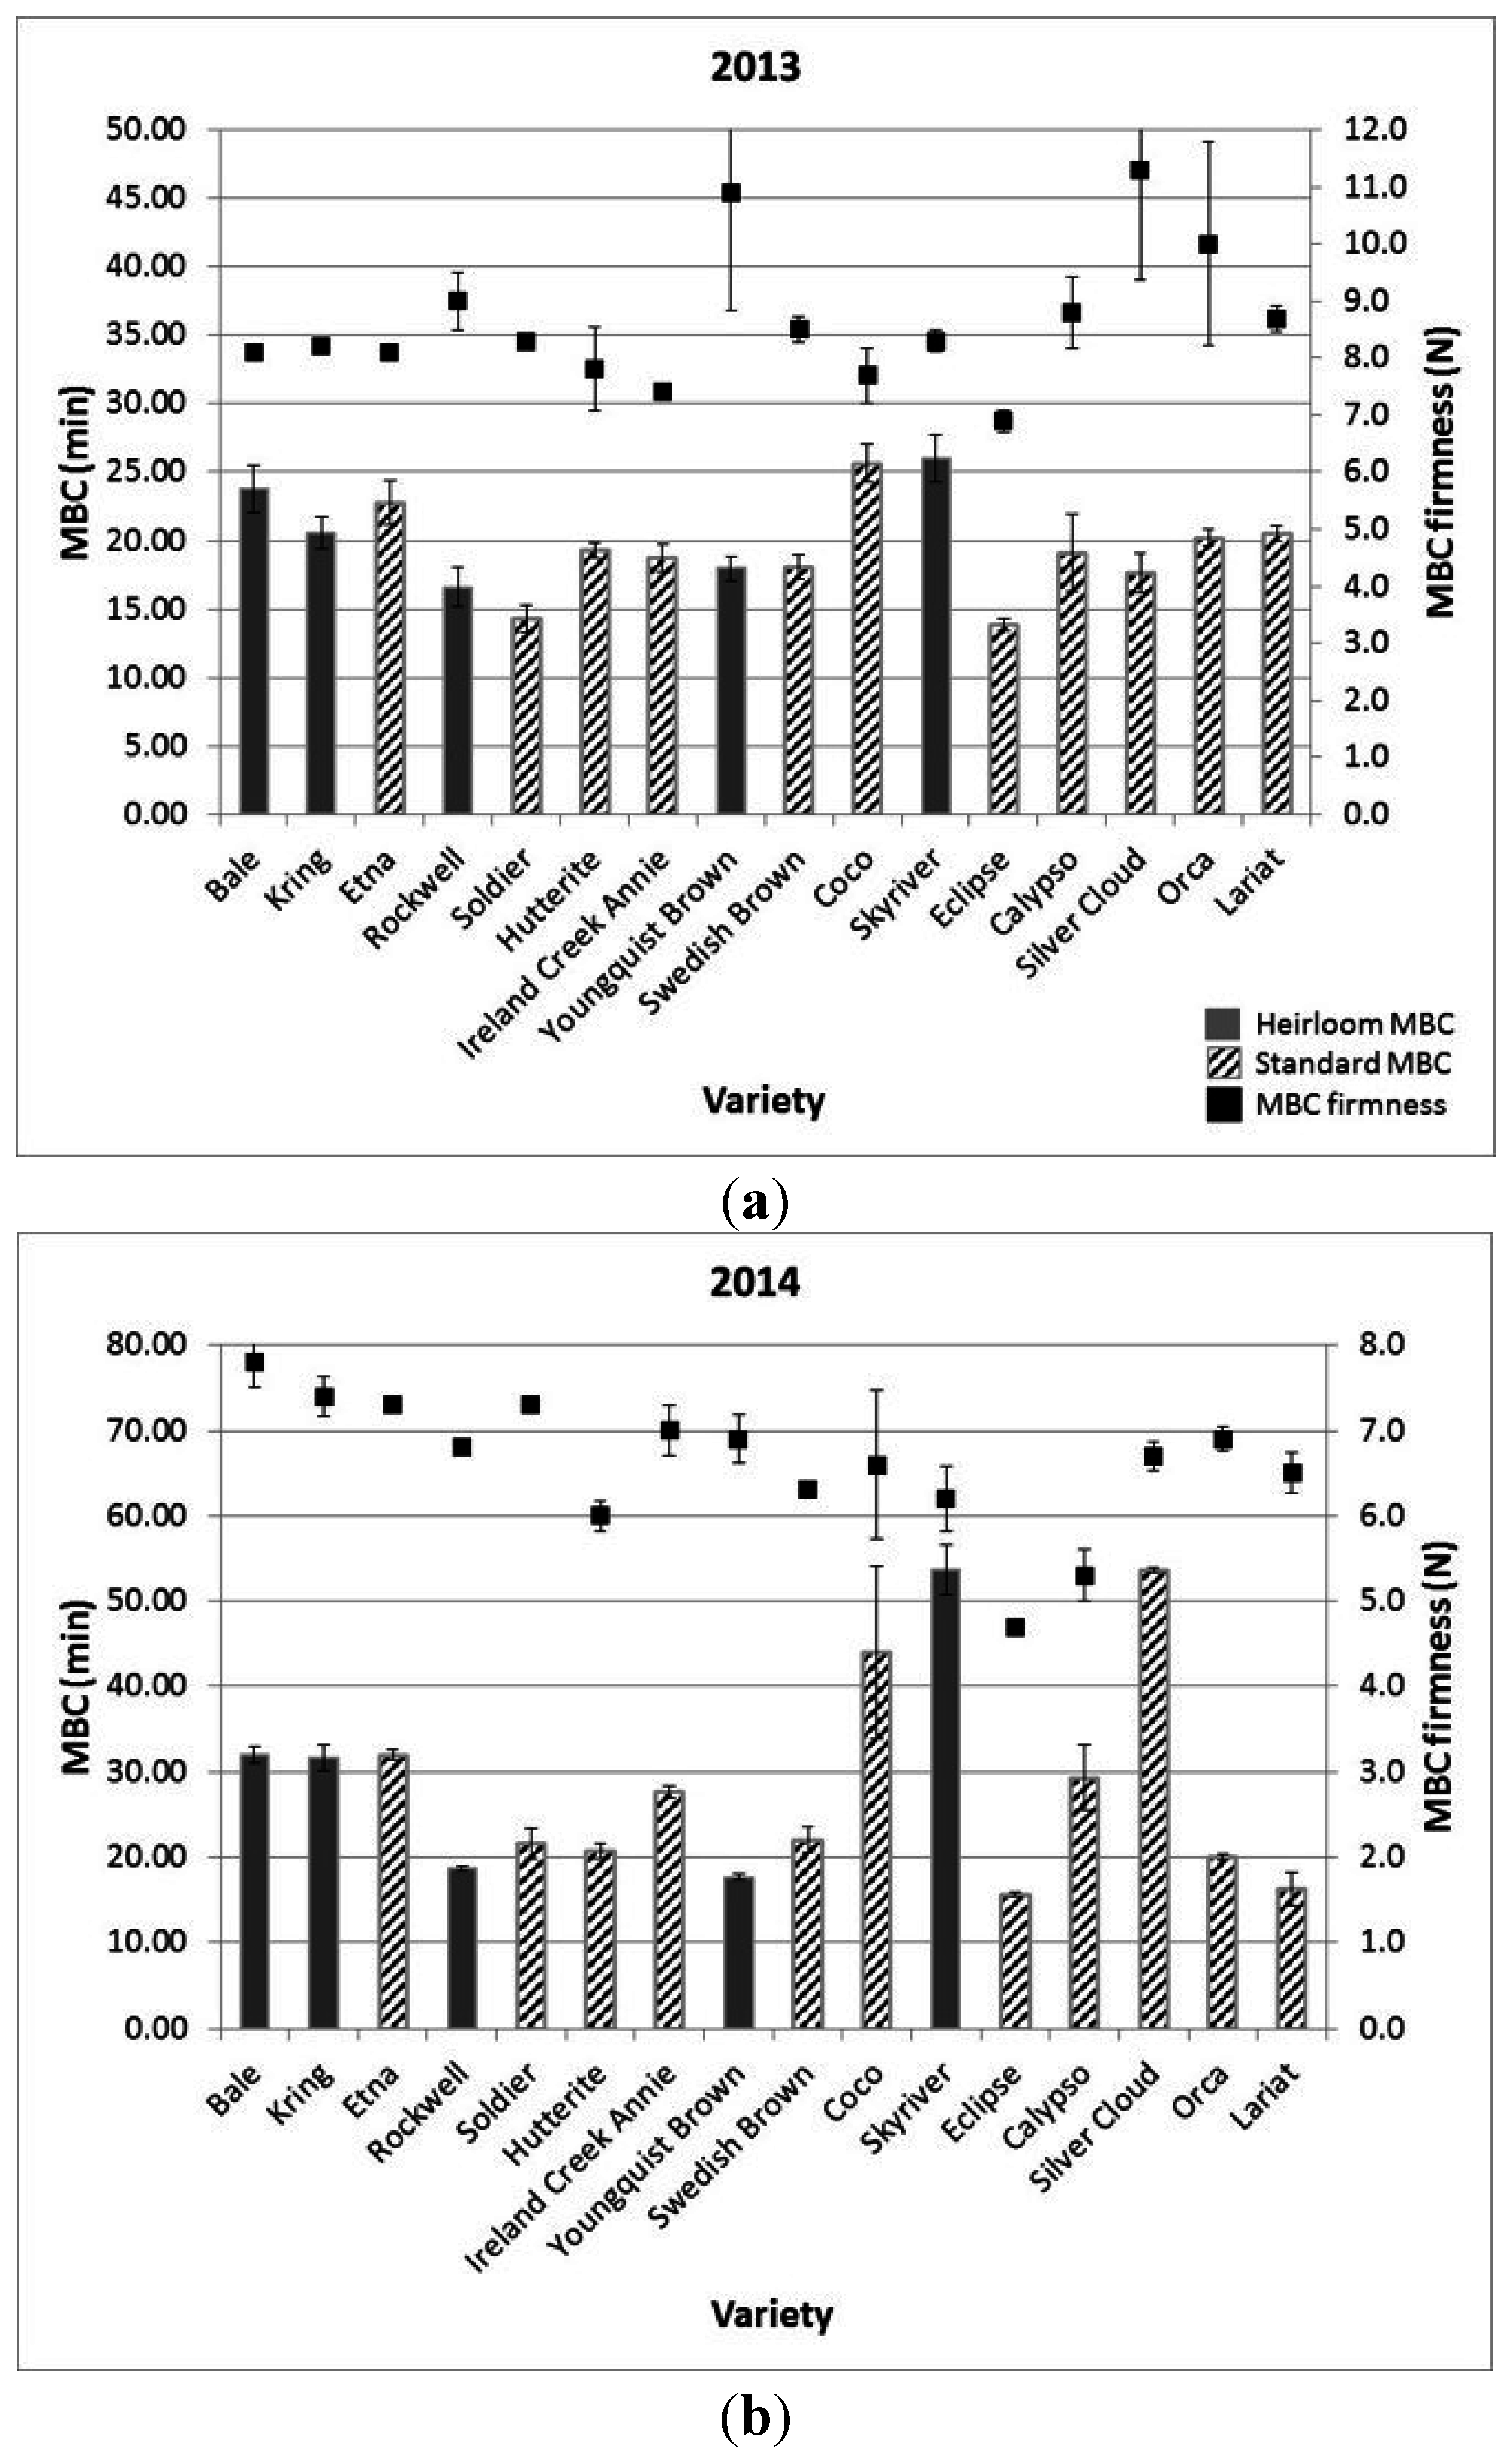
Figure 2). “Coco” (S) had the longest cooking time both years, while “Etna” (S) and “Skyriver” (H) also had long cooking times in 2013. While cooking time measured with an MBC is shorter than with most home-cooking methods, it does provide relative values for comparison purposes.
Overall, firmness after cooking with the MBC also did not differ between heirloom varieties (8.0 N) and standard varieties (7.4 N) (
p = 0.35) (
Table 2). While there was no significant interaction between type and year (
p = 0.73), there was a difference between years (
p < 0.0001). In 2013, there was no significant difference between heirloom and standard varieties (8.9 N and 8.5 N, respectively;
p = 0.34), while in 2014, the firmness of heirloom varieties (7.0 N) was greater than for standard varieties (6.4 N) (
p = 0.04) (data not shown). There was a significant difference in bean firmness among varieties overall (
p = 0.0005); there were significant differences among varieties each year (
p = 0.002 in 2013,
p < 0.0001 in 2014); and there was a significant interaction between year and variety (
p = 0.03) (
Table 2 and
Figure 2). Mean bean firmness for all varieties was greater in 2013 (8.6 N) than in 2014 (6.6 N), and varieties with the lowest firmness both years were “Eclipse” (S) and “Hutterite” (S), while only “Soldier” (S) had the greatest firmness both years.
Figure 2.
Mean cooking time (min) and firmness (N) using a Mattson bean cooker six months after harvest of 16 dry bean varieties grown at Washington State University Northwestern Washington Research and Extension Center, Mount Vernon, WA, USA, in 2013 (
a) and 2014 (
b); varieties differed significantly both years (
p < 0.0001 and
p = 0.002, respectively). All data were analyzed using JMP (JMP v. 11.2.0, SAS Institute Inc., Cary, NC, USA) with α = 0.05. When data violated the assumptions of ANOVA, a transformation was used for analysis following the range method outlined by Kirk [
33]. All means are non-transformed. Error bars based on standard deviation.
Protein content for heirloom varieties (20.3%) did not differ significantly from standard varieties (20.7%) (
p = 0.09); there was no significant difference between type either year (
p = 0.17 in 2013 and
p = 0.48 in 2014); and there was no significant interaction between type and year (
p = 0.10) (
Table 2). There was a significant difference in protein content for varieties overall (
p < 0.0001); protein content for varieties was greater in 2013 (21.2%) than 2014 (20.0%) (
p = 0.006); and there was a significant interaction between variety and year (
p < 0.0001) (
Table 2 and
Table 3). Varieties with the highest protein both years were “Calypso” (S), “Coco” (S) and “Silver Cloud” (S), while “Hutterite” (S) and “Youngquist Brown” (H) had the lowest protein both years (
Figure 2).
4. Discussion
The most important consideration when selecting a dry bean variety for a cool region, such as northwest Washington, is the number days to harvest. DTH with 1500 GDD on average for the two study years was 22 days longer than in other bean-growing regions [
22,
23] Northwest Washington heirloom varieties matured three days earlier than standard varieties, and six heirloom varieties had the shortest DTH both years. This difference could be significant as rainfall starting in mid to late September can prevent beans from reaching a sufficiently dry stage for harvest and storage. Studies of early maturing varieties are needed to determine if there are standard varieties that are well suited to this region. It is important to note that the average GDD during this two-year study (1500 GDD) was 15% greater than the previous 20-year average (1300 GDD).
Overall yield of dry beans in this study was 1950 kg·ha
−1, which was comparable to yield in one organic field study in Michigan (1909 kg·ha
−1, non-irrigated), but less than a different organic field study in Michigan (2455 kg·ha
−1, irrigated), as well as conventional field studies in Idaho (3465 kg·ha
−1, irrigated) and North Dakota (2642 kg·ha
−1, non-irrigated) [
21,
22,
23,
24]. Nevertheless, this study demonstrates that dry beans can be a productive crop in northwest Washington, even without irrigation, and, therefore, could be a suitable legume crop for crop rotation in the region. To better understand yield potential in the region, future studies should be carried out with irrigation.
Consumer demand for regionally-produced staple crops has opened a market opportunity for regionally-produced crops, such as dry beans [
25]. While this study shows that there are many dry bean varieties that can be grown successfully in the region, consumers who shop at farmers’ markets (as well as other direct market customers) may be more likely to purchase unique color-patterned beans or heirloom varieties [
36]. These niche market varieties may be sold at premium prices ($13–$31 per kg) [
9]. While not as profitable, schools could be secure and substantial customers for local crops, including dry beans [
37,
38]. The National School Lunch Program (NSLP) requires school cafeterias to serve 120 mL dry beans and/or dry peas per student per week [
39]; in northwest Washington where 530,000 students are enrolled in NSLP, this equates to 51,000 kg of dry beans served in school cafeterias per week or 2000 tons per year (based on a school year of 36 weeks) [
40]. For institutional buyers, it is likely that price will be the most important factor, so identifying the highest yielding cultivars regardless of appearance may be a priority for this market outlet.
Varieties that are faster cooking may be of particular interest to institutions where large quantities of beans are prepared. Cooking time measured with the MBC is shorter than can be obtained with most home cooking methods, and the MBC underestimates cooking time as beans are generally too firm for eating [
32]. However, the MBC provides a comparative cooking time and may be used to identify beans that are fast or slow cooking. Of the beans with the shortest cooking time in this study, “Eclipse” (S) was the only variety that was among the softest after cooking. In contrast, “Silver Cloud” (S) and “Rockwell” (H) both had a shorter cooking time, but their beans were among the most firm after cooking. Protein content of dry bean varieties is also of interest to many consumers. The mean protein content for dry bean varieties in this study was 21% with a range of 17%–26%. One serving (120 mL or 96 g dry uncooked beans) of a high protein variety contains 24 g of protein, and one serving of a low protein variety contains 16 g of protein. In order to acquire the same amount of protein when eating a low protein bean variety, an additional 8 g of beans are needed, or the equivalent of approximately 10 dry uncooked beans, or approximately two spoonfuls. While this amount could be considered insignificant for a household, for institutions, such as schools in northwest Washington, this would amount to an additional 5300 kg of dry beans per week or 191 tons per year, and the selection of dry beans with high protein may be desirable.


