
Polyethylene Glycol (PEG)-Treated Hydroponic Culture Reduces Length and Diameter of Root Hairs of Wheat Varieties


Abstract
:1. Introduction
2. Results
2.1. Treatment Effect

| Treatments (% PEG) | Number of Adventitious Roots per Tiller | Root Hair Density (no. mm−2) | Root Hair Diameter (µ) | Root Hair Length (µ) | Root Hair Surface Area per mm2 Main Axis (mm2) |
|---|---|---|---|---|---|
| 0 | 10.2 | 70.8 | 7.75 | 367 | 0.725 |
| 0.3 | 9.3 | 96.2 | 5.90 | 341 | 0.592 |
| 0.6 | 11.1 | 106 | 4.04 | 59 | 0.085 |
| SEM | 0.37 | 7.9 | 0.24 | 30.9 | 0.071 |
| p value | 0.035 | 0.12 | <0.001 | <0.001 | <0.001 |
| Traits | PC1 | PC2 | PC3 |
|---|---|---|---|
| Live leaves (no.) | 0.396 | −0.117 | −0.096 |
| Total number of roots per tiller | 0.394 | −0.175 | −0.021 |
| Main axis length at Pr1 (cm) | 0.109 | 0.192 | −0.358 |
| Main axis length at Pr2 (cm) | 0.164 | 0.131 | −0.502 |
| Diameter of root hair (µ) | 0.115 | 0.531 | 0.085 |
| Length of root hair (μ) | 0.161 | 0.543 | 0.109 |
| Root hair density (no. mm−2) | 0.291 | −0.254 | 0.008 |
| Root hair surface area mm−2 axis | 0.231 | 0.473 | 0.137 |
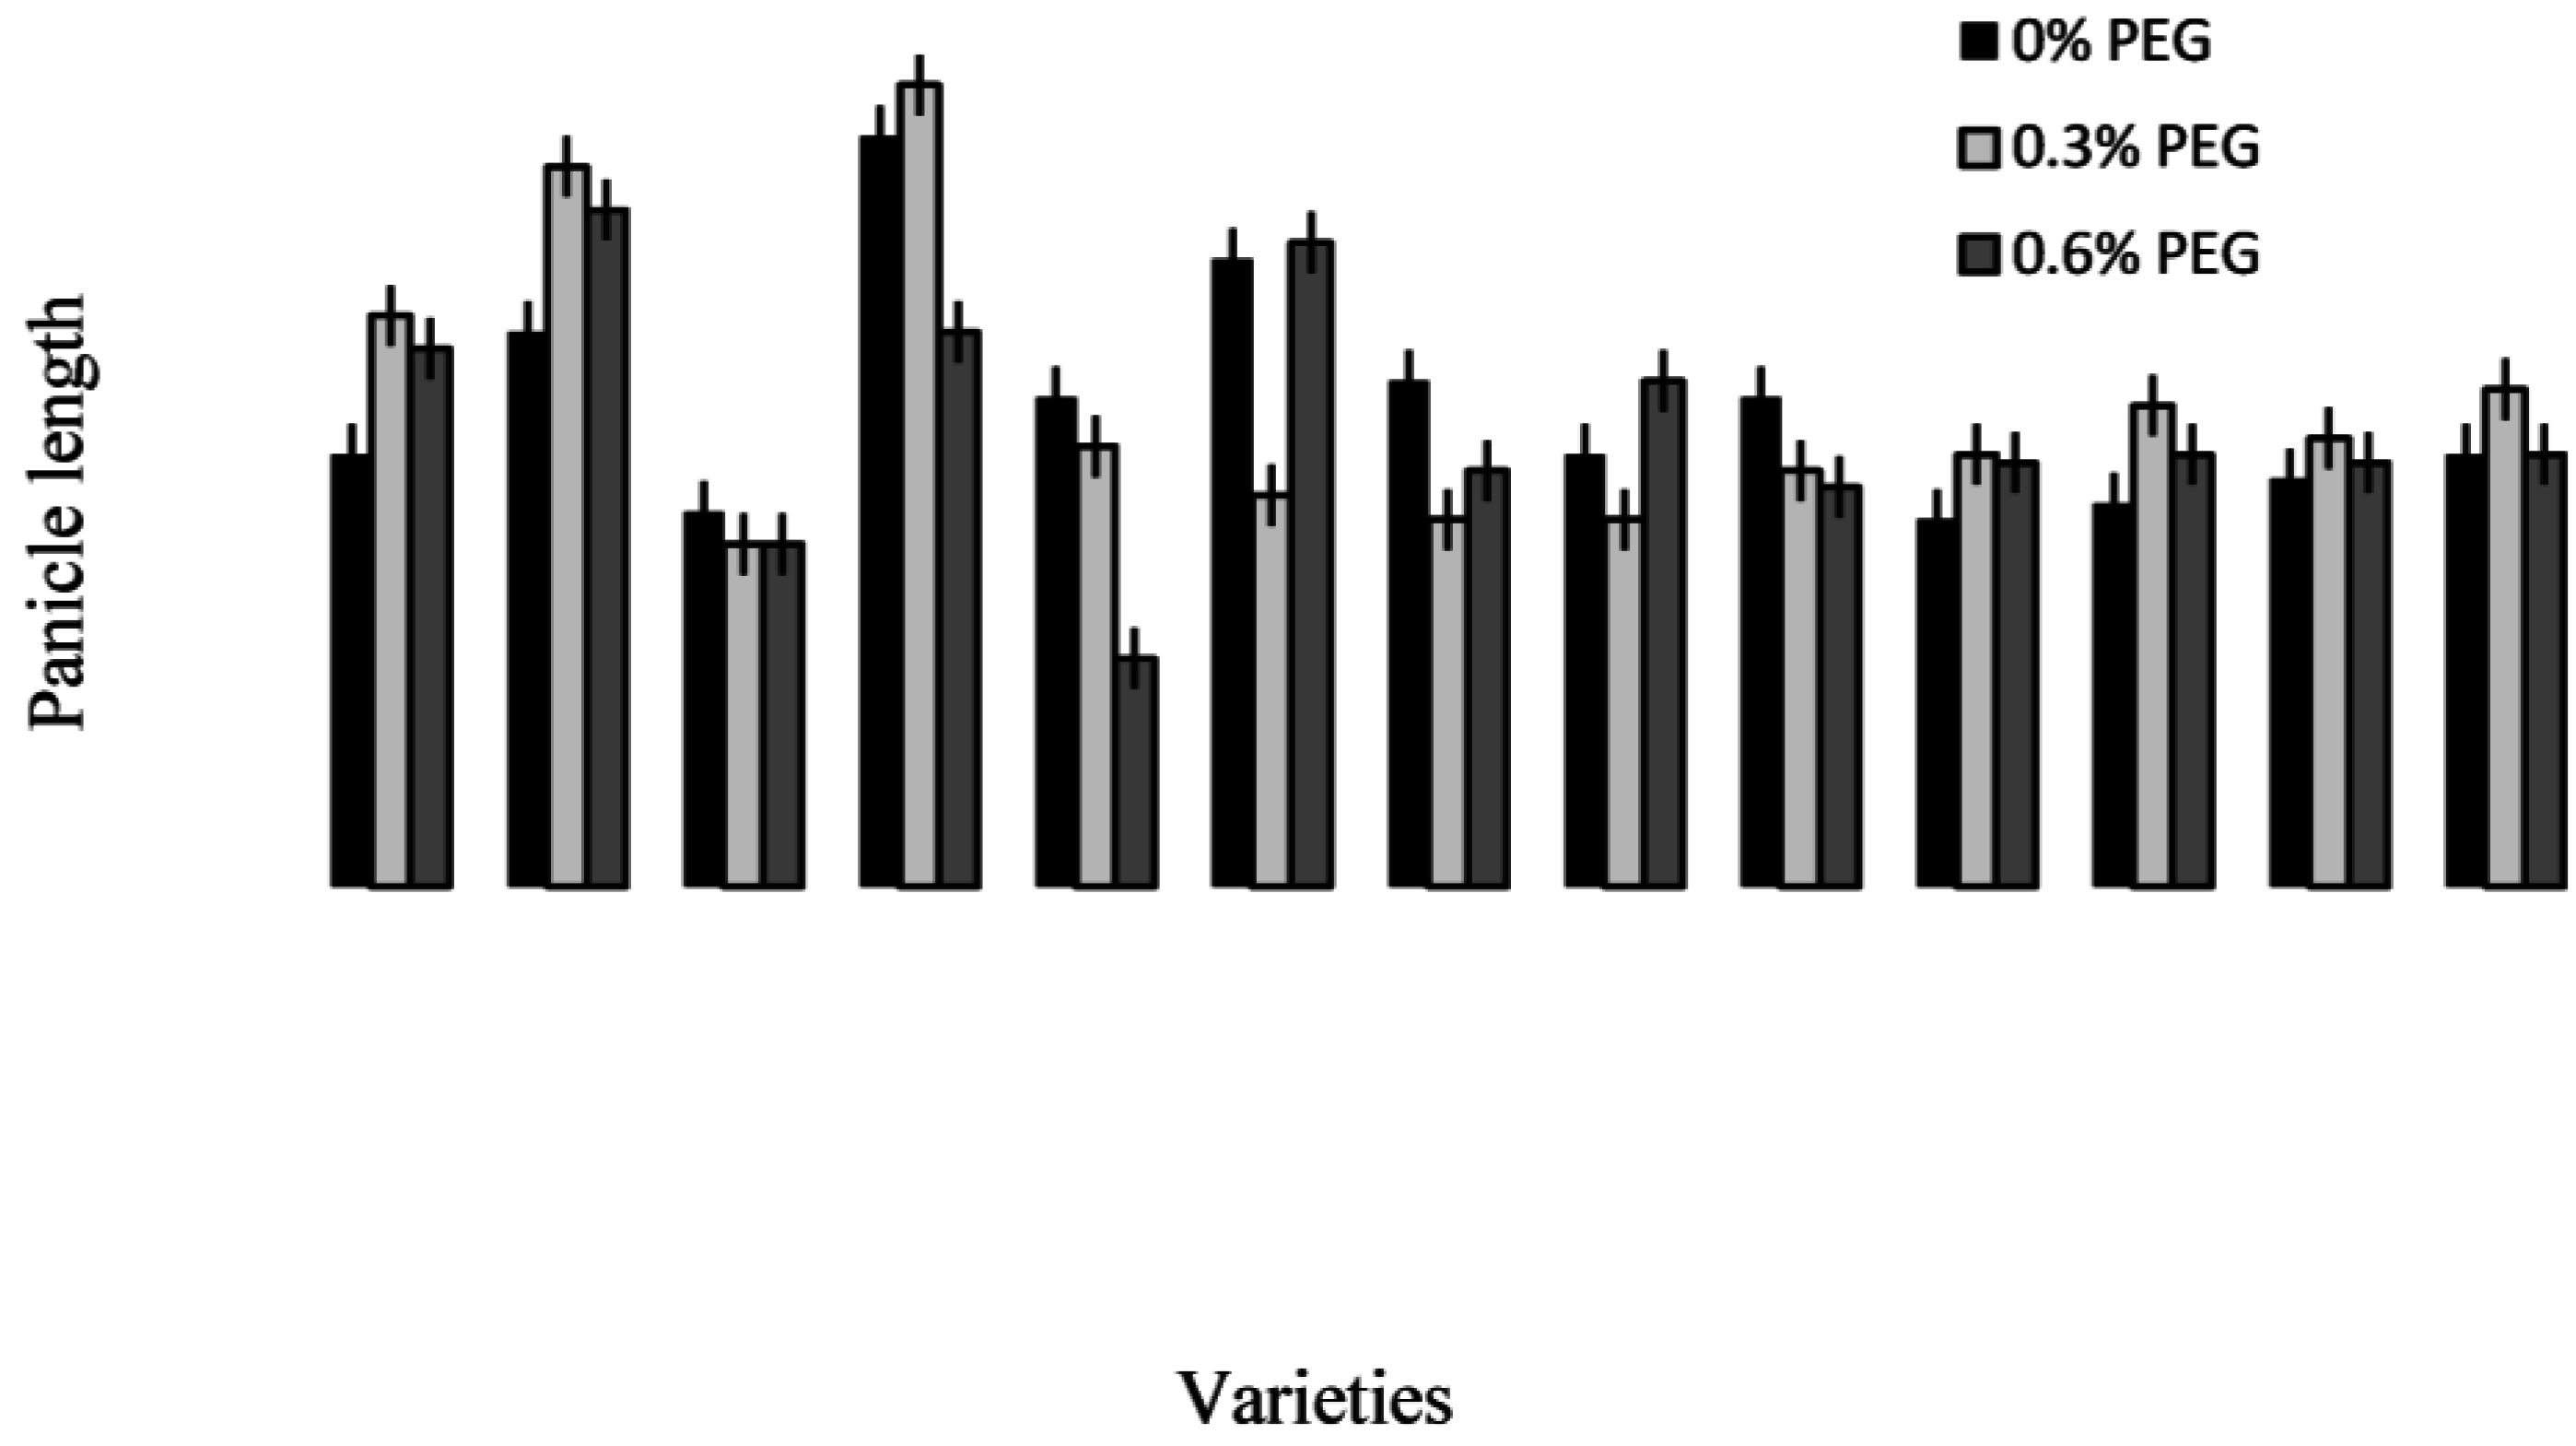
| Panicle length (cm) | 0.297 | −0.090 | 0.470 |
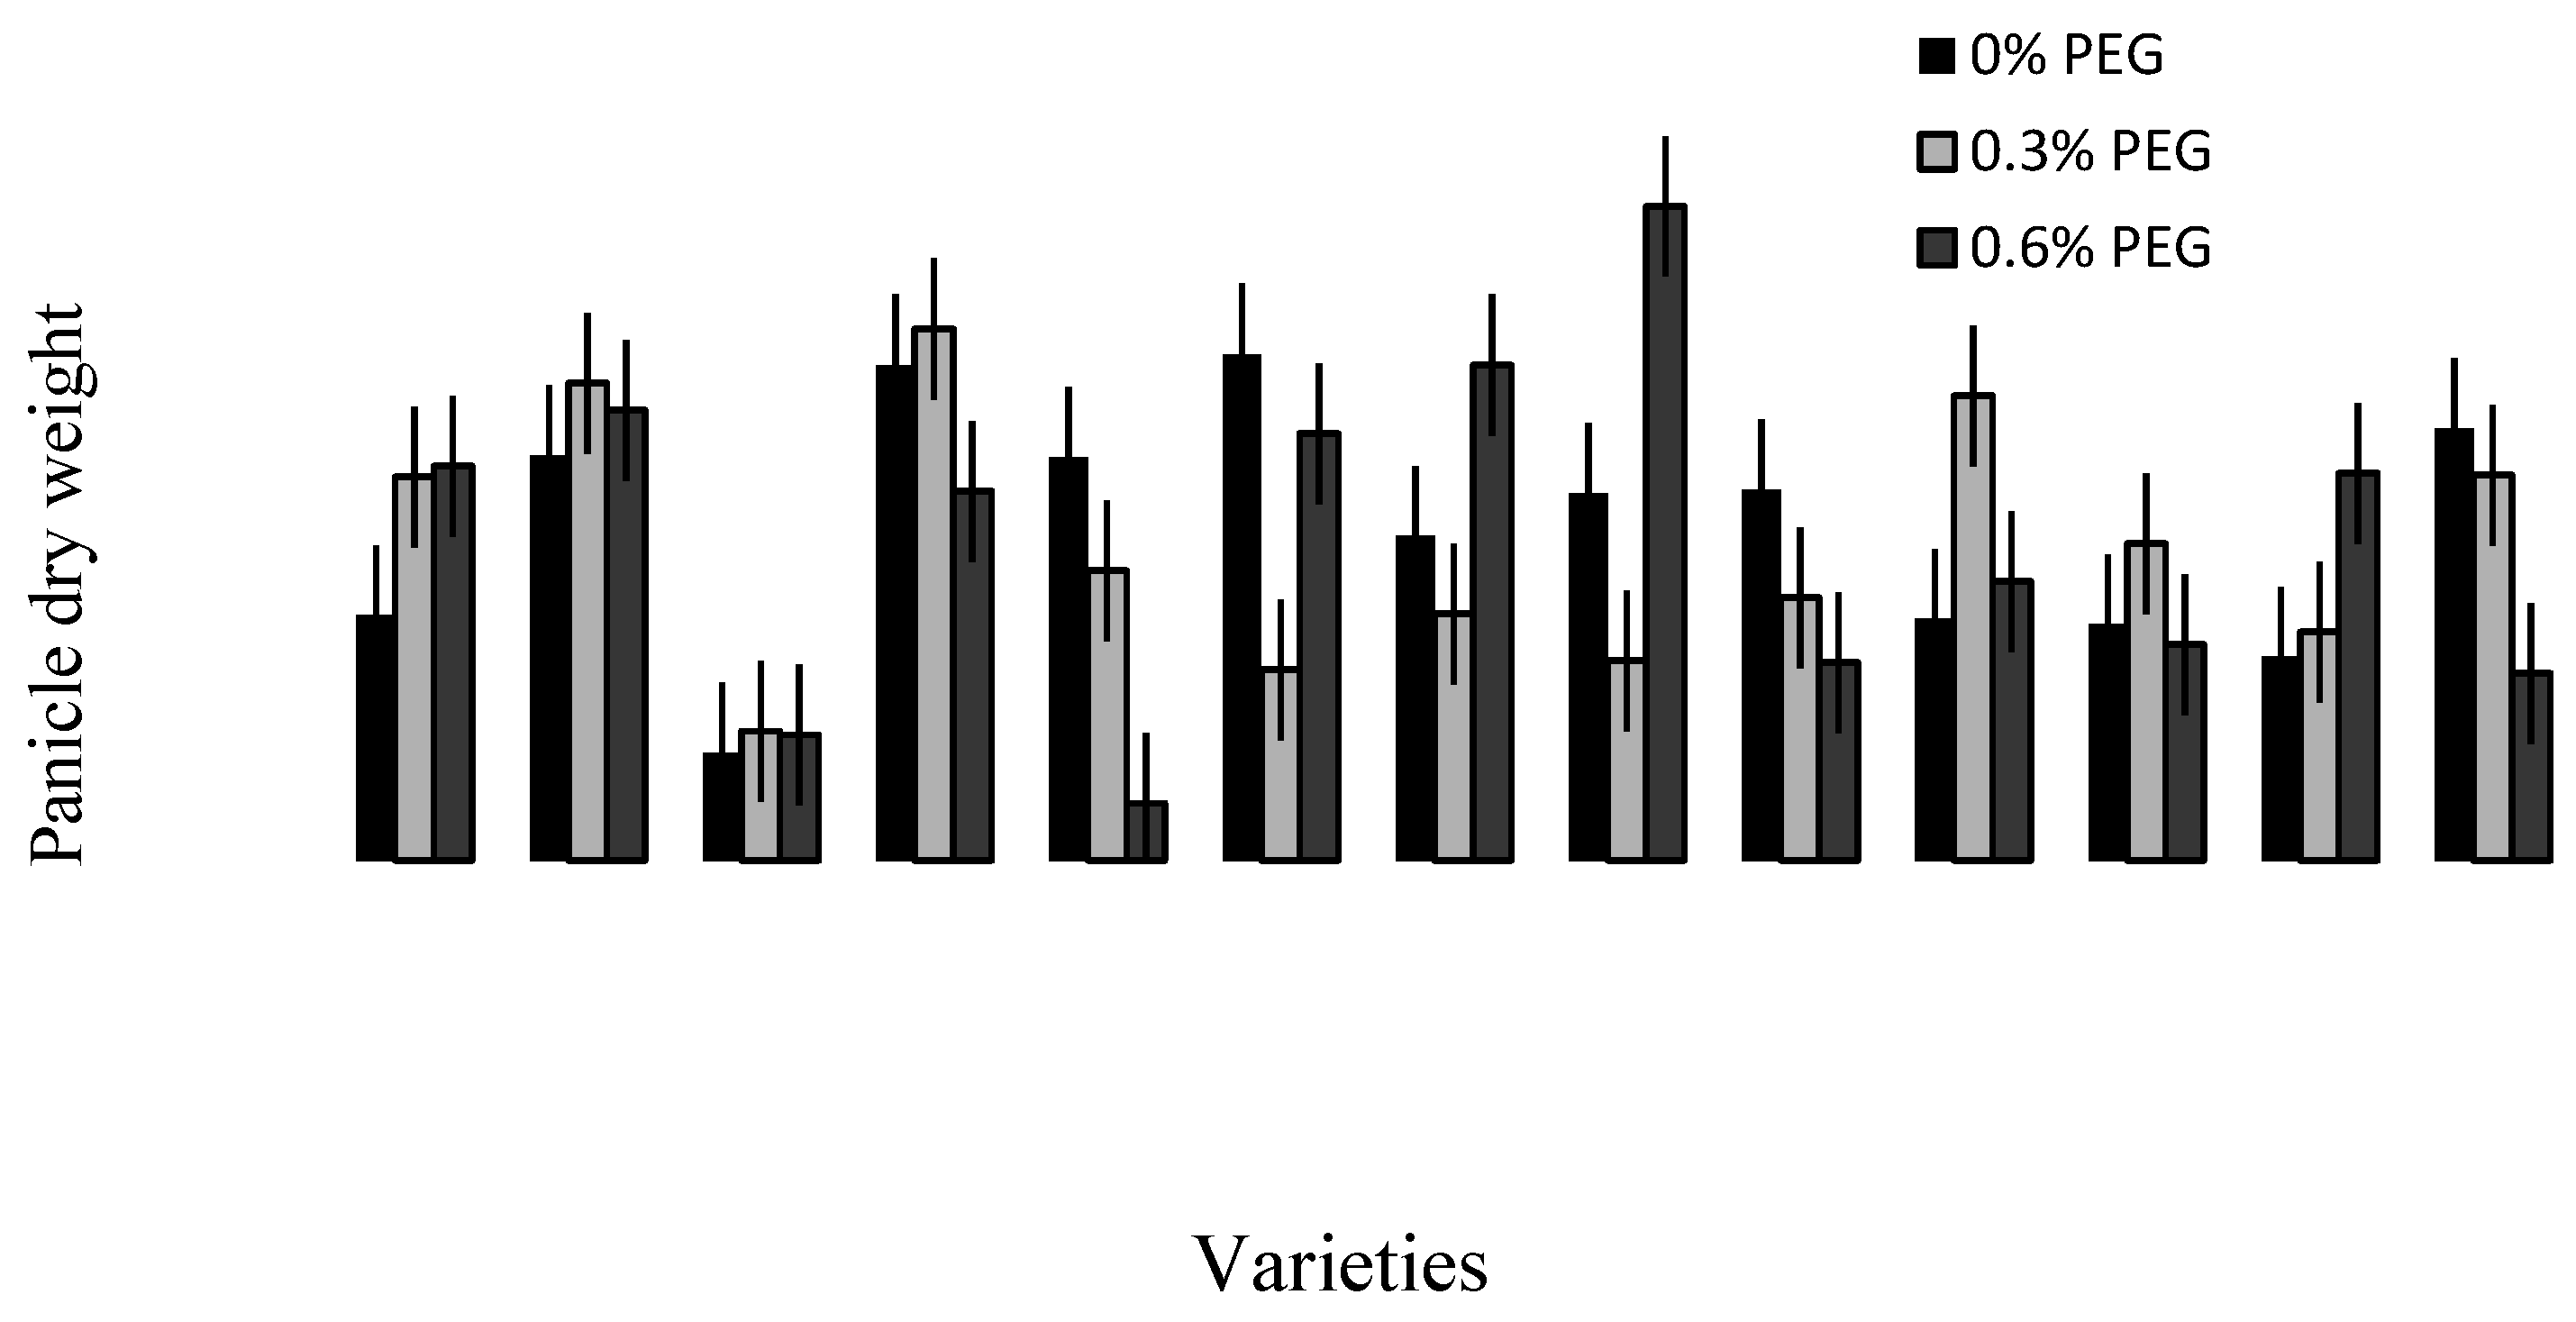
| Panicle dry weight (mg) | 0.232 | −0.050 | 0.485 |
| Root dry weight per tiller (mg) | 0.393 | −0.159 | −0.109 |
| Shoot dry weight per tiller (mg) | 0.202 | 0.005 | −0.304 |
| % variation explained | 31 | 17.5 | 13.1 |
| p (treatment) | 0.27 | <0.001 | 0.292 |
| p (variety) | <0.001 | 0.222 | <0.001 |
| p (treatment × variety) | 0.169 | 0.982 | <0.001 |
| Mean PC scores for treatment | |||
| 0.0% PEG | 0.23 ± 0.22 | 0.77 ± 0.25 | 0.13 ± 0.14 |
| 0.3% PEG | 0.02 ± 0.22 | 0.28 ± 0.25 | 0.09 ± 0.15 |
| 0.6% PEG | −0.26 ± 0.22 | −1.02 ± 0.25 | −0.17 ± 0.14 |
| Mean PC scores for variety | |||
| Shotabdi | 0.91 ± 0.51 | −0.09 ± 0.58 | 0.60 ± 0.34 |
| Shourov | −0.61 ± 0.48 | −0.49 ± 0.55 | 1.55 ± 0.32 |
| Sufi | −1.92 ± 0.48 | 0.36 ± 0.55 | −0.55 ± 0.32 |
| Prodeep | 3.81 ± 0.44 | −1.51 ± 0.51 | 0.59 ± 0.29 |
| Bijoy | −0.87 ± 0.44 | 0.88 ± 0.51 | −0.07 ± 0.29 |
| BARI gom25 | 1.87 ± 0.44 | −0.22 ± 0.51 | −0.30 ± 0.29 |
| BARI gom26 | −0.23 ± 0.44 | 0.11 ± 0.51 | −0.29 ± 0.29 |
| BARI gom27 | −1.01 ± 0.44 | −0.38 ± 0.51 | 0.45 ± 0.29 |
| BARI gom28 | −0.99 ± 0.44 | 0.21 ± 0.51 | −0.07 ± 0.29 |
| Kheri | 0.43 ± 0.44 | 0.49 ± 0.51 | −0.78 ± 0.29 |
| Sonalika | −0.90 ± 0.44 | 0.14 ± 0.51 | −0.24 ± 0.29 |
| Kanchan | −0.37 ± 0.44 | 0.27 ± 0.51 | −0.42 ± 0.29 |
| Akbar | −0.15 ± 0.48 | 0.36 ± 0.55 | −0.26 ± 0.32 |
2.2. Varietal Difference
| Variety | Live Leaves (No.) | No. of Root Bearing Phytomer | No. of Adventitious Roots per Tiller | Average no. of Roots per Phytomer | No. of Seminal Roots | Main Axis Length at Pr1 (cm) | Main Axis Length at Pr2 (cm) | Main Axis Diameter (mm) | Root Hair Density (No. mm−2) | Root Dry Weight (mg) |
|---|---|---|---|---|---|---|---|---|---|---|
| Shotabdi | 5.3 | 5.77 | 11.7 | 2.01 | 3.78 | 10.2 | 16.9 | 0.57 | 34.7 | 65 |
| Shourov | 4.0 | 3.89 | 7.3 | 1.89 | 3.00 | 12.8 | 12.4 | 0.55 | 21.9 | 43 |
| Sufi | 3.0 | 5.22 | 9.2 | 1.77 | 2.56 | 12.1 | 17.6 | 0.53 | 14.5 | 38 |
| Prodeep | 7.8 | 7.00 | 17.8 | 2.52 | 4.56 | 11.5 | 20.0 | 0.71 | 76.7 | 134 |
| Bijoy | 3.4 | 4.89 | 9.4 | 1.95 | 2.44 | 13.2 | 17.2 | 0.60 | 28.5 | 53 |
| BARI gom25 | 6.2 | 6.44 | 13.8 | 2.12 | 4.56 | 17.4 | 23.6 | 0.66 | 31.6 | 81 |
| BARI gom26 | 4.1 | 4.89 | 10.0 | 2.03 | 3.22 | 13.2 | 19.9 | 0.51 | 26.3 | 54 |
| BARI gom27 | 4.1 | 4.33 | 9.2 | 2.14 | 3.00 | 8.9 | 17.3 | 0.49 | 17.1 | 37 |
| BARI gom28 | 3.9 | 4.33 | 7.7 | 1.78 | 3.11 | 15.5 | 16.3 | 0.59 | 10.6 | 67 |
| Kheri | 5.7 | 5.11 | 9.7 | 1.88 | 3.00 | 28.2 | 21.0 | 0.57 | 34.5 | 62 |
| Sonalika | 3.6 | 4.78 | 8.4 | 1.78 | 2.78 | 19.0 | 16.2 | 0.52 | 33.2 | 46 |
| Kanchan | 4.7 | 5.00 | 9.0 | 1.79 | 2.78 | 17.5 | 19.1 | 0.47 | 26.7 | 41 |
| Akbar | 4.2 | 5.22 | 9.3 | 1.81 | 3.44 | 14.9 | 24.2 | 0.51 | 43.2 | 44 |
| SEM | 0.16 | 0.12 | 0.37 | 0.035 | 0.11 | 0.96 | 0.75 | 0.012 | 3.12 | 3.84 |
| p value | <0.001 | <0.001 | <0.001 | <0.001 | 0.001 | 0.03 | 0.02 | 0.003 | 0.004 | <0.001 |
2.3. Treatment–Variety Interaction


2.4. Discussion
2.4.1. Root Surface Area Reduction under Osmotic Stress
2.4.2. Increased Total Number of Roots per Tiller
2.4.3. Trait Association: Root Traits with Panicle Traits
2.4.4. Varietal Differences
3. Experimental Section
3.1. Plant Culture and Management
| Variety | Seed Source |
|---|---|
| Shotabdi | Wheat Research Centre of Bangladesh Agricultural Research Institute |
| Shourov | |
| Sufi | |
| Prodeep | |
| Bijoy | |
| BARI gom25 | |
| BARI gom26 | |
| BARI gom27 | |
| BARI gom28 | |
| Kheri | |
| Sonalika | |
| Kanchan | |
| Akbar |
3.2. Measurements and Data Collection
3.3. Estimation of Root Hair Density and Root Hair Surface Area
3.4. Statistical Analyses
4. Conclusions
Acknowledgments
Author Contributions
Conflicts of Interest
References
- FAOSTAT Data, 2007—Food and Agricultural Commodities Production. FAO: Rome, Italy, 2012; Available online: http://faostat.fao.org (accessed on 4 November 2012).
- Anonymous. Statistical Year Book of Bangladesh-2010, Bangladesh Bureau of Statistics, Planning Division, Ministry of Planning; Government of the People’s Republic of Bangladesh: Dhaka, Bangladesh, 2011.
- Hossain, A.; Silva, J.A.T. Wheat production in Bangladesh: Its future in the light of global warming. AoB Plants 2013, 5, 42. [Google Scholar] [CrossRef] [PubMed]
- Rahman, A.; Biswas, P.R. Devours resources. Dhaka Cour. 1995, 11, 7–8. [Google Scholar]
- Shahid, S.; Behrawan, H. Drought risk assessment in the western part of Bangladesh. Nat. Hazards 2008, 46, 391–413. [Google Scholar] [CrossRef]
- Blum, A. Genetic and physiological relationships in plant breeding for drought resistance. Agric. Water Manag. 1983, 7, 195–205. [Google Scholar] [CrossRef]
- Turner, N.C.; Wright, G.C.; Siddique, K.H.M. Adaptation of grain legumes (pulses) to water-limited environments. Adv. Agron. 2001, 71, 194–233. [Google Scholar]
- Gunasekera, D.; Berkowitz, G.A. Evaluation of contrasting cellular-level acclimation responses to leaf water deficits in three wheat genotypes. Plant Sci. 1992, 86, 1–12. [Google Scholar] [CrossRef]
- Morgan, J.M. Osmoregulation and water stress in higher plants. Annu. Rev. Plant Physiol. 1984, 35, 299–319. [Google Scholar] [CrossRef]
- Bray, E.A. Molecular responses to water deficit. Plant Physiol. 1993, 103, 1035–1040. [Google Scholar] [PubMed]
- Manavalan, L.P.; Guttikonda, S.K.; Tran, L.S.P.; Nguyen, H.T. Physiological and molecular approaches to improve drought resistance in soybean. Plant Cell Physiol. 2009, 50, 1260–1276. [Google Scholar] [CrossRef] [PubMed]
- Turner, N.C. Adaptation to water deficits: A changing perspective. Funct. Plant Biol. 1986, 13, 175–190. [Google Scholar] [CrossRef]
- Turner, N.C.; Jones, M.M. Turgor Maintenance by Osmotic Adjustment: A Review and Evaluation. In Adaptation of Plants to Water and High Temperature Stress; Turner, N., Kramer, P., Eds.; John Wiley & Sons, Inc., the University of Michigan: Ann Arbor, MI, USA, 1980; pp. 87–103. [Google Scholar]
- Bengough, A.G.; Bransby, M.F.; Hans, J.; McKenna, S.J.; Roberts, T.J.; Valentine, T.A. Root responses to soil physical conditions; growth dynamics from field to cell. J. Exp. Bot. 2006, 57, 437–447. [Google Scholar] [CrossRef] [PubMed]
- Bengough, A.G.; McKenzie, B.; Hallett, P.; Valentine, T. Root elongation, water stress, and mechanical impedance: A review of limiting stresses and beneficial root tip traits. J. Exp. Bot. 2011, 62, 59–68. [Google Scholar] [CrossRef] [PubMed]
- Brown, L.K.; George, T.S.; Thompson, J.A.; Wright, G.; Lyon, J.; Dupuy, L.; Hubbard, S.; White, P. What are the implications of variation in root hair length on tolerance to phosphorus deficiency in combination with water stress in barley (Hordeum vulgare L.)? Ann. Bot. 2012, 110, 319–328. [Google Scholar] [CrossRef] [PubMed]
- Crush, J.; Easton, H.; Waller, J.; Hume, D.; Faville, M. Genotypic variation in patterns of root distribution, nitrate interception and response to moisture stress of a perennial ryegrass (Lolium perenne L.) mapping population. Grass Forage Sci. 2007, 62, 265–273. [Google Scholar] [CrossRef]
- Ehdaie, B.; Layne, A.P.; Waines, J.G. Root system plasticity to drought influences grain yield in bread wheat. Euphytica 2012, 186, 219–232. [Google Scholar] [CrossRef]
- Ji, H.; Liu, L.; Li, K.; Xie, Q.; Wang, Z.; Zhao, X.; Li, X. PEG-mediated osmotic stress induces premature differentiation of the root apical meristem and outgrowth of lateral roots in wheat. J. Exp. Bot. 2014, 65, 4863–4872. [Google Scholar] [CrossRef] [PubMed]
- Maggio, A.; Hasegawa, P.M.; Bressan, R.A.; Consiglio, M.F.; Joly, R.J. Review: Unravelling the functional relationship between root anatomy and stress tolerance. Funct. Plant Biol. 2001, 28, 999–1004. [Google Scholar] [CrossRef]
- Manschadi, A.M.; Christopher, J.; Hammer, G.L. The role of root architectural traits in adaptation of wheat to water-limited environments. Funct. Plant Biol. 2006, 33, 823–837. [Google Scholar] [CrossRef]
- Manschadi, A.M.; Hammer, G.L.; Christopher, J.T. Genotypic variation in seedling root architectural traits and implications for drought adaptation in wheat (Triticum aestivum L.). Plant Soil 2008, 303, 115–129. [Google Scholar] [CrossRef]
- Palta, J.A.; Chen, X.; Milroy, S.P.; Rebetzke, G.J.; Dreccer, M.F.; Watt, M. Large root systems: Are they useful in adapting wheat to dry environments? Funct. Plant Biol. 2011, 38, 347–354. [Google Scholar] [CrossRef]
- Rauf, M.; Munir, M.; ul Hassan, M.; Ahmad, M.; Afzal, M. Performance of wheat genotypes under osmotic stress at germination and early seedling growth stage. Afr. J. Biotechnol. 2007, 6, 971–975. [Google Scholar]
- Dhanda, S.; Sethi, G.; Behl, R. Indices of drought tolerance in wheat genotypes at early stages of plant growth. J. Agron. Crop Sci. 2004, 190, 6–12. [Google Scholar] [CrossRef]
- Davidson, D.; Chevalier, P. Influence of polyethylene glycol-induced water deficits on tiller production in spring wheat. Crop Sci. 1987, 27, 1185–1187. [Google Scholar] [CrossRef]
- Michel, B.E.; Kaufmann, M.R. The osmotic potential of polyethylene glycol 6000. Plant Physiol. 1973, 51, 914–916. [Google Scholar] [CrossRef] [PubMed]
- Haling, R.E.; Brown, L.K.; Bengough, A.G.; Young, I.M.; Hallett, P.D.; White, P.J.; George, T.S. Root hairs improve root penetration, root-soil contact, and phosphorus acquisition in soils of different strength. J. Exp. Bot. 2013, 64, 3711–3721. [Google Scholar] [CrossRef] [PubMed]
- Haling, R.E.; Brown, L.K.; Bengough, A.G.; Valentine, T.A.; White, P.J.; Young, I.M.; George, T.S. Root hair length and rhizosheath mass depend on soil porosity, strength and water content in barley genotypes. Planta 2014, 239, 643–651. [Google Scholar] [CrossRef] [PubMed]
- Jupp, A.; Newman, E. Morphological and anatomical effects of severe drought on the roots of Lolium perenne L. New Phytol. 1987, 105, 393–402. [Google Scholar] [CrossRef]
- Khanna-Chopra, R. Leaf senescence and abiotic stresses share reactive oxygen species-mediated chloroplast degradation. Protoplasma 2012, 249, 469–481. [Google Scholar] [CrossRef] [PubMed]
- Munné-Bosch, S.; Alegre, L. Die and let live: Leaf senescence contributes to plant survival under drought stress. Funct. Plant Biol. 2004, 31, 203–216. [Google Scholar] [CrossRef]
- Gahoonia, T.S.; Nielsen, N.E. Barley genotypes with long root hairs sustain high grain yields in low-P field. Plant Soil 2004, 262, 55–62. [Google Scholar] [CrossRef]
- Röhm, M.; Werner, D. Isolation of root hairs from seedlings of Pisum sativum. Identification of root hair specific proteins by in situ labeling. Physiol. Plant. 1987, 69, 129–136. [Google Scholar] [CrossRef]
- Robin, A.H.K.; Saha, P.S. Morphology of lateral roots of twelve rice cultivars of Bangladesh: Dimension increase and diameter reduction in progressive root branching at the vegetative stage. Plant Root 2015, 9, 34–42. [Google Scholar] [CrossRef]
- Gahoonia, T.S.; Nielsen, N.E. Variation in root hairs of barley cultivars doubled soil phosphorus uptake. Euphytica 1997, 98, 177–182. [Google Scholar] [CrossRef]
- Gahoonia, T.S.; Nielsen, N.E.; Joshi, P.A.; Jahoor, A. A root hairless barley mutant for elucidating genetic of root hairs and phosphorus uptake. Plant Soil 2001, 235, 211–219. [Google Scholar] [CrossRef]
- Narang, R.A.; Bruene, A.; Altmann, T. Analysis of phosphate acquisition efficiency in different Arabidopsis accessions. Plant Physiol. 2000, 124, 1786–1799. [Google Scholar] [CrossRef] [PubMed]
- Brown, L.K.; George, T.S.; Barrett, G.E.; Hubbard, S.F.; White, P.J. Interactions between root hair length and arbuscular mycorrhizal colonisation in phosphorus deficient barley (Hordeum vulgare). Plant Soil 2013, 372, 195–205. [Google Scholar] [CrossRef]
- Robin, A.H.K.; Uddin, M.J.; Afrin, S.; Paul, P.R. Genotypic variations in root traits of wheat varieties at phytomer level. J. Bangladesh Agric. Univ. 2014, 12, 45–54. [Google Scholar] [CrossRef]
- Caradus, J. Selection for root hair length in white clover (Trifolium repens L.). Euphytica 1979, 28, 489–494. [Google Scholar] [CrossRef]
- Haling, R.E.; Richardson, A.E.; Culvenor, R.A.; Lambers, H.; Simpson, R.J. Root morphology, root-hair development and rhizosheath formation on perennial grass seedlings is influenced by soil acidity. Plant Soil 2010, 335, 457–468. [Google Scholar] [CrossRef]
- Haling, R.E.; Simpson, R.J.; Delhaize, E.; Hocking, P.J.; Richardson, A.E. Effect of lime on root growth, morphology and the rhizosheath of cereal seedlings growing in an acid soil. Plant Soil 2010, 327, 199–212. [Google Scholar] [CrossRef]
- Nicolas, M.E.; Lambers, H.; Simpson, R.J.; Dalling, M.J. Effect of drought on metabolism and partitioning of carbon in two wheat varieties differing in drought-tolerance. Ann. Bot. 1985, 55, 727–742. [Google Scholar]
- Nicolas, M.E.; Simpson, R.J.; Lambers, H.; Dalling, M.J. Effects of drought on partitioning of nitrogen in two wheat varieties differing in drought-tolerance. Ann. Bot. 1985, 55, 743–754. [Google Scholar]
© 2015 by the authors; licensee MDPI, Basel, Switzerland. This article is an open access article distributed under the terms and conditions of the Creative Commons Attribution license (http://creativecommons.org/licenses/by/4.0/).
Share and Cite
Robin, A.H.K.; Uddin, M.J.; Bayazid, K.N. Polyethylene Glycol (PEG)-Treated Hydroponic Culture Reduces Length and Diameter of Root Hairs of Wheat Varieties. Agronomy 2015, 5, 506-518. https://0-doi-org.brum.beds.ac.uk/10.3390/agronomy5040506
Robin AHK, Uddin MJ, Bayazid KN. Polyethylene Glycol (PEG)-Treated Hydroponic Culture Reduces Length and Diameter of Root Hairs of Wheat Varieties. Agronomy. 2015; 5(4):506-518. https://0-doi-org.brum.beds.ac.uk/10.3390/agronomy5040506
Chicago/Turabian StyleRobin, Arif Hasan Khan, Md. Jasim Uddin, and Khandaker Nafiz Bayazid. 2015. "Polyethylene Glycol (PEG)-Treated Hydroponic Culture Reduces Length and Diameter of Root Hairs of Wheat Varieties" Agronomy 5, no. 4: 506-518. https://0-doi-org.brum.beds.ac.uk/10.3390/agronomy5040506