Effect of Large-Scale Cultivated Land Expansion on the Balance of Soil Carbon and Nitrogen in the Tarim Basin


1
Key Laboratory of Land Surface Pattern and Simulation, Institute of Geographic Sciences and Natural Resources Research, Chinese Academy of Sciences, Beijing 100101, China
2
Institute of Soil and Fertilizer, Xinjiang Academy of Agricultural Sciences, Urumqi 830091, China
*
Authors to whom correspondence should be addressed.
Agronomy 2019, 9(2), 86; https://0-doi-org.brum.beds.ac.uk/10.3390/agronomy9020086
Submission received: 23 January 2019
/
Accepted: 12 February 2019
/
Published: 14 February 2019
(This article belongs to the Special Issue Remote Sensing Applications for Agriculture and Crop Modelling)
Abstract
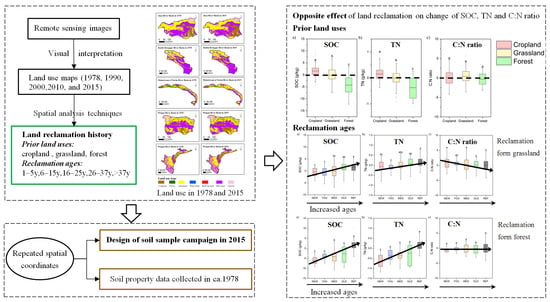
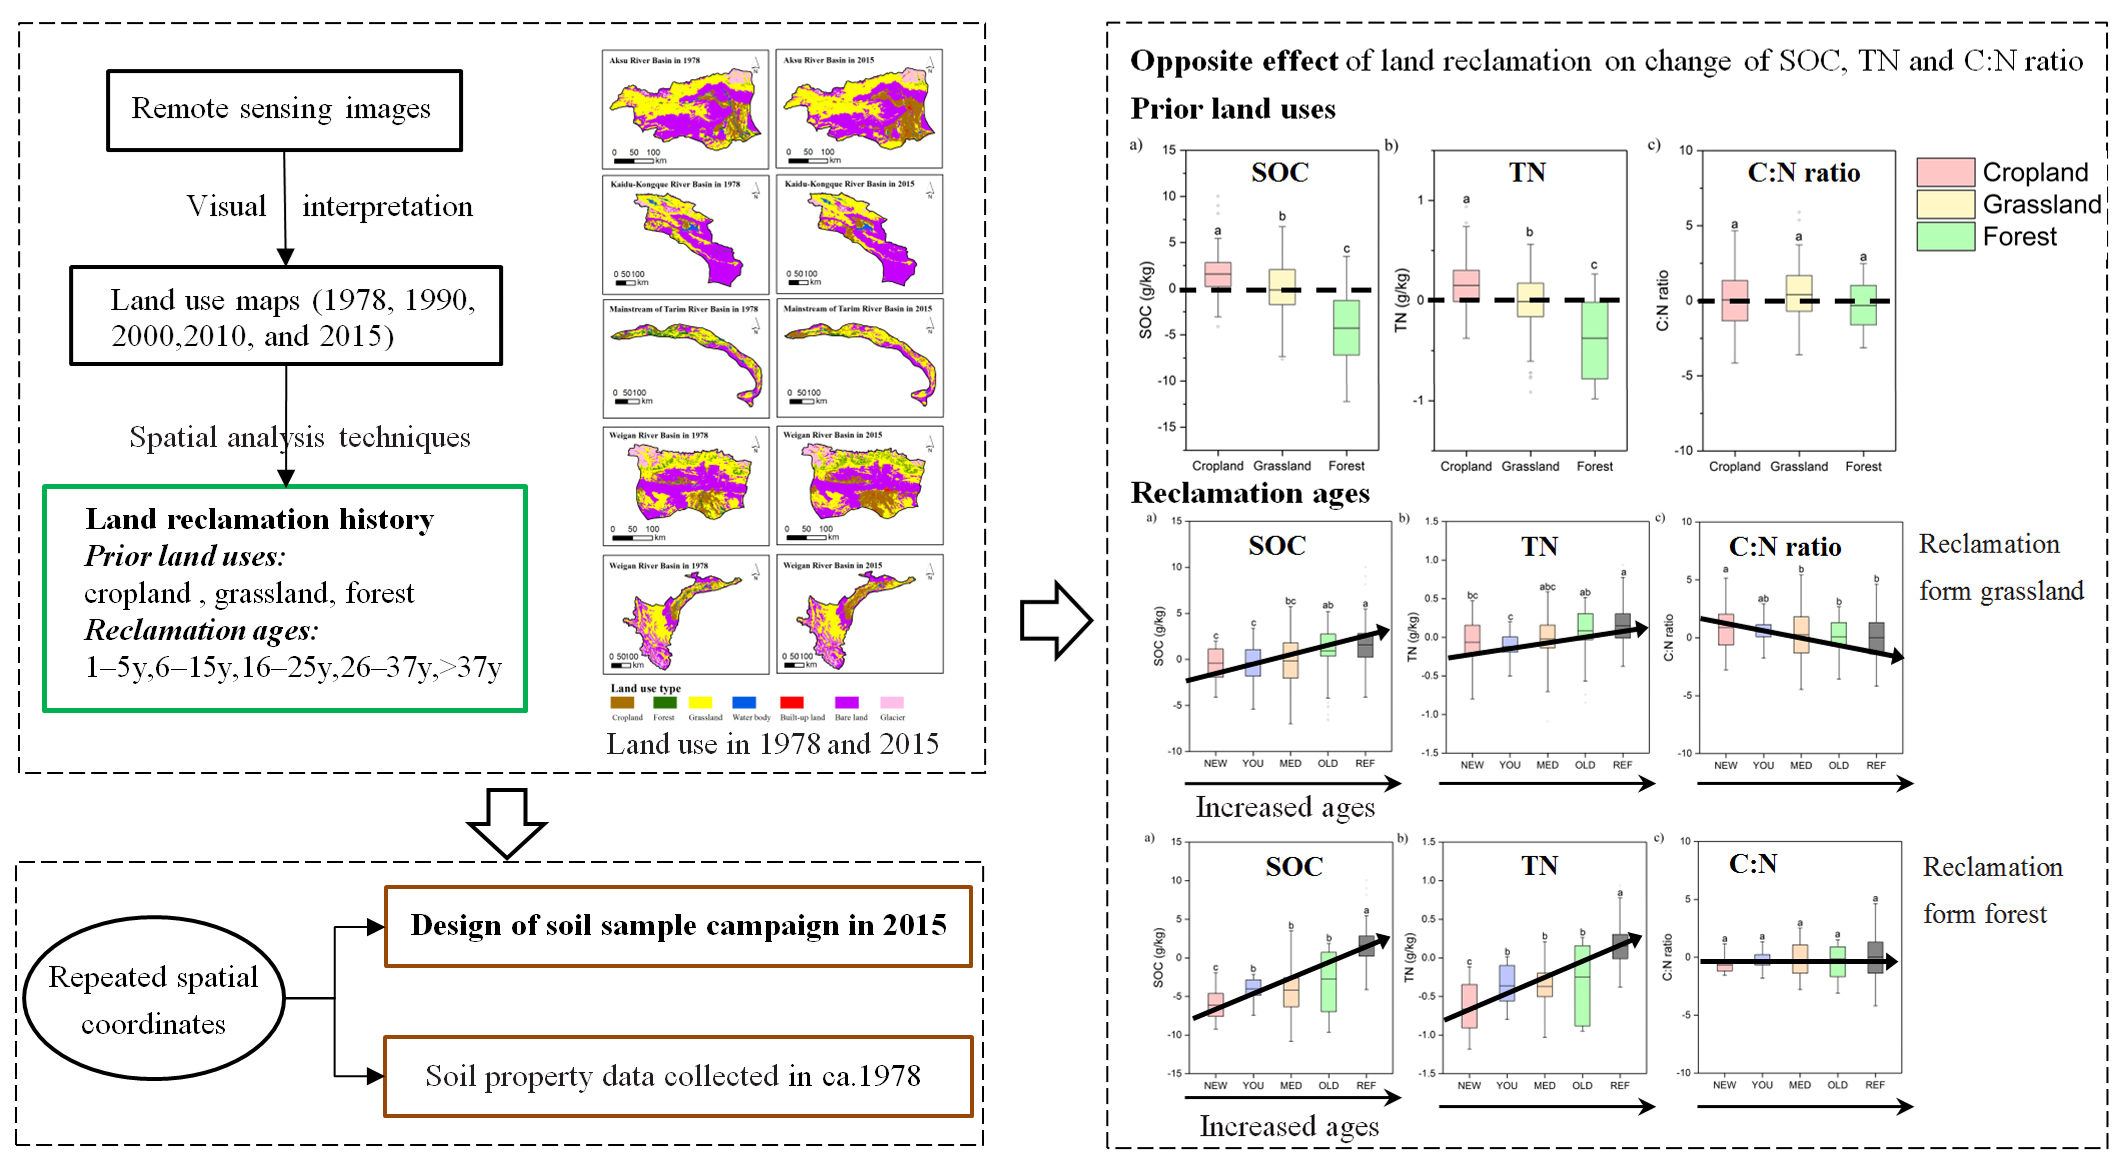
:Land reclamation influences the soil carbon and nitrogen cycling, but its scale and time effects on the balance of soil carbon and nitrogen are still uncertain. Taking the Tarim Basin as the study area, the impact of land reclamation on the soil organic carbon (SOC), total nitrogen (TN), and carbon to nitrogen (C:N) ratio was explored by the multiple temporal changes of land use and soil samples. Remote sensing detected that cropland nearly doubled in area from 1978 to 2015. Spatial analysis techniques were used to identify land changes, including the prior land uses and cultivation ages. Using land reclamation history information, a specially designed soil sampling was conducted in 2015 and compared to soil properties in ca. 1978. Results found a decoupling characteristic between the C:N ratio and SOC or TN, indicating that changes in SOC and TN do not correspond directly to changes in the C:N ratio. The land reclamation history coupled with the baseline effect has opposite impacts on the temporal rates of change in SOC, TN and C:N ratios. SOC and TN decreased during the initial stage of conversion to cropland and subsequently recovered with increasing cultivation time. By contrast, the C:N ratio for soils derived from grassland increased at the initial stage but the increase declined when cultivated longer, and the C:N ratio decreased for soils derived from forest and fluctuated with the cultivation time. Lower C:N ratios than the global average and its decreasing trend with increasing reclamation age were found in newly reclaimed croplands from grasslands. Sustainable agricultural management practices are suggested to enhance the accumulation of soil carbon and nitrogen, as well as to increase the C:N ratio to match the nitrogen deposition to a larger carbon sequestration.
1. Introduction
Soil carbon (C) and nitrogen (N) are the main sources of plant mineral nutrition and organic nutrients, which are the two primary factors affecting soil fertility [1,2]. They also play an important role in terrestrial soil C and N pools and global C and N cycles [3,4]. The ratio of soil organic carbon (SOC) and total nitrogen (TN), labeled as the C:N ratio, reliably indicates changes in soil microbial activity, decomposition, mineralization rates of SOC, and the cycle of soil C and N [5,6]. Moreover, the soil C:N ratio can be a good predictor of key parameters in the related C and N cycles, such as the dissolved organic carbon flux [7], nitrate leaching [8,9], and nitrous oxide emissions [10]. Therefore, understanding soil C and N content and their variation can help explore the mechanisms of soil C and N cycling and their coupling effects, and aid in enhancing soil C sequestration and reducing N losses in the ecosystem.
A high soil C:N ratio correlates with low organic matter (SOM) decomposition and mineralization rates while in soils with a low C:N ratio, SOM can be decomposed and mineralized relatively quickly [1]. SOC, TN, and the C:N ratio are influenced by many factors, such as climatic conditions (temperature, moisture), soil properties (soil texture, soil pH), terrain characteristics, and anthropogenic factors (land use and management) [2,11,12,13]. The soil C:N ratio and its variation are determined by gains (input of SOC and TN) and losses [11]. At the global scale, it has been shown that tundra, natural wetlands, and boreal forest can have a relatively wide range of soil C:N ratios, while croplands have a narrow range [2]. Land reclamation can alter the soil C and N bio-geochemical cycling and spatial-temporal characteristics of soil C:N ratios greatly [14,15,16,17]. The conversion from native vegetation to cropland decreases the input of vegetative tissues and increases soil temperatures to accelerate the litter decomposition and soil micro-organisms in the decomposition of soil C and N [18]. Reclamation activities can further cause C and N losses and change the soil C:N ratio [3]. Meanwhile, the increasing crop yields of land under sustainable agricultural management can enhance the input crop residues and roots, which can in turn, increase the SOM content and promote the accumulation of SOC and TN [19,20,21].
Generally, the dynamics of soil C:N ratios are determined by the relative changes in magnitude of SOC and TN contents [22,23]. Many case studies have found that forest converted to cropland results in a decrease in soil C:N ratio because of the high uptake and storage of N by trees [1,3,24,25]. In contrast, agricultural management can promote maintenance of crop residues at the soil surface, which may have beneficial impacts on soil fertility and increase the soil C:N ratio [1]. Plantation age also shows complex effects on the accumulation and decomposition of SOC and TN. For example, soil C:N ratios of cropland showed a significant increase over time at a sub-tropical site, although little change was observed at three temperate sites [11]. The above studies illustrate that the variation in soil C:N ratios during agricultural reclamation and management is complex and is not yet fully understood.
The dynamics of SOC, N, and the C:N ratio, which are affected by land use coupled with other physical factors, present significant spatial and temporal variations. Agricultural reclamation activities mean exploiting other land uses for croplands. Outcomes of reclamation are primarily the result of changes in plant types associated with the changes in the litter input, detritus and litter decomposition, root secretion and soil mineralization [14,26,27]. These changes are related to the prior land use type before the reclamation, which directly or indirectly influence the soil C, N, and their balance after the reclamation. Meanwhile, knowledge of the agricultural duration is important [28], because it is related to the cultivation intensity and the soil mellowing process. Thus, land reclamation history, including the different prior land use types and the duration age of the reclamation, will influence the fate of soil C and N. However, the effects of reclamation history remain uncertain [29], and this leads to difficulties in decision making and agriculture management. This calls for a deeper understanding of the impact that past and future land use changes can have on soil C:N ratios.
Arid and semi-arid regions are especially susceptible to human disturbance and climate change [30], which easily lead to land degradation and soil nutrient element loss [31,32,33]. Oasis agriculture is a specific ecosystem surrounded by the desert in an arid area, where environmental conditions are milder than the desert, ensuring fertility and allowing desert farming [34]. Aridisols, called Yermosols in the FAO-UNESCO classification (Food and Agriculture Organization-United Nations Educational, Scientific and Cultural Organization) [35], are the major original soil types, undisturbed by humans in arid regions [36]. The expansion of oasis agriculture disturbs the soil environment and may cause the loss of soil C and N. Under long-term sustainable tillage, fertilizing and irrigation of the oasis agriculture [37,38], Aridisols are gradually developed to Anthrosols with changes in C and N storage [35]. Thus, this calls for a deep understanding of how oasis agriculture influences the soil C and N.
The Tarim Basin contains the Taklimakan Desert, the world’s second largest shifting sand desert [39]. It has experienced a significant expansion in oasis agriculture from its native vegetation, and even the desert since 1949 [40]. The cropland area in this region has nearly doubled since the 1980s [41,42], which was much higher than the average increase rate in the world [43]. Due to the extreme dry and hot climate with annual limited precipitation of 50–100 mm, almost the entire oasis agriculture relies on irrigation for crop growth in harsh conditions and to resist drought [44]. For the last few decades, land reclamation and the development of high-efficiency irrigation techniques has played an important role in this region [45], making the Tarim Basin one of the main agricultural production regions in China and one of the largest areas of oasis agriculture in the world. This dramatic expansion in cropland has significantly changed the nutrients in the cultivated soils, and has also caused the overuse of water sources and land desertification [46], which in turn, influence the terrestrial C and N cycles [47]. Proper management of such changes requires a deep understanding of the effects of the land reclamation history on the variation in SOC and TN and their balance. Thus, the Tarim Basin was selected as the study area to explore the relationship between the land reclamation history and changes in the soil C, N, and C:N ratio. The objectives of this study were to (1) design a soil sampling campaign from land use change histories to quantify the changes in the SOC and TN dynamics of the cultivated topsoil, and (2) investigate the effects of the land reclamation history on these changes and the coupled relationships between SOC and TN.
2. Methods
2.1. Study Area
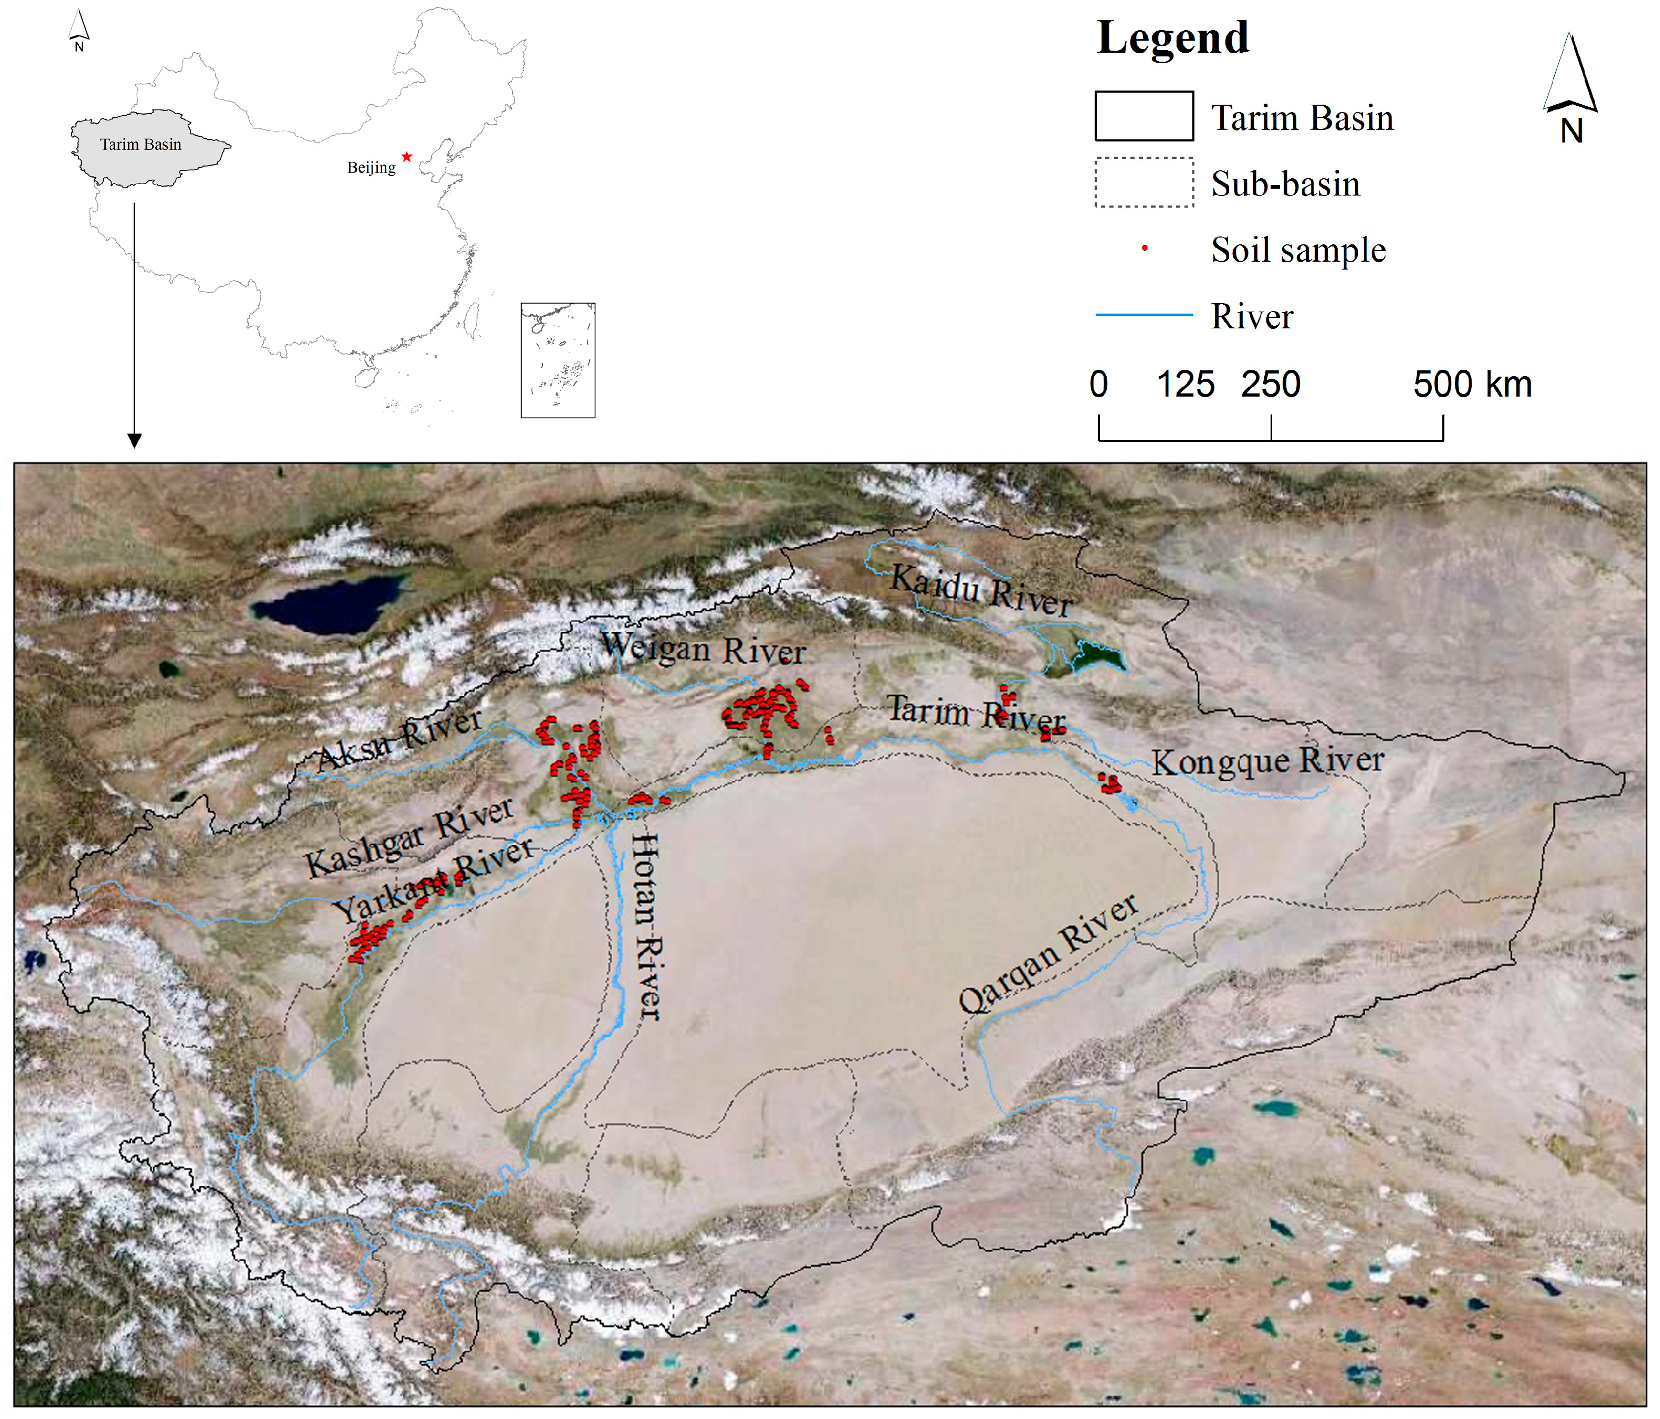
The Tarim Basin, located in the south of Xinjiang Province, Northwest China, was selected as our study region. It is located between 38°–43° N latitude and 76°–87° E longitude. Five typical sub-basins, the Aksu River Basin, the Kaidu-Kongque River Basin, the mainstream of Tarim River Basin, the Weigan River Basin, and the Yarkant River Basin, were selected as the case study sites with a total area of 311,765 km2 (Figure 1). They lie within an extremely dry climate zone, with high temperatures of 20–30 °C in the summer and low temperatures of −10 to −20 °C in winter, a mean annual precipitation of 50–100 mm, and an annual evaporation of 2000–3000 mm [48]. Landscapes in the study area majorly consist of the desert, grassland, cropland, and forest. Native forests with shrubs, mainly including the Populus euphratica Oliv. and Tamarix ramosissima Ledeb. [49], are located in the riparian zone with an adequate water supply for vegetation growth. These climatic conditions have resulted in a specific oasis agriculture, with widespread use of highly efficient water-saving irrigation techniques.
2.2. Conceptual Framework for Exploring Impacts of Land Reclamation History on Soil C and N
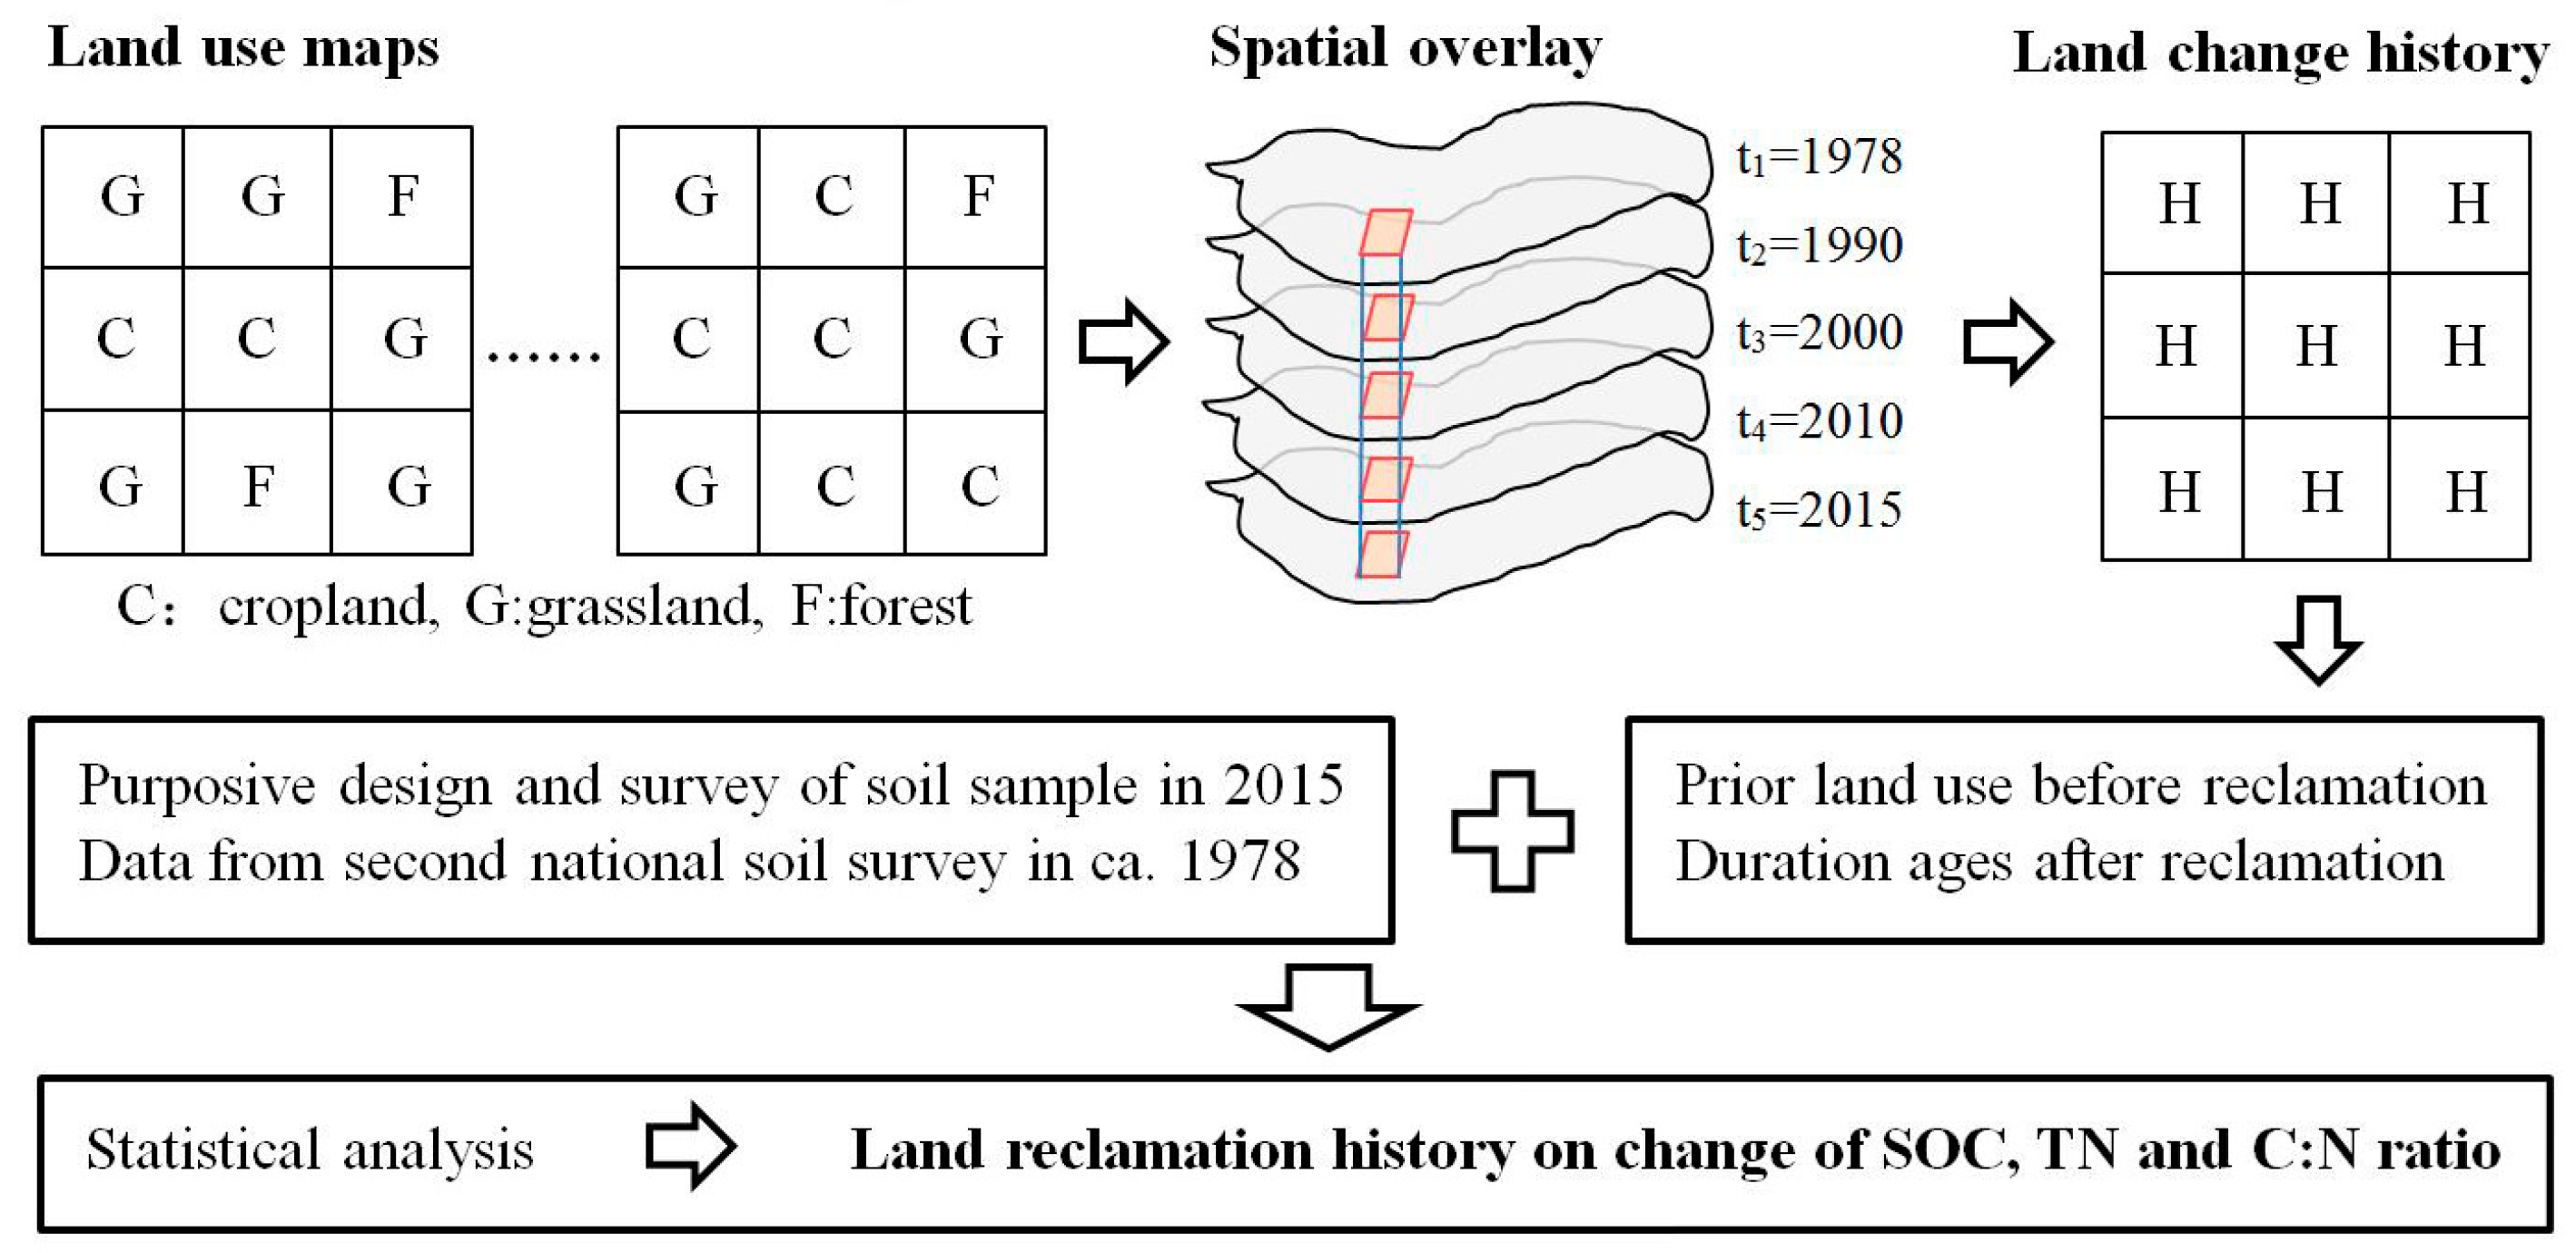
Figure 2 showed the framework for exploring how land reclamation history influences the soil properties. Using the land use maps at different time nodes and spatial overlaying techniques, the land change histories at each location were identified from ca. 1978 to 2015. Also, the specific land reclamation history, including the prior land use before the reclamation and the duration age after the reclamation were extracted. Meanwhile, the simultaneous changes of SOC, TN, and C:N ratio were collected by purposive survey sampling in 2015 and the soil dataset in ca. 1978. Based on the statistical test, the impact of land reclamation history on SOC, TN, and the C:N ratio can be analyzed.
2.3. Land Use Change History Detection
The soil sampling strategy was designed on the basis of the land reclamation history, which included land use prior to reclamation indicating the original soil nutrient status, while the cropland age was used to characterize the duration of management practices. To examine the land use change history on the SOC and TN dynamics from ca. 1980 (national soil surveys in 1978 to 1982) to 2015 (soil survey in this study), five time nodes, i.e., 1978, 1990, 2000, 2010, and 2015, of remote sensing images from Landsat MSS/TM and Landsat-8 Operational Land Imager (OLI) images were collected to map the land use via visual interpretation with a local expert tutorial on land use interpretation by ourselves. The paths and rows covering the study area are shown in Table S1. Preprocessing, including the application of geometric and atmospheric corrections, was conducted using ENVI 5.1 (ITT Visual Information Solutions Inc.). Images within ±2 y of the time node were used as a proxy when there were no effective cloud-free images from a particular node.
The land use maps were divided into seven classes: cropland, forest, grassland, water body, built-up land, bare land, and glacier. As the majority of the croplands were derived from grassland, with a minority from forest and other land use types [47], this study focused on the effects of grassland and forest conversion to croplands on the SOC and TN dynamics. Using spatial overlay techniques in ArcGIS 10.1 (ESRI Inc., Redlands, CA, USA) for the land use vector maps with seven classes at the five time nodes, the overlaying vector polygon representing the land use change trajectory from ca. 1978 to 2015 was obtained. With the overlaying land use maps, the time nodes where the reclamations occurred were obtained, and the land use prior to the reclamation was identified. Grassland, forest, and cropland were labeled as G, F, and C, respectively, and the land use types for each of the five time nodes were identified. For example, “G→G→C→C→C” indicates the reclamation of grassland to cropland in the period of 1990 to 2000. The label “C→C→C→C→C”, indicates that the cropland was assarted before 1978, and land with this history of use was used as a reference for this study. Following labeling for land use, the assarted croplands were grouped according to age as follows: assarted between 2010 and 2015 (new, 1–5 years), 2000 and 2010 (young, 6–15 years), 1990 and 2000 (medium, 16–25 years), 1978 and 1990 (old, 26–37 years). In addition, in some areas land use changes occurred more than once, and cases where cropland transferred to other land use types because of abandonment or build-up and occupation were excluded in this study. Thus, cropland, grassland, and forest were the three prior land use types in this study. Finally, three land use change types, i.e., unchanged cropland, cropland from grassland, and cropland from forest over nearly four decades, with five discrete reclamation ages were identified for the design of the soil sampling campaign.
2.4. Soil Sampling Design, Collection, and Laboratory Methods
Since we were particularly interested in the effect of land reclamation history, soil sampling conducted in 2015 was only carried out for cropland with different reclamation histories. First, the range of cropland in 2015 was extracted and 280 soil plots were identified in the croplands of five sub-basins by a random sampling strategy. A minimum distance of 1000 m between plots of the same category of land use change history was set. Next, three land use change types and five discrete reclamation ages from 1978 to 2015 in the designed soil plots were identified based on the spatial overlay techniques mentioned in Section 2.1. If the area of the vector polygon for overlaying land use maps was smaller than 1 km2, the corresponding soil plots were excluded to minimize geolocalization errors of land use interpretation and make the resolution of land use maps consistent with soil C and N data. Finally, we collected samples from a total of 270 soil sample plots, including 126, 103, and 41 plots of unchanged cropland, cropland from grassland, and cropland from forest between 1978 and 2015, respectively. At each sampling plot of 10 m × 10 m, five sites, four at the corners and one in the center of the plot, were selected. According to the Genetic Soil Classification of China [38], the main soil type of the soil samples is irrigation-silted soil (Aric Anthrols in the FAO-UNESCO classification). Irrigation-silted soil is a type of Anthrosol and formed the new anthraquic epipedon in the soil irragric process and mellowing process under cultivation, which means soil materials are silted with irrigation water [38].
The soil C and N distribution within soil profile is highly influenced by management practices, especially tillage systems [50]. As soil disturbance by agricultural tillage is a primary cause of the historical change of soil nutrients, the tillage zone or management zone, mainly including the 0–20 cm soil layer, was sampled using a soil auger of 5 cm diameter. Soil samples were transported to the laboratory and preprocessing was conducted. Soil clods were crushed, and litter and living roots, stones (>2 mm), and visible plant remains were removed. Next, the soil samples were air-dried in the shade and passed through a 2 mm sieve. SOC and TN were measured by the H2SO4-K2Cr2O7 oxidation method [51] and Kjeldahl procedure [52], respectively. Soil C:N fractions were calculated as the mass ratio of SOC to TN.
To compare simultaneous changes in soil properties and land use, the SOM and TN from ca. 1978 were obtained from the soil characteristics database of China, which were measured by the same chemical analysis methods as those used in 2015. This data has a resolution of 30 × 30 arc-seconds, and was generated from soil data collected in the 1979–1982 national soil survey. As the designed soil plots were located in the overlaying land use vector polygon with an area of larger than 1 km2 (close to 30 × 30 arc-seconds), the spatial resolution of land reclamation histories and soil properties in the plot were consistent and could be compared and analyzed. The data was provided by the Cold and Arid Regions Science Data Center at Lanzhou [53] and downloaded from their website (http://westdc.westgis.ac.cn/data). The SOC was then calculated from SOM values, using the Bemmelen index of 0.58, which was widely used in previous studies [54,55]. Since the soil data set consists of eight vertical layers with different depths, the SOC and TN at the study depth of 0–20 cm were estimated by a weighted depth method provided by Yan, et al. [19].
2.5. Statistical Analysis
Statistical analysis was carried out using the SPSS18.0 statistical package (SPSS Inc., New York, NY, USA). Differences in variation of SOC, TN, and C:N ratio for the 270 soil plots between ca. 1978 and 2015 were calculated using paired-samples t-tests, using 270 pairs in the same spatial coordinates. The significance of differences in the levels and variations of SOC, TN, and C:N ratio in plots with different land reclamation histories were tested with one-way analysis of variance (ANOVA) and least-significant-difference (LSD) methods, followed by Tamhane post hoc tests (p < 0.05).
3. Results
3.1. Land Reclamation from 1978 to 2015 in Typical Areas of the Tarim Basin
The classification accuracy of land use maps was assessed by a total of 2000 ground-reference data-points in the five sub-basins, including the field validation investigations with GPS in 2015, and points from high resolution images from Google Earth in 2010 and 2015. The ground-reference data-points were randomly collated by the stratified land use types. This assessment found a high classification accuracy, with kappa coefficients of 0.913 and 0.906 and an overall accuracy of 92.30% and 91.35% for the 2010 and 2015 data, respectively. Since the visual interpretation methods used for other year were similar, it was assumed that the classification accuracies of land use maps for 1990 and 2000 were similar to those for the 2010 and 2015 maps. Similar to previous studies using the multiple Landsat MSS/TM images for long time series of land use change detection [56,57], the land use map in 1978 interpreted by the same executor with the same satellite and similar images could be relied upon. Figure 3 shows the land use maps for 1978 and 2015.
Croplands accounted for 10.37% of the total area of the five sub-basins of the Tarim Basin in 2015. Areas of croplands were 1.72 × 10⁴, 1.89 × 10⁴, 2.11 × 10⁴, 2.72 × 10⁴, and 3.23 × 10⁴ km2 for the five time nodes of 1978, 1990, 2000, 2010, and 2015, respectively. The cropland area nearly doubled with a significantly increased rate of 88.37% from 1978 to 2015. Most of them mainly expanded in the vicinity of their existing areas. The assarted croplands were converted from grassland, forest, bare land, and water body, with the proportions of 70.35%, 16.89%, 9.56%, and 3.20%, respectively.
3.2. Status and Change in Soil C, N and C:N
Table 1 shows the statistical characteristics of SOC, TN, and C:N ratios in the Tarim Basin. The mean values of these parameters increased from ca.1978 to 2015 with varying magnitudes, but do not show a significant change (p < 0.05). The mean SOC content is 6.61 g/kg, with an increase of 0.17 g/kg from ca.1978 to 2015. The TN contents, meanwhile, increased from 0.63 g/kg to 0.65 g/kg. It was found that the TN content is highly correlated with the SOC content in 270 soil sample plots, showing high Pearson’s correlation coefficients of 0.938 and 0.925 in ca. 1978 and 2015, respectively. Although the range of contents of SOC and TN increased from ca. 1978 to 2015 (Table 1), their standard deviations decreased. With cultivation practices, the standard deviation of SOC and TN in 270 plots show increases from 1.96 g/kg and 0.22 g/kg, respectively, in ca. 1978, to 2.90 g/kg and 0.28 g/kg, respectively, in 2015.
The change in statistical characteristics for the C:N ratio is similar to those of SOC and TN content. The mean C:N ratio is 10.22 in 2015, ranging from 6.11 to 17.25. Most of these values fall in the range from 9.0 (10% quantile) to 11.5 (90% quantile). A larger increase in SOC over TN resulted in a slight increase of 0.11 in the C:N ratio from circa (ca.) 1978 to 2015, with no significant change at the 95% confidence level. Long-term cultivation has tended to homogenize the soil C:N ratio, resulting in a decrease in standard deviation, from 1.73 in ca. 1978 to 1.21 in 2015, separating the soil plots as two groups, i.e., the increased values from ca. 1978 to 2015 and decreased values at this period. Using the paired-samples t-test, two-third of the total observations showed an increasing trend in SOC and TN at a significant level of 99%, and other one-third showed a significant decrease. In contrast, about 59.26% of the total observations showed an increasing trend in C:N ratio at a non-significant level of 95%, with the remainder showing a decrease at a significant level of 95%. Thus, a deep exploration of change in soil C and N based on the different land reclamation histories is called for.
3.3. Effects of Land Reclamation History on SOC and TN
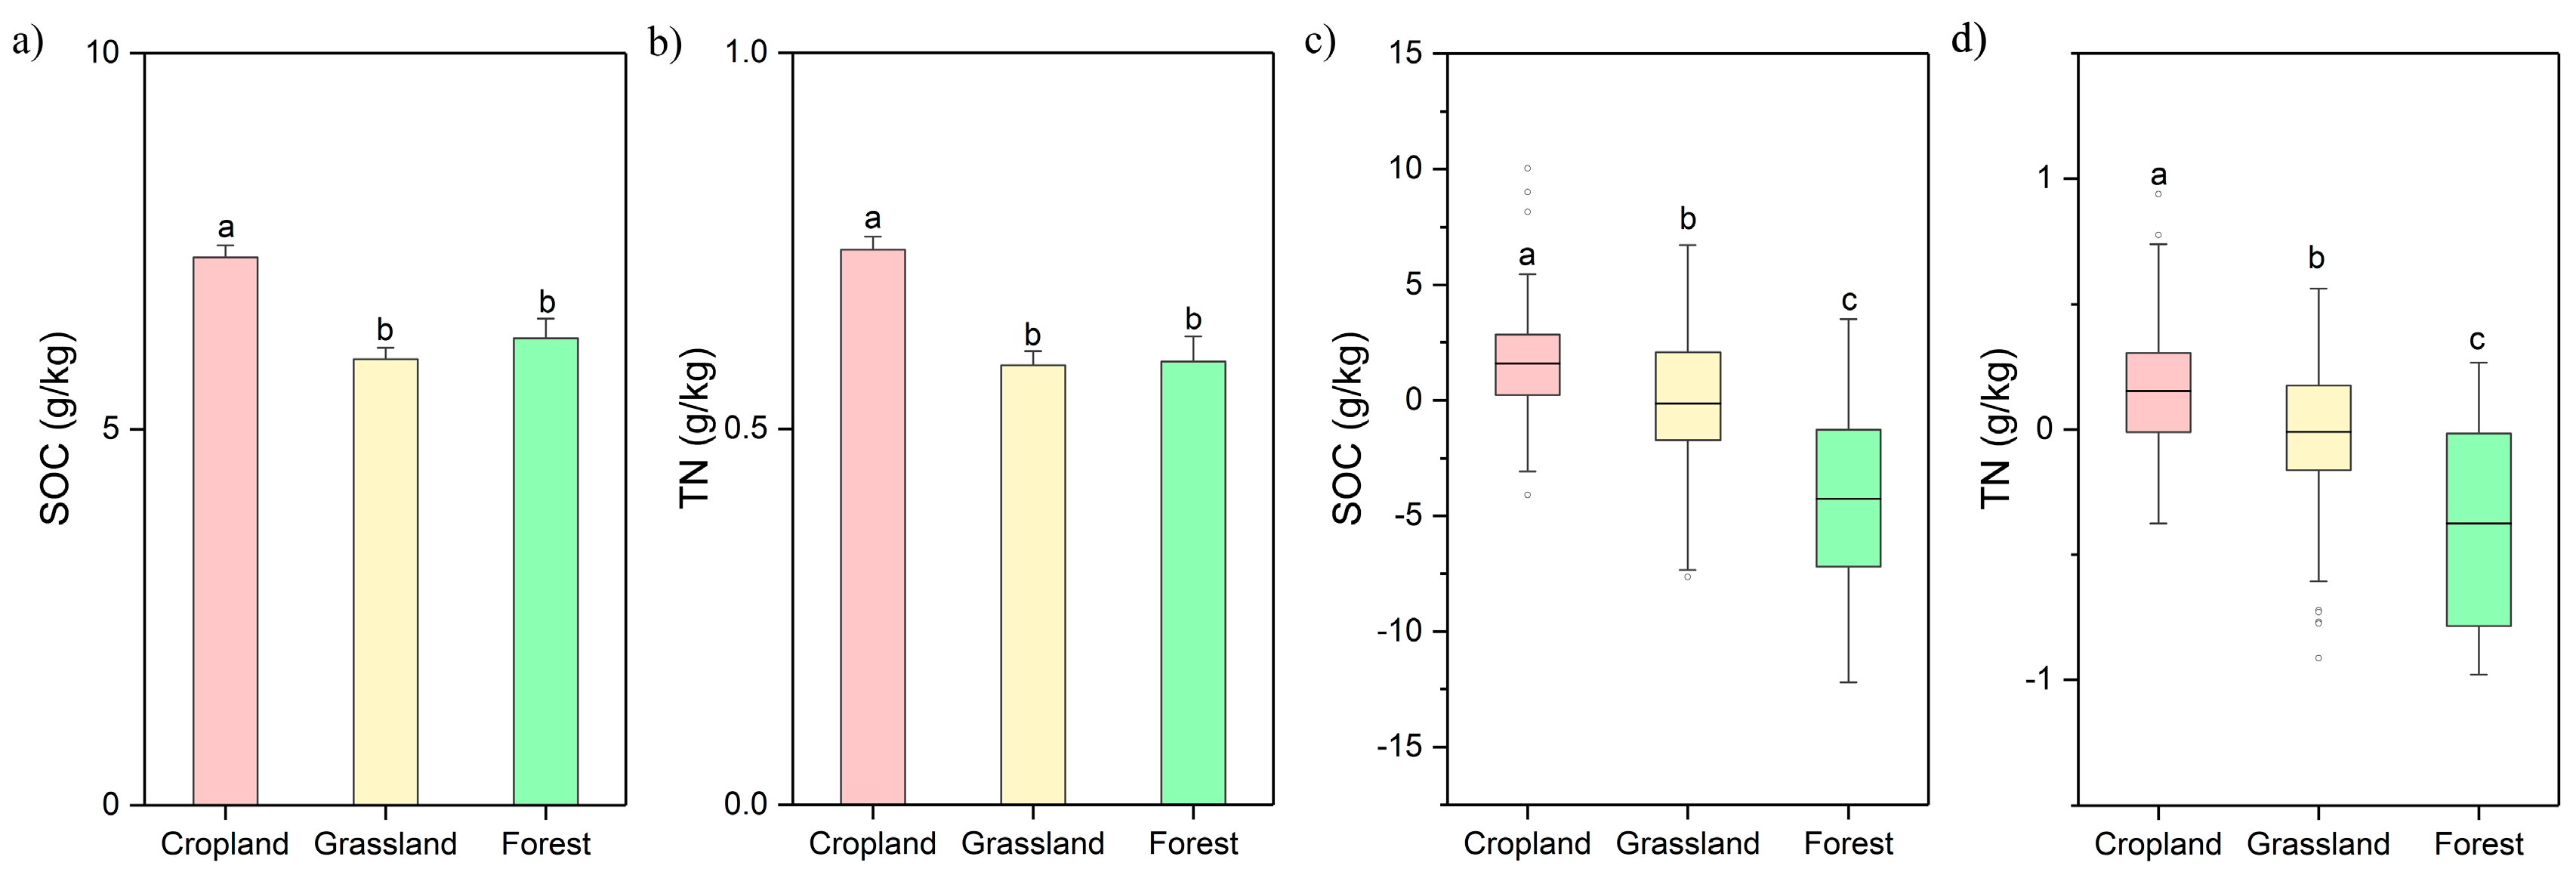
The selected sites presented significant differences (p < 0.05) in SOC and TN contents in 2015, depending on their prior land uses (Figure 4a,b). The SOC and TN contents of cropland soils for lands assarted before 1978 were 7.29 g/kg and 0.74 g/kg, respectively. These values were significantly higher than those for soils from land with prior use as grassland and forest assarted in the study period. The SOC content in previously forested land (6.21 g/kg) is slightly higher than that for land that was previously grassland (5.93 g/kg), and the TN content of soil from forest (0.59 g/kg) is close to that from grassland (0.58 g/kg). Comparing the SOC and TN contents in ca. 1978 and 2015, differences in change values according to prior land use were also significant (p < 0.05) (Figure 4c,d). In 2015, SOC and TN content in those sites previously used as cropland had significantly increased, as indicated by the paired-samples t-test (p < 0.05), the largest increases being 1.59 g/kg and 0.15 g/kg, respectively. Sites where prior land use was grassland showed an increase in SOC content of 0.17 g/kg and a slight decrease in TN content. In contrast, the SOC and TN content in previously forested land showed a significant decrease of 4.18 g/kg and 0.30 g/kg, respectively.
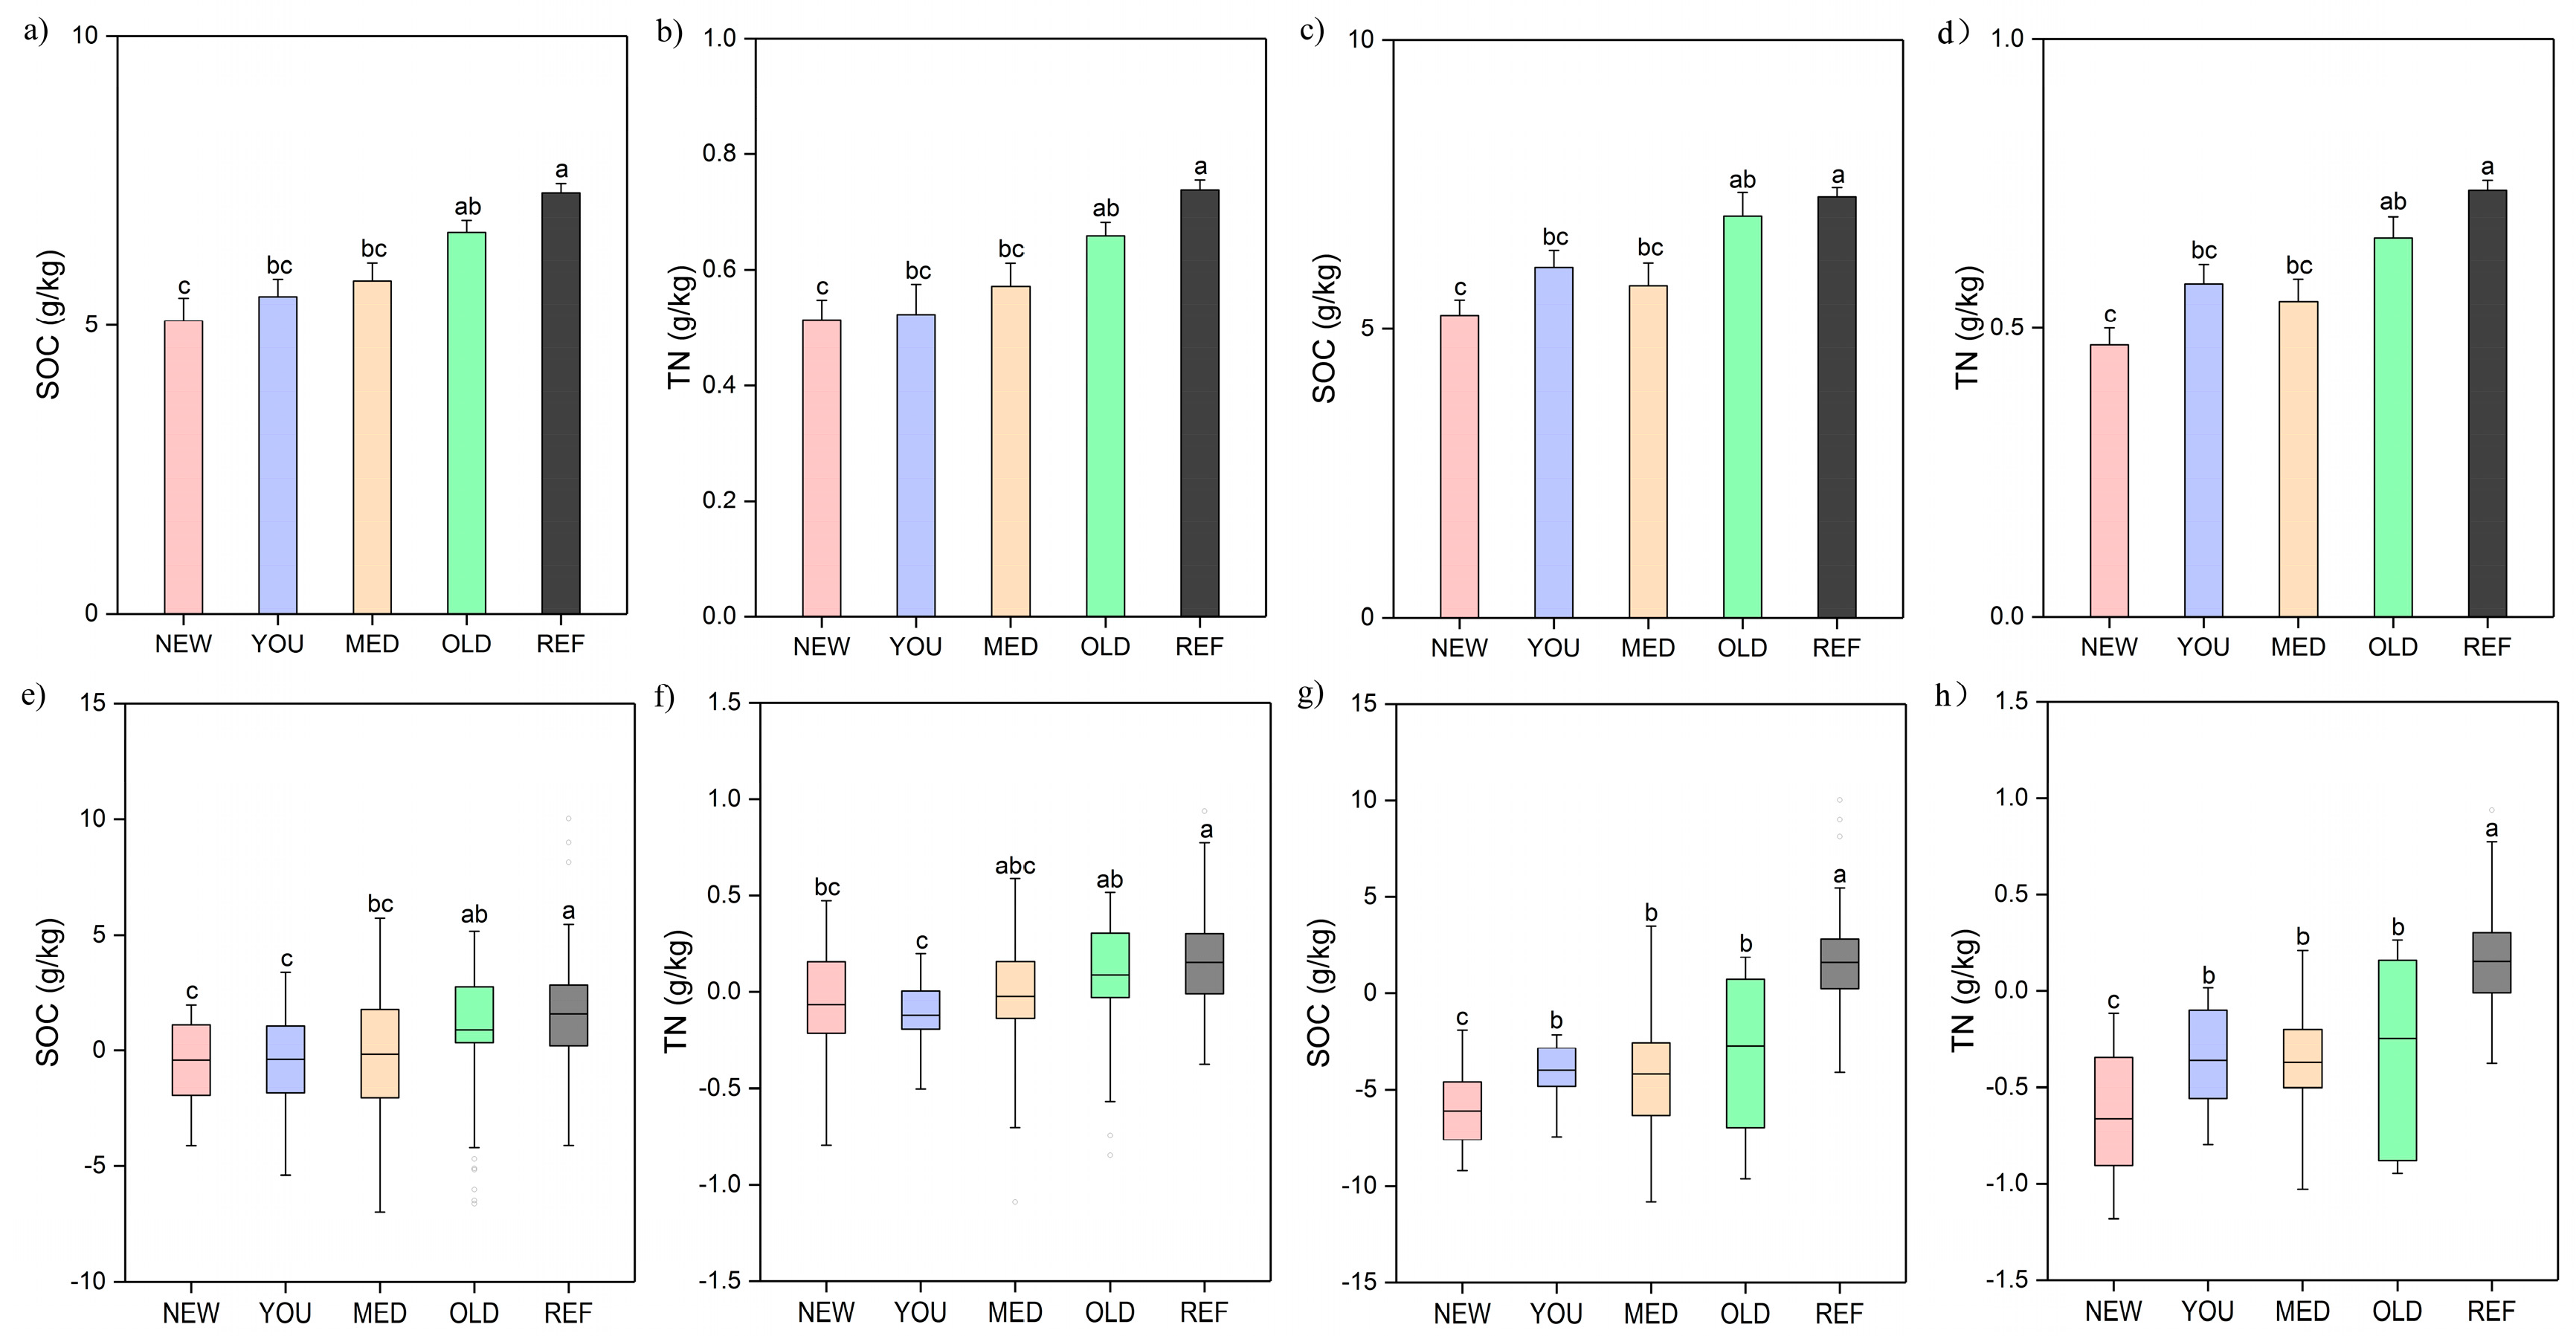
With the increasing reclamation age, the accumulation of SOC and TN in soil from land derived from grassland and forest increased (Figure 5a–d). The mean SOC and TN content in the newly assarted soils were the lowest, and were significantly lower than those in the old assarted soils (p < 0.05). In addition, SOC and TN content for old assarted soils were lower than the reference cropland assarted before 1978, but were not significantly different. The SOC content in land that was previously grassland and forest increased significantly from 5.17 and 5.23 g/kg in the newly assarted soils to 6.60 and 6.95 g/kg in the old assarted soils, respectively (Figure 5a,c). Similarly, the TN content in land that was previously grassland and forest increased significantly from 0.51 and 0.47 g/kg in the newly assarted soils to 0.66 and 0.66 g/kg in the old assarted soils, respectively (Figure 5b,d).
An increase in the reclamation age resulted in an accumulation in SOC and TN at a significance level of 95% (Figure 5e–h). Compared to the initial SOC and TN levels prior to reclamation, changes in content for new, young, and medium assarted soils were negative. The decreases in the newly assarted soils were the largest, and increasing reclamation age resulted in increases in SOC and TN stocks. A slight decrease in SOC and TN content in the sites which were previously grassland was observed, with a larger decrease for previously forested sites. For example, the changes in SOC content for new, young, and medium croplands derived from grassland are −0.48, −0.32, and −0.07 g/kg, respectively; and those for croplands derived from forest are −6.03, −3.90, and −4.19 g/kg, respectively. With a longer cultivation age, the change in SOC and TN in old croplands derived from grassland was positive, with mean values of 0.89 and 0.09 g/kg, respectively, which were significantly higher than those of newly assarted croplands with mean changes of −0.48 and −0.06 (p < 0.05) (Figure 5e,f). In contrast, changes in SOC and TN in soils from old croplands derived from forested lands were still negative, with mean values of −2.91 and −0.25 g/kg, respectively (Figure 5g,h).
3.4. Effects of Land Reclamation History on Soil C:N Ratio
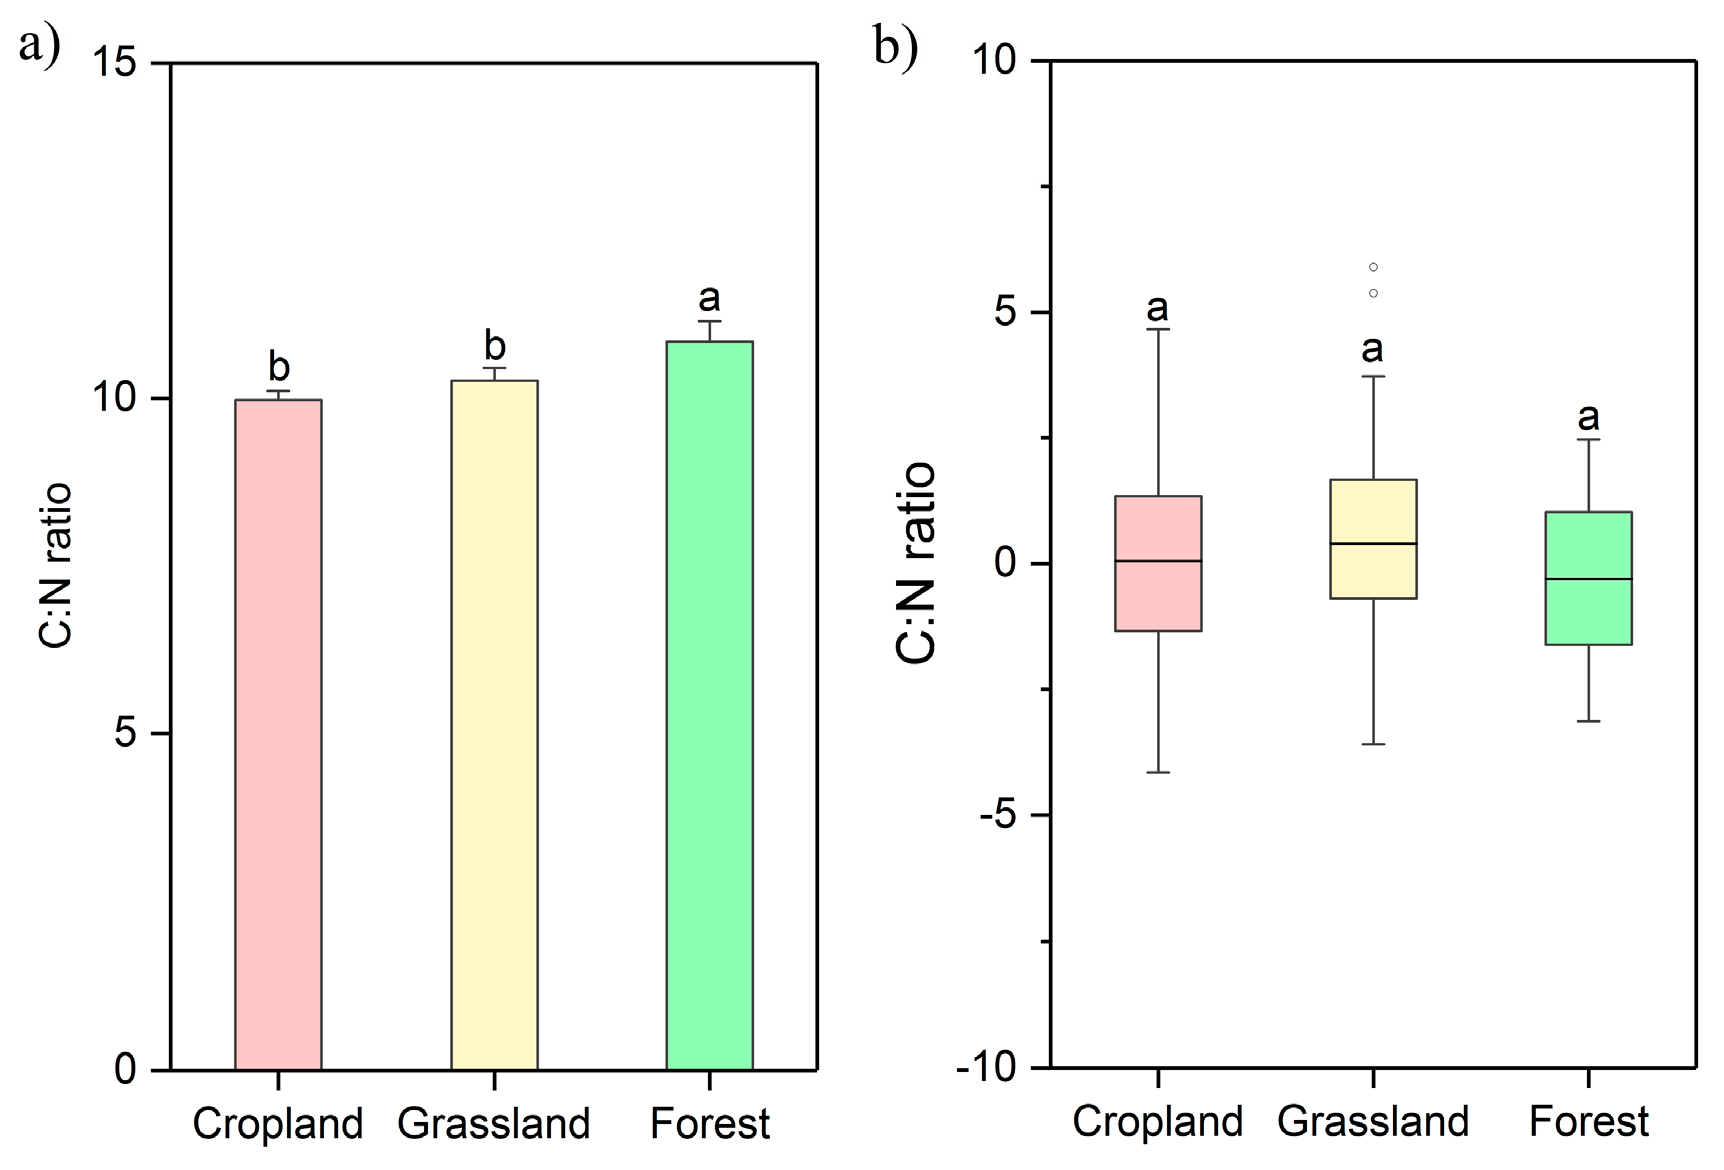
Compared to the difference in SOC and TN levels for different prior land uses, the C:N ratios showed opposite characteristics (Figure 6a). The C:N ratio in previously forested land (10.85) was significantly higher than where the prior land use was cropland or grassland (9.96 and 10.29, respectively). Comparing the changes with the three prior land uses in the past four decades, the C:N ratios showed non-significant variations (p < 0.05) (Figure 6b), of 0.05, 0.32, and −0.25 for sites with prior land use as cropland, grassland, and forest, respectively. The C:N ratio for sites with prior land use as cropland increased slightly, from 9.91 to 9.96 in two periods of ca. 1978 and 2015, with a non-significant change as indicated by the paired-samples t-test (p < 0.05). In contrast, the C:N ratio for soils from grassland sites increased from 9.97 to 10.29, and the ratio for forest sites decreased from 11.10 to 10.85.
Although the SOC and TN changed significantly with increasing reclamation age, the change in soil C:N ratios shows different trends (Figure 7a,b). With an increase in the reclamation age, C:N ratios with prior land use as grassland significantly decreased from 10.79 in the newly assarted soils to 9.92 in the old assarted soils at a 95% confidence level (Figure 7a). The C:N ratio of old assarted soils was close to the C:N ratio of 9.96 in the reference cropland soils assarted prior to 1978. In contrast, relatively little variation, with a non-significant difference in C:N ratios, was found for soils from previously forested land (Figure 7b). C:N ratios from the previously forested land are 10.98, 11.01, 10.83, and 10.87 for the new, young, medium, and old assarted soils, respectively.
Changes in C:N ratios in two periods of ca. 1978 and 2015 were found to have relatively less variation (Figure 7c,d). The changes in C:N ratios for grassland tended to be positive, but that increased magnitude tended to diminish with increasing reclamation age (Figure 7c). The mean increase in C:N ratio was 0.89 for newly assarted soils, which is significantly higher than those in medium and old assarted soils, with mean values of 0.28 and 0.06 at a 95% confidence level, respectively. Moreover, for previously forested land, the change in the magnitude of the C:N ratios did not tend to vary significantly with an increase in the reclamation age, being −0.43, −0.21, −0.23, −0.15 for new, young, medium, and old assarted soils, respectively (Figure 7d).
4. Discussion
Land use change history is closely related to soil C and N dynamics [1,29]. Numerous studies have explored the relationship between soil C and N, however, the balance between them and their coupling relationship remains uncertain [55]. This study investigated how large-scale cultivation has affected the SOC, TN, and C:N ratio. Using remote sensing and GIS techniques, this research identified the land use change history, which indicated that cropland has nearly doubled in typical regions of the Tarim Basin over the last four decades. According to different land reclamation histories, large-scale soil sampling was conducted to quantify the spatial variability of soil C and N. The multiple temporal changes of land use and soil proprieties using a repeated soil sampling strategy allowed the investigation of the time effects of reclamation on the soil C:N ratio [22,58]. Results found that the changes in soil C:N ratios are significantly different from the changes in SOC and TN under different land reclamation histories. This research can serve as a better reference for the soil C and N balance in ecological interactions and processes [59].
Land reclamation from grassland and forest in the study area resulted in SOC and TN loss during the initial reclamation stages, but these recovered with increasing reclamation age (Figure 5), which is in accordance with previous studies [18,60,61]. Anthropogenic disturbances frequently destroy the initial soil structure and accelerate the mineralization and decomposition process of SOM, which can intensify losses of C and N [62,63,64]. In the study area, the scarce water resources and low rate of bioaccumulation limited the growth of uncultivated grassland, primarily desert steppe [65], which resulted in a low level of initial SOC and TN [47,66]. After reclamation, the conditions of soil moisture and biomass growth improved in the arid regions; processes which can increase the above- and below-ground biomass, and result in soil C and N accumulation with increasing reclamation age [67]. The high-efficiency agricultural production in the Tarin Basin increases the crop yield with enhanced soil C and N input through crop residues and also enhances the anthropogenic mellowing process of soils to improve the soil structure and function, which further promotes the accumulation of soil C and N [68]. Improved agricultural practices, including applying organic manure, and conservative tillage measures are used in oasis agriculture, which enhances the soil C and N storage by providing water, organic amendments, and increased crop residue is returned to the soil [19,69,70].
C and N cycling are tightly coupled in ecosystems [71] and TN change in soils is generally assumed to follow variation in SOC, since both elements are bound into organic compounds [72,73]. The high correlation between these parameters was confirmed in this study. Land use change and management practices can alter C and N bio-geochemical cycling, and the change in soil C:N ratio can be used to determine the relative input and output of SOC and TN [23]. This study found that land reclamation history change had an opposite effect on C:N ratio, compared to the trends observed for SOC and TN. The magnitude of changes observed for C:N ratios were also smaller than those observed for SOC and TN (Figure 4, Figure 5, Figure 6 and Figure 7). This implied that the change in C:N ratio is complex and does not show consistency with either C or N variations.
Different land use regulates C and N source availability, soil microbial activities, and therefore litter decomposition rates [74,75,76]. In general, forested soils had a higher C:N ratio, which is to be expected since trees take up more N and store it within their biomass rather than in the soil, and also, microbial decomposers of forested soils have higher C:N ratios than cultivated soils [3,25]. This resulted in a significant decrease in C:N ratios when forests were converted to croplands (Figure 6). In contrast, the conversion from grassland to cropland resulted in an increase in C:N ratios but a decrease in SOC and TN (Figure 4 and Figure 6) in the initial reclamation process, indicating a greater loss of N compared to that of SOC. This may be partly explained by baseline effects [58]. In the Tarim Basin, the uncultivated grassland, primarily desert steppe, was limited by water resources and a lower rate of bioaccumulation [65], resulting in a lower level of initial SOC than TN [47,66]. Cultivation with adequate water supplies and fertilizer application would significantly improve soil physicochemical properties [77]. Land reclamation enhanced the C input of the litter returned to the soil and sped up nutrient cycling, resulting in an increase in the soil C:N ratio [23,78]. This, in turn, can result in relatively lower SOC losses, and more SOC accumulation compared to TN to increase the C:N ratio at the initial reclamation stage.
Moreover, as the age of cultivated soils increased, the different accumulation rates of C and N in the soils resulted in a change of C:N ratio [79]. With increasing reclamation age, it was found that the increases in C:N ratios for sites previously used as grassland tended to be less (Figure 7c). The increased N accumulation in the soil may be partly due to the overuse of N fertilizer, an effective way to increase crop biomass and yield, enhancing the N deposition in soils [80]. An experimental site receiving synthetic N fertilization over a 40–50 year period indicated a net decline in soil C [81]. Thus, the C:N ratio decreased according to the smaller change rate of SOC accumulation than N deposition. In addition, C:N ratios from previously forested land stayed relatively stable, indicating similar accumulation rates and a relative balance between SOC and TN. The variations in soil C:N ratio are not only caused by C and N inputs, but also by decomposition in soils [11]. Soil micro-organisms in the previously forested soils may enhance nitrogen-induced increases in the C uptake in the soil [82]. The underlying mechanisms of these variations and the longer time monitoring of C:N ratios require further study.
The global mean value of soil C:N ratios (0–30 cm) in cropland is 12.5 [2], which is much higher than the mean level for our study area (10.22), and the highest value for sites derived from forest (10.85). In addition, the C:N ratios for sites derived from grassland with low cropland ages tended to decrease with increasing reclamation age. A reduction in the soil C:N ratio could disrupt the balance between soil C and N cycling and cause loss of N through leaching and denitrification processes [1,22,83]. These results highlight the importance of effective agricultural management for the soils in the study area. Although the change in C:N ratios for cropland assarted before 1978 has remained relatively stable over the last four decades, it was found that over 10% of these C:N ratios were larger than 12.50, indicating that it is possible to increase the C:N ratio with the use of sustainable agricultural management. For example, no-tillage can increase soil C:N ratios as compared to the use of traditional pillow tillage [1,84,85]. In addition, using N fertilizer more efficiently and decreasing the overall amounts used would effectively decrease the input of N to soils [80,86]. Management efforts in the region should focus on how to enhance the accumulation of soil C and N, and also to better understand their coupling characteristics in order that N deposition might be matched with C sequestration [87].
5. Conclusions
To reveal the effect of land use changes on the balance of soil C and N, a purpose designed sampling strategy, along with the gathering of information on different land use change histories, was conducted in representative areas within the Tarim Basin. Based on the visual interpretation of data from remote sensing, cropland area nearly doubled in four decades in the study area, where over 70% of new cropland was assarted mainly from grasslands, a small fraction from forest, and few from other land use types. Using GIS spatial analysis techniques, three prior land uses and five types of cropland age were identified. The status and change in soil C, N, and their fractions were investigated under the different land reclamation histories. Results found that the prior land use significantly influenced the soil C and N. Meanwhile, the relative magnitudes of C:N ratios for the various land uses were,: forest > grassland > cropland. For soils assarted before 1978, SOC and TN significantly increased, but the C:N ratio increased slightly by 0.05 without a significant difference. An increase was found in the SOC, TN, and C:N ratio where prior land use was grassland, but these decreased in soils derived from forest between 1978 and 2015. The change in magnitudes of SOC and TN with a significant difference between three prior land uses is larger than that C:N ratio with a non-significant difference. SOC and TN decreased in the initial stage of the reclamation process and did not recover in the short term. After 30 years of cultivation, the decrease in initial SOC and TN values for land recovered from grassland had recovered. SOC and TN loss from land derived from forest, however, was not completely recovered even after 40 years of agricultural management. With increasing reclamation age, the increase in C:N ratios of soils from land derived from grassland was less, but remained relatively stable for land derived from forest. The findings in this study indicated near opposite effects of land reclamation history on the soil C and N and C:N ratios. Differences in the variation of the soil C:N ratio are determined by the relative input and output of SOC and TN under the different land reclamation processes and associated cultivation practices. Since the C:N ratios are much lower than the global average and show a decreasing trend in soils derived from grasslands, the application of sustainable agricultural management is suggested to increase not only SOC and TN, but also the C:N ratio, matching N deposition with the currently larger amount of carbon sequestration.
Supplementary Materials
The following are available online at https://0-www-mdpi-com.brum.beds.ac.uk/2073-4395/9/2/86/s1, Table S1: Landsat image description.
Author Contributions
E.X., H.Z. and Y.X. conceived and designed the experiments. E.X. and Y.X. analyzed the data. E.X. and H.Z. wrote and revised the paper.
Funding
This work was financially supported by the National Natural Science Foundations of China (Grant No. 41671097, 41601095 and 41561070).
Acknowledgments
We are thankful to the National Natural Science Foundations of China for their financial support of the present study and the comments and suggestions of the editor and reviewers.
Conflicts of Interest
The authors declare no conflict of interest.
References
- Liu, M.; Ussiri, D.A.; Lal, R. Soil organic carbon and nitrogen fractions under different land uses and tillage practices. Commun. Soil Sci. Plant Anal. 2016, 47, 1528–1541. [Google Scholar] [CrossRef]
- Xu, X.; Thornton, P.E.; Post, W.M. A global analysis of soil microbial biomass carbon, nitrogen and phosphorus in terrestrial ecosystems. Glob. Ecol. Biogeogr. 2013, 22, 737–749. [Google Scholar] [CrossRef]
- Murty, D.; Tarinm, M.U.; Mcmurtrie, R.E.; Mcgilvray, H. Does conversion of forest to agricultural land change soil carbon and nitrogen? A review of the literature. Glob. Chang. Biol. 2002, 8, 105–123. [Google Scholar] [CrossRef]
- Stiglitz, R.; Mikhailova, E.; Sharp, J.; Post, C.; Schlautman, M.; Gerard, P.; Cope, M. Predicting Soil Organic Carbon and Total Nitrogen at the Farm Scale Using Quantitative Color Sensor Measurements. Agronomy 2018, 8, 212. [Google Scholar] [CrossRef]
- Huang, B.; Sun, W.; Zhao, Y.; Zhu, J.; Yang, R.; Zou, Z.; Ding, F.; Su, J. Temporal and spatial variability of soil organic matter and total nitrogen in an agricultural ecosystem as affected by farming practices. Geoderma 2007, 139, 336–345. [Google Scholar] [CrossRef]
- Wiesmeier, M.; Hübner, R.; Barthold, F.; Spörlein, P.; Geuß, U.; Hangen, E.; Reischl, A.; Schilling, B.; von Lützow, M.; Kögel-Knabner, I. Amount, distribution and driving factors of soil organic carbon and nitrogen in cropland and grassland soils of southeast Germany (Bavaria). Agric., Ecosyst. Environ. 2013, 176, 39–52. [Google Scholar] [CrossRef]
- Kindler, R.; Siemens, J.; Kaiser, K.; Walmsley, D.C.; Bernhofer, C.; Buchmann, N.; Cellier, P.; Eugster, W.; Gleixner, G.; Grũnwald, T. Dissolved carbon leaching from soil is a crucial component of the net ecosystem carbon balance. Glob. Change Biol. 2011, 17, 1167–1185. [Google Scholar] [CrossRef] [Green Version]
- Lovett, G.M.; Weathers, K.C.; Arthur, M.A. Control of Nitrogen Loss from Forested Watersheds by Soil Carbon: Nitrogen Ratio andTree Species Composition. Ecosystems 2002, 5, 712–718. [Google Scholar] [CrossRef]
- Cools, N.; Vesterdal, L.; De Vos, B.; Vanguelova, E.; Hansen, K. Tree species is the major factor explaining C:N ratios in European forest soils. For. Ecol. Manag. 2014, 311, 3–16. [Google Scholar] [CrossRef]
- Klemedtsson, L.; Von Arnold, K.; Weslien, P.; Gundersen, P. Soil CN ratio as a scalar parameter to predict nitrous oxide emissions. Glob. Chang. Biol. 2005, 11, 1142–1147. [Google Scholar] [CrossRef] [Green Version]
- Cong, R.; Wang, X.; Xu, M.; Zhang, W.; Xie, L.; Yang, X.; Huang, S.; Wang, B. Dynamics of soil carbon to nitrogen ratio changes under long-term fertilizer addition in wheat-corn double cropping systems of China. Eur. J. Soil Sci. 2012, 63, 341–350. [Google Scholar] [CrossRef]
- Obu, J.; Lantuit, H.; Myers-Smith, I.; Heim, B.; Wolter, J.; Fritz, M. Effect of terrain characteristics on soil organic carbon and total nitrogen stocks in soils of Herschel Island, Western Canadian Arctic. Permaf. Periglac. Processes 2017, 28, 92–107. [Google Scholar] [CrossRef]
- Lozano-García, B.; Muñoz-Rojas, M.; Parras-Alcántara, L. Climate and land use changes effects on soil organic carbon stocks in a Mediterranean semi-natural area. Sci. Total Environ. 2017, 579, 1249–1259. [Google Scholar] [CrossRef] [PubMed]
- Yimer, F.; Ledin, S.; Abdelkadir, A. Changes in soil organic carbon and total nitrogen contents in three adjacent land use types in the Bale Mountains, south-eastern highlands of Ethiopia. For. Ecol. Manag. 2007, 242, 337–342. [Google Scholar] [CrossRef]
- Soosaar, K.; Mander, Ü.; Maddison, M.; Kanal, A.; Kull, A.; Lõhmus, K.; Truu, J.; Augustin, J. Dynamics of gaseous nitrogen and carbon fluxes in riparian alder forests. Ecol. Eng. 2011, 37, 40–53. [Google Scholar] [CrossRef]
- Edmondson, J.L.; Davies, Z.G.; McCormack, S.A.; Gaston, K.J.; Leake, J.R. Land-cover effects on soil organic carbon stocks in a European city. Sci. Total Environ. 2014, 472, 444–453. [Google Scholar] [CrossRef] [PubMed] [Green Version]
- Mishra, U.; Ussiri, D.A.; Lal, R. Tillage effects on soil organic carbon storage and dynamics in Corn Belt of Ohio USA. Soil Till. Res. 2010, 107, 88–96. [Google Scholar] [CrossRef]
- Kopittke, P.M.; Dalal, R.C.; Finn, D.; Menzies, N.W. Global changes in soil stocks of carbon, nitrogen, phosphorus, and sulphur as influenced by long-term agricultural production. Glob. Chang. Boil. 2017, 23, 2509–2519. [Google Scholar] [CrossRef]
- Yan, X.; Cai, Z.; Wang, S.; Smith, P. Direct measurement of soil organic carbon content change in the croplands of China. Glob. Chang. Biol. 2011, 17, 1487–1496. [Google Scholar] [CrossRef]
- Maaroufi, N.I.; Nordin, A.; Hasselquist, N.J.; Bach, L.H.; Palmqvist, K.; Gundale, M.J. Anthropogenic nitrogen deposition enhances carbon sequestration in boreal soils. Glob. Chang. Boil. 2015, 21, 3169–3180. [Google Scholar] [CrossRef]
- Alvarez, R. A review of nitrogen fertilizer and conservation tillage effects on soil organic carbon storage. Soil Use Manag. 2005, 21, 38–52. [Google Scholar] [CrossRef]
- Gao, Y.; He, N.; Yu, G.; Chen, W.; Wang, Q. Long-term effects of different land use types on C, N, and P stoichiometry and storage in subtropical ecosystems: A case study in China. Eco. Eng. 2014, 67, 171–181. [Google Scholar] [CrossRef]
- Brady, N.; Weil, R. The Nature and Properties of Soils; Pearson Prentice Hall: Upper Saddle River, NJ, USA, 2008. [Google Scholar]
- Liu, X.; Ma, J.; Ma, Z.-W.; Li, L.-H. Soil nutrient contents and stoichiometry as affected by land-use in an agro-pastoral region of Northwest China. Catena 2017, 150, 146–153. [Google Scholar] [CrossRef]
- Livesley, S.J.; Ossola, A.; Threlfall, C.G.; Hahs, A.K.; Williams, N.S.G. Soil Carbon and Carbon/Nitrogen Ratio Change under Tree Canopy, Tall Grass, and Turf Grass Areas of Urban Green Space. J. Environ. Qual. 2016, 45, 215–223. [Google Scholar] [CrossRef] [PubMed]
- Hobbie, S.E.; Reich, P.B.; Oleksyn, J.; Ogdahl, M.; Zytkowiak, R.; Hale, C.; Karolewski, P. Tree species effects on decomposition and forest floor dynamics in a common garden. Ecology 2006, 87, 2288–2297. [Google Scholar] [CrossRef]
- Li, Z.; Liu, C.; Dong, Y.; Chang, X.; Nie, X.; Liu, L.; Xiao, H.; Lu, Y.; Zeng, G. Response of soil organic carbon and nitrogen stocks to soil erosion and land use types in the Loess hilly–gully region of China. Soil Till. Res. 2017, 166, 1–9. [Google Scholar] [CrossRef]
- Post, W.M.; Kwon, K.C. Soil carbon sequestration and land-use change: Processes and potential. Glob. Chang. Boil. 2000, 6, 317–327. [Google Scholar] [CrossRef]
- Sartori, F.; Lal, R.; Ebinger, M.H.; Parrish, D.J. Potential soil carbon sequestration and CO2 offset by dedicated energy crops in the USA. Crit. Rev. Plant Sci. 2006, 25, 441–472. [Google Scholar] [CrossRef]
- Hulme, M. Recent climatic change in the world’s drylands. Geophys. Res. Lett. 1996, 23, 61–64. [Google Scholar] [CrossRef]
- Reynolds, J.F.; Smith, D.M.S.; Lambin, E.F.; Turner, B.; Mortimore, M.; Batterbury, S.P.; Downing, T.E.; Dowlatabadi, H.; Fernández, R.J.; Herrick, J.E. Global desertification: Building a science for dryland development. Science 2007, 316, 847–851. [Google Scholar] [CrossRef]
- Qiu, L.; Wei, X.; Zhang, X.; Cheng, J.; Gale, W.; Guo, C.; Long, T. Soil organic carbon losses due to land use change in a semiarid grassland. Plant Soil 2012, 355, 299–309. [Google Scholar] [CrossRef]
- Lal, R. Carbon sequestration in dryland ecosystems. Environ. Manag. 2004, 33, 528–544. [Google Scholar] [CrossRef] [PubMed]
- Mekki, I.; Jacob, F.; Marlet, S.; Ghazouani, W. Management of groundwater resources in relation to oasis sustainability: The case of the Nefzawa region in Tunisia. J. Environ. Manag. 2013, 121, 142–151. [Google Scholar] [CrossRef] [PubMed]
- FAO-UNESCO. Soil Map of the World: Revised Legend (with Corrections and Updates), World Soil Resources Report 60; FAO: Rome, Italy, 1988. [Google Scholar]
- Eswaran, H.; Van Den Berg, E.; Reich, P. Organic carbon in soils of the world. Soil Sci. Soc. Am. J. 1993, 57, 192–194. [Google Scholar] [CrossRef]
- Su, Y.-Z.; Wang, F.; Zhang, Z.-H.; Du, M.-W. Soil Properties and Characteristics of Soil Aggregate in Marginal Farmlands of Oasis in the Middle of Hexi Corridor Region, Northwest China. Agric. Sci. China 2007, 6, 706–714. [Google Scholar] [CrossRef]
- Gong, Z.; Zhang, G.; Luo, G. Diversity of Anthrosols in China. Pedosphere 1999, 9, 193–204. [Google Scholar]
- Liu, F.; Zhang, H.; Qin, Y.; Dong, J.; Xu, E.; Yang, Y.; Zhang, G.; Xiao, X. Semi-natural areas of Tarim Basin in northwest China: Linkage to desertification. Sci. Total Environ. 2016, 573, 178–188. [Google Scholar] [CrossRef] [PubMed]
- Chen, Y. Water Resources Research in Northwest China; Springer Science & Business Media: Dordrecht, The Netherlands, 2014. [Google Scholar]
- Liu, J.; Kuang, W.; Zhang, Z.; Xu, X.; Qin, Y.; Ning, J.; Zhou, W.; Zhang, S.; Li, R.; Yan, C. Spatiotemporal characteristics, patterns, and causes of land-use changes in China since the late 1980s. J. Geogr. Sci. 2014, 24, 195–210. [Google Scholar] [CrossRef]
- Bai, L.Y.; Feng, J.Z.; Ma, Y.X.; Ran, Q.Y.; Wang, K.; Zhao, Y. Analysis of spatial pattern Change of LU/LC over the upper Tarim River region since 1990 using remote sensing data. IOP Conference Series: Earth Environ. Sci. 2017, 57, 012038. [Google Scholar] [CrossRef] [Green Version]
- Song, X.-P.; Hansen, M.C.; Stehman, S.V.; Potapov, P.V.; Tyukavina, A.; Vermote, E.F.; Townshend, J.R. Global land change from 1982 to 2016. Nature 2018, 560, 639. [Google Scholar] [CrossRef]
- Wichern, F.; Luedeling, E.; Müller, T.; Joergensen, R.G.; Buerkert, A. Field measurements of the CO2 evolution rate under different crops during an irrigation cycle in a mountain oasis of Oman. Appl. Soil Ecol. 2004, 25, 85–91. [Google Scholar] [CrossRef]
- Liu, Y.; Fang, F.; Li, Y. Key issues of land use in China and implications for policy making. Land Use Policy 2014, 40, 6–12. [Google Scholar] [CrossRef]
- Wang, T.; Yan, C.; Song, X.; Xie, J. Monitoring recent trends in the area of aeolian desertified land using Landsat images in China’s Xinjiang region. ISPRS J. Photogramm. Remote Sens. 2012, 68, 184–190. [Google Scholar] [CrossRef]
- Wang, Y.; Luo, G.; Zhao, S.; Han, Q.; Li, C.; Fan, B.; Chen, Y. Effects of arable land change on regional carbon balance in Xinjiang. Acta Geogr. Sin. 2014, 69, 110–120. (In Chinese) [Google Scholar] [CrossRef]
- Yaning, C.; Changchun, X.; Xingming, H.; Weihong, L.; Yapeng, C.; Chenggang, Z.; Zhaoxia, Y. Fifty-year climate change and its effect on annual runoff in the Tarim River Basin, China. Quat. Int. 2009, 208, 53–61. [Google Scholar] [CrossRef]
- Zhang, Y.; Chen, Y.; Pan, B. Distribution and floristics of desert plant communities in the lower reaches of Tarim River, southern Xinjiang, People’s Republic of China. J. Arid Environ. 2005, 63, 772–784. [Google Scholar] [CrossRef]
- Olson, K.R.; Al-Kaisi, M.M. The importance of soil sampling depth for accurate account of soil organic carbon sequestration, storage, retention and loss. CATENA 2015, 125, 33–37. [Google Scholar] [CrossRef]
- Nelson, D.W.; Sommers, L.E. Total carbon, organic carbon, and organic matter. Methods Soil Anal. Part 3—Chem. Methods 1996, 961–1010. [Google Scholar]
- Gallaher, R.; Weldon, C.; Boswell, F. A Semiautomated Procedure for Total Nitrogen in Plant and Soil Samples 1. Soil Sci. Soc. Am. J. 1976, 40, 887–889. [Google Scholar] [CrossRef]
- Shangguan, W.; Dai, Y.; Liu, B.; Zhu, A.; Duan, Q.; Wu, L.; Ji, D.; Ye, A.; Yuan, H.; Zhang, Q.; et al. A China data set of soil properties for land surface modeling. J. Adv. Model. Earth Syst. 2013, 5, 212–224. [Google Scholar] [CrossRef] [Green Version]
- Yang, Y.; Fang, J.; Smith, P.; Tang, Y.; Chen, A.; Ji, C.; Hu, H.; Rao, S.; Tan, K.; HE, J.S. Changes in topsoil carbon stock in the Tibetan grasslands between the 1980s and 2004. Glob. Chang. Biol. 2009, 15, 2723–2729. [Google Scholar] [CrossRef]
- Zhou, Z.; Wang, C. Reviews and syntheses: Soil resources and climate jointly drive variations in microbial biomass carbon and nitrogen in China’s forest ecosystems. Biogeosciences 2015, 12, 6751–6760. [Google Scholar] [CrossRef]
- Renó, V.F.; Novo, E.M.; Suemitsu, C.; Rennó, C.D.; Silva, T.S. Assessment of deforestation in the Lower Amazon floodplain using historical Landsat MSS/TM imagery. Remote Sens. Environ. 2011, 115, 3446–3456. [Google Scholar] [CrossRef]
- Vittek, M.; Brink, A.; Donnay, F.; Simonetti, D.; Desclée, B. Land cover change monitoring using Landsat MSS/TM satellite image data over West Africa between 1975 and 1990. Remote Sens. 2014, 6, 658–676. [Google Scholar] [CrossRef]
- Chen, L.; Smith, P.; Yang, Y. How has soil carbon stock changed over recent decades? Glob. Change Boil. 2015, 21, 3197–3199. [Google Scholar] [CrossRef] [PubMed]
- Sterner, R.W.; Elser, J.J. Ecological Stoichiometry: The Biology of Elements from Molecules to the Biosphere; Princeton University Press: Princeton, NJ, USA, 2002. [Google Scholar]
- Houghton, R.; Skole, D.; Nobre, C.A.; Hackler, J.; Lawrence, K.; Chomentowski, W.H. Annual fluxes of carbon from deforestation and regrowth in the Brazilian Amazon. Nature 2000, 403, 301–304. [Google Scholar] [CrossRef] [PubMed]
- Lal, R. Soil carbon dynamics in cropland and rangeland. Environ. Pollut. 2002, 116, 353–362. [Google Scholar] [CrossRef]
- Gelaw, A.M.; Singh, B.; Lal, R. Soil organic carbon and total nitrogen stocks under different land uses in a semi-arid watershed in Tigray, Northern Ethiopia. Agric., Ecosyst. Environ. 2014, 188, 256–263. [Google Scholar] [CrossRef]
- Berihu, T.; Girmay, G.; Sebhatleab, M.; Berhane, E.; Zenebe, A.; Sigua, G.C. Soil carbon and nitrogen losses following deforestation in Ethiopia. Agron. Sustain. Dev. 2017, 37, 1. [Google Scholar] [CrossRef]
- Lozano-García, B.; Parras-Alcántara, L.; Cantudo-Pérez, M. Land use change effects on stratification and storage of soil carbon and nitrogen: Application to a Mediterranean nature reserve. Agric., Ecosyst. Environ. 2016, 231, 105–113. [Google Scholar] [CrossRef]
- Shan, L.; Zhang, X.; Wang, Y.; Wang, H.; Yan, H.; Wei, J.; Xu, H. Influence of moisture on the growth and biomass allocation in Haloxylon ammodendron and Tamarix ramosissima seedlings in the shelterbelt along the Tarim Desert Highway, Xinjiang, China. Chin. Sci. Bull. 2008, 53, 93–101. [Google Scholar] [CrossRef]
- Huang, Y.; Sun, W. Changes in topsoil organic carbon of croplands in mainland China over the last two decades. Chin. Sci. Bull. 2006, 51, 1785–1803. [Google Scholar] [CrossRef]
- Li, X.-G.; Li, F.-M.; Rengel, Z.; Wang, Z.-F. Cultivation effects on temporal changes of organic carbon and aggregate stability in desert soils of Hexi Corridor region in China. Soil Till. Res. 2006, 91, 22–29. [Google Scholar] [CrossRef]
- Shen, W.; Lin, X.; Gao, N.; Zhang, H.; Yin, R.; Shi, W.; Duan, Z. Land use intensification affects soil microbial populations, functional diversity and related suppressiveness of cucumber Fusarium wilt in China’s Yangtze River Delta. Plant Soil 2008, 306, 117–127. [Google Scholar] [CrossRef]
- Congreves, K.; Hooker, D.; Hayes, A.; Verhallen, E.; Van Eerd, L. Interaction of long-term nitrogen fertilizer application, crop rotation, and tillage system on soil carbon and nitrogen dynamics. Plant Soil 2017, 410, 113–127. [Google Scholar] [CrossRef]
- Smith, P. Land use change and soil organic carbon dynamics. Nutr. Cycl. Agroecosyst. 2008, 81, 169–178. [Google Scholar] [CrossRef]
- Luo, Y.; Hui, D.; Zhang, D. Elevated CO2 stimulates net accumulations of carbon and nitrogen in land ecosystems: A meta-analysis. Ecology 2006, 87, 53–63. [Google Scholar] [CrossRef] [PubMed]
- Manzoni, S.; Porporato, A. Soil carbon and nitrogen mineralization: Theory and models across scales. Soil Biol. Biochem. 2009, 41, 1355–1379. [Google Scholar] [CrossRef]
- Yuan, J.; Ouyang, Z.; Zheng, H.; Xu, W. Effects of different grassland restoration approaches on soil properties in the southeastern Horqin sandy land, northern China. Appl. Soil Ecol. 2012, 61, 34–39. [Google Scholar] [CrossRef] [Green Version]
- Fierer, N.; Craine, J.M.; McLauchlan, K.; Schimel, J.P. Litter quality and the temperature sensitivity of decomposition. Ecology 2005, 86, 320–326. [Google Scholar] [CrossRef]
- Kemmitt, S.J.; Wright, D.; Goulding, K.W.; Jones, D.L. pH regulation of carbon and nitrogen dynamics in two agricultural soils. Soil Biol. Biochem. 2006, 38, 898–911. [Google Scholar] [CrossRef]
- Pietri, J.A.; Brookes, P. Nitrogen mineralisation along a pH gradient of a silty loam UK soil. Soil Biol. Biochem. 2008, 40, 797–802. [Google Scholar] [CrossRef]
- Singh Brar, B.; Singh, J.; Singh, G.; Kaur, G. Effects of Long Term Application of Inorganic and Organic Fertilizers on Soil Organic Carbon and Physical Properties in Maize–Wheat Rotation. Agronomy 2015, 5, 220–238. [Google Scholar] [CrossRef] [Green Version]
- Su, Y.Z.; lin Zhao, H. Soil properties and plant species in an age sequence of Caragana microphylla plantations in the Horqin Sandy Land, north China. Eco. Eng. 2003, 20, 223–235. [Google Scholar] [CrossRef]
- O’Brien, S.L.; Jastrow, J.D.; Grimley, D.A.; Gonzalez-Meler, M.A. Moisture and vegetation controls on decadal-scale accrual of soil organic carbon and total nitrogen in restored grasslands. Glob. Chang. Biol. 2010, 16, 2573–2588. [Google Scholar] [CrossRef]
- Liu, X.; Zhang, Y.; Han, W.; Tang, A.; Shen, J.; Cui, Z.; Vitousek, P.; Erisman, J.W.; Goulding, K.; Christie, P. Enhanced nitrogen deposition over China. Nature 2013, 494, 459. [Google Scholar] [CrossRef] [PubMed]
- Khan, S.A.; Mulvaney, R.L.; Ellsworth, T.R.; Boast, C.W. The Myth of Nitrogen Fertilization for Soil Carbon Sequestration. J. Environ. Qual. 2007, 36, 1821–1832. [Google Scholar] [CrossRef] [PubMed]
- Reay, D.S.; Dentener, F.; Smith, P.; Grace, J.; Feely, R.A. Global nitrogen deposition and carbon sinks. Nat. Geosci. 2008, 1, 430. [Google Scholar] [CrossRef]
- Li, Z.-P.; Zhang, T.-L.; Chen, B.-Y. Changes in organic carbon and nutrient contents of highly productive paddy soils in Yujiang county of Jiangxi province, China and their environmental application. Agric. Sci. China 2006, 5, 522–529. [Google Scholar] [CrossRef]
- Mazzoncini, M.; Antichi, D.; Di Bene, C.; Risaliti, R.; Petri, M.; Bonari, E. Soil carbon and nitrogen changes after 28 years of no-tillage management under Mediterranean conditions. Eur. J. Agron. 2016, 77, 156–165. [Google Scholar] [CrossRef]
- Mazzoncini, M.; Sapkota, T.B.; Barberi, P.; Antichi, D.; Risaliti, R. Long-term effect of tillage, nitrogen fertilization and cover crops on soil organic carbon and total nitrogen content. Soil Till. Res. 2011, 114, 165–174. [Google Scholar] [CrossRef]
- Yang, Y.-C.; Zhang, M.; Zheng, L.; Cheng, D.-D.; Liu, M.; Geng, Y.-Q. Controlled release urea improved nitrogen use efficiency, yield, and quality of wheat. Agron. J. 2011, 103, 479–485. [Google Scholar] [CrossRef]
- Gu, B.; Ju, X.; Wu, Y.; Erisman, J.W.; Bleeker, A.; Reis, S.; Sutton, M.A.; Lam, S.K.; Smith, P.; Oenema, O. Cleaning up nitrogen pollution may reduce future carbon sinks. Glob. Environ. Chang. 2018, 48, 56–66. [Google Scholar] [CrossRef]
Figure 1.
Location and soil sampling sites in the area of the Tarim Basin.

Figure 2.
Conceptual framework for exploring impacts of land reclamation history on soil C and N.

Figure 3.
Land use maps of 1978 and 2015 in typical areas of the Tarim Basin.

Figure 4.
Soil C and N for different prior land uses: (a) Soil organic carbon content in 2015, (b) Total nitrogen content in 2015, (c) Change of soil organic carbon content, (d) Change of total nitrogen content. Note: 1. Group differences after one-way ANOVA (p < 0.05) was indicated by different lowercase letters. 2. Bar length gives the mean value, vertical whisker of bar for each column indicate standard errors of the mean. 3. Line within the boxes gives the median value, box means the 25th and 75th percentile, whisker of box represents 1.5 times the length of the box from either end of the box (1.5 times the interquartile range), circle represents outliers and extremes. The same as below.

Figure 5.
Impact of reclamation ages on soil C and N: (a) Soil organic carbon content in 2015 assarted from grassland, (b) Total nitrogen content in 2015 assarted from grassland, (c) Soil organic carbon content in 2015 assarted from forest, (d) Total nitrogen content in 2015 assarted from forest, (e) Change of soil organic carbon content assarted from grassland, (f) Change of total nitrogen content assarted from grassland, (g) Change of soil organic carbon content assarted from forest, (h) Change of total nitrogen content assarted from forest. NEW = newly assarted (1–5 years), YOU = young assarted (6–15 years), MED = medium assarted (16–25 years), OLD = old assarted (26–37 years), REF = referenced cropland assarted before 1978.

Figure 6.
Soil C:N ratio for different prior land uses: (a) Values in 2015, (b) Changes from ca.1978 to 2015.
Figure 6.
Soil C:N ratio for different prior land uses: (a) Values in 2015, (b) Changes from ca.1978 to 2015.

Figure 7.
Impact of reclamation ages on soil C:N ratio: (a) Values in 2015 assarted from grassland, (b) values in 2015 assarted from forest, (c) Changes assarted from grassland, (d) Changes assarted from forest. NEW = newly assarted (1–5 years), YOU = young assarted (6–15 years), MED = medium assarted (16–25 years), OLD = old assarted (26–37 years), REF = referenced cropland assarted before 1978. NEW = newly assarted (1–5 years), YOU = young assarted (6–15 years), MED = medium assarted (16–25 years), OLD = old assarted (26–37 years), REF = referenced cropland assarted before 1978.


Table 1.
Statistical characteristics of soil properties.
| Mean | Standard Deviation | Maximum | Minimum | ||
|---|---|---|---|---|---|
| Soil bulk density (g cm−3) | ca.1978 | 1.30 | 0.18 | 1.75 | 0.93 |
| 2015 | 1.29 | 0.16 | 1.61 | 1.05 | |
| SOC content (g/kg) | ca.1978 | 6.44 | 2.90 | 16.85 | 3.42 |
| 2015 | 6.61 | 1.96 | 17.65 | 2.26 | |
| TN content (g/kg) | ca.1978 | 0.63 | 0.28 | 1.67 | 0.29 |
| 2015 | 0.65 | 0.22 | 1.76 | 0.19 | |
| C:N ratio | ca.1978 | 10.11 | 1.73 | 14.90 | 7.33 |
| 2015 | 10.22 | 1.21 | 17.25 | 6.11 |
© 2019 by the authors. Licensee MDPI, Basel, Switzerland. This article is an open access article distributed under the terms and conditions of the Creative Commons Attribution (CC BY) license (http://creativecommons.org/licenses/by/4.0/).
Share and Cite
MDPI and ACS Style
Xu, E.; Zhang, H.; Xu, Y. Effect of Large-Scale Cultivated Land Expansion on the Balance of Soil Carbon and Nitrogen in the Tarim Basin. Agronomy 2019, 9, 86. https://0-doi-org.brum.beds.ac.uk/10.3390/agronomy9020086
AMA Style
Xu E, Zhang H, Xu Y. Effect of Large-Scale Cultivated Land Expansion on the Balance of Soil Carbon and Nitrogen in the Tarim Basin. Agronomy. 2019; 9(2):86. https://0-doi-org.brum.beds.ac.uk/10.3390/agronomy9020086
Chicago/Turabian StyleXu, Erqi, Hongqi Zhang, and Yongmei Xu. 2019. "Effect of Large-Scale Cultivated Land Expansion on the Balance of Soil Carbon and Nitrogen in the Tarim Basin" Agronomy 9, no. 2: 86. https://0-doi-org.brum.beds.ac.uk/10.3390/agronomy9020086
Note that from the first issue of 2016, this journal uses article numbers instead of page numbers. See further details here.