Article

Effects of Cooling Systems on Greenhouse Microclimate and Cucumber Growth under Mediterranean Climatic Conditions

by
Georgios Nikolaou
1,*,
Damianos Neocleous
2,
Nikolaos Katsoulas
1 and
Constantinos Kittas
1
1
Department of Agriculture Crop Production and Rural Environment, School of Agricultural Sciences, University of Thessaly, Fytokou Str., 38446 Volos, Greece
2
Department of Natural Resources and Environment, Agricultural Research Institute, 1516 Nicosia, Cyprus
*
Author to whom correspondence should be addressed.
Submission received: 17 May 2019 / Revised: 9 June 2019 / Accepted: 9 June 2019 / Published: 11 June 2019

Abstract

:
Two experiments were conducted in different cropping seasons under Mediterranean climatic conditions to investigate the impact of two cooling systems (fan-pad evaporative as opposed to fan ventilation) on greenhouse microclimate and soilless cucumber growth. The second objective of the experiment was to determine the most appropriate irrigation regime (between 0.24 and 0.32 L m−2) in relation to crop water uptake and greenhouse fertigation effluents. The use of a fan ventilation system enhanced the vapor pressure deficit; thus, the crop transpiration improved by 60% in relation to the transpiration rates of plants grown under the fan-pad system. Higher transpiration rates alleviated the heat load as the external–inside greenhouse air differences declined from 6.2 °C to 3 °C. The leaf–air temperature differential indicated that plants were not facing any water stress conditions for both cooling systems tested; however, fan ventilation reduced drainage emissions outflows (95% decrease) compared with evaporative cooling. Results also demonstrated that an irrigation regime of 0.24 L m−2 can be applied successfully in soilless cucumber crops, keeping the drainage to a minimum (20% of the nutrient solution supply). These results suggest that fan ventilation cooling system in conjugation with an appropriate irrigation regime prevents overheating and minimizes the nutrient and water losses in spring-grown soilless cucumber crops in Mediterranean greenhouses without compromising yield.

1. Introduction

Greenhouse overheating may become a serious problem for plant growth and production throughout a significant part of the year, especially in arid and semi-arid regions, resulting from high solar radiation values [1,2]. In order to cope with this, various kinds of greenhouse cooling technologies have been proposed [3]. However, the suitability to local climatic conditions still remains a challenge, as seasonal changes in solar energy result in seasonal patterns of heat built up within a greenhouse [4,5].
Passive cooling methods (e.g., natural ventilation, white washing, shading nets) are considered simple and low-cost ways to reduce greenhouse heat accumulation, as they require little initial investment [6,7]. However, the efficiency of natural ventilation is limited under low external air velocity values and shading can affect production and fruit quality characteristics based on the technique used and the percentage reduction of incoming solar radiation [8,9]. Hence, active cooling methods (e.g., evaporative pads, fogging, misting, fan ventilation) are being implemented in warmer climates. Nevertheless, their cooling efficiency is higher under lower ambient air temperature and humidity levels (e.g., temperate climates) [2,10], as they can reduce the outside–inside air temperature difference from 10 to 25 °C and increase the air relative humidity from 10 to 90% [11,12]. In any case, greenhouse cooling represents a process with high energy demand [13]. In addition, high quality water needs to be supplied for evaporative cooling systems, which are based on the conversion of sensible heat into latent by means of water evaporation [11,14,15]. Recently, Nikolaou et al. [16] measured the daily water needed for the operation of a fan-pad evaporative cooling under Mediterranean conditions in a greenhouse filled with cucumber crop, and found it to be as high as 3 L per m2 of greenhouse-ground area. Taking into account the scarcity of water in the eastern Mediterranean basin and the need to reduce greenhouse energy consumption, cooling a greenhouse remains an economic and technical challenge [11,12].
The effect of greenhouse microclimate on crop transpiration rate, growth, and production has been the research topic of several investigations in the past. Leonardi et al. [17] correlated the drastic effect of vapor pressure deficit (VPD) on crop production through variations in water supply to fruits. Willits et al. [18] stated that crop production is negatively affected even with an increase of the greenhouse air temperature during the day by 1–2 °C above crop optimum. It was also shown that the cucumber harvest period was shortened and the production was negatively affected as a result of higher air temperatures and solar radiation values, comparing a spring–fall as opposed to a winter–spring cropping season [19]. Climate control methods must be carefully chosen to align with local climate conditions so as to suit the cultivated crop [20]. In fact, monitoring of the plant water status and growth in real time with the use of phyto-sensing technology in intensive production systems can be of great importance not only for irrigation management but also for evaluating a greenhouse climate control strategy [21].
Yet, in high-frequency irrigation and soilless-based systems, limited information is available regarding crop growth and production in different greenhouse environments and irrigation regimes taking into account specific features of the Mediterranean climate [22]. Furthermore, fertilizers’ leaching is an important environmental issue especially in areas with high concentration of greenhouses, as they may potentially contaminate groundwater aquifers [23,24]. Especially in soilless cultivation systems, a drainage amount of 30–50% of irrigation solution (i.e., drain to waste hydroponic systems) is often recommended [25,26]. Thus, there is a need to minimize greenhouse outflows without compromising yield and quality through efficient and adequate irrigation [27,28]. It has been shown that in soilless cucumber crops, increasing the daily irrigation interval rate from 6 to 16 events (same daily amount of water) positively affected crop water uptake and minimized the drainage emissions outflow by 24% [29]. This is of great concern, taking into consideration recent environmental concerns and water-related problems [30,31].
Accordingly, the primary objective of this work was to study the effects of a fan ventilation as opposed to a fan-pad evaporative cooling system on greenhouse microclimate and cucumber growth in two distinct cropping seasons (autumn–winter and spring) under Mediterranean climatic conditions. A secondary objective was to determine the most appropriate irrigation regime in soilless cucumber crops in relation to crop water uptake and transpiration, greenhouse fertigation emissions, and water use efficiency values.

2. Materials and Methods

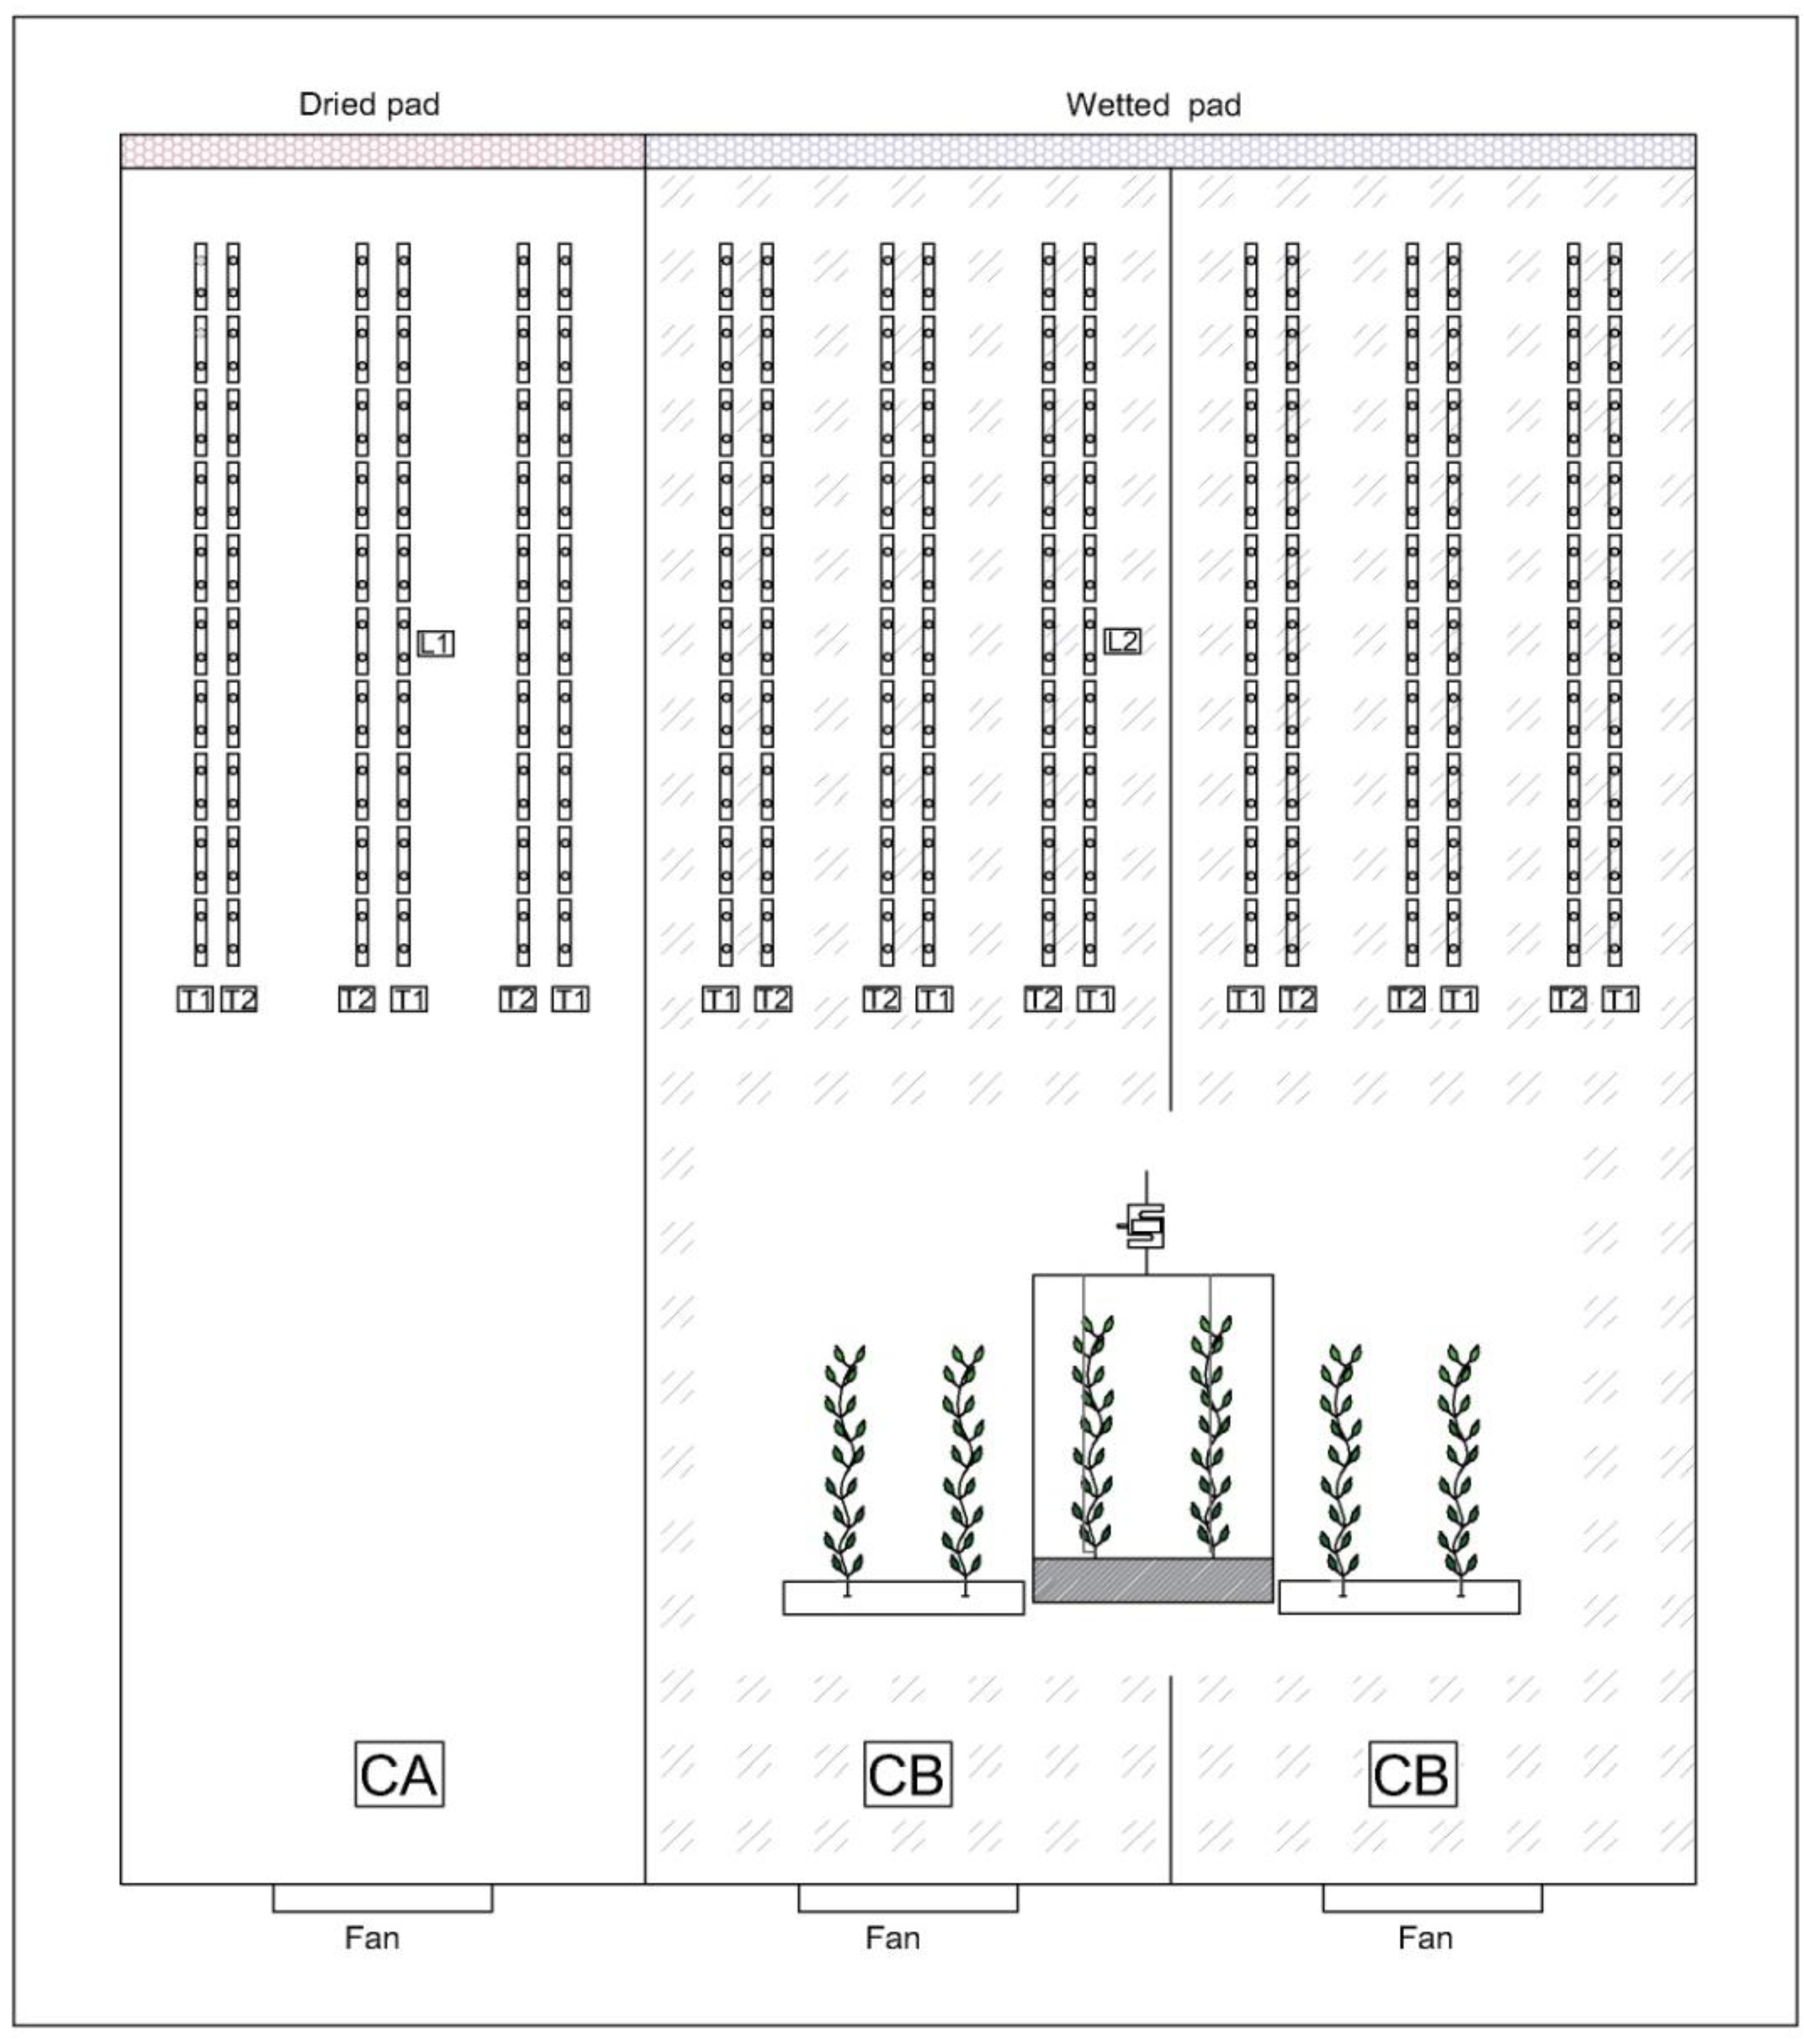
2.1. Greenhouse and Experiments

Two experiments were performed in a North–South-oriented, multi-span type (3 spans) greenhouse at the Agricultural Research Institute of Cyprus (34°94′N, long. 33°19′E, altitude 40 m). The first experiment was conducted from October to December 2014 (Exp. 1) and the second from March to June 2015 (Exp. 2). The geometrical characteristics of each span were as follows: spans width 7 m, ridge height 5 m, eaves height 3.50 m, length 24 m. The total greenhouse ground area was 504 m2 and the total volume 2016 m3. The greenhouse cover was low-density anti-drip colorless polyethylene (LDPE) film (200 micron thick), with 88% light global transmission, 55% light diffused transmission, and 88% thermic efficiency.
In order to evaluate the effect of different cooling systems on soilless cucumber culture, the greenhouse was separated longitudinally with polyethylene film of the same characteristics in two compartments (Figure 1). In the first compartment, cooling was performed by a single fan operated at daytime when the temperature exceeded 33 °C and during the night when relative humidity exceeded 75% (hereafter referred to as Compartment A; CA) (Figure 2).
In the second compartment, dynamic ventilation was performed by two fans—one at each span—when greenhouse temperature exceeded 25 °C (hereafter referred to as Compartment B; CB). A wet pad and fan cooling system was operated when the temperature exceeded 27 °C. CB was equipped with a side vent at one wall with opening area of 52.8 m2 (18 × 2.2 m) and a single continuous roof vent with opening area of 24 m2 (24 × 1 m) in the middle span. All openings were covered by an insect screen.

2.2. Plant Material and Irrigation Regimes

Cucumber seedlings (n = 360) (Cucumis sativus L. cv Phenomenon) with two leaves were transplanted in Grodan rockwool slabs (100 × 20 × 7.5 cm) in the greenhouse on 2 October 2014 (Exp. 1) and on 17 March 2015 (Exp. 2). The plant density was 1.6 plant m−2. Each plant was trained to one stem by pruning and removing the secondary shoots and old and damaged leaves. In both seasons, the experimental period ended at 75 Days after Transplanting (DAT).
Plants were uniformly irrigated (i.e., 0.24 L m−2) for the first 14 days after transplanting, at fixed time intervals. Then, two different irrigation regimes were applied per greenhouse compartment, following a randomized block design (Figure 2). The amounts of water tested per irrigation were 0.32 L m−2, (Treatment 1; T1) and 0.24 L m−2, (Treatment 2; T2). The frequency of irrigation was monitored based on the solar radiation intensity method following Katsoulas et al. [32]. It was adjusted on a regular basis at different crops growth stages, in order to maintain a drainage fraction between 35 and 40% (T1) and 15 and 20% (T2) in CA. The composition of nutrient solution used were prepared according to Savvas et al. [33].

2.3. Data Recorded, Sampling and Measurements

Temperature (Ti, °C) and relative humidity (RH, %) were recorded in CA and CB (Sensor type PT 100; Galcon, Kfar Blum, Israel). Simultaneous to the inside climatic variable measurements, the same type of sensors were used for monitoring outside greenhouse air temperature and relative humidity. A pyranometer was used to measure solar radiation (RGo, W. m−2) at a height of 3 m above the greenhouse (Sensor pyranometer type TIR-4P; Bio Instruments Company, Chisinau, Moldova). Measurements of all above sensors were recorded on a data logger system at 30-second intervals (Galileo controller; Galcon, Kfar Blum, Israel) and the average was estimated every ten minutes.
Plant transpiration rate of CA, T1 and CB, T1 was directly monitored by a lysimeter unit consisting of a load cell suspended from the greenhouse structure (Model 9363; Vishay Precision Group, Malvern, USA; capacity of 50 Kg, ±0.02 g) to a plant supporting system with a growing media of two plants in each treatment (Figure 2), following Beeson et al. [34]. The crop transpiration rate was assumed to be equal to the weight loss, as measured by the electronic balance [35]. Additionally, a simplified water balance model was applied as an indirect method to estimate crop transpiration, by using measurements of the quantity of water supplied to the plants and water collected in each treatment by the drainage system [36]. The Irrigation Water Use Efficiency (IWUE) was calculated as the cucumber marketable yield divided by total irrigation solution supply [37,38].
For calculated leaf area index (LAI: m2 leaf m−2 ground) plant destructive measurements were repeated four times (30, 45, 60, 75 DAT) in Exp. 1 and Exp. 2, by means of a scanner (F4280; HP, Deskjet, Japan). Four plants were randomly chosen for T1 and T2, in CA and CB. The leaf area was determined following the procedure described by Varma and Osuri [39].
In order to determine fresh and dry weight of different organs, four additional plants were also randomly chosen in each treatment following the same dates and procedure. Each plant was divided into stem, fruits, and leaves. The fresh and dry weight (after drying at 180 °C for 48 h; Heraeus t 5050, Germany) were measured by means of a weighing scale (BJ 41000Dd 0.1 gr; Precisa, Swiss Made). Non-destructive measurements (i.e., length and width of each leaf, plant height) over plant growth cycle in Exp. 1 and Exp. 2, were repeated five times (15, 30, 45, 60, 75 DAT) in three labeled plants and on three randomly selected for T1 and T2, in each greenhouse compartment. Harvesting was made two to three times per week during morning hours, and started 25 DAT (Exp. 1) and 27 DAT (Exp. 2), with 15 harvests being conducted for each treatment. In each treatment, the total number of fruit production and total weight was measured.
One representative plant each from CA, T1 and CB, T1 was monitored on a time basis of 10 minutes by means of a Phyto-Sensor system (Bio Instruments Company, Chisinau, Moldova). In each treatment there were a stem micro-variation sensor (Model SD-5z), a leaf temperature sensor (Model LT-1z), and a sensor for substrate moisture and temperature (Model SMTE-3z).

2.4. Statistical Analysis

Statistical analyses were performed using SPSS (Statistical Package for the Social Sciences; IBM Corp. Released 2011, IBM SPSS Statistics for Windows, Version 20.0. Armonk, NY, USA) and comparisons of means were analysed through one-way analysis of variance (ANOVA).

3. Results

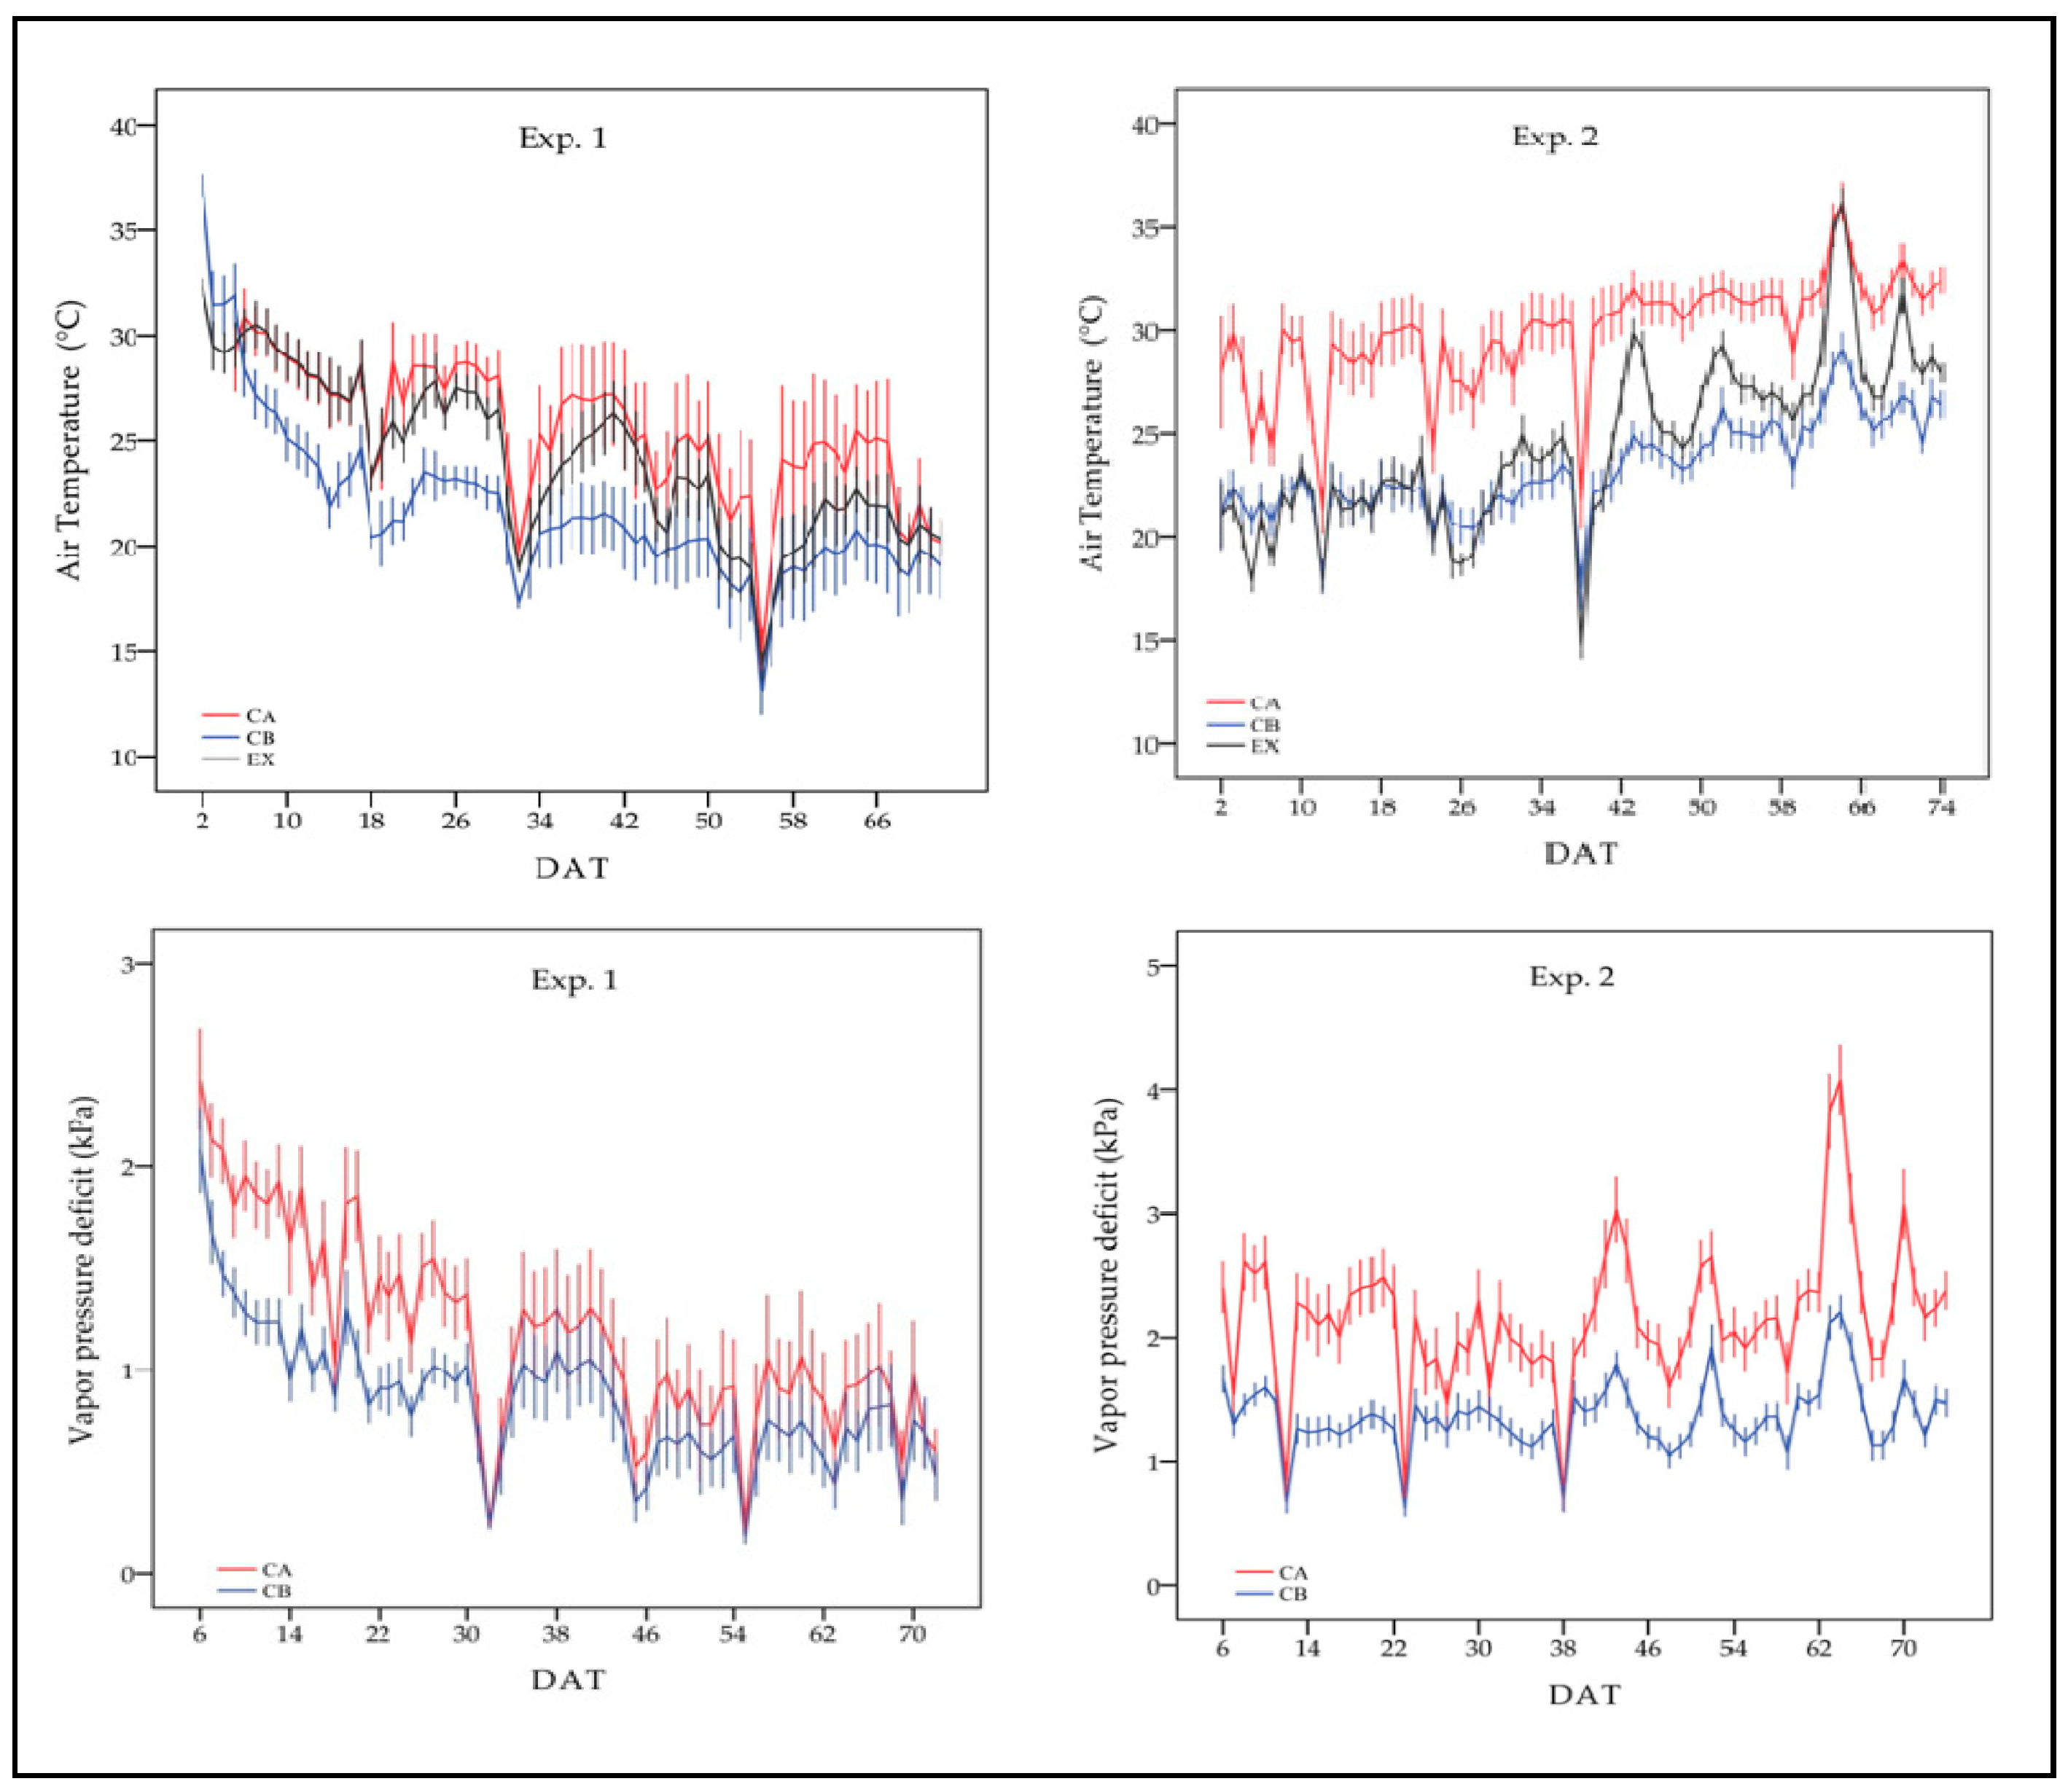
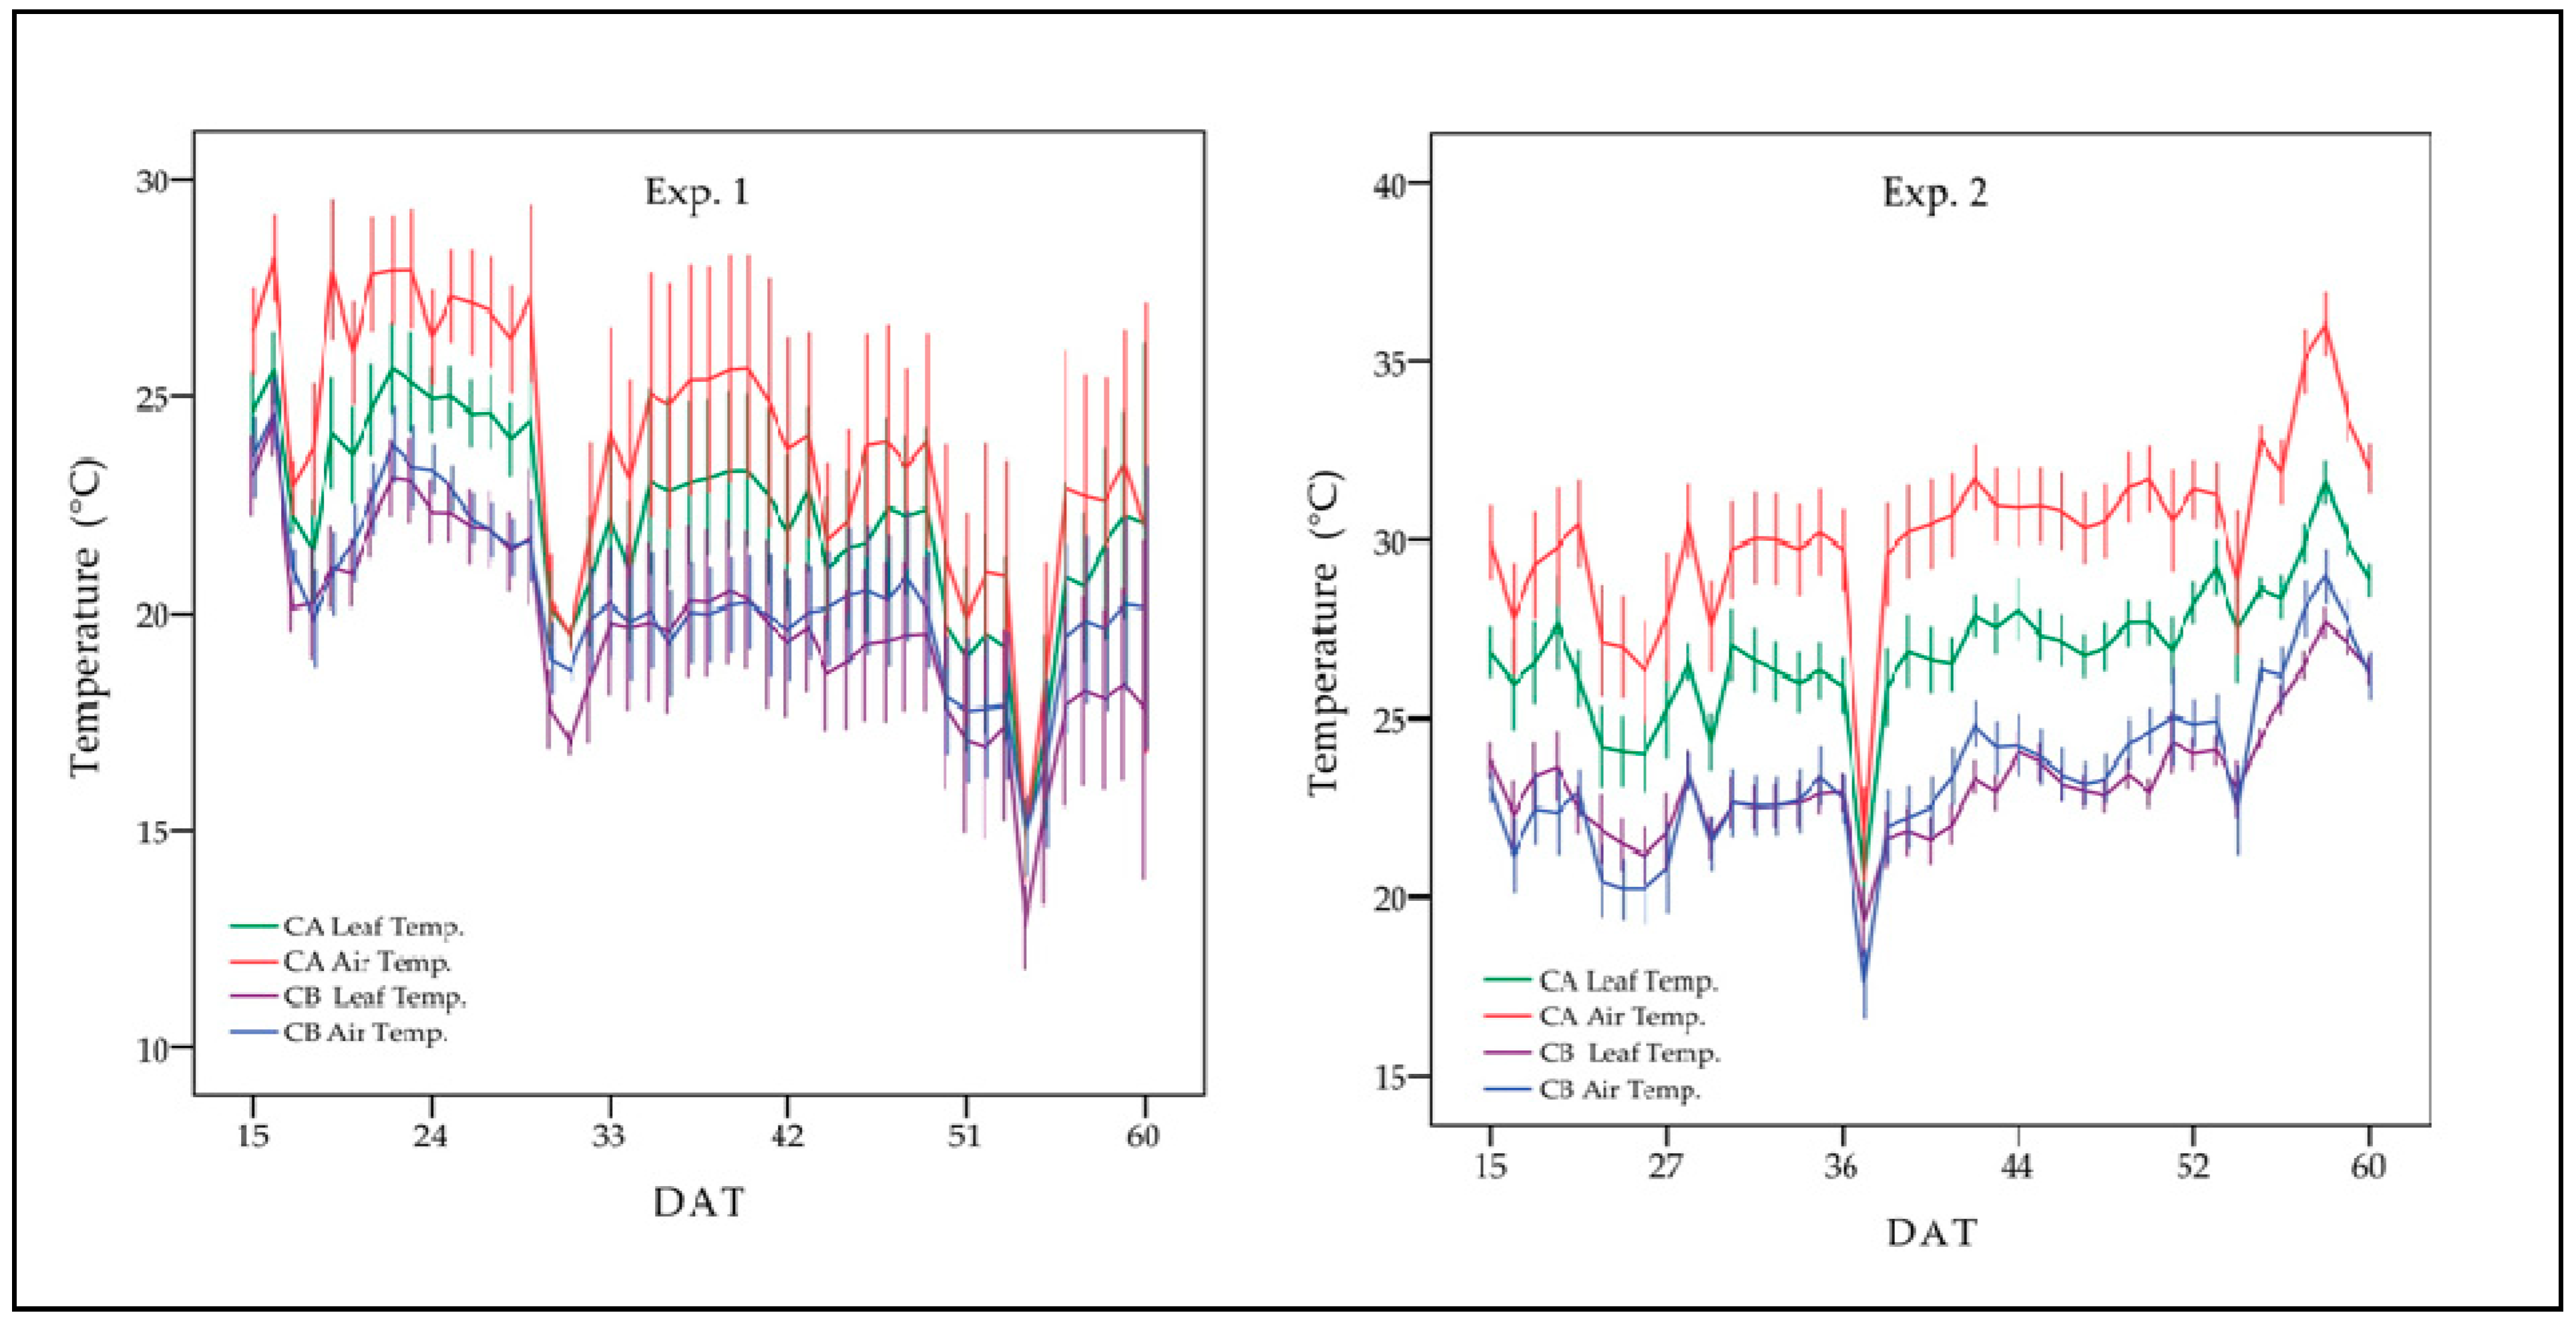
3.1. Greenhouse and Crop Microclimate

The ten-day mean values for both outside and inside the greenhouse microclimate during the daylight hours for Exp. 1 and Exp. 2 are presented in Table 1. Significantly higher greenhouse microclimate values were recorded in CA in both experimental periods. The mean recorded greenhouse air temperature values was 26.1 °C (CA) higher by 4.6 °C in comparison with CB during Exp. 1, increasing to 30.1 °C and higher by 6.7 °C during Exp. 2. Additionally, from Table 1 it can be observed that the external–inside greenhouse air differences declined as the crop grew, from 6.2 °C to 3 °C for CA during Exp. 2, despite the increase in the external air temperature and radiation levels.
Regarding differences of the mean values of VPD, it is seen that it increased from 0.38 (Exp. 1) to 0.78 (Exp. 2), in favor of CA. The maximum VPD values which were recorded during the Exp. 1 period were 3.7 kPa (CA) and 2.2 kPa (CB), and during Exp. 2 were 5.2 kPa (CA) and 3.0 kPa (CB). The diurnal variation of greenhouse air temperature and VPD for the two cooling systems for Exp. 1 and Exp. 2 are illustrated in Figure 3.
Leaf temperatures of T1 were evaluated and were found to be consistently lower than the greenhouse air temperature during the daytime, in both cooling systems tested. From Figure 4, it can be observed that differences between greenhouse air and leaf temperatures were greater in CA, especially during Exp. 2. In CA (Exp. 1) for daylight hours (15–60 DAT) when the mean external solar radiation value was 436 W m−2, the mean recorded leaf temperature value was 23.2 °C, 1.9 °C lower than the greenhouse air temperature (n = 2128); while in CB, the mean value was 20.1 °C, making it 0.6 °C lower than the greenhouse air temperature. During Exp. 2, when the mean external radiation increased to 685 W. m−2, the mean leaf temperature in CA was 26.8 °C, 3.3 °C lower than the air temperature; while in CB the mean value was 23.2 °C, 0.2 °C lower, for a number of observations (n = 2782).

3.2. Plant Growth Parameters and Yield

Table 2 presents the comparison of plant growth means values (e.g., number of leaves, height, LAI), the fresh and dry weight of different plant organs (e.g., stem, leaves, fruit) and reproduction (e.g., number and weight of fruit per plant) as affected by different irrigation regimes and cooling methods during Exp. 1 and Exp. 2.
It can be observed that irrespective of the growing period, plants in CA show a higher mean value with regard to height, leaf number per plant, and LAI compared with the same replications in CB. The mean differences in plants’ height were higher in CA by 20% for T1 and by 17% for T2 during Exp. 1, and by 21% for T1 and 18% T2 during Exp. 2. In addition, the LAI mean values were higher in CA during both experimental periods, with maximum recorded values of 2.15 (T1) and 1.82 (T2) during Exp. 1 and 1.36 (T1) and 1.61 (T2) during Exp. 2. In any case, the height, number of leaves per plant, and LAI were enhanced by the irrigation regime T1, even though results could not be generalized as the differences were not always significant.
With respect to fresh and dry weight per plant, both T1 and T2 treatments followed almost the same trend during the experiments as there were no significant differences in terms of fresh or dry weight per plant regarding leaves, stem, and fruit in the different environments and irrigation regimes tested. Plants in CA treatment indicated higher but not significant mean values of number or the weight of fruit per plant as shown in Table 2. The cumulative production values observed were higher by 4.5% (T1) and 6.3% (T2) in Exp. 1, and by 21.3% (T1) and 34.9% (T2) in Exp. 2 in CA, in comparison with the same replications within CB. Additionally, no differences were observed during production in relation to different irrigation regimes tested. From Table 2, we can also observe that higher values of vegetative cucumber production were observed during the Exp. 2 period.

3.3. Transpiration and Irrigation Water Use Efficiency

Differences in crop transpiration rates between T1 treatments, for the different cooling systems tested, were significantly higher in CA for daylight hours as directly measured by lysimeters 15–60 DAT), by 22% in (Exp. 1) and by 62% in (Exp. 2), and also for shorter interval periods, as indicated in Table 3. Similarly, water uptake (mL pl.−1) as estimated with the water balance method over the course of a 6-day representative period (45–50 DAT) indicated higher transpiration rates for T2, CA in both experimental periods.
As expected, a close correlation was observed between the transpiration rate and the amount of nutrient outflow from the greenhouse to the environment (i.e., drainage). As indicated in Table 3, the mean drainage recorded values over the course of a 10-day representative period (44–53 DAT) was between 30–35% (T1) and around 20% (T2) in both experiments in CA. In CB, a higher drainage amount was recorded, with greater differences between the two cooling systems tested during Exp. 2. As the results indicated, the amount of nutrient outflow from the greenhouse to the environment was 45–95% higher for T1 and T2, respectively, in CB during Exp. 2.
Table 4 shows the IWUE value in terms of cumulative yield and total irrigation apply per treatment. It can be observed that the IWUE was affected by irrigation regimes and different cooling systems tested. Maximum values were determined for T2. In both experimental periods, higher IWUE value were obtained in the fan ventilation cooling compartment.

3.4. Water Status of Plant and Root Zone Environment

A paired sample t-test was performed on collected data (i.e., substrate temperature and volumetric water content) over the course of a 10-day representative period (30–40 DAT) for T1 in both experiments. During daylight hours, significantly higher substrate temperatures were observed in CA as the mean recorded values were 21.4 °C (Exp. 1; n = 500 observations) and 25.0 °C (Exp. 2; n = 770 observations), comparing with 19.7 °C and 22.3 °C in CB, respectively. At night, the substrate temperature also remained higher for CA by 0.9 °C (Exp. 1) and by 1.9 °C (Exp. 2). The substrate volumetric water content was statistically higher for T1 in CB, as the mean estimated values were 62.3% (Exp. 1) and 66.9% (Exp. 2) compared to 57.6% (Exp. 1) and 62.3% (Exp. 2) for T2.
The variation of stem diameter reflected the relative water loss and cucumber growth rate as affected by the greenhouse microclimate. The diurnal variation in the stem was associated with the diurnal variation in the VPD (data not shown). A more explicit trunk depression occurred in CA when VPD was reached its highest values during midday. The influence of two cooling systems on plant growth rate (i.e., daily stem diameter increment) were examined over the course of a 4-day representative period related to the first (25–28 DAT) and late (60–63 DAT) crop development stage in both experiments. Throughout the period 25–28 DAT (Exp. 1), the absolute stem increase rate value were 0.34 mm (CA) and 0.19 mm (CB), and during 60–63 DAT were 0.49 mm (CA) and 0.11 mm (CB). During 25–28 DAT (Exp. 2), the absolute stem increase rate value recorded was higher for the evaporative cooling compartment as the values obtained were 0.33 mm (CA) and 0.5 mm (CB), and during 60–63 DAT were 0.78 mm (CA) and 1.5 mm (CB). In all of these cases, differences of stem growth rate between treatments were significant.

4. Discussion

Mediterranean countries have great potential for productivity due to large amounts of solar radiation throughout the year. These regions, however, also have disadvantages, such as severe water scarcity and salinity, and high air temperature and humidity levels [2]. Under these conditions, the optimal plant growth environment within a greenhouse can be sustained through the excessive use of cooling and ventilation systems [14].
In a previous section it was shown that evaporative cooling was found to be the most efficient way to control the high temperature and to keep low levels of VPD. However, the main drawbacks of evaporative cooling seem to be associated with the high initial investment and running cost; additionally, water of adequate quality and quantity is needed to be evaporated [40]. The results presented in this study suggest that a fan ventilation cooling system removes the excess sensible energy from a greenhouse soilless cucumber crop during spring cropping season in Mediterranean greenhouses, under prevailing environmental conditions. Despite the increase in the external solar radiation (maximum values of about 1053 W m−2) and temperature values (33.9 °C), the external–inside greenhouse air differences declined from 6.2 °C to 3 °C as the crop grew. Higher vapor pressure in the fan ventilation greenhouse compartment enhanced crop transpiration and helped to alleviate the heat load during warm days with high radiation load. In addition, the leaf temperatures in both cooling systems tested were consistently lower than the temperature of the air, indicating that the plants were not facing any water stress conditions. Consideration of Figure 4 and Table 3 reveals the strong connection between higher leaf–air temperature differences and transpiration rate, which were observed for plants within the fan ventilation greenhouse compartment. The average leaf temperature values obtained were similar for soilless cucumber in a naturally ventilated greenhouse and in the range for optimal plant growth and development [41,42]. As expected, the lower transpiration rates, which were observed in the fan pad evaporative cooling compartment, were associated with a higher amount of nutrient outflow from the greenhouse to the environment (i.e., drainage). Particularly in Exp. 2, drainage emission was around 40–45% of the nutrient solution applied for both irrigation regimes tested. In addition, statistical analysis indicated that even within the same greenhouse compartment, different irrigation regimes tested had significantly affected the transpiration rate and the drainage percentage.
The greatest differences on VPD levels between the two cooling systems tested were observed during Exp. 2. This could be explained mainly by the air temperature differences, rather than air humidity levels. It must be noted that when the on and off time of the fan ventilation was not so frequent (Exp. 1; data not shown) the air humidity levels were up to 15–20% higher within the greenhouses’ compartments. The higher humidity levels seem to stimulate cucumber leaf growth (LAI), which was also reported in a previous paper by Körner and Challa [43]. A decrease of the levels of a greenhouse’s air relative humidity has also been reported by many authors as affected by an increase in the ventilation rate [44,45]. However, higher values of LAI were not able to explain lower transpiration values comparing with the Exp. 2 period. Similarly, Yang et al. [46] did not find a strong relationship between transpiration and LAI in the cucumber crop. It is clear from the results that the effect of greenhouse microclimate on the transpiration rate was stronger [47,48], as higher values were observed under the fan ventilation cooling compartment during Exp. 2, compared with the same replications in fan-pad evaporative in the Exp. 1 period.
Despite the fact that growth, yield, and quality of greenhouse plants may be affected by day air temperature above 30 °C [42], in this experiment this was not the case. The comparative results revealed higher mean values for plant growth characteristics (e.g., height, number of leaves and LAI), in the fan ventilation cooling compartment in both growing periods. Similarly, production in terms of number and cucumber weight were also higher, even though differences between cooling systems were not significant. This may be attributed to higher values of vegetative growth (e.g., leaf number, LAI), which were associated with maximum photosynthesis and enhanced water and nutrient supply [40,49]. Higher production values and a lower irrigation regime (T2) considerably improved the absolute values of IWUE on behalf of fan ventilation.
According to substrate temperature, the higher mean day and night temperatures values, which were observed in the compartment with fan ventilation cooling system, may be positively correlated with higher LAI and production. The positive effect of higher cucumber root temperature values on shoot growth, total leaf area, and yield were examined in the past with root temperatures ranging between 12 and 36 °C and were correlated with lower root resistances [50,51]. Stem micro-variation measurements affected by the prevailing greenhouse environment followed diurnal changes of VPD, also reported by several authors [52,53,54]. Even though higher stem shrinkage was observed in the CA compartment, and the growth rate was not as high as in CB, the crop did not seem to be negatively affected in terms of production.

5. Conclusions

Previous studies have underlined the need for the performance evaluation of greenhouse cooling systems to local climatic conditions. In the present study, we have focused on the effectiveness of fan ventilation and a fan-pad evaporative cooling system on greenhouse microclimate and soilless cucumber growth under Mediterranean climatic conditions. We have shown that, in the absence of an evaporative cooling system, cucumber crop can grow and produce without yield restrictions throughout the spring crop period of the year, and that a forced ventilation system proved to be capable of preventing the overheating of a crop. In addition, the present study clearly demonstrated that there is a strong connection between greenhouse microclimate, water uptake, and drainage emissions, and based on the results it is suggested that an irrigation regime of 0.24 L m−2 can be applied successfully in soilless cucumber crops to substantially reduce fertigation effluents. The information presented reveals a need for the performance evaluation of greenhouse cooling systems to local climatic conditions, in order to identify the best strategy for managing agricultural production in environmentally sensitive or water-stressed areas.

Author Contributions

Formal analysis, G.N.; Investigation, G.N.; Methodology, N.K. and C.K.; Supervision, D.N., N.K. and C.K.; Writing—review & editing, G.N. and D.N.

Funding

This research received no external funding.

Acknowledgments

This work was supported by the Agricultural Research Institute of Cyprus (ARI) and authors did not receive any specific grant from funding agencies in the public, commercial, or not-for-profit sectors. The authors would like to thank the staff of the Natural Resources and Environment Section of ARI for their assistance. We also thank anonymous reviewers who helped to increase the clarity of the paper by their comments.

Conflicts of Interest

The authors declare no conflict of interest.

References

  1. Villarreal-Guerrero, F.; Kacira, M.; Fitz-Rodríguez, E.; Linker, R.; Kubota, C.; Giacomelli, G.A.; Arbel, A. Simulated performance of a greenhouse cooling control strategy with natural ventilation and fog cooling. Biosyst. Eng. 2012, 111, 217–228. [Google Scholar] [CrossRef]
  2. Ishii, M.; Sase, S.; Moriyama, H.; Okushima, L.; Ikeguchi, A.; Hayashi, M.; Kurata, K.; Kubota, C.; Kacira, M.; Giacomelli, G.A. Controlled Environment Agriculture for Effective Plant Production Systems in a Semiarid Greenhouse. Jpn. Agric. Res. Q. JARQ 2016, 50, 101–113. [Google Scholar] [CrossRef] [Green Version]
  3. Davies, P.A.; Zaragoza, G. Ideal performance of a self-cooling greenhouse. Appl. Therm. Eng. 2019, 149, 502–511. [Google Scholar] [CrossRef]
  4. Xu, J.; Li, Y.; Wang, R.; Liu, W.; Zhou, P. Experimental performance of evaporative cooling pad systems in greenhouses in humid subtropical climates. Appl. Energy 2015, 138, 291–301. [Google Scholar] [CrossRef]
  5. Chauhan, P.M.; Kim, W.S.; Lieth, J.H. Combined Effect of Whitening and Ventilation Methods on Microclimate and Transpiration in Rose Greenhouse. In Proceedings of the International Conference on Thermal Energy Storage Technologies and Systems, Indore, India, 22–24 March 2003. [Google Scholar]
  6. García, M.; Medrano, E.; Sánchez-Guerrero, M.; Lorenzo, P. Climatic effects of two cooling systems in greenhouses in the Mediterranean area: External mobile shading and fog system. Biosyst. Eng. 2011, 108, 133–143. [Google Scholar] [CrossRef]
  7. Sethi, V.; Sharma, S. Survey of cooling technologies for worldwide agricultural greenhouse applications. Sol. Energy 2007, 81, 1447–1459. [Google Scholar] [CrossRef]
  8. McCartney, L.; Orsat, V.; Lefsrud, M.G. An experimental study of the cooling performance and airflow patterns in a model Natural Ventilation Augmented Cooling (NVAC) greenhouse. Biosyst. Eng. 2018, 174, 173–189. [Google Scholar] [CrossRef]
  9. Aroca-Delgado, R.; Pérez-Alonso, J.; Callejón-Ferre, Á..J.; Velázquez-Martí, B. Compatibility between Crops and Solar Panels: An Overview from Shading Systems. Sustainability 2018, 10, 743. [Google Scholar] [CrossRef]
  10. McCartney, L.; Lefsrud, M.G. Field trials of the Natural Ventilation Augmented Cooling (NVAC) greenhouse. Biosyst. Eng. 2018, 174, 159–172. [Google Scholar] [CrossRef]
  11. Vox, G.; Teitel, M.; Pardossi, A.; Minuto, A.; Tinivella, F.; Schettini, E. Sustainable greenhouse systems. In Sustainable Agriculture: Technology, Planning and Management; Salazar, A., Rios, I., Eds.; Nova Science Publishers, Inc.: New York, NY, USA, 2010; pp. 1–78. ISBN 978-1-60876-269-9. [Google Scholar]
  12. Giacomelli, G.; Sase, S.; Cramer, R.; Hoogeboom, J.; MacKenzie, A.; Parbst, K.; Scarascia-Mugnozza, G.; Selina, P.; Sharp, D.; Voogt, J.; et al. Greenhouse Production Systems for People. Acta Hortic. 2012, 927, 23–38. [Google Scholar] [CrossRef]
  13. Romantchik, E.; Ríos, E.; Sánchez, E.; López, I.; Sánchez, J.R. Determination of energy to be supplied by photovoltaic systems for fan-pad systems in cooling process of greenhouses. Appl. Therm. Eng. 2017, 114, 1161–1168. [Google Scholar] [CrossRef]
  14. Ganguly, A.; Ghosh, S. A Review of Venti-lation and Cooling Technologies in Agricultural Greenhouse Application. Iran. J. Energy Environ. 2011, 2, 32–46. [Google Scholar]
  15. Kittas, C.; Katsoulas, N.; Bartzanas, T. Structures: Design, technology and climate control. In Good Agricultural Practices for Greenhouse Vegetables Production in the South East European Countries; Plant Production and Protection Paper 230; FAO: Rome, Italy, 2017; pp. 29–53. [Google Scholar]
  16. Nikolaou, G.; Neocleous, D.; Katsoulas, N.; Kittas, C. Dynamic Assessment of Whitewash Shading and Evaporative Cooling on the Greenhouse Microclimate and Cucumber Growth in a Mediterranean Climate. Ital. J. Agrometeorol. 2018, 2, 15–26. [Google Scholar]
  17. Leonardi, C.M.; Guichard, S.; Bertin, N. High vapour pressure deficit influences growth, transpiration and quality of tomato fruits. Sci. Hortic. 2000, 84, 285–296. [Google Scholar] [CrossRef]
  18. Willits, D. Cooling Fan-ventilated Greenhouses: A Modelling Study. Biosyst. Eng. 2003, 84, 315–329. [Google Scholar] [CrossRef]
  19. Alsadon, A.; Al-Helal, I.; Ibrahim, A.; Abdel-Ghany, A.; Al-Zaharani, S.; Ashour, T. The effects of plastic greenhouse covering on cucumber (Cucumis sativus L.) growth. Ecol. Eng. 2016, 87, 305–312. [Google Scholar] [CrossRef]
  20. Ghani, S.; Bakochristou, F.; ElBialy, E.M.A.A.; Gamaledin, S.M.A.; Rashwan, M.M.; Abdelhalim, A.M.; Ismail, S.M.; Ayman, M.A.; Salman, M.I. Design challenges of agricultural greenhouses in hot and arid environments—A review. Eng. Agric. Environ. Food 2019, 12, 48–70. [Google Scholar] [CrossRef]
  21. Adeyemi, O.; Grove, I.; Peets, S.; Domun, Y.; Norton, T. Dynamic modelling of lettuce transpiration for water status monitoring. Comput. Electron. Agric. 2018, 155, 50–57. [Google Scholar] [CrossRef]
  22. Nikolaou, G.; Neocleous, D.; Constantinos Kittas, N.K. Modelling Transpiration of Soilless Greenhouse Cucumber and Its Relationship with Leaf Temperature in a Mediterranean Climate. Emirates J. Food Agric. 2017, 29, 911–920. [Google Scholar] [CrossRef]
  23. Li, J.; Liu, H.; Wang, H.; Luo, J.; Zhang, X.; Liu, Z.; Zhang, Y.; Zhai, L.; Lei, Q.; Ren, T.; et al. Managing irrigation and fertilization for the sustainable cultivation of greenhouse vegetables. Agric. Water Manag. 2018, 210, 354–363. [Google Scholar] [CrossRef]
  24. Garcia-Caparros, P.; Contreras, J.I.; Baeza, R.; Segura, M.L.; Lao, M.T. Integral Management of Irrigation Water in Intensive Horticultural Systems of Almería. Sustainability 2017, 9, 2271. [Google Scholar] [CrossRef]
  25. Kläring, H.-P. Strategies to control water and nutrient supplies to greenhouse crops. A review. Agronomy 2001, 21, 311–321. [Google Scholar] [CrossRef] [Green Version]
  26. Nikolaou, G.; Neocleous, D.; Katsoulas, N.; Kittas, C. Irrigation of Greenhouse Crops. Horticulturae 2019, 5, 7. [Google Scholar] [CrossRef]
  27. Rahil, M.; Qanadillo, A. Effects of different irrigation regimes on yield and water use efficiency of cucumber crop. Agric. Water Manag. 2015, 148, 10–15. [Google Scholar] [CrossRef]
  28. Sánchez-Guerrero, M.; Lorenzo, P.; Medrano, E.; Baille, A.; Castilla, N. Effects of EC-based irrigation scheduling and CO2 enrichment on water use efficiency of a greenhouse cucumber crop. Agric. Water Manag. 2009, 96, 429–436. [Google Scholar] [CrossRef]
  29. Nikolaou, G.; Neocleous, D.; Katsoulas, N.; Kittas, C. Effect of irrigation frequency on growth and production of a cucumber crop under soilless culture. Emir. J. Food Agric. 2017, 29, 863. [Google Scholar] [CrossRef]
  30. Sanchez-Molina, J.A.; Rodriguez, F.; Guzman, J.L.; Ramírez-Arias, J. Water content virtual sensor for tomatoes in coconut coir substrate for irrigation control design. Agric. Water Manag. 2015, 151, 114–125. [Google Scholar] [CrossRef]
  31. Pérez-Castro, A.; Sánchez-Molina, J.A.; Castilla, M.; Sánchez-Moreno, J.; Moreno-Úbeda, J.C.; Magán, J.J. CFertigUAL: A Fertigation Management App for Greenhouse Vegetable Crops. Agric. Water Manag. 2017, 183, 186–193. [Google Scholar] [CrossRef]
  32. Katsoulas, N.; Kittas, C.; Dimokas, G.; Lykas, C. Effect of Irrigation Frequency on Rose Flower Production and Quality. Biosyst. Eng. 2006, 93, 237–244. [Google Scholar] [CrossRef]
  33. Savvas, D.; Gianquinto, G.P.; Tuzel, Y.; Gruda, N. Soilless Culture. In Good Agricultural Practices for Greenhouse Vegetable Crops. Principles for Mediterranean Climate Areas; FAO, Ed.; Food and Agriculture Organization of the United Nations: Rome, Italy, 2013; pp. 303–354. [Google Scholar]
  34. Beeson, R. Weighing lysimeter systems for quantifying water use and studies of controlled water stress for crops grown in low bulk density substrates. Agric. Water Manag. 2011, 98, 967–976. [Google Scholar] [CrossRef]
  35. Vera-Repullo, J.A.; Ruiz-Peñalver, L.; Jiménez-Buendía, M.; Rosillo, J.J.; Molina-Martínez, J.M. Software for the Automatic Control of Irrigation Using Weighing-Drainage Lysimeters. Agric. Water Manag. 2015, 151, 4–12. [Google Scholar] [CrossRef]
  36. Tsirogiannis, I.; Katsoulas, N.; Kittas, C. Effect of Irrigation Scheduling on Gerbera Flower Yield and Quality. HortScience 2010, 45, 265–270. [Google Scholar] [CrossRef] [Green Version]
  37. Schiattone, M.; Viggiani, R.; Di Venere, D.; Sergio, L.; Cantore, V.; Todorovic, M.; Perniola, M.; Candido, V. Impact of irrigation regime and nitrogen rate on yield, quality and water use efficiency of wild rocket under greenhouse conditions. Sci. Hortic. 2018, 229, 182–192. [Google Scholar] [CrossRef]
  38. Liu, H.; Duan, A.-W.; Li, F.-S.; Sun, J.-S.; Wang, Y.-C.; Sun, C.-T. Drip Irrigation Scheduling for Tomato Grown in Solar Greenhouse Based on Pan Evaporation in North China Plain. J. Integr. Agric. 2013, 12, 520–531. [Google Scholar] [CrossRef]
  39. Varma, V.; Osuri, M.A. Black Spot: A platform for automated and rapid estimation of leaf area from scanned images. Plant Ecol. 2013, 214, 1529–1534. [Google Scholar] [CrossRef]
  40. Katsoulas, N.; Savvas, D.; Tsirogiannis, I.; Merkouris, O.; Kittas, C. Response of an eggplant crop grown under Mediterranean summer conditions to greenhouse fog cooling. Sci. Hortic. 2009, 123, 90–98. [Google Scholar] [CrossRef]
  41. Singh, M.C.; Singh, J.; Singh, K. Development of a microclimate model for prediction of temperatures inside a naturally ventilated greenhouse under cucumber crop in soilless media. Comput. Electron. Agric. 2018, 154, 227–238. [Google Scholar] [CrossRef]
  42. Singh, M.C.; Singh, J.P.; Singh, K.G. Optimal Operating Microclimatic Conditions for Drip Fertigated Cucumbers in Soilless Media under a Naturally Ventilated Greenhouse. India J. Ecology 2017, 44, 821–826. [Google Scholar]
  43. Körner, O.; Challa, H. Process-based humidity control regime for greenhouse crops. Comput. Electron. Agric. 2003, 39, 173–192. [Google Scholar] [CrossRef]
  44. Ahemd, H.A.; Al-Faraj, A.A.; Abdel-Ghany, A.M. Shading greenhouses to improve the microclimate, energy and water saving in hot regions: A review. Sci. Hortic. 2016, 201, 36–45. [Google Scholar] [CrossRef]
  45. Sase, S.; Ishii, M.; Moriyama, H.; Kubota, C.; Kurata, K.; Hayashi, M.; Sabeh, N.; Romero, P.; Giacomelli, G. Effect of Natural Ventilation Rate on Relative Humidity and Water Use for Fog Cooling in A Semiarid Greenhouse. Acta Hortic. 2006, 719, 385–392. [Google Scholar] [CrossRef]
  46. Yang, X.; Short, T.H.; Fox, R.D.; Bauerle, W.L. The Microclimate and Transpiration of a Greenhouse Cucumber Crop. Trans. ASAE 1989, 32, 2143–2150. [Google Scholar] [CrossRef]
  47. Zhang, Z.-K.; Liu, S.-Q.; Liu, S.-H.; Huang, Z.-J. Estimation of Cucumber Evapotranspiration in Solar Greenhouse in Northeast China. Agric. Sci. China 2010, 9, 512–518. [Google Scholar] [CrossRef]
  48. Kittas, C. Solar radiation of a greenhouse as a tool to its irrigation control. Int. J. Energy Res. 1990, 14, 881–892. [Google Scholar] [CrossRef]
  49. Melo, E.F.R.; Dos Santos, O.S. Growth and production of nasturtium flowers in three hydroponic solutions. Hortic. Bras. 2011, 29, 584–589. [Google Scholar] [CrossRef] [Green Version]
  50. Gosselin, A.; Trudel, M.-J. Influence of root-zone temperature on growth, development and yield of cucumber plants cv. Toska. Plant Soil 1985, 85, 327–336. [Google Scholar] [CrossRef]
  51. Yoshida, S.; Eguchi, H. Root temperature effect on root hydraulic resistance in cucumber (cucumis sativus L.) and figleaf gourd (cucurbita ficifolia B.) plants. Biotronics 1990, 19, 121–127. [Google Scholar]
  52. Gallardo, M.; Thompson, R.B.; Valdez, L.C.; Fernández, M.D.; Thompson, R. Use of stem diameter variations to detect plant water stress in tomato. Irrig. Sci. 2006, 24, 241–255. [Google Scholar] [CrossRef]
  53. De Swaef, T.; Steppe, K. Linking stem diameter variations to sap flow, turgor and water potential in tomato. Funct. Plant Boil. 2010, 37, 429–438. [Google Scholar] [CrossRef]
  54. Lee, B.W.; Shin, J.H. Optimal irrigation management system of greenhouse tomato based on stem diameter and transpiration monitoring. Agric. Inf. Tech. Asia Oceania. 1998, 23, 87–90. [Google Scholar]
Figure 1. Greenhouse layout and sun orientation during autumn–winter (Exp. 1) and spring (Exp. 2) cropping seasons.
Agronomy 09 00300 g001
Figure 2. Layout of greenhouse separation into two compartments, positioning of the plants and measuring equipment (lysimeters); CA, compartment with fan ventilation cooling; CB, compartment with fan-pad evaporative cooling; L1, L2, lysimeters; T1, irrigation treatment 1 (0.32 L m−2); T2, irrigation treatment 2 (0.24 L m−2).
Agronomy 09 00300 g002
Figure 3. Mean measured greenhouse air temperature and vapor pressure deficit in the greenhouse compartment with fan ventilation cooling system (CA) and in the greenhouse compartment with fan-pad evaporative cooling (CB) during Exp. 1 and Exp. 2; ambient air temperature (EX); error bars (± 1 standard error).
Agronomy 09 00300 g003
Figure 4. Mean measured greenhouse air and leaf temperature values in the greenhouse compartment with fan ventilation cooling system (CA) and in the greenhouse compartment with fan-pad evaporative cooling (CB) during Exp. 1 and Exp. 2, error bars (± 1 standard error).
Agronomy 09 00300 g004
Table 1. Mean values (±standard deviation) of inside microclimate greenhouse and external greenhouse climatic data for daylight hours for Exp. 1 (autumn–winter crop) and Exp. 2 (spring crop).
External ClimateCACB
DATRGO (W m−2)RGI (W m−2)TO (°C)RHO (%)TI (°C)RHI (%)VPDI (kPa)TI (°C)RHI (%)VPDI (kPa)
Exp. 110-20520 (258)330 (165)28.2 (3.8)55.2 (10.6)27.2 (5.0)57.4 (12.9)1.7 (0.8)23.2 (4.3)62.7 (9.5)1.1 (0.4)
21-31505 (224)322 (150)27.3 (3.2)56.4 (10.5)28.3 (5.1)66.7 (12.3)1.4 (0.7)22.7 (3.5)68.4 (10.9)0.9 (0.4)
32-42418 (256)247 (168)23.3 (4.1)59.9 (16.7)24.7 (5.4)74.7 (12.9)0.9 (0.7)20.2 (3.6)71.5 (14.5)0.7 (0.5)
43-53411 (203)240 (136)24.5 (3.4)55.2 (14.5)25.3 (5.6)73.9 (10.2)1.0 (0.6)20.5 (3.7)71.7 (13.9)0.7 (0.4)
54-64388 (214)227 (134)20.4 (3.7)59.2 (13.4)21.9 (6.5)75.4 (11.5)0.8 (0.5)18.0 (4.9)75.3 (12.1)0.6 (0.4)
65-75378 (193)222 (121)21.4 (3.4)62.9 (12.6)23.9 (5.7)75.2 (11.8)0.8 (0.5)19.7 (4.1)74.5 (12.5)0.6 (0.4)
Exp. 210-20609 (311)424 (217)21.7 (3.6)62.5 (13.1)27.9 (6.4)52.6 (15.1)2.1 (1.1)21.7 (4.1)55.3 (12.6)1.2 (0.5)
21-31632 (311)440 (216)20.9 (3.7)55.4 (12.1)28.4 (6.3)57.3 (15.3)1.9 (1.1)21.4 (4.2)53.9 (15.8)1.2 (0.5)
32-42679 (307)473 (214)22.7 (4.2)54.9 (11.1)29.1 (6.2)60.8 (13.9)1.8 (0.9)22.0 (4.3)56.9 (15.1)1.2 (0.5)
43-53747 (292)520 (203)25.7 (3.6)52.2 (15)31.1 (4.7)54.8 (15.8)2.2 (0.9)23.7 (3.4)55.9 (13.7)1.3 (0.5)
54-64707 (314)492 (219)27.3 (2.8)61.1 (18.3)31.3 (4.0)56.6 (13.4)2.1 (0.8)24.9 (3.2)59.9 (13.3)1.3 (0.5)
65-75735 (318)512 (221)29.7 (4.2)49.2 (14.1)32.7 (4.0)50.2 (14.2)2.6 (1.1)26.5 (3.5)56.8 (11.7)1.6 (0.6)
RGo, outside greenhouse solar radiation; RGI, inside greenhouse solar radiation; To, outside greenhouse; RHO, outside air relative humidity; Ti, greenhouse air temperature; RHI, greenhouse air relative humidity; VPDI, greenhouse air vapor pressure deficit; CA, greenhouse compartment with fan ventilation cooling; CB, greenhouse compartment with fan-pad evaporative cooling; DAT, days after transplanting.
Table 2. Mean values (±standard deviation) of fresh and dry weight of leaves, stem, and fruits, leaf area index (LAI), leaves, height and number of fruits and weight per plant for (autumn–winter crop; Exp. 1) and (spring crop; Exp. 2).
Exp. 1Exp. 2
CA, T1CA, T2CB, T1CB, T2CA, T1CA, T2CB, T1CB, T2
Leaves (no pl−1)21.4 (3.4)c19.7 (2.3)b18.6 (2.9)ab17.7 (1.9)a21.2 (4.4)c19.4 (3.9)bc17.2 (3.9)ab16.1 (3.5)a
Height (cm pl−1)226.2 (58.8)c208.5 (45.7)bc187.5(48.6)ab176.8 (41.6)a165.9 (7.3)b150.2(45.2)ab137.3(60.9)ab127.1 (55.6)a
LAI (m2 leaf m−2 ground)1.6 (0.3)b1.5 (0.2)b1.4 (0.3)b1.2 (0.2)a0.9 (0.2)ab0.9 (0.3)b0.8 (0.2)a0.8 (0.2)a
Leaf fresh weight (gr pl−1)407.1 (198.9)351.6 (184.3)371.2 (195.1)330.5 (167.3)300.4 (222.1)272.2 (206)292.4 (226.8)245.2 (194.4)
Leaf dry weight (gr pl−1)35.9 (15.1)35.1 (17.1)38.2 (19.8)33.6 (16.9)32.3 (21)30.6 (21)33.8 (25.1)28.2 (20.9)
Stem fresh weight (gr pl−1)196.6 (98.3)171.1 (77.5)180.4 (94.6)172.2 (86.1)143.2 (98.3)140.2 (104.5)172.4 (138.9)159.2 (132.8)
Stem dry weight (gr pl−1)13.5 (7.8)13.3 (6.8)12.9 (7.4)13.4 (8.3)11.8 (9.1)12.2 (10.6)14.2 (12.9)13.7 (13)
Fruit fresh weight (gr pl−1)371.1 (281.1)260.1 (223.3)305.2 (271.6)216.8 (172.1)390.5 (404)652.4 (372)441 (229)430.1 (298.3)
Fruit dry weight (gr pl−1)19.1 (13.3)15.4 (13.4)17.4 (14.5)14.6 (12.6)18.2 (17.3)30.6 (17.3)20.86 (11.5)21.6 (14.6)
Fruits (no pl−1)3.0 (1.4)3.1 (1.4)2.9 (1.4)3.0 (1.4)4.9 (2.2)4.9 (2.3)4.4 (2.3)4.1 (2.3)
Fruits (gr pl−1)367.8 (191.2)364.3 (222.9)351.8 (170.4)342.5 (175.1)656.3 (321.1)670.4 (350.9)541.1 (297.2)525.0 (283.0)
CA, greenhouse compartment with fan ventilation cooling; CB, greenhouse compartment with fan-pad evaporative cooling; T1, irrigation treatment 1 (0.32 L m−2); T2, irrigation treatment 2 (0.24 L m−2); in each experiment within row, values followed by the same letter (a, b, c) are not significantly different (p = 0.05).
Table 3. Mean values (±standard deviation) of plant transpiration measured by weighing lysimeters, water uptake estimated with the water balance method and drainage for Exp. 1 (autumn–winter crop) and Exp. 2 (spring crop).
DATCA, T1CA, T2CB, T1CB, T2
Exp. 1Transpiration (W m−2)15–60104.0 (60.8)b-84.7 (47.1)a-
50–5586.8 (51.1)b-64.9 (45.7)a-
Water uptake (mL pl−1 irrig−1)45–50122 (46.8)d116.4 (33.2)c111.3 (40.1)b93.6 (28.2)a
Drainage (% irrig−1)44–5335.3 (22.6)d21.9 (11.5)a34.3 (20.7)c28.4 (20.1)b
Exp. 2Transpiration (W m−2)15–60130.5 (62.5)b-80.1 (50.1)a-
50–55171.3 (88.1)b-110.2 (50.2)a-
Water uptake (mL pl−1 irrig−1)45–50130.5 (57.5)d126.2 (32.2)c111.8 (83.2)b101 (53.8)a
Drainage (% irrig−1)44–5330.9 (26.3)b21.9 (12.8)a45.5 (37.1)d42.5 (28.5)c
CA, greenhouse compartment with fan ventilation cooling; CB, greenhouse compartment with fan-pad evaporative cooling; DAT, Days After Transplanting; T1, irrigation treatment 1 (0.32 L m−2); T2, irrigation treatment 2 (0.24 L m−2); in each row, values followed by the same letter (a, b, c, d) are not significantly different (p = 0.05).
Table 4. Estimation of Irrigation Water Use Efficiency (IWUE) based on absolute values of cumulative yield per treatment and total irrigation for Exp. 1 (autumn–winter crop) and Exp. 2 (spring crop).
TreatmentProduction (kg m−2)Irrigation (L m−2)IWUE (kg m−3)
Exp. 1CA, T18.8312272
CA, T28.7410286
CB, T18.4412269
CB, T28.2210280
Exp. 2CA, T115.1723864
CA, T215.3719878
CB, T111.9923850
CB, T210.4919853
CA, greenhouse compartment with fan ventilation cooling; CB, greenhouse compartment with fan-pad evaporative cooling; T1, irrigation treatment 1 (0.32 L m−2); T2, irrigation treatment 2 (0.24 L m−2).

