Article

Contrasting Impacts of Long-Term Application of Biofertilizers and Organic Manure on Grain Yield of Winter Wheat in North China Plain

1
College of Agronomy and Biotechnology, China Agricultural University, Haidian district, Beijing 100193, China
2
Department of Agronomy, Higher Institute of Agronomy and Veterinary of Faranah, Faranah 131, Guinea
3
College of Resources and Environmental Sciences, China Agricultural University, Haidian district, Beijing 100193, China
*
Authors to whom correspondence should be addressed.
Submission received: 3 April 2019 / Revised: 4 June 2019 / Accepted: 5 June 2019 / Published: 13 June 2019

Abstract

:
The effects of long-term incorporation of organic manure and biofertilizers have been investigated on winter wheat in the North China Plain (NCP). The five-year field experiment (2013–2018) has illustrated the responses of grain yield and yield components. Seven fertilization approaches, included pig farm-yard-manure and biofertilizers amendments combined with five NPK% drop levels of chemical fertilizer ratio + organic fertilizer + biofertilizer (0, C+O+B) 25%, CL4; 50%, CL3; 75%, CL1; and 100%, CL0), without fertilizer as control (CK), in NCP during the years 2013–2018. Results showed that the grain yields of CL1 and CL2 were equivalent to CL0 in all growing seasons except 2014/2015. The grain yields of CL4 were 29.9% to 46.6% lower than that of CL0 during 2014/2015, 2016/2017, and 2017/2018. The valuable spike-number, grain number per-spike, and 1000-grain weight showed significant variations among different growing periods. Regression analysis of grain yield and yield components indicated that number grains per-spike showed significant increase in seed yield formation. The 1000-grain weight was the major parameter that influenced yield of moderate and low yielding periods, respectively. The results revealed that application of 30 m3 ha−1 pig farm-yard-manure and 20 kg ha−1 biofertilizers has reduced at least 50% of the NPK fertilization without dropping grain yields in the North China Plain.

1. Introduction

Wheat (Triticum aestivum L.) is one of the most important grain crops in the world and provides approximately 20% of the entire caloric intake of the world population [1,2,3]. About one third of human being nutritional protein is derived from grains worldwide. China is a major wheat producing country and contributed to 11.1% (24.3 million hectares) and 17.6% (131.7 million tons) of the world total wheat harvest area and yield production in 2016, respectively [4,5,6]. The North China Plain (NCP) is the most important dryland grain production region in China. The plain is known for its intensively managed double-cropping systems with rotations of wheat (Triticum aestivum L.) and maize (Zea mays L.). Winter wheat and summer maize rotation is the primary cropping system in the North China Plain [3,7,8] and this region produced 2/3 of the nation’s total production. Consequently, wheat production in the NCP plays a very important role to fulfill the increased food demands in China to ensure food security. As such, potential soil regions around the world, could play an important role to combat future climate change impacts on soil health and sustainable agriculture [9,10,11].
Fertilization is one of the most key driving forces in agriculture and play important role in crop grain yield formation [12,13,14] and farmers in general apply a high dose of chemical fertilizers during wheat production to harvest high grain yields [7,15,16]. However, the long-term unnecessary use of compound fertilizers in agricultural farming has unanticipated environmental impacts, including degradation of soil fertility, organic matter absorption and decreased water holding capacity (WHC), nutrient mobilization, and uptake by root zone [3,17]. Moreover, the excess input of chemical fertilizers resulted in NO3 leaching, volatilization of NH3, and NOx emission from agricultural fields and damaged both environment and human health [3,5,6,18,19]. Efforts have been devoted to reduce chemical fertilizers application in wheat production, and organic manure and biofertilizers amendments are considered to be feasible ways to realize this goal without decreasing grain yields [11,20,21,22]. Application of organic manure can increase soil carbon, improve soil fertility, and obtain similar yield compared with inorganic fertilizer addition [18,23,24]. Research [25,26] reported that the wheat grain yields were comparable in the treatments that received 80 t ha−1 yr−1 of organic manure or 204–252 kg N ha−1 yr−1 chemical N-fertilizers. As for biofertilizers, [27,28,29] reported that application of one biofertilizers obtained from sewage sludge at 7.2 L ha−1 increased maize grain yield by 17% compared with the untreated control and [10,30,31] revealed that biofertilizers amendments reduced inorganic N-fertilizers by 25% without decreasing rice yield in India [32].
Application of organic manure and biofertilizers showed great advantages in dry matter, grain yield, and nutrient content in grain [11,29,33], and had the potential to reduce chemical fertilizers without decreasing grains yield. Nevertheless, limited literature is available on how organic manure or farm-yard-manure (FYM) and biofertilizers amendments combined with reduced chemical fertilizers can improve grain yield and yield components in the NCP winter wheat [18,33,34]. Furthermore, the national level food production depended upon the crop rotation system which is applied to 30 million hectare of wheat and maize crops in the North China Plain [31], accounting for 48% and 39%, respectively.
In the present study, we investigated the effects of organic manure and biofertilizer amendments pooled with different reduction rates of compound fertilizers on wheat grain yield and yield components during the 2013–2018 growing seasons. The objectives were: (1) to estimate what percentage of chemical fertilizers can be substituted by organic manure and biofertilizers amendments without decline in grain yield and (2) to explore how effective spike number, grain number per spike, and 1000-grain weight contribute to grain yields and economic production under different grain yield levels.

2. Materials and Methods

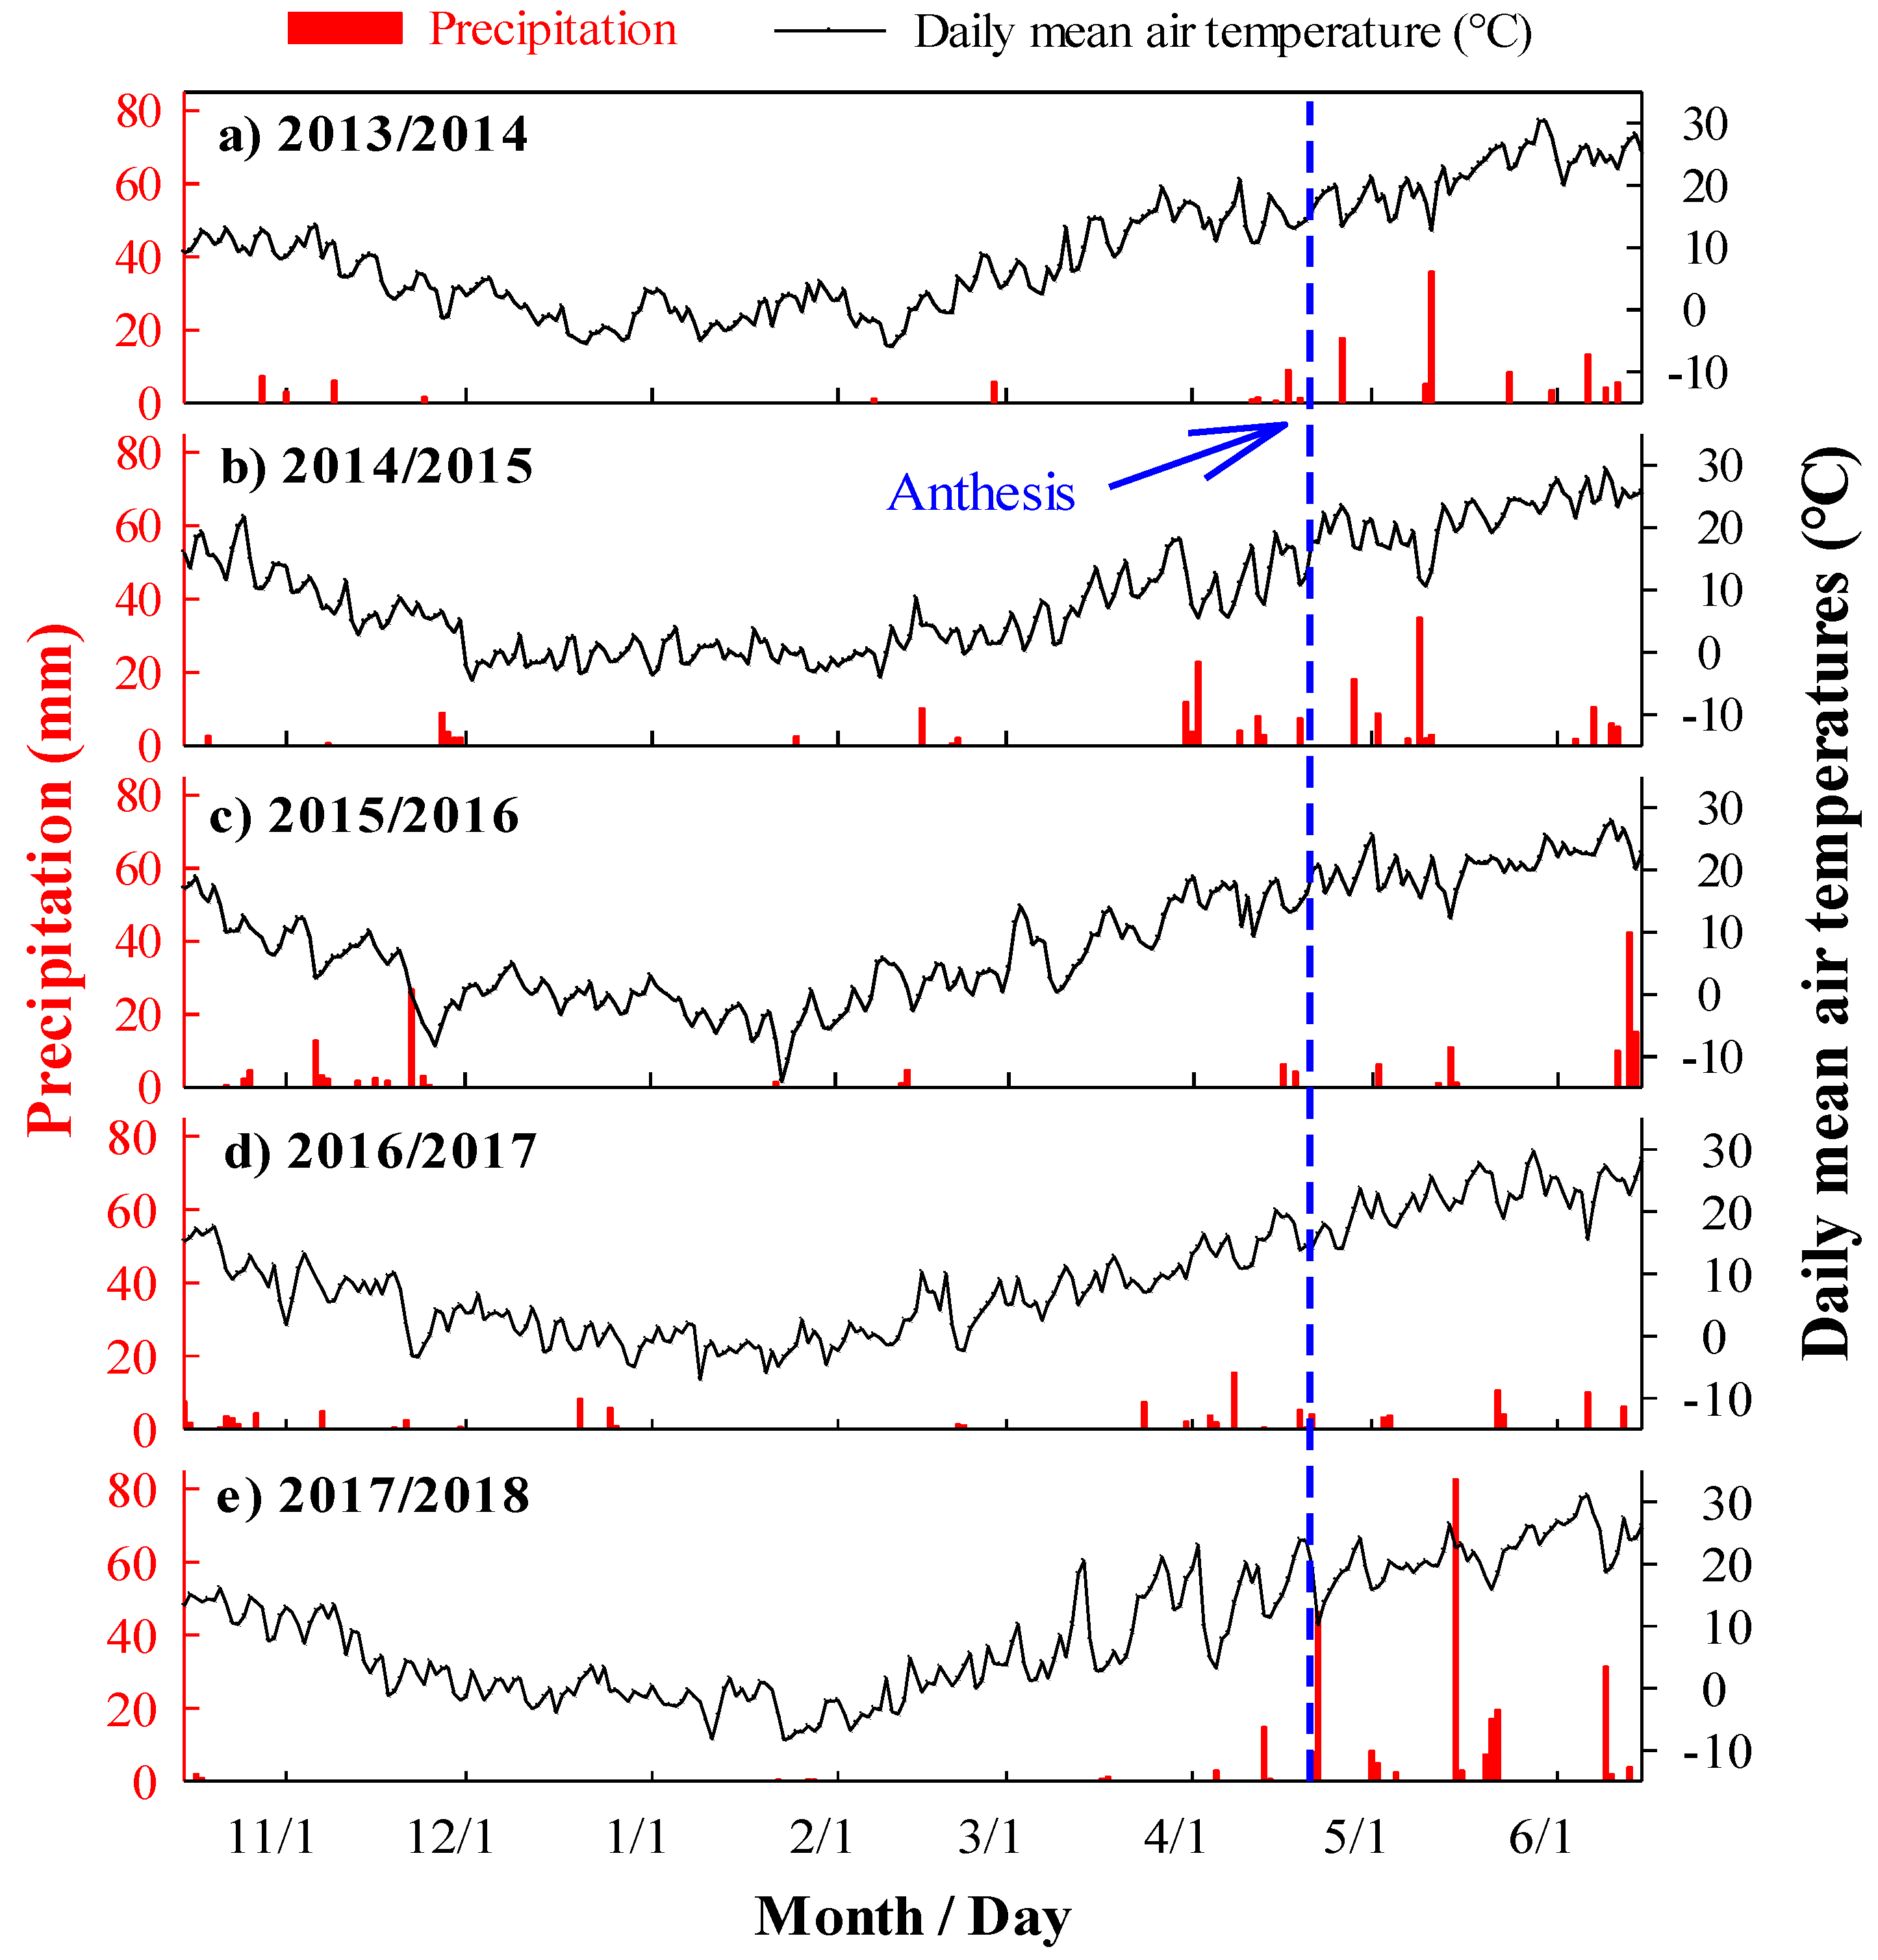
2.1. Status of Agrometeorology and Soil Profile

The long-term field experiment was conducted during the 2013–2018 (2013/2014, 2014/2015, 2015/2016, 2016/2017, and 2017/2018) winter wheat growing seasons at the Wuqiao Experimental Station of China Agricultural University (37°37′ N, 116°26′ E) in Cangzhou, Hebei, China. This site has a warm temperate semi-humid continental monsoon climate with a mean frost-free period of 201 days. The long-term average annual precipitation, temperature, and sunshine time were 562 mm, 12.6°, and 2724 h, respectively. Daily precipitation and mean air temperature during the 2013–2018 growing seasons are shown in Figure 1.
Precipitation during the 2017 to 2018 growing season was 49% higher than the long-term average, but nearly 70% of the rainfall was concentrated after flowering stage of the winter wheat crop [3]. The soil type of the research site is sandy to clay loam (Table 1). Basic properties of the topsoil (0–20 cm) layer were: Soil pH 8.2 (1: 2.5, soil to water), soil organic matter 16.09 g kg−1, total nitrogen 1.02 g kg−1, Olsen phosphorus 20.31 mg kg−1, and available potassium 87.49 mg kg−1, respectively, before the experiment started in 2013.

2.2. Long-Term Fertilization Strategies

The field fertilization experiment started from the 2013/2014 winter wheat growing season in winter wheat-summer maize rotation system and then maintained the same fertilization approaches. The experiment contained seven treatments with three replicates in a randomized complete-block design (RCBD): (i) without fertilization as control (CK); (ii) 100% chemical fertilizers NPK (CL0); (iii) 75% chemical fertilizers NPK + organic manure + biofertilizers (CL1); (iv) 50% chemical fertilizers NPK + organic manure + biofertilizers (CL2); (v) 25% chemical fertilizers NPK + organic manure + biofertilizers (CL3); (vi) organic manure+biofertilizers (CL4); and (vii) 100% chemical fertilizers NPK+organic manure + biofertilizers (C+O+B). The plot size was 20 m2 (5 m by 4 m).
Fertilization strategies were the same for all the five years winter wheat growing periods. The 100% chemical fertilizers were 205.5 kg N ha−1, 172.5 kg P2O5 ha−1, and 112.5 kg K2O ha−1 in form of urea, diammonium phosphate, and potassium sulfate, respectively. The organic manure was applied with pig manure at a rate of 30 m3 ha−1 which contained 226.2 kg N ha−1, 903.8 kg P2O5 ha−1, and 125.1 kg K2O ha−1, respectively. Microbial biofertilizer with the effective viable count of ≥2 million g-1 mixed with microbial fertilizer with lignite as the base material used in this study which was supplied by the Beijing Liuhe Shenzhou Biotechnology Co. Ltd. Biofertilizers were applied with a rate of 20 kg ha−1 (Table 2). All the phosphorus (P), potassium (K), organic manure, and biofertilizers were applied as base fertilizer and chemical N-fertilizer was applied with 50% as base fertilizer and 50% as topdressing at the jointing stage of the crop, correspondingly.

2.3. Crop Management and Sampling Analysis

Winter wheat was cultivated from 8 to 15 October and harvested from 10 to 13 June of the next year during the entire experiment (2013–2018) of wheat growing seasons, respectively. Before winter wheat sowing, the field was irrigated with 50m3 ha−1 (75 mm) and received one more irrigation during the jointing and grain filling stages with 50 m3 ha−1, in that order. Other agronomic management practices i.e., weeding, pest control, and disease control, were done as recommended and needed according to tangible conditions during the 2013 to 2018 growing period. At the crop maturity stage, an area of 1 m2 (1 m by 1 m) winter wheat plants were selected for sampling, effective spike number and grain yield measurements, and 20 winter wheat plants were collected to determine the grain number per spike in each replication of different treatments. The 1000-grain weight was measured three times for each plot and treatment.
One-way analysis of variance (ANOVA) was performed to compare the differences in winter wheat yield and yield components in each growing season using the least significant difference test (LSD, P = 0.05) and two-way ANOVA was carried out to show the significance of year, fertilization, and their interaction on winter wheat yield and yield components using SPSS 20.0 (SPSS Inc., Chicago, IL, USA). Regression analysis was performed to present the correlations between yield and yield components under high, moderate, and low yield conditions. All figures were made by using SigmaPlot 14 (Systat Software Inc., San José, CA, USA).

3. Results

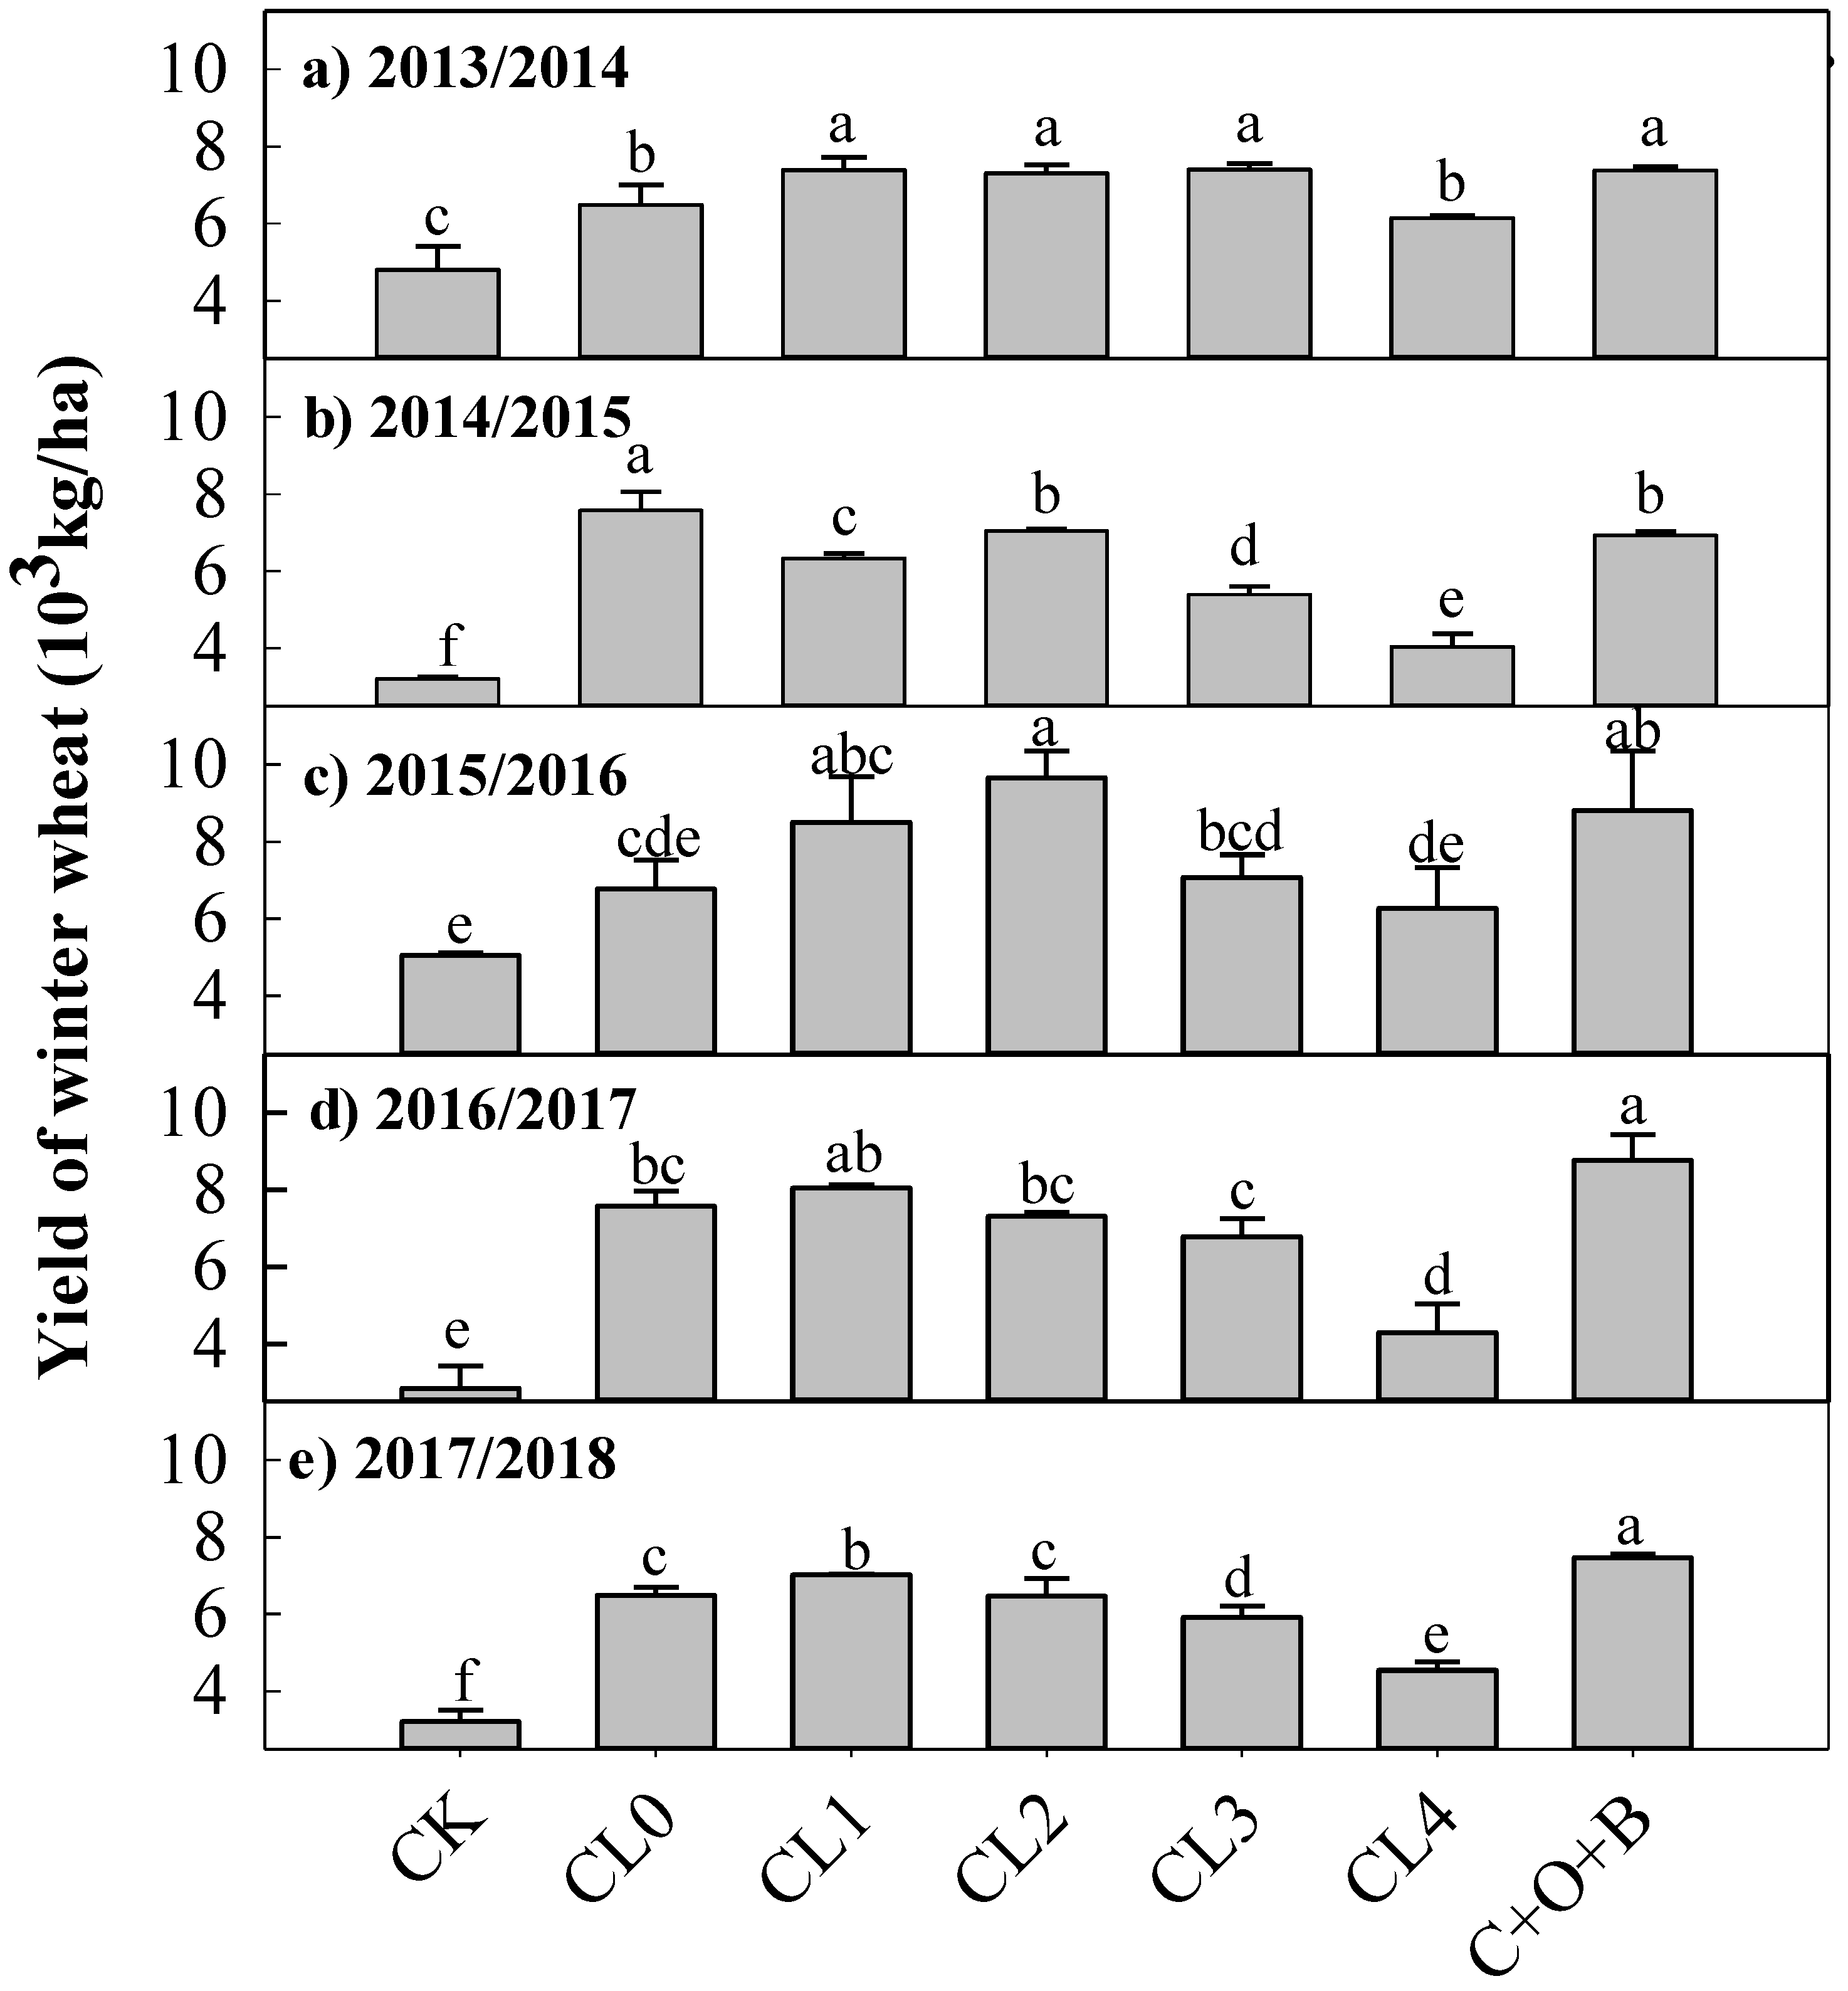
3.1. Soil Profile and Grain Yield

Significant variations were observed in grains yield among different fertilization treatments as reported in Figure 2. The two-way ANOVA showed that year (F = 119.311, P < 0.001), fertilization (F = 34.329, P < 0.001), and their interaction (F = 5.236, P < 0.001) all greatly influenced the grain yields at the maturity stage (Table 3). The grain yields in all the fertilized treatments were significantly high (0.28–0.54, 0.20–1.36, 0.24–0.91, 0.51–2.06, and 0.41–1.32 times more in the 2013/2014, 2014/2015, 2015/2016, 2016/2017, and 2017/2018 growing seasons, respectively) than that in CK with the exception of CL4 in 2015/2016. Treatments that received organic manure and biofertilizers showed enormous variations in grains yield compared with CL0 in different planting seasons. Furthermore, the grain yields drastically decreased with the decrease in chemical fertilizers application rates and the grain yield in CL4 was the lowest among the organic manure and biofertilizers amendment treatments in all the five growing seasons. In the 2014/2015 growing season, the grain yields in all the organic manure and biofertilizers amendments treatments were 53.4–93.0% as much as that in CL0 and the grain yields arranged in order by CL0>CL1, C+O+B>CL1>CL3>CL4 in the fertilized treatments (P < 0.001).
The grain yields in CL1 and C+O+B were 1.06–1.25 and 1.14–1.30 times more and that in CL4 were 0.57–0.95 times more as much as those in CL0 in the rest four growing seasons (P < 0.001), respectively. The grain yields in CL2 and CL3 were 1.13–1.43 and 1.05–1.14 times more in the 2013/2014 and 2015/2016, and 0.96–1.00 and 0.90–0.91 times as much as that in CL0 in the 2016/2017 and 2017/2018 growing seasons (P < 0.001) (Figure 2, Table 3), respectively. During the five growing seasons, the highest mean annual grain yield was observed in C+O+B, followed by CL2, CL1, CL0, CL4, and CK. The mean grain yields of the 2013–2018 growing seasons in the fertilized treatments were 0.32–1.05 times greater than that in CK and those in combined chemical fertilizers (NPK) and organic manure treatments were 0.29–0.56 times more than that in organic manure and biofertilizers amendments treatment (CL4), respectively.

3.2. Assessment of Biofertilizer and Manure Effects on Growth and Seed Yield

The effectual spikes, number of grains per-spike, and 1000-grain weight varied greatly among different fertilization in all the five growing spells except for 1000-grain weight in the 2013/2014 growing season (Table 3). The two-way ANOVA showed that year (F = 506.477, P < 0.001; F = 13.354, P < 0.001, and F = 34.941, P < 0.001), fertilization (F = 17307.338, P < 0.001; F = 140.882, P < 0.001, and F = 10.999, P < 0.001), and their interaction (F = 599.855, P < 0.001; F = 3.937, P < 0.001, and F = 8.403, P < 0.001) all profoundly affected the effective spike number, grain number per spike, and 1000-grain weight (Table 3), in that order. The highest effective spike numbers were obtained in C+O+B in the 2013/2014, 2015/2016, 2016/2017, and 2017/2018 growing seasons and in CL2 in the 2014/2015 growing season, which were 1.1–29.5%, 15.5–57.5%, 5.0–65.7%, 9.0–57.1%, and 1.8–47.5% higher than those in the rest treatments (Table 3), respectively.

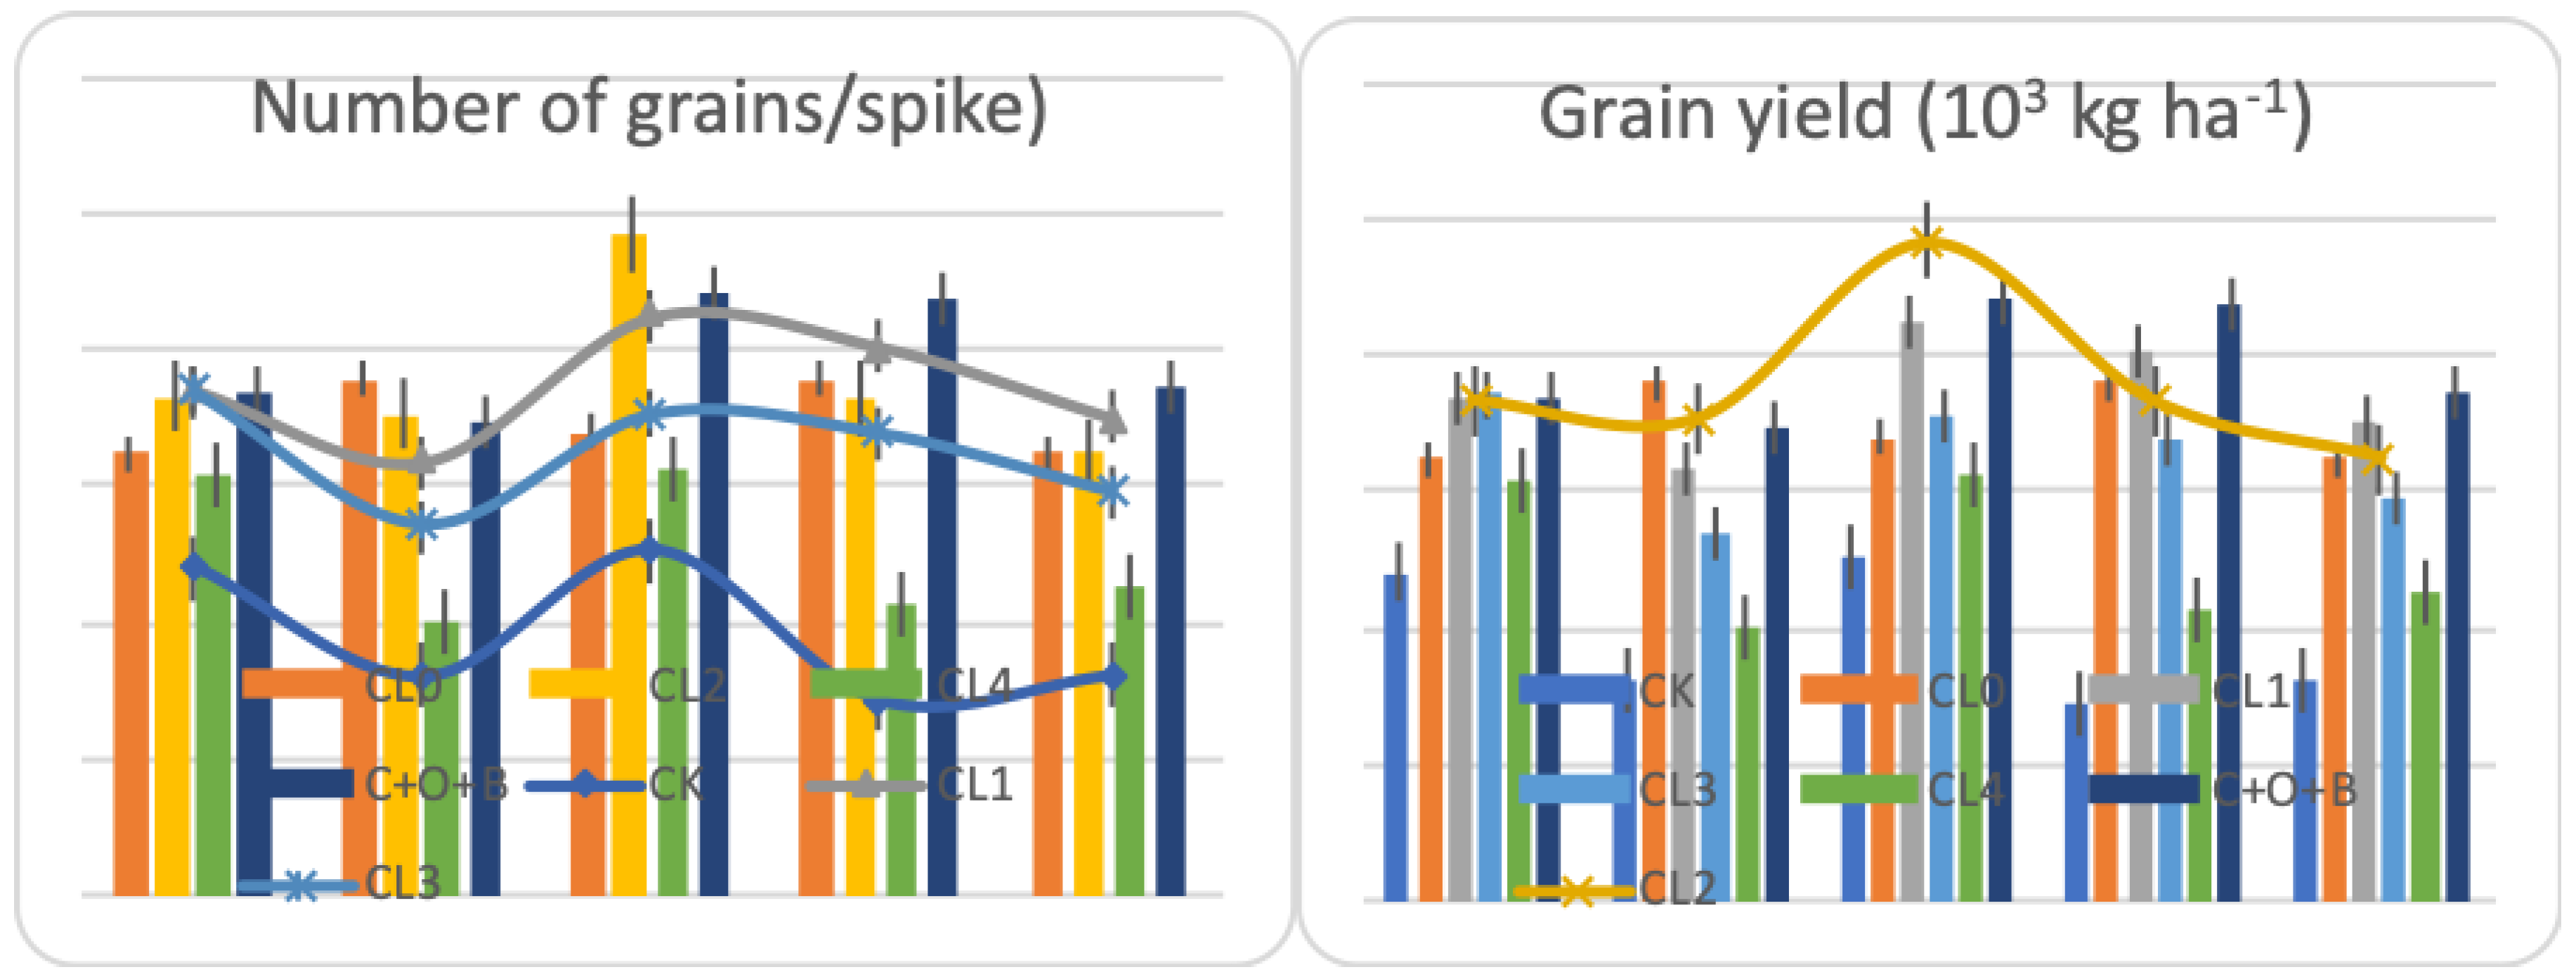
3.3. Effects of Biofertilizer on Yield Components

As for number of grain per spike, the highest values were obtained in C+O+B and CL0 in the first two growing seasons and in C+O+B, CL1, and CL2 in later three growing seasons, and the lowest number was found in CK in all the five growing seasons with 24.7–41.0% lower in average than those in the rest of the treatments in the five growing seasons, respectively. Pertaining to 1000-grain weight, significant differences were found in the later four growing seasons. In the 2014/2015 growing season, significant lower 1000-grain weight was detected in CL1 and C+O+B and they were 7.0–12.3% and 3.0–12.8% less than those in the rest of treatments. The highest 1000-grain weight was found in CL3 in the 2015/2016 growing season and in CL1 and C+O+B in the 2016/2017 and 2017/2018 growing seasons, which were 2.4–16.1%, 4.1–27.6%, 6.8–30.9%, and then those in the rest of the treatments in the three growing seasons (Table 3), equally.
During the 2013–2018 growing seasons, the mean effective spike number and grain number per spike both ranked in a decreasing order with C+O+B>CL1>CL2>CL0>CL3>CL4>CK while the mean 1000-grain weight ranked in a decreasing order with CL1>C+O+B>CL3>CL2>CL0>CL4>CK. The mean effective spike number, grain number per spike, and 1000-grain weight in the fertilized treatments were 8.3–47.75%, 16.9–60.6%, and 2.2–9.3% higher than that in CK and those in combined chemical fertilizers (NPK) and organic manure treatments were 4.4–36.3%, 16.4–37.4%, and 1.7–6.9% greater than that in the organic manure and biofertilizers amendments alone treatment (CL4). Our five-year field experiment results are varied with the two year field experiment of [34] who reported the effects of full-straw incorporation on soil fertility richness, and crop yield in a rice-wheat (Oryza sativa L.–Triticum aestivum L.) under rotation system on sandy, loamy soil.

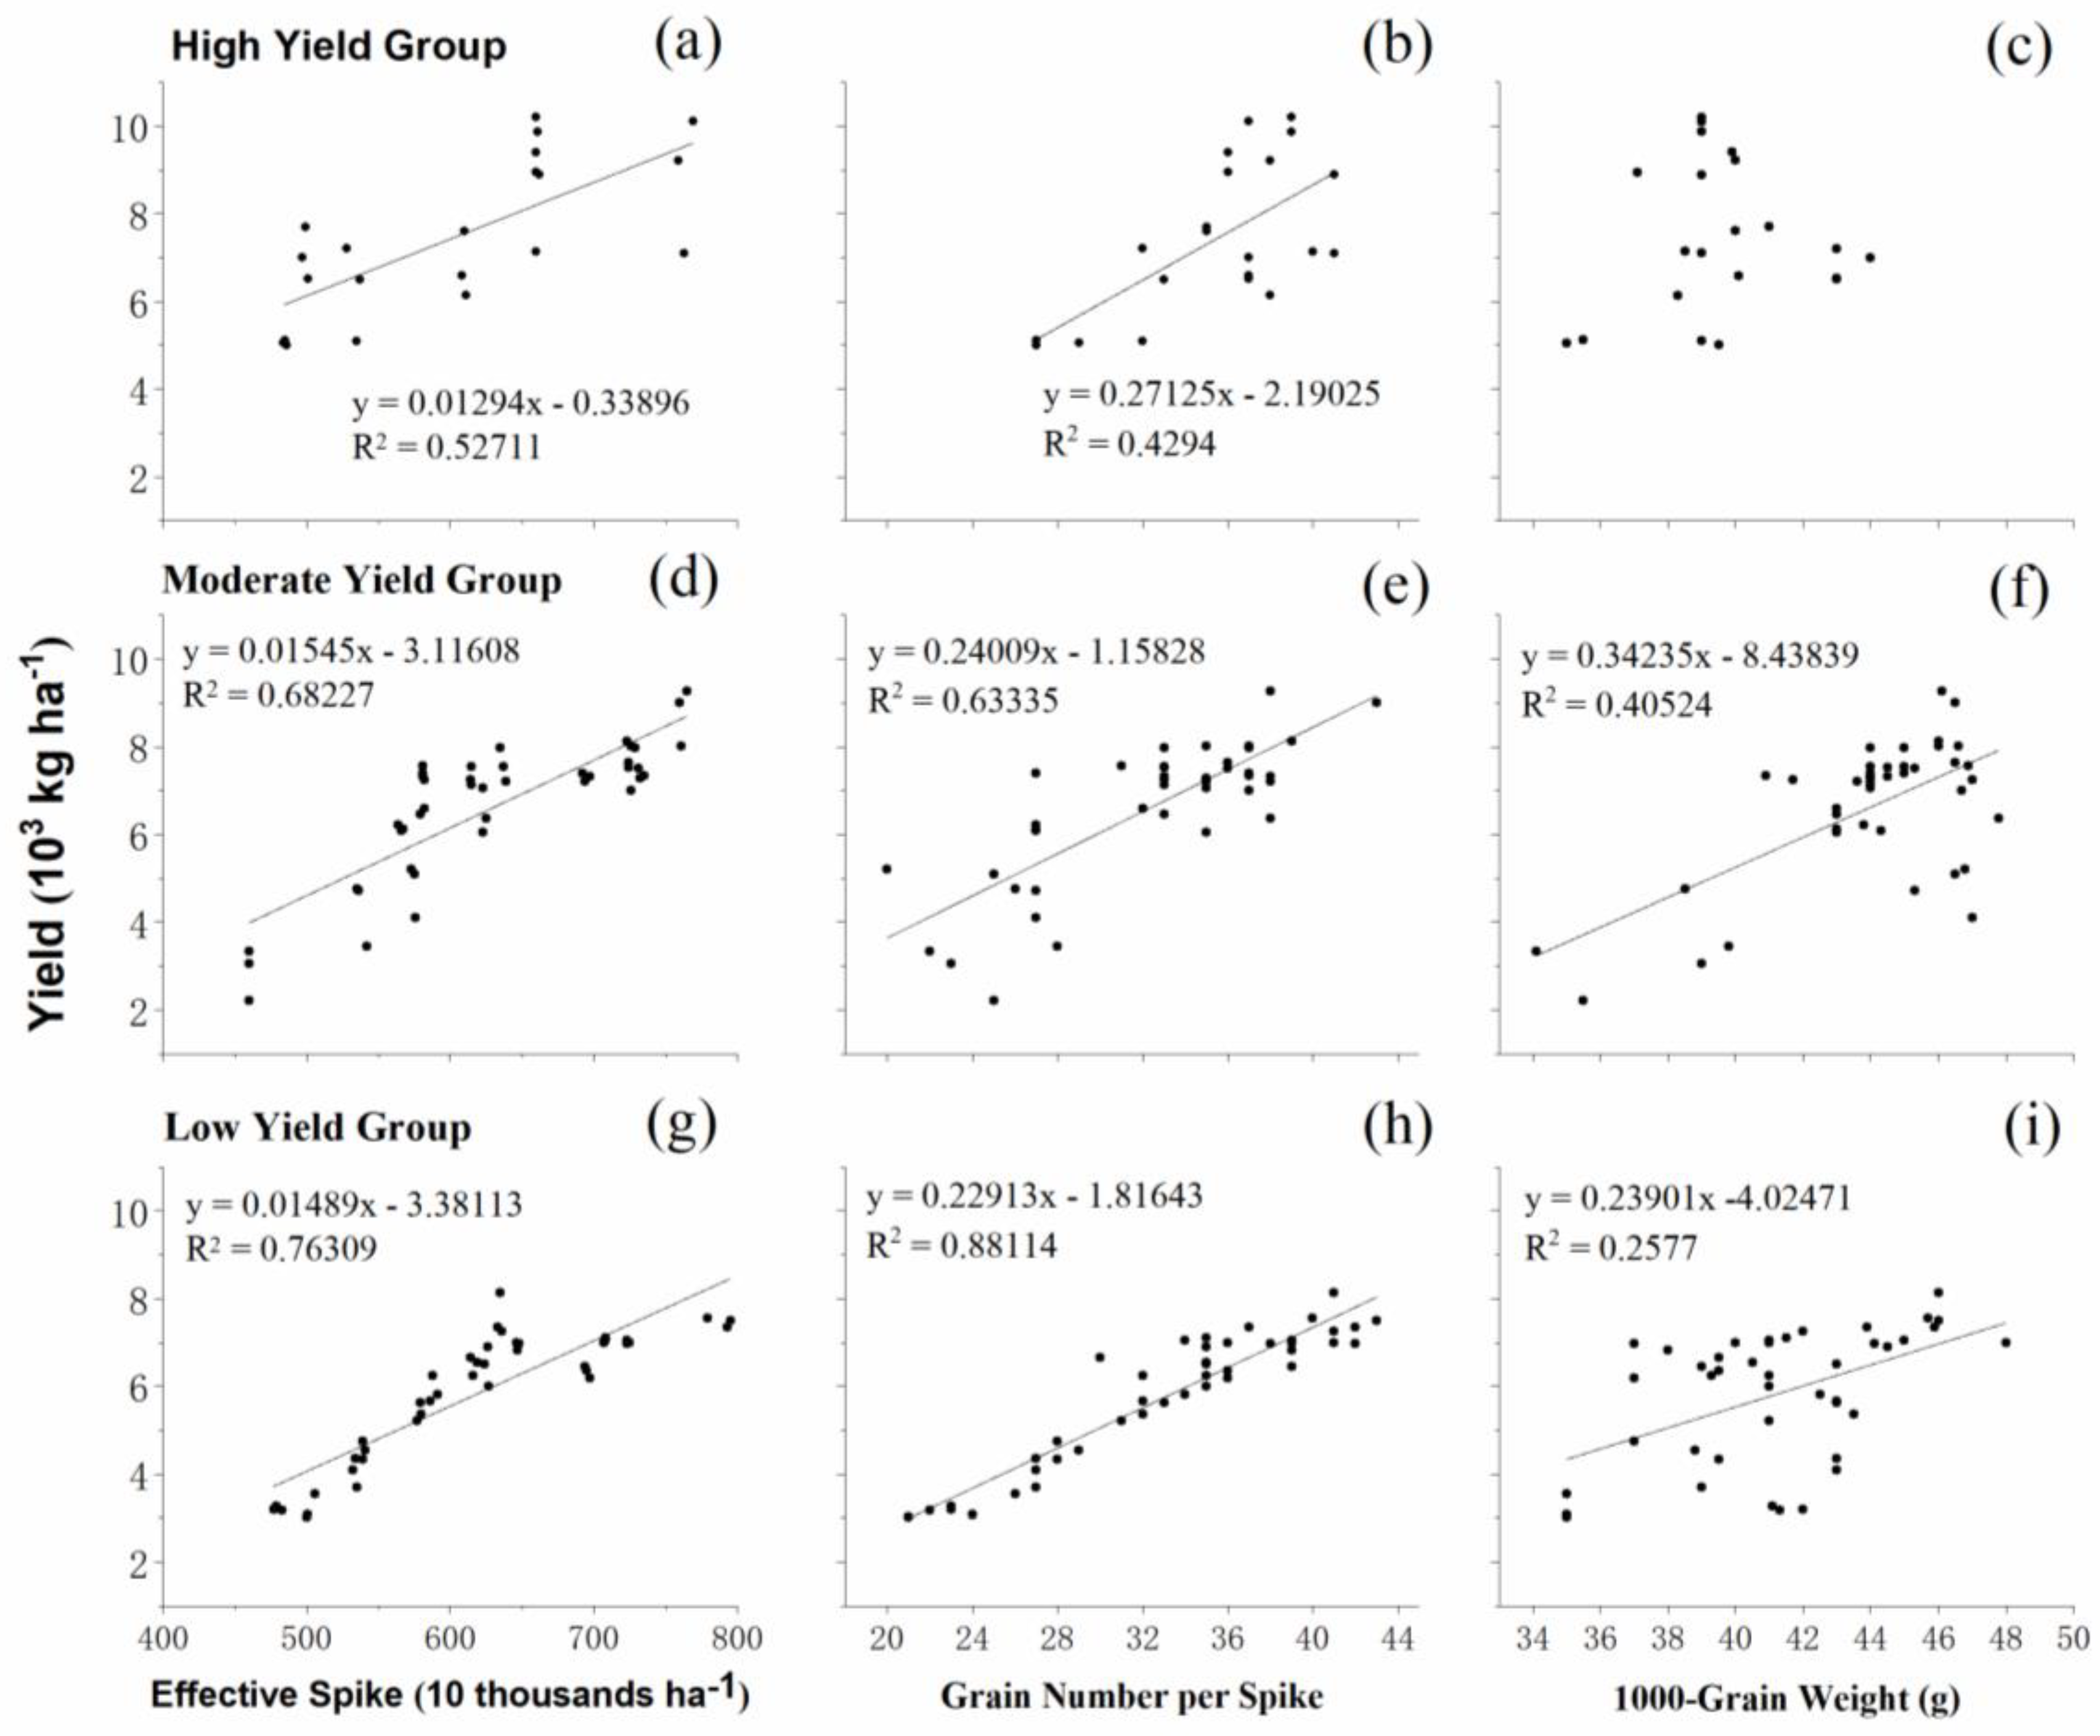
3.4. Correlations among Grain Yield and Other Components

Among the five growing seasons, the grain yield can be divided into three groups: (a) high yield growing season (>7 t ha−1, 2015/2016), (b) moderate yield growing seasons (6~7 t ha−1, 2013/2014 and 2016/2017), and (c) low yield growing seasons (5~6 t ha−1, 2014/2015 and 2017/2018), based on the mean grain yield of all the treatments. Regression analysis was performed to show the correlations between grain yield and yield components at the three grain yield levels (Figure 3). For the high yield growing season, grain yield correlated significantly with effective spike number and grain number per spike with determination coefficient (R2) values of 0.52711 and 0.4294, respectively. The grain yield correlated significantly with effective spike number, grain number per spike, and 1000-grain weight with R2 values of 0.68277, 0.63335, and 0.40524 and 0.76309, 0.88114, and 0.2577 in the moderate yield growing season, while R2 values of 0.76309, 0.88114, and 0.2577 were respectively obtained in the low yield growing season. The slope between grain yield and grain number per spike in the high yield growing season (0.27125) was higher than those in the moderate and low yield growing seasons (0.24009 and 0.22913), while the slope between grain yield and effective spike number showed an opposite result. The 1000-grain weight and slope between grain yield and 1000-grain weight in the moderate yield growing seasons were much higher than those in the low yield growing seasons. These results demonstrated that the effective spike number dominated in yield formation in the high yield growing season while the 1000-grain weight was a very important yield development factor in the moderate and low yield growing seasons, respectively.
The cumulative data analysis of yield parameters of winter wheat in China North Plain study sites showed significant effects of long-term incorporation of biofertilizers and organic manure in soil which enhances the soil properties; enrich nutrients and soil fertility levels (Figure 4, Appendix A). The contrasting impact of biofertilizers into soil also promote the plant growth and booted the vegetative growth, which ensure effective number of spikes, significant increase in grain weight and grain yield 103 kg ha−1. The applications of 30 m3 ha−1 pig FYM and 20 kg ha−1 biofertilizers might reduce at least 50% of the NPK application without reducing wheat grain yields in the North China Plain. Therefore, the applications of biofertilizers and FYM are advantageous for soil NO3-N content balance in the soil (Appendix A). These outcomes (Figure 3, Figure 4, and Appendix A) showed a greater potential for utilization of biofertilizers and farm-yard-manure to improve the grain yield while decrease the input cost of farm practices.

4. Discussion

Contrasting impacts of long-term application of organic manure and crop residual straw nitrate-N along with the soil profile in the NCP, amendments significantly increased the plant’s growth and development leads to economic yields as The finding was supported by [14,34]. Five years of research work investigated response of grain yield and yield components of wheat to organic manure and biofertilizers amendments combined with different application rates of chemical fertilizers. Treatment C+O+B generated the highest grain yields apart from the 2014/2015 growing season and the highest and lowest mean grain yields were observed in C+O+B and CK, respectively, during the whole growing seasons. In accordance with findings, (Abbasi and Yousra, 2012 [35]) found high wheat grain yield in the treatment that received organic manure, biofertilizers, and inorganic fertilizers and [14,24,36] observed higher maize grain yield in the organics, biofertilizers, and recommended dose of NPK treatment during the experiment period.
The grain yields in the treatments that received up to 50% reduction of chemical fertilizers (CL0, CL1, and CL2) were 6.8–12.4% higher, and those in treatments with 25% and 0% recommending dose of chemical fertilizers (CL3 and CL4) in the study area, even the same dose of organic manure and biofertilizers, were much less than that in the chemical fertilizers application alone treatment during the growing seasons, respectively. Our results indicate that organic manure and biofertilizers amendments could substitute about half of the recommended chemical fertilizers in winter wheat production without decreasing grain yield, and this was supported with other findings [24,27]. These results (Figure 4) were in accordance with previous studies about the effects of organic manure and biofertilizers application on cotton and wheat yields [25,37,38]. The increases in grain yield of low chemical fertilizers substitute rates treatments might be due to the positive effects of organic manure and biofertilizers on wheat plants. As previously reported, organic manure amendment had the advantages of slowly releasing nutrients and preventing losses due to leaching [39,40] while biofertilizers could produce vitamins and substances that were beneficial to root development [32,41], which can promote wheat plants to absorb more nutrients.
The effects of organic manure and biofertilizers amendments on grain yield and 1000-grain weight varied in different studies. Research [31,42] reported that the grain yield and 1000-grain weight of maize received a half dose of N (102.75 Kg ha−1 ) fertilizer and biofertilizers were 13% and 10% greater than that in treatment with a full dose of N fertilizer (175 kg N ha−1), respectively. On the contrary, two studies revealed that biofertilizers and half dose of N fertilizer produced 25% and 17% less in grain yield and 1000-grain weight compared with that received a full dose of N fertilizer [26,38]. In this study, half dose chemical fertilizers (102.5 kg N ha−1, 86.25 kg P2O5 ha−1, and 56.25 kg K2O ha−1) combined with organic manure and biofertilizers amendments produced 7.0% to 42.5% excessive in grain yield compared with full dose chemical fertilizers and less difference was detected in 1000-grain weight between these treatments among the five growing seasons except for 2017/2018, respectively. The treatment CL0 which was composed of only the mineral fertilizer (NPK) provided more grain per spike with an average of 36.0 compared to CL2 of 33.6 which is constituted by a proportional mixture of the mineral fertilizer (NPK) 50% + manure organic + biofertilizer. This was explained by the slow and gradual release of the elements contained in the dose CL2 compared to CL0 the findings supported by the results of [20,26].
Solar radiation, accumulated temperature, and precipitation were the major important meteorological factors that caused wheat grain yield changes from year to year [14,30,43,44,45]. Hence, it could be explained by the meteorological conditions and potential grain yields in different growing seasons. On the other hand, number of spikes, grain numbers per spike, and 1000-grain weight were three yield component factors resulted in yield formation and, generally, grain number per spike was strongly source-limited and 1000-grain weight was limited by its particular sink-strength, respectively [2,46,47]. The long-term observations resulted that, CL1-CL4 contains more nutrients (N, P2O5, and K2O) than CL0 under the same weather conditions. CL0 has the ability to provide instant nutrients essential for plant growth more quickly as compared with organic manure, FYM, and biofertilizers supported by the studies of [33,40,48]. In this study, the grain yield showed great variations in different growing seasons, and it can be divided into three yield levels based on the mean grain yield of all the treatments. Garcia et al. [49] reported that grain yield under warmer conditions was mostly determined by grain number per spike, whereas 1000-grain weight dominantly affected grain production in the colder environments. Contrary to these findings, long-term results indicated that grain number per spike was the main factor that affected grain yield in lower mean temperature growing season while 1000-grain weight was the main factor that influenced grain yield in growing seasons with higher mean temperature, respectively. The reason might be that water was the first limiting factor determining the grain yield formation and could affect the contributions of yield components to yield [50,51,52].

5. Conclusions

In conclusion, these results indicated that the grain yields in C+O+B, CL1, and CL2 were comparable to CL0 during all the growing seasons except for 2014/2015. The results revealed that application of 30 m3 ha−1 pig FYM and 20 kg ha−1 biofertilizers possibly reduce at least 50% of the NPK application without dropping wheat grain yields in the North China Plain. Therefore, we concluded that biofertilizers and FYM applications are advantageous for soil NO3-N content balance. These results (Figure 3, Figure 4, and Appendix A) indicated a more significant potential for utilization of biofertilizers and FYM to improve the grain yield while decrease total input cost to ensure sustainable agriculture farming. The number of wheat grains per spike played very important role in total yield formation at the high yield growing season and 1000-grains weight contributed greatly to yield formation at the moderate and low yield growing seasons, respectively. The five-year contrasting field experiment demonstrated that 30 m3 ha−1 organic manure and 20 kg ha−1 biofertilizers amendments could reduce at least 50% of the recommended dose of chemical fertilizers that is typically applied for winter wheat production without affecting the grain yields in the North China Plain. This long-term research results recommend that, the application of 30 m3 ha−1 pig farm-yard-manure and 20 kg ha−1 biofertilizers will reduce at least 50% of the NPK application without dropping grain yields in North China Plain soils. While this study recommends that 30 m3 ha−1 pig farm-yard-manure and 20 kg ha−1 biofertilizers will reduce at least 50% of the NPK application without dropping grain yields in North China Plain soils, it was the only rate of pig farm-yard-manure and biofertilizer tested in this study. These rates provided additional amounts of nutrients (N, P2O5, and K2O) which are actually higher than those in the CL0 treatment (Table 2). Therefore, future research should test other FYM (probably lower rates) and biofertilizer application rates.

Author Contributions

Conceptualization, A.C., and Y.H., methodology and investigation, A.C., X.W., F.Y., A.A., data organization and formal analysis, A.A.; writing the original draft preparation, A.C., A.A.; writing, review and editing, A.A., F.Y., A.C.; supervision by Y.H. All authors read and approved the final version of this manuscript for further development with no objections in research data, analysis and funding to support this project.

Funding

CSC provided financial supported to the first author during the five-year experiment to support his PhD research work and other expenses.

Acknowledgments

We would like to thank the workers in the Wuqiao Experimental Station of China Agricultural University for their help in field managements. We are also very thankful to CSC-2013/19 for their support during the research work.

Conflicts of Interest

All authors read and approved the manuscript and declare no conflict of interest.

Appendix A

Table A1. Analysis of soil chemical properties after harvesting of winter wheat in North China Plain (NCP) experimental site during years 2017/2018, soil pH, Soil total nitrogen, NH4+-N, and NO3-N at different soil depths under different fertilizer treatments.
TreatmentSoil Total N
(g kg−1)
NH4+-N
(mg kg−1)
NO3-N
(mg kg−1)
Soil pH
10 cm20 cm40 cm10 cm20 cm40 cm 10cm (1:2.5 H2O)(1:2.5 KCl)(1:5CaCl2)
CK0.47 ± 0.01d0.73 ± 0.01e1.20 ± 0.01e0.23 ± 0.00g0.32 ± 0.00f0.19 ± 0.01f0.32 ± 0.00g7.4 ± 0.14a6.8 ± 0.17a6.9 ± 0.22a
CL00.84 ± 0.03ab1.35 ± 0.00bc2.48 ± 0.02ab1.01 ± 0.00e1.12 ± 0.00d0.67 ± 0.01a6.12 ± 0.08e6.9 ± 0.07a6.3 ± 0.12b6.4 ± 0.23b
CL10.87 ± 0.06ab1.39 ± 0.02ab2.65 ± 0.02a1.53 ± 0.01b1.56 ± 0.03b0.50 ± 0.01b9.02 ± 0.03b6.8 ± 0.08a6.4 ± 0.13b6.3 ± 0.22b
CL20.85 ± 0.01ab1.37 ± 0.02abc2.35 ± 0.01bc1.44 ± 0.01c1.31 ± 0.02c0.45 ± 0.00c7.76 ± 0.12c7.1 ± 0.15a6.8 ± 0.23a6.9 ± 0.12a
CL30.77 ± 0.01bc1.33 ± 0.02c2.25 ± 0.01c1.34 ± 0.01d1.10 ± 0.02d0.39 ± 0.00d7.18 ± 0.06d7.5 ± 0.14a6.9 ± 0.23a7.1 ± 0.11a
CL40.70 ± 0.00c1.23 ± 0.00d1.70 ± 0.14d0.67 ± 0.01f0.76 ± 0.02e0.29 ± 0.01e5.09 ± 0.05f7.7 ± 0.18a7.1 ± 0.12a7 ± 0.12a
C+O+B0.88 ± 0.03a1.41 ± 0.01a2.64 ± 0.03a1.82 ± 0.02a2.02 ± 0.02a0.68 ± 0.00a9.99 ± 0.02a7.4 ± 0.07a7 ± 0.12a7.2 ± 0.12a
In each column lower case lettering is used to show the significant differences between different types of treatments at P < 0.05 level. Values show Standard errors (SE) ± mean of four replicates. CK, without fertilization control; CL0, 100% synthetic fertilizers NPK; CL1, 75% synthetic fertilizers NPK + organic manure + biofertilizer; CL2, 50% synthetic fertilizers NPK + organic manure + biofertilizer; CL3, 25% synthetic fertilizers NPK + organic manure + biofertilizer; CL4, organic manure + biofertilizer; and C+O+B, 100% synthetic fertilizers NPK + organic manure + biofertilizer.

References

  1. Reynolds, M.; Bonnett, D.; Chapman, S.C.; Furbank, R.T.; Manés, Y.; Mather, D.E.; Parry, M.A.J. Raising yield potential of wheat. I. Overview of a consortium approach and breeding strategies. J. Exp. Bot. 2011, 62, 439–452. [Google Scholar] [CrossRef] [PubMed]
  2. Goriewa-Duba, K.; Duba, A.; Wachowska, U.; Wiwart, M. An Evaluation of the Variation in the Morphometric Parameters of Grain of Six Triticum Species with the Use of Digital Image Analysis. Agronomy 2018, 8, 296. [Google Scholar] [CrossRef]
  3. Xiao, G.; Zhao, Z.; Liang, L.; Meng, F.; Wu, W.; Guo, Y. Improving nitrogen and water use efficiency in a wheat-maize rotation system in the North China Plain using optimized farming practices. Agric. Water Manag. 2019, 212, 172–180. [Google Scholar] [CrossRef]
  4. Gumma, M.K.; Thenkabail, P.S.; Teluguntla, P.; Oliphant, A.; Xiong, J.; Congalton, R.G.; Yadav, K.; Smith, C. NASA Making Earth System Data Records for Use in Research Environments (MEaSUREs) Global Food Security-Support Analysis Data (GFSAD) Cropland Extent 2015 Validation Global 30 m V001; NASA EOSDIS Land Process DAAC: Sioux Falls, SD, USA, 2017.
  5. Ju, X.-T.; Xing, G.-X.; Chen, X.-P.; Zhang, S.-L.; Zhang, L.-J.; Liu, X.-J.; Cui, Z.-L.; Yin, B.; Christie, P.; Zhu, Z.-L.; et al. Reducing environmental risk by improving N management in intensive Chinese agricultural systems. Proc. Natl. Acad. Sci. USA 2009, 106, 3041–3046. [Google Scholar] [CrossRef] [PubMed] [Green Version]
  6. Cui, F.; Yan, G.; Zhou, Z.; Zheng, X.; Deng, J. Annual emissions of nitrous oxide and nitric oxide from a wheat-maize cropping system on a silt loam calcareous soil in the North China Plain. Soil Biol. Biochem. 2012, 48, 10–19. [Google Scholar] [CrossRef]
  7. Niu, J.; Zhang, W.; Ru, S.; Chen, X.; Xiao, K.; Zhang, X.; Assaraf, M.; Imas, P.; Magen, H.; Zhang, F.; et al. Effects of potassium fertilization on winter wheat under different production practices in the North China Plain. Field Crops Res. 2013, 140, 69–76. [Google Scholar] [CrossRef]
  8. Hartmann, T.E.; Yue, S.; Schulz, R.; He, X.; Chen, X.; Zhang, F.; Müller, T. Yield and N use efficiency of a maize-wheat cropping system as affected by different fertilizer management strategies in a farmer’s field of the North China Plain. Field Crops Res. 2015, 174, 30–39. [Google Scholar] [CrossRef]
  9. Oroian, C.F.; Safirescu, C.O.; Harun, R.; Chiciudean, G.O.; Arion, F.H.; Muresan, I.C.; Bordeanu, B.M. Consumers’ attitudes towards organic products and sustainable development: A case study of Romania. Sustainability 2017, 9, 1559. [Google Scholar] [CrossRef]
  10. Susha, V.S.; Das, T.K.; Nath, C.P.; Pandey, R.; Paul, S.; Ghosh, S. Impacts of tillage and herbicide mixture on weed interference, agronomic productivity and profitability of a maize—Wheat system in the North-western Indo-Gangetic Plains. Field Crops Res. 2018, 219, 180–191. [Google Scholar] [CrossRef]
  11. Broberg, M.; Högy, P.; Pleijel, H. CO2-Induced Changes in Wheat Grain Composition: Meta-Analysis and Response Functions. Agronomy 2017, 7, 32. [Google Scholar] [CrossRef]
  12. Mon, J.; Bronson, K.F.; Hunsaker, D.J.; Thorp, K.R.; White, J.W.; French, A.N. Interactive effects of nitrogen fertilization and irrigation on grain yield, canopy temperature, and nitrogen use efficiency in overhead sprinkler-irrigated durum wheat. Field Crops Res. 2016, 191, 54–65. [Google Scholar] [CrossRef]
  13. Zhang, W.; Yu, Y.; Li, T.; Sun, W.; Huang, Y. Net greenhouse gas balance in China’s croplands over the last three decades and its mitigation potential. Environ. Sci. Technol. 2014, 48, 2589–2597. [Google Scholar] [CrossRef] [PubMed]
  14. Gai, X.; Liu, H.; Liu, J.; Zhai, L.; Wang, H.; Yang, B.; Ren, T.; Wu, S.; Lei, Q. Contrasting impacts of long-term application of manure and crop straw on residual nitrate-N along the soil profile in the North China Plain. Sci. Total Environ. 2019, 650, 2251–2259. [Google Scholar] [CrossRef] [PubMed]
  15. Wang, Q.; Li, F.; Zhao, L.; Zhang, E.; Shi, S.; Zhao, W.; Song, W.; Vance, M.M. Effects of irrigation and nitrogen application rates on nitrate nitrogen distribution and fertilizer nitrogen loss, wheat yield and nitrogen uptake on a recently reclaimed sandy farmland. Plant Soil 2010, 337, 325–339. [Google Scholar] [CrossRef]
  16. Ashraf, A.; Ristina, S.S.; Asad, M.; Hasan, M.; Qamar, H.; Mudassar, M.; Raza, M.; Anum, W.; Abbasi, W.; Arshad, A.; et al. Variability and Correlation Study of Different Newly Developed Sunflower Hybrids in Pakistan. Int. J. Biosci. 2019, 14, 398–408. [Google Scholar]
  17. Tan, Y.; Xu, C.; Liu, D.; Wu, W.; Lal, R.; Meng, F. Effects of optimized N fertilization on greenhouse gas emission and crop production in the North China Plain. Field Crops Res. 2017, 205, 135–146. [Google Scholar] [CrossRef]
  18. Liu, E.; Yan, C.; Mei, X.; He, W.; Bing, S.H.; Ding, L.; Liu, Q.; Liu, S.; Fan, T. Long-term effect of chemical fertilizer, straw, and manure on soil chemical and biological properties in northwest China. Geoderma 2010, 158, 173–180. [Google Scholar] [CrossRef]
  19. Yang, J.; Jiang, F.; Ma, C.; Rui, Y.; Rui, M.; Adeel, M.; Cao, W.; Xing, B. Alteration of Crop Yield and Quality of Wheat upon Exposure to Silver Nanoparticles in a Life Cycle Study. J. Agric. Food Chem. 2018, 66, 2589–2597. [Google Scholar] [CrossRef]
  20. Uribe, D.; Sánchez-Nieves, J.; Vanegas, J. Role of Microbial Biofertilizers in the Development of a Sustainable Agriculture in the Tropics. In Soil Biology and Agriculture in the Tropics; Springer: Berlin, Germany, 2010. [Google Scholar]
  21. Liang, Q.; Chen, H.; Gong, Y.; Yang, H.; Fan, M.; Kuzyakov, Y. Effects of 15 years of manure and mineral fertilizers on enzyme activities in particle-size fractions in a North China Plain soil. Eur. J. Soil Biol. 2014, 60, 112–119. [Google Scholar] [CrossRef]
  22. Asad, M.; Mahmood, Z.; Rasheed, M.R.A.M. Efficacy of some selective herbicides against broad leaved weeds of wheat crop grown under moisture deficit conditions of Pakistan. Turk. J. Weed Sci. 2017, 20, 38–45. [Google Scholar]
  23. Majumder, B.; Mandal, B.; Bandyopadhyay, P.K.; Gangopadhyay, A.; Mani, P.K.; Kundu, A.L.; Mazumdar, D. Organic Amendments Influence Soil Organic Carbon Pools and Rice–Wheat Productivity. Soil Sci. Soc. Am. J. 2008, 72, 775–785. [Google Scholar] [CrossRef]
  24. Umesha, S.; Divya, M.; Prasanna, K.; Lakshmipathi, R.; Sreeramulu, K. Comparative Effect of or ganics and Biofertilizers on Growth and Yield of Maize (Zea mays. L). Curr. Agric. Res. J. 2014. [Google Scholar] [CrossRef]
  25. Arif, M.; Ilyas, M.; Riaz, M.; Ali, K.; Shah, K.; Haq, I.U.; Fahad, S. Biochar improves phosphorus use efficiency of organic-inorganic fertilizers, maize-wheat productivity and soil quality in a low fertility alkaline soil. Field Crops Res. 2017, 214, 25–37. [Google Scholar] [CrossRef]
  26. Abbasi, M.K.; Yousra, M. Synergistic effects of biofertilizer with organic and chemical N sources in improving soil nutrient status and increasing growth and yield of wheat grown under greenhouse conditions. Plant Biosyst. 2012, 146, 181–189. [Google Scholar] [CrossRef]
  27. Htwe, A.Z.; Moh, S.M.; Soe, K.M.; Moe, K.; Yamakawa, T. Effects of Biofertilizer Produced from Bradyrhizobium and Streptomyces griseoflavus on Plant Growth, Nodulation, Nitrogen Fixation, Nutrient Uptake, and Seed Yield of Mung Bean, Cowpea, and Soybean. Agronomy 2019, 9, 77. [Google Scholar] [CrossRef]
  28. Tejada, M.; Rodríguez-Morgado, B.; Gómez, I.; Franco-Andreu, L.; Benítez, C.; Parrado, J. Use of biofertilizers obtained from sewage sludges on maize yield. Eur. J. Agron. 2016, 78, 13–19. [Google Scholar] [CrossRef]
  29. Gupta, T.C.; Aggarwal, S.K. Performance of wheat (Triticum aestivum) to incorporation of organic manure and bioinoculants. Arch. Agron. Soil Sci. 2008, 54, 615–627. [Google Scholar] [CrossRef]
  30. Sharma, S.; Padbhushan, R.; Kumar, U. Integrated Nutrient Management in Rice–Wheat Cropping System: An Evidence on Sustainability in the Indian Subcontinent through Meta-Analysis. Agronomy 2019, 9, 71. [Google Scholar] [CrossRef]
  31. Santillano-Cázares, J.; Núñez-Ramírez, F.; Ruíz-Alvarado, C.; Cárdenas-Castañeda, M.E.; Ortiz-Monasterio, I. Assessment of Fertilizer Management Strategies Aiming to Increase Nitrogen Use Efficiency of Wheat. Agronomy 2018, 8, 304. [Google Scholar] [CrossRef]
  32. Simansky, V.; Horak, J.; Juriga, M.; Srank, D. Soil structure and soil organic matter in water-stable aggregates under different application rates of biochar. Vietnam J. Earth Sci. 2018, 59. [Google Scholar] [CrossRef]
  33. Arshad, A.; Lizhen, L.; Yue, Z.; Hong, J.; Tina, R.; Asad, M.; Ran, W. Significance of Pak-China Weather Forecasting and Climate Modeling to Sustainable Agriculture. In Proceedings of the HIWeather Chinese Academy of Meteorological Sciences, Beijing, China, 20–22 November 2018. [Google Scholar]
  34. Zhao, X.; Yuan, G.; Wang, H.; Lu, D.; Chen, X.; Zhou, J. Effects of Full Straw Incorporation on Soil Fertility and Crop Yield in Rice-Wheat Rotation for Silty Clay Loamy Cropland. Agronomy 2019, 9, 133. [Google Scholar] [CrossRef]
  35. Asad, M.; Zahid, M.; Mudassar, M.; Arshad, A.; Raza, W.A.U. Bio-economic assessment of non-chemical weed management strategies in minor crops: A review on Weed research issues, challenges, and opportunities in Pakistan. J. Res. Weed Sci. 2019, 2, 127–140. [Google Scholar]
  36. Haefele, S.M.; Jabbar, S.M.A.; Siopongco, J.D.L.C.; Tirol-Padre, A.; Amarante, S.T.; Sta Cruz, P.C.; Cosico, W.C. Nitrogen use efficiency in selected rice (Oryza sativa L.) genotypes under different water regimes and nitrogen levels. Field Crops Res. 2008, 107, 137–146. [Google Scholar] [CrossRef]
  37. Hawes, C.; Alexander, C.; Begg, G.; Iannetta, P.; Karley, A.; Squire, G.; Young, M. Plant Responses to an Integrated Cropping System Designed to Maintain Yield Whilst Enhancing Soil Properties and Biodiversity. Agronomy 2018, 8, 229. [Google Scholar] [CrossRef]
  38. Akhtar, M.F.U.Z.; Jamil, M.; Ahamd, M.; Abbasi, G.H. Evaluation of biofertilizer in combination with organic amendments and rock phosphate enriched compost for improving productivity of chickpea and maize. Soil Environ. 2017, 36, 59–69. [Google Scholar]
  39. Arshad, M.; Khalid, A.; Mahmood, M.H.; Zahir, Z.A. Potential of Nitrogen and L-tryptophan Enriched Compost for Improving Growth and Yield of Hybrid Maize. Pak. J. Agric. Sci. 2004, 41, 16–24. [Google Scholar]
  40. Ahmad, R.; Shahzad, S.M.; Khalid, A.; Arshad, M.; Mahmood, M.H. Growth and yield response of wheat (Triticum aestivum L.) and maize (Zea mays L.) to nitrogen and L-tryptophan enriched compost. Pak. J. Bot. 2007, 39, 541–549. [Google Scholar]
  41. Pennacchi, J.; Carmo-Silva, E.; Andralojc, P.; Feuerhelm, D.; Powers, S.; Parry, M. Dissecting Wheat Grain Yield Drivers in a Mapping Population in the UK. Agronomy 2018, 8, 15. [Google Scholar] [CrossRef]
  42. Naveed, M.; Khalid, M.; Jones, D.L.; Ahmad, R.; Zahir, Z.A. Relative efficacy of pseudomonas spp., containing acc-deaminase for improving growth and yield of maize (zea mays l.) in the presence of organic fertilizer. Pak. J. Bot. 2008, 40, 1243–1251. [Google Scholar]
  43. Yang, X.; Asseng, S.; Wong, M.T.F.; Yu, Q.; Li, J.; Liu, E. Quantifying the interactive impacts of global dimming and warming on wheat yield and water use in China. Agric. For. Meteorol. 2013, 182–183, 342–351. [Google Scholar] [CrossRef]
  44. Yu, Q.; Li, L.; Luo, Q.; Eamus, D.; Xu, S.; Chen, C.; Wang, E.; Liu, J.; Nielsen, D.C. Year patterns of climate impact on wheat yields. Int. J. Climatol. 2014, 34, 518–552. [Google Scholar] [CrossRef]
  45. Mueller, N.D.; Gerber, J.S.; Johnston, M.; Ray, D.K.; Ramankutty, N.; Foley, J.A. Closing yield gaps through nutrient and water management. Nature 2012, 490, 254–257. [Google Scholar] [CrossRef] [PubMed]
  46. Ren, J.; Chen, Z.; Zhou, Q.; Tang, H. Regional yield estimation for winter wheat with MODIS-NDVI data in Shandong, China. Int. J. Appl. Earth Obs. Geoinf. 2008, 10, 403–413. [Google Scholar] [CrossRef]
  47. Stockmann, F.; Weber, E.; Mast, B.; Schreiter, P.; Merkt, N.; Claupein, W.; Graeff-Hönninger, S. Evaluation of Asparagine Concentration as an Indicator of the Acrylamide Formation in Cereals Grown under Organic Farming Conditions. Agronomy 2018, 8, 294. [Google Scholar] [CrossRef]
  48. Arshad, A.; Yousaf, K.; Hua, Q.; Ming, L.; Zhang, W.; Mateen, A.M.-U.-H. Impact of climate change on apple and mango production in China and Pakistan. In Proceedings of the Technical Session Proceedings’ of International Horticulture Conference, Paris, France, 4–5 November 2019; p. 121. [Google Scholar]
  49. García Del Moral, L.F.; Rharrabti, Y.; Villegas, D.; Royo, C. Evaluation of grain yield and its components in durum wheat under Mediterranean conditions: An ontogenic approach. Agron. J. 2003, 95, 266–274. [Google Scholar] [CrossRef]
  50. Weiler, C.; Merkt, N.; Hartung, J.; Graeff-Hönninger, S. Variability among Young Table Grape Cultivars in Response to Water Deficit and Water Use Efficiency. Agronomy 2019, 9, 135. [Google Scholar] [CrossRef]
  51. Arshad, A.; Hua, Q.; Ristina, S.S.; Zubair, M.; Asad, M. Impact Assessment and Model Simulation to Urban Extreme Weather Vulnerabilities to Advance Climate Adaptation; EGU General Assembly Vienna-Austria: Vienna, Austria, 2019; Volume 21. [Google Scholar]
  52. Khan, T.A.; Nadeem, F.; Chen, L.; Wang, X.; Zeng, Z.; Hu, Y. Enhancing naked oat (Avena nuda L.) productivity with minimal indirect nitrogen loss and maximum nitrogen use efficiency through integrated use of different nitrogen sources. PloS ONE 2019, 14, e0213808. [Google Scholar] [CrossRef] [PubMed]
Figure 1. Agrometeorological status of daily precipitation, daily mean air temperature of Wuqiao Experimental Station during the 2013–2018 winter wheat growing period in Cangzhou, Hebei, China.
Agronomy 09 00312 g001
Figure 2. Grain yield of fertilization treatments (CK, CL0, CL1, CL2, CL3, CL4, and C+O+B) during the winter wheat production years 2013–2018 at the China North Plain.
Agronomy 09 00312 g002
Figure 3. Regression correlations of yield (103 kg ha−1) grain yield, effective spikes, 1000-seed weight at the high (ac), moderate (df), and low (gi) grain yield groups during the cropping years of 2013 to 2018 in China North Plain experiment sites.
Agronomy 09 00312 g003
Figure 4. Cumulative evaluation analysis of number of grains/spike and total grain yield (103 kg ha−1) of winter wheat in the North China Plain during the long-term research intervention 2013–2018 (data attached).
Agronomy 09 00312 g004
Table 1. Basic soil properties of the experimental site before the start of the experiment in 2013 winter wheat growing period in Cangzhou, Hebei, China North Plain.
Sand a (%)Silt a
(%)
Clay a
(%)
pHSOM
(g kg−1)
Total N
(g kg−1)
Olsen P
(mg kg−1)
Available K (mg kg−1)
88.3911.460.768.052.291.0220.3187.49
a The method of soil texture classification was defined as the following: sand, 0.05–2.0 mm; silt, 0.002–0.005 mm, clay, <0.002; SOM: soil organic matter.
Table 2. Application combinations with amount of biofertilizer, synthetic fertilizers (kg ha−1) applied to different concentrations rates during winter wheat growing seasons 2013–2018.
Treatment (~)Synthetic FertilizersOrganic ManureBiofertilizer
NP2O5K2ONP2O5K2O
CK-------
CL0205.5172.5112.5----
CL1154.1129.484.4226.2903.8125.120
CL2102.886.356.3226.2903.8125.120
CL351.443.128.1226.2903.8125.120
CL4---226.2903.8125.120
C+O+B205.5172.5112.5226.2903.8125.120
~(CK, without fertilization control; CL0, 100% synthetic fertilizers NPK; CL1, 75% synthetic fertilizers NPK + organic manure+biofertilizer; CL2, 50% synthetic fertilizers NPK + organic manure + biofertilizer; CL3, 25% synthetic fertilizers NPK + organic manure + biofertilizer; CL4, organic manure + biofertilizer; and C+O+B, 100% synthetic fertilizers NPK + organic manure + biofertilizer).
Table 3. Yield components of winter wheat yield parameters in different fertilization treatments during the 2013–2018 wheat growing seasons of China North Plain.
TreatmentEffective Spike
(10 thousands ha−1)
Grain Number (per Spike)1000-Grain
Weight (g)
Grain Yield
(103 kg ha−1)
2013/2014
CK574.67 ± 1.53 f24.00 ± 3.60 d46.77 ± 0.25 a4.80 ± 0.60 c
CL0623.67 ± 1.15c36.00 ± 1.73 a44.93 ± 2.53 a6.48 ± 0.51 b
CL1724.67 ± 1.15 b35.33 ± 2.08 a45.90 ± 1.22 a7.39 ± 0.33 a
CL2614.67 ± 0.58 d33.67 ± 1.15 ab45.33 ± 1.53 a7.31 ± 0.22 a
CL3581.33 ± 0.58 e30.33 ± 3.05 bc44.53 ± 2.63 a7.40 ± 0.16 a
CL4565.67 ± 1.53 g27.00 ± 0.00 cd43.70 ± 0.65 a6.14 ± 0.06 b
C+O+B732.67 ± 2.08 a36.00 ± 1.00 a43.40 ± 2.26 a7.37 ± 0.11 a
2014/2015
CK479.67 ± 3.05 g22.67 ± 0.6 f41.47 ± 0.47 a3.21 ± 0.04 f
CL0634.67 ± 1.53 d40.63 ± 0.58 a43.97 ± 2.00 a7.57 ± 0.48 a
CL1695.33 ± 1.53 b37.00 ± 1.73 b38.50 ± 1.32 b6.33 ± 0.13 c
CL2707.67 ± 0.58 a35.00 ± 1.00 c41.17 ± 0.29 a7.05 ± 0.05 b
CL3578.67 ± 1.53 e32.00 ± 1.00 d42.50 ± 1.32 a5.40 ± 0.21 d
CL4533.67 ± 1.53f27.00 ± 0.00 e41.7 ± 2.31 a4.04 ± 0.34e
C+O+B647.00 ± 1.00 c41.37 ± 1.53 a38.33 ± 1.53 b6.93 ± 0.09 b
2015/2016
CK485.00 ± 1.00 f27.63 ± 1.53 d36.70 ± 2.52 c5.05 ± 0.58 e
CL0609.70 ± 2.00 c36.67 ± 1.15 b39.46 ± 0.23 bc6.77 ± 0.38 cde
CL1660.00 ± 3.00 b37.37 ± 1.15 ab38.57 ± 0.81 c8.49 ± 0.08 abc
CL2661.03 ± 2.52 b39.67 ± 0.58 a39.00 ± 0.00 bc9.65 ± 0.10 a
CL3499.07 ± 1.53 e36.37 ± 0.58 b42.60 ± 0.87 a7.07 ± 0.47 bcd
CL4533.37 ± 3.78 d32.30 ± 1.00 c41.62 ± 3.61 ab6.26 ± 0.74 de
C+O+B763.70 ± 2.64 a38.67 ± 4.04 ab39.30 ± 0.26 bc8.80 ± 0.66 ab
2016/2017
CK460.00 ± 1.00 g23.33 ± 1.52 d36.20 ± 2.52 c2.86 ± 0.58 e
CL0637.00 ± 2.00 d33.67 ± 1.15 b43.87 ± 0.23 ab7.57 ± 0.39 bc
CL1726.00 ± 3.00 b37.67 ± 1.15 a45.87 ± 0.81 a8.04 ± 0.08 ab
CL2694.33 ± 2.52 c37.67 ± 0.58 a44.00 ± 0.00 ab7.30 ± 0.10 bc
CL3580.67 ± 1.53 e32.67 ± 0.58 b43.50 ± 0.87 ab6.78 ± 0.47c
CL4537.67 ± 3.78 f27.00 ± 1.00 c41.20 ± 3.60 b4.30 ± 0.74 d
C+O+B762.00 ± 5.03 a38.67 ± 4.04 a46.20 ± 0.26 a8.76 ± 0.67 a
2017/2018
CK502.33 ± 3.21 g23.67 ± 2.52 d35.00 ± 0.00 d3.22 ± 0.29 f
CL0616.33 ± 2.52 d32.33 ± 2.52 b39.77 ± 0.64 c6.48 ± 0.21 c
CL1723.67 ± 1.15 b38.67 ± 0.58 a45.70 ± 2.04 a7.00 ± 0.03 b
CL2625.67 ± 1.53 c35.00 ± 0.00 b42.83 ± 1.75 b6.46 ± 0.45 c
CL3588.33 ± 2.52 e33.67 ± 1.53 b42.17 ± 1.04 b5.91 ± 0.30 d
CL4539.67 ± 1.15 f28.33 ± 0.58 c38.43 ± 1.29 c4.54 ± 0.21 e
C+O+B789.00 ± 8.71 a40.00 ± 3.00 a45.87 ± 0.15 a7.47 ± 0.10 a
Significance of
Year (Y)***********
Fertilization (F)************
Y × F************
Values are mean ± SD (n = 3). CK, without fertilization control; CL0, 100% synthetic fertilizers NPK; CL1, 75% synthetic fertilizers NPK + organic manure + biofertilizer; CL2, 50% synthetic fertilizers NPK + organic manure + biofertilizer; CL3, 25% synthetic fertilizers NPK + organic manure + biofertilizer; CL4, organic manure + biofertilizer; and C+O+B, 100% synthetic fertilizers NPK + organic manure + biofertilizer. (**: P ˂ 0.01; ***: P ˂ 0.001) All SD values means are different superscript as mentioned in the table.

