Article

Morphological and Physiological Responses Induced by Protein Hydrolysate-Based Biostimulant and Nitrogen Rates in Greenhouse Spinach

1
Department of Environmental, Biological and Pharmaceutical Sciences and Technologies, University of Campania “Luigi Vanvitelli”, 81100 Caserta, Italy
2
Department of Agriculture and Forest Sciences, University of Tuscia, 01100 Viterbo, Italy
3
Department of Agricultural Sciences, University of Naples Federico II, 80055 Portici, Italy
4
Council for Agricultural Research and Economics (CREA)—Research Center for Cereal and Industrial Crops, 81100 Caserta, Italy
5
Italpollina USA Inc., Anderson, IN 46016, USA
6
Department of Vegetable Crops, Agricultural Research Institute, 1516 Nicosia, Cyprus
7
Consiglio per la Ricerca in Agricoltura e l’Analisi dell’Economia Agraria (CREA), Centro di Ricerca Orticoltura e Florovivaismo (CREA-OF), 84098 Pontecagnano Faiano, Italy
*
Authors to whom correspondence should be addressed.
Submission received: 23 July 2019 / Revised: 9 August 2019 / Accepted: 12 August 2019 / Published: 14 August 2019
(This article belongs to the Special Issue Nitrogen Fertilization in Vegetable Crops)

Abstract

:
Plant-derived protein hydrolysates (PHs) are gaining prominence as biostimulants due to their potential to improve yield and nutritional quality even under suboptimal nutrient regimens. In this study, we investigated the effects of foliar application of a legume-derived PH (0 or 4 mL L−1) on greenhouse baby spinach (Spinacia oleracea L.) under four nitrogen (N) fertilization levels (0, 15, 30, or 45 kg ha−1) by evaluating morphological and colorimetric parameters, mineral composition, carbohydrates, proteins, and amino acids. The fresh yield in untreated and biostimulant-treated spinach plants increased in response to an increase in N fertilization from 1 up to 30 kg ha−1, reaching a plateau thereafter indicating the luxury consumption of N at 45 kg ha−1. Increasing N fertilization rate, independently of PH, lead to a significant increase of all amino acids with the exception of alanine, GABA, leucine, lysine, methionine, and ornithine but decreased the polyphenols content. Interestingly, the fresh yield at 0 and 15 kg ha−1 was clearly greater in PH-treated plants compared to untreated plants by 33.3% and 24.9%, respectively. This was associated with the presence in of amino acids and small peptides PH ‘Trainer®’, which act as signaling molecules eliciting auxin- and/or gibberellin-like activities on both leaves and roots and thus inducing a “nutrient acquisition response” that enhances nutrients acquisition and assimilation (high P, Ca, and Mg accumulation) as well as an increase in the photochemical efficiency and activity of photosystem II (higher SPAD index). Foliar applications of the commercial PH decreased the polyphenols content, but on the other hand strongly increased total amino acid content (+45%, +82%, and +59% at 0, 15, and 30 kg ha−1, respectively) but not at a 45-kg ha−1-rate. Overall, the use of PH could represent a sustainable tool for boosting yield and nitrogen use efficiency and coping with soil fertility problems under low input regimens.

1. Introduction

The rapid global population growth and the improved quality of life are expected to increase food demand around 50% by 2030, further doubling it by 2050 [1]. This unprecedented demand for food will put enormous pressure on the agricultural sector to ensure global food security at affordable prices [2]. One of the possible responses is culture intensification, with high use of soil and cultural inputs in concentrated spaces, but the ecological outcome could be severe [3]. In fact, greenhouse horticulture, which is the best example of resource-intensive agriculture, entails the highest use of chemicals, in particular nitrogen (N), per unit area than any other agricultural system, causing high costs and strong environmental impacts [4,5,6,7]. Nitrogen fertilization, in fact, is not only one of the main costs for farmers, with prices linked to that of petroleum, but it is also responsible for very serious environmental implications and health risks [8]. From a study of Lassaletta et al. [9] on the data available in the FAO database from 1961 to 2009 (www.faostat.fao.org), it comes out that the massive use of synthetic N inputs (increased by a factor of nine over that period) has certainly increased agricultural productivity while decreasing nitrogen use efficiency (NUE). This latter, in fact, decreased from 68% in the early 1960s to 47% in the last decade, with more than half the N fertilizers getting lost in the soil–plant system, causing contamination of surface and groundwater resources, eutrophication of coastal waters, and release of air pollutants and greenhouse gases [9,10]. Moreover, N fertilizers, in particular nitrate, can have serious effects on human health [8]. When nitrate is accumulated in edible plant tissues above the maximum residue levels (MRLs), it can be reduced to nitrite by gastrointestinal microflora leading to methemoglobinemia in children (blue baby syndrome) [11,12,13]. Nitrite can further react with amines and amides being transformed in N-nitroso compounds (NOCs), classified as “probably carcinogenic to humans” and correlated to gastric, esophageal, nasopharyngeal, and colon cancers [12,14,15]. Therefore, nitrate content must be monitored in leafy vegetables, and maintained lower than the limits imposed by EU regulation no. 1258/2011 (e.g., nitrate content in spinach must be lower than 3500 mg kg−1fw).
Over the past three decades several researchers have tried unsuccessfully to improve the NUE through plant breeding and biotechnology approach strategies. Nitrogen use efficiency is described by the Organisation for Economic Co-operation and Development (OECD) as the ratio between the amount of N fertilizer exported from the field by the crops and the amount of N fertilizer applied, following a suggestion of Hirel et al. [16]. However, measuring NUE in practice is neither usual nor easy, because NUE is a complex trait depending not only on the ability of plants to uptake nutrients from the soil, but also on their subsequent transport, assimilation, storage, mobilization and use within the plant, as well as on the impact of N lost in the environment [17]. In fact, a recent paper suggested the whole food chain NUE (NUEFC), a more complex approach considering the ratio of the protein (expressed as N) available for human consumption to the (newly fixed and imported) N input to the food system; this latter considers all together the life cycle analysis, the N footprint and budget, and the assessment of environmental impact [18].
Therefore, to sustainably increase NUE and agricultural productivity and reduce both the costs and adverse effect of N fertilizers on environment and human health, it is necessary to adopt new agricultural technological practices shifting from N intensive agriculture to more environmental friendly approaches [4,19,20]. One promising strategy to increase NUE and reduce the amount of N fertilizer while maintaining acceptable yields implies the use of plant biostimulants [21]. They have been recently defined at the European level as products stimulating plant nutrition processes independently of their nutrient content, with the aim to enhance one or more of the following plant features: (i) nutrient use efficiency, (ii) tolerance to abiotic stress, (iii) crop quality traits, and (iv) availability of confined nutrients in the soil and rhizosphere.
Among plant biostimulants (PBs), plant protein hydrolysates (PHs) constituted by a mixture of polypeptides, oligopeptides, and amino acids have been shown to improve horticultural and agronomic crops resources use efficiency (RUE) [22,23], carbon and N metabolism [24,25,26], productivity [27,28], product quality [27,29], and tolerance to abiotic stresses [25,30,31,32]. All these effects cannot in any way be attributed to the increase in N availability because the dose at which they are applied is very low if compared with that of normal N fertilizers [33]. However, PHs contain bioactive peptides able to elicit hormone-like activities (auxin and gibberellins) influencing not only shoot and root growth, but also root architecture (e.g. length, number, density, and surface of lateral roots) thus improving crop productivity [22,24,34]. Moreover, PHs containing mainly peptides, and amino acids can add complex nutrients to the soil solution potentially rendering them more available for plant uptake and enhancing microbial activity [22,26]. Protein hydrolysates are manufactured from plant-derived protein sources using partial enzymatic, chemical (acid and alkaline hydrolysis), or thermal hydrolysis [26,35,36] and used with root drenching or foliar spray application [26]. For their production, it is possible to use crop residual biomass or agricultural by-products, which represent an economical and eco-friendly solution to reduce the amount of biomass disposed in landfill and pollution overall. This process is in compliance with the European Sustainable Waste Management Guidelines and the principles of the circular economy [22,37].
Trainer®, a commercial legume-derived PH containing soluble peptides and free amino acids, is easily absorbed by leaves and translocated to other plant parts in few hours. In addition to the above-mentioned beneficial effects, it is able to stimulate N uptake and assimilation, with a significant increase in crop productivity [38,39]. Moreover, it has great potential to reduce nitrate accumulation in leafy vegetables such as lettuce, rocket, and spinach [22]. Italy is the European leader in the production of these leafy vegetables destined for the minimally processed market with nearly 15,000 ha and 160 kilotons per year in protected cultivation [40,41]. However, among these leafy vegetables, spinach is the less efficient in both N uptake and utilization [42] and needs large inputs of N to grow and establish the dark green color [43]. This leads spinach to accumulate considerable amounts of nitrate in the marketable product [42].
The aim of the paper was not only to verify the beneficial effect of this PB on spinach growth and marketability under reduced N inputs, but also to contribute in increasing the knowledge about the regulatory mechanisms involved in PB control of plant N economy, capital for improving NUE and for reducing excessive input of fertilizers and, consequently, environmental and health problems.

2. Materials and Methods

2.1. Plant Material and Greenhouse Conditions

A greenhouse experiment was conducted from 19 January to 14 March, 2018, at the Department of Agricultural Sciences, University of Naples Federico II (40°49′ N, 14°15′ E; 70 m above sea level). The leafy vegetable selected for the current study was baby spinach (Spinacia oleracea L. cv. Platypus RZ F1, RijkZwaan, Bologna, Italy). This dark green semi savoy type is popular in Italy among growers and consumers and widely cultivated during autumn and winter periods. The soil was classified as sandy loam (textural analysis: 75% sand, 18% silt, and 6% clay) with a pH of 7.1, soil electrical conductivity of 0.4 dS m−1, organic matter of 1.6% (w/w), total N at 0.10%, NO3-N and NH4-N at 90 and 10 mg kg−1, respectively, P at 31 mg kg−1 and exchangeable K at 1012 mg kg−1. Daily solar radiation and men air temperatures inside the greenhouse ranged from 2.1 to 17.5 MJ m−2 and from 11.0 to 21.5 °C, respectively.

2.2. Experimental Design, Nitrogen Application, Cultural Practices and Biostimulant Characteristic

Eight treatments were compared deriving from the factorial combination of two biostimulant applications (control or foliar application of PH) and four N fertilization levels (0, 15, 30, or 45 kg ha−1). The eight tested treatments were arranged in a randomized complete block split-plot design with N fertilization levels as main factor and biostimulant application as a sub-factor with three replicates amounting to 24 experimental plots. The surface area of each replicate (experimental plot) was 3.5 square meter containing 1000 seeds per m2. The baby spinach was hand seeded on 19 January.
Based on the soil analysis, no phosphorus (P) and potassium (K) fertilization were required due to the high concentration of these two macronutrients in the soil. The N was applied as NH4NO3 (34%) through an overhead irrigation system, in 3 weekly applications starting 7 days after sowing (DAS). Overhead irrigation started when the soil available water capacity decreased to 80% at 20 cm depth. Pests and pathogens were controlled based on the standard protection practices adopted among greenhouse vegetable growers in south Italy. Weeds were also controlled with hand hoeing.
The commercial legume-derived protein hydrolysate biostimulant Trainer® was provided by ItalpollinaS.p.A., Rivoli Veronese, Italy. The legume-derived PH biostimulant obtained through enzymatic hydrolysis contains 75% of free amino acids and peptides, 22% of carbohydrates and 3% of mineral nutrients. The detailed aminogram (Ala, Arg, Asp, Cys, Glu, Gly, His, Ile, Leu, Lys, Met, Phe, Pro, Ser, Thr, Trp, Tyr, and Val) of the product along with the phenolics, flavonoids, and elemental composition were reported in detail by Rouphael et al. [28] and Paul et al. [44]. No detectable phytohormones in the commercial PH have been recorded. The biostimulant-treated plants were sprayed uniformly five times (at 25, 32, 39, 46, and 53 DAS) during the growing cycle at 7-days interval with a solution containing 4 ml L−1 of Trainer® using a 10-L stainless steel sprayer.

2.3. Yield and Biometric Assessments, Leaf Color Measurements and SPAD Index

Spinach plants were harvested on March 14 (55 DAS) and marketable yield was determined by harvesting 1 m2 of the center of the 24 replicates (i.e., experimental plot). A sample of the fresh material was dried at 80 °C for about 3 d until reaching constant weight, and weighed again to determine dry shoot biomass as well as leaf dry matter percentage. The dried leaf samples were collected for further mineral analysis. In addition, leaf number per plant as well as the total leaf area measured by an electronic area meter (Li-Cor3000, Li-Cor, Lincoln, NE, USA) were also recorded on 20 plants in each experimental plot.
Baby spinach leaf color was measured on the upper part of the leaves using Minolta CR-300 Chroma Meter (Minolta Camera Co. Ltd., Osaka, Japan) in order to obtain the color space parameters in particular L* (brightness), a* (chroma component ranging from green to red) and b* (chroma component ranging from blue to yellow).
The Soil Plant Analysis Development (SPAD) index was measured three times during the growing cycle (33, 41, and 48 DAS) using a portable chlorophyll meter SPAD-502 (Konica Minolta, Tokyo, Japan) as described in detail by Kumar et al. [45]. Fifteen fully expanded leaves were measured and averaged to a single SPAD value for replicate.

2.4. Mineral Composition Analysis

The desiccated spinach leaf tissues were ground in a Wiley Mill to pass through an 841 µm screen and used for macro-mineral profile and sodium (Na) analysis. The total protein content was assessed by the Kjeldahl method [46], with N to protein conversion factor of 6.25. The macro-mineral and Na content were analyzed according to Rouphael et al. [28] and Kyriacou et al. [47]. Briefly, 0.25 g of dry tissue were put in 50 mL of ultrapure water (Milli-Q, Merck Millipore, Darmstadt, Germany), then freeze-thawed for four cycles with liquid N and incubated (80 °C) and shaken (100 rpm) in a ShakeTemp SW22 water bath (Julabo, Seelbach, Germany) for 10 min. The suspension was centrifuged at 6000 rpm for 10 min (R-10 M, RemiElektrotechnik Limited, Mumbai, India), then filtered through a 0.20 μm filter paper (Whatman International Ltd., Maidstone, U.K.). Nitrate, phosphorus, potassium, calcium (Ca), magnesium (Mg), sulfur (S), and sodium were separated and quantified by ICS-3000 ion chromatography (Dionex, Sunnyvale, CA, USA) coupled to a conductivity detector. An IonPac CG12A (4 × 250 mm, Dionex, Corporation) guard column and IonPac CS12A (4 × 250 mm, Dionex, Corporation) analytical column were used for the K, Ca, Mg, and Na analysis, while for nitrate, P and S determination, an IonPac AG11-HC guard (4 × 50 mm) column and IonPac AS11-HC analytical column (4 × 250 mm) were adopted. Nitrate concentration was expressed in mg kg−1 fresh weight (fw), whereas the remaining macronutrients and Na concentrations were expressed on a dry weight basis (g kg−1dw).

2.5. Starch and Soluble Carbohydrates Analysis

Soluble carbohydrates (µmol g−1dw) were quantified in ethanolic extracts of lyophilized spinach leaf tissues. Starch as well was quantified in the pellet of the same ethanolic extract after hydrolysis to glucose, by an enzymatic assay coupled with reduction of pyridine nucleotides as described in Carillo et al. [48]. The increase in absorbance at 340 nm was recorded by a Synergy HT spectrophotometer (BioTEK Instruments, Bad Friedrichshall, Germany).

2.6. Carotenoids Analysis

Total carotenoids (µg g−1dw) were extracted by homogenization of lyophilized spinach leaf tissues (1.0 g) in methanol according to Annunziata et al. [49]. The resulting extracts were centrifuged at 4.800× g for 15 min, and carotenoids content was estimated by measuring the absorbance of the supernatant at 470,652 and 665 nm in a polypropylene microplate by a microplate reader (Synergy HT, BioTEK Instruments, Bad Friedrichshall, Germany) according to Wellburn [50].

2.7. Polyphenols Analysis

The total polyphenols (mg g−1 fw) content was determined by the Folin–Ciocalteu method according to Singleton et al. [51] with few modifications. Lyophilized leaf tissues (30 mg) were extracted in 700 μL of 60% methanol (v:v); 35 μL of extract was mixed with 125 μL of the Folin–Ciocalteu reagent diluted with distilled water (1:4 v/v) and, after mixing for 6 min, 650 μL of 3% (w:v) sodium carbonate was added. After 90 min at room temperature, the absorbance at 760 nm was determined in a microplate reader Synergy HT (BioTEK Instruments, Bad Friedrichshall, Germany). The polyphenols concentration was expressed as gallic acid equivalents (GAE) as described in Carillo et al. [52].

2.8. Free and Total Amino Acids Analysis

Primary amino acids and proline (µmol g−1dw) were extracted from 40 mg of lyophilized leaf tissues in 1 mL of 60% (v/v) ethanol overnight at 4 °C according to Ferchichi et al. [53]. Amino acids were estimated by HPLC after pre-column derivatization with o-phthaldialdehyde (OPA) according to Woodrow et al. [54]. Proline was determined in the same extract according to the acid–ninhydrin-based method of Bates et al. [55], with some modifications as described by Woodrow et al. [54].

2.9. Statistics, Principal Component Analysis, and Heat Map

All data were subjected to two-way analysis of variance (ANOVA) using the software package SPSS 13 for Windows 2001. The means were separated by Duncan’s multiple-range test (significance level 0.05). Biostimulant application main effects were compared using the t-test. Principal component analysis (PCA) was performed on morpho-physiological, qualitative parameters and mineral contents to unravel the dominant parameters that mainly discriminated between N fertilization levels and biostimulant application by using Minitab® 18 statistical software (Minitab LLC, State College, Pennsylvania, USA) [48,56]. The score plot and loading matrix were also determined based on the first and second principal components (PCs). A heat map generated by using the https://biit.cs.ut.ee/clustvis/online program package with Euclidean distance as the similarity measure and hierarchical clustering with complete linkage heatmap, summarized all the plant responses to both N rates and PH-based biostimulant. Data were visualized using a false color scale, with red indicating an increase and blue a decrease of values [52]. A second heat map generated in Excel summarized the plant responses to different N-rates and PH-based biostimulant. Results were calculated as Log2 of legume-derived biostimulant/control in plants grown at different N (0, 15, 30, and 45 kg ha−1). Results were visualized using a false color scale with red indicating an increase and blue a decrease, while no differences were visualized by white squares [57].

3. Results

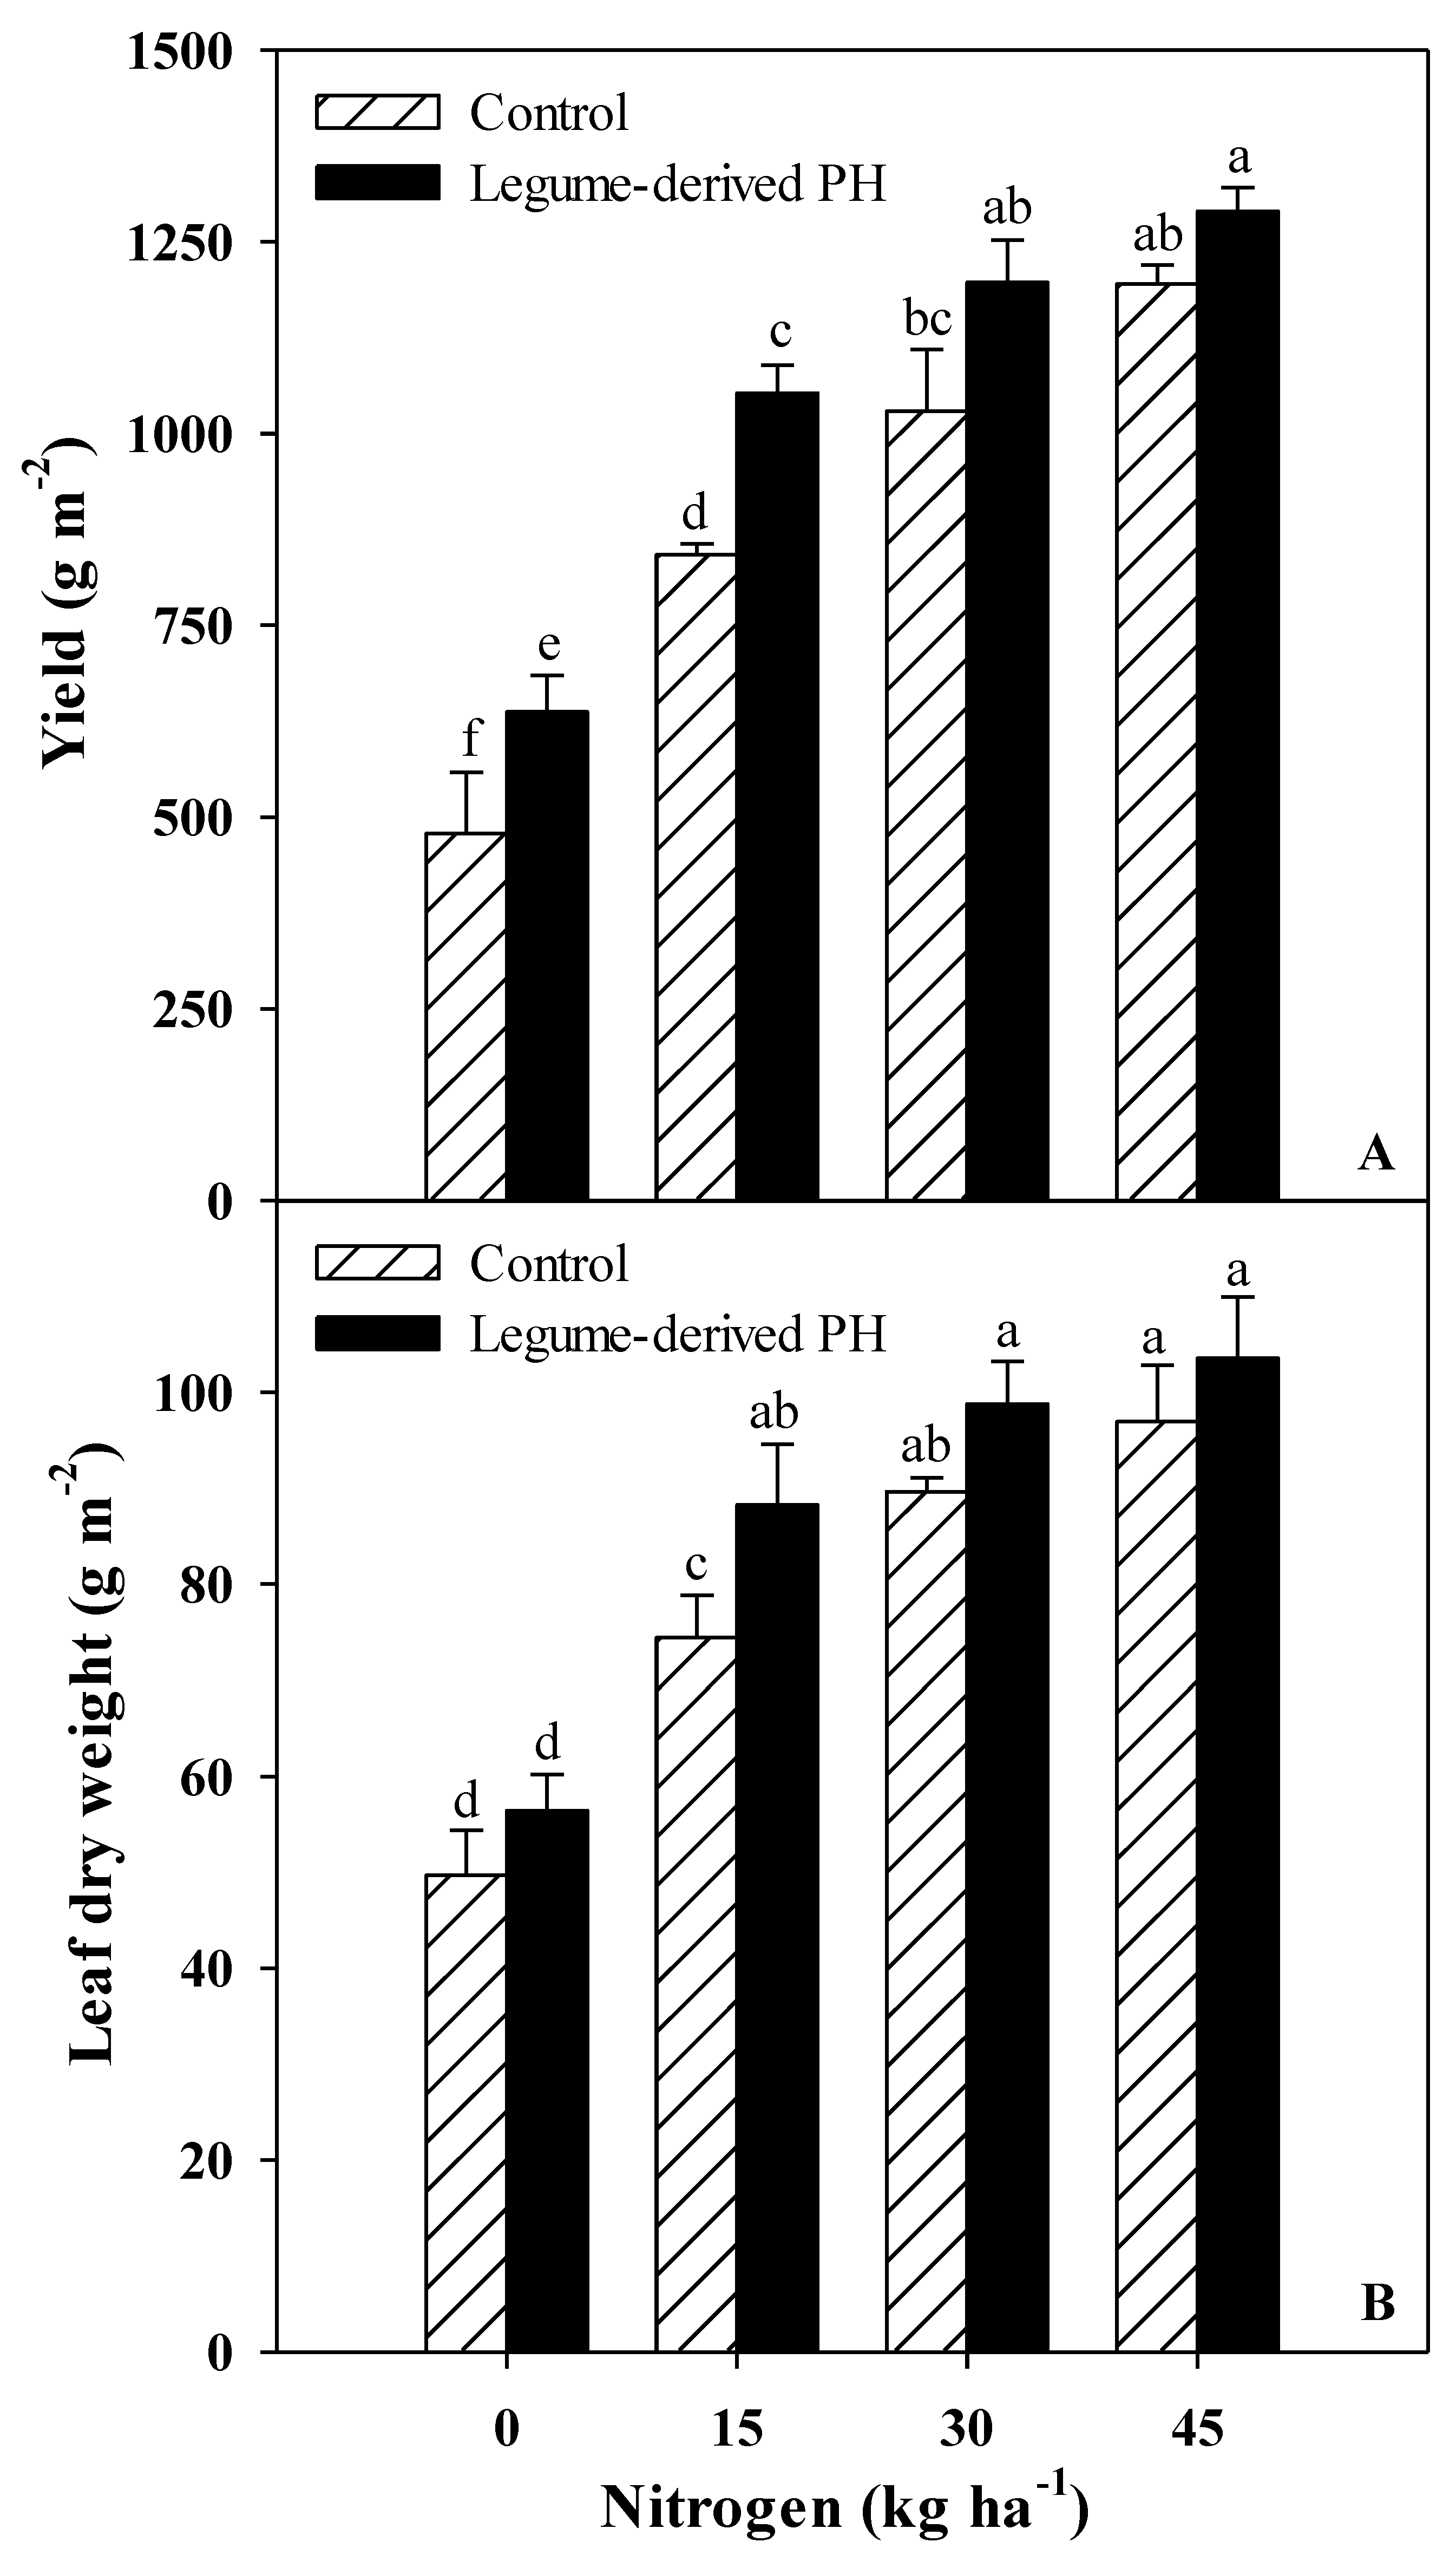
3.1. Marketable Yield and Morphometric Measurements

The results regarding marketable yield and morphological parameters of spinach in relation to N fertilization rates and legume-derived biostimulant application are presented in Table 1 and Figure 1. Marketable yield expressed on both fresh and dry weight basis was significantly influenced by N fertilization and biostimulant application interaction, whereas no significant interaction was recorded between the two tested factors for the total number of leaves, leaf area and leaf dry matter percentage (Figure 1 and Table 1). For instance, the fresh and dry biomass in untreated and biostimulant-treated spinach plants increased in response to an increase in N fertilization from 1 up to 30 kg ha−1, reaching a plateau thereafter indicating the luxury consumption of N at 45 kg ha−1 (Figure 1). Interestingly, the fresh yield (at 0 and 15 kg ha−1) and dry biomass (at 15 kg ha−1) differential was clearly higher in PH-treated plants compared to untreated plants (33.3% and 24.9% increase for fresh yield and 18.7% increase for dry biomass).
Irrespective of biostimulant treatment (N fertilization × biostimulant = ns), total leaf area increased linearly with increasing N rates from 0 to 45 kg ha−1, whereas an opposite trend was observed for leaf dry matter percentage (Table 1). Averaged over N fertilization levels, the number of leaves per plant and the total leaf area in PH-treated plants were higher than those in untreated plants by 10.1% and 31.8%, respectively (Table 1).

3.2. SPAD Index and Leaf Colorimetry

Neither N fertilization rate nor legume-derived protein hydrolysate application had a significant effect on the Commission internationale de l’éclairage CIELAB color space parameters: L* (avg. 39.4) a* (avg. 13.7) and b* (avg. 18.6) (Table 2). On the other hand, except for the last sampling date (48 DAS), the SPAD index at 33 and 41 DAS was significantly affected by both tested factors but not by their interaction (Table 2). When averaged over biostimulant application, increasing the N fertilization rate from 0 to 45 kg ha−1 boosted the SPAD index linearly and significantly with the highest values recorded at 45 kg ha−1. Finally, irrespective of the N fertilization rate SPAD index at 33 and 41 DAS in PH-treated plants was significantly higher than untreated plants by 6.0% and 5.0%, respectively (Table 2).

3.3. Protein Content and Leaf Mineral Composition

Protein content was significantly affected by N fertilization rate and biostimulant application but not by their interaction. The protein content was significantly influenced by foliar application of PH, which was higher by 15.3% than in untreated spinach plants (Table 3). Among analyzed minerals, K was by far the most abundant, irrespective of N fertilization rate and biostimulant application, ranging from 86.6 to 104.5 g kg−1dw. The consecutive most abundant minerals were Mg, P, Ca, S, and Na (Table 3). Neither N fertilization rate nor legume-derived protein hydrolysate application had a significant effect on K, S, and Na concentration in leaves (avg. 98.4, 1.3, and 1.2 g kg−1dw, respectively). Except for Mg, which incurred significant N fertilization rate × Biostimulant application interaction, the following macronutrients nitrate, P, and Ca were significantly affected by N fertilization rate or biostimulant application but not by their interaction (Table 3). Specifically, increasing the N fertilization rate from 0 to 45 kg ha−1 increased the leaf concentrations of nitrate and Mg with the lowest values observed under control treatment (0 kg ha−1; Table 3). The PH-biostimulant treatment, averaged over N fertilization rate, affected the P, Mg, and Ca concentrations in leaf tissue, which were higher by 12.9%, 10.3%, and 12.8%, respectively than in untreated spinach plants (Table 3).

3.4. Carbohydrates, Carotenoids and Polyphenols Content

Neither N fertilization rate nor the legume-derived PH application had a significant effect on starch (avg. 7.4 mg g−1dw), reduced sugars such as fructose (avg. 13.1 mg g−1dw) and sucrose (avg. 2.6 mg g−1dw) as well as on carotenoids (avg. 5.2 µg g−1dw) concentrations (Table 4). The foliar application of PH at weekly interval, averaged over N fertilization rate negatively affected the glucose and polyphenols concentrations in spinach leaves (reduction of 18.1% and 9.7%, respectively; Table 4). Finally, when averaged over PH-based biostimulant, increasing N fertilization from 0 to 45 kg ha−1 significantly decreased the polyphenols content, with no significant differences between the three N fertilization rates (Table 4).

3.5. Free Amino Acid Contents

The free amino acids profile as a function of N fertilization rate and PH biostimulant treatments are reported in Table 5. Irrespective of the PH treatment, γ-aminobutyric acid (GABA), alanine, glutamine, and glutamate were quantitatively the major amino acids, representing about 28.0%, 21.2%, 9.0%, and 8.1% of total free amino acids in spinach plants grown under control treatment (0 kg ha−1), respectively. Essential amino acids (the sum of isoleucine, histidine, leucine, lysine, methionine, threonine, and valine) accounted for 12.4% of total amino acids in the same treatment. Increasing N fertilization rate, independently of PH, determined a significant increase of all amino acids with the exception of alanine, GABA, leucine, lysine, methionine, and ornithine (Table 5). Interestingly, the foliar application of the commercial PH Trainer® strongly increased total amino acid content (+45%, +82%, and +59% at 0, 15, and 30 kg ha−1, respectively) but not at 45 kg ha−1-rate in which, on the contrary, it determined a decrease of 10% (Table 5). In this latter condition, the only amino acids which did not decrease compared to the respective controls were the amides asparagine and glutamine, proline and essential amino acids (Table 5).

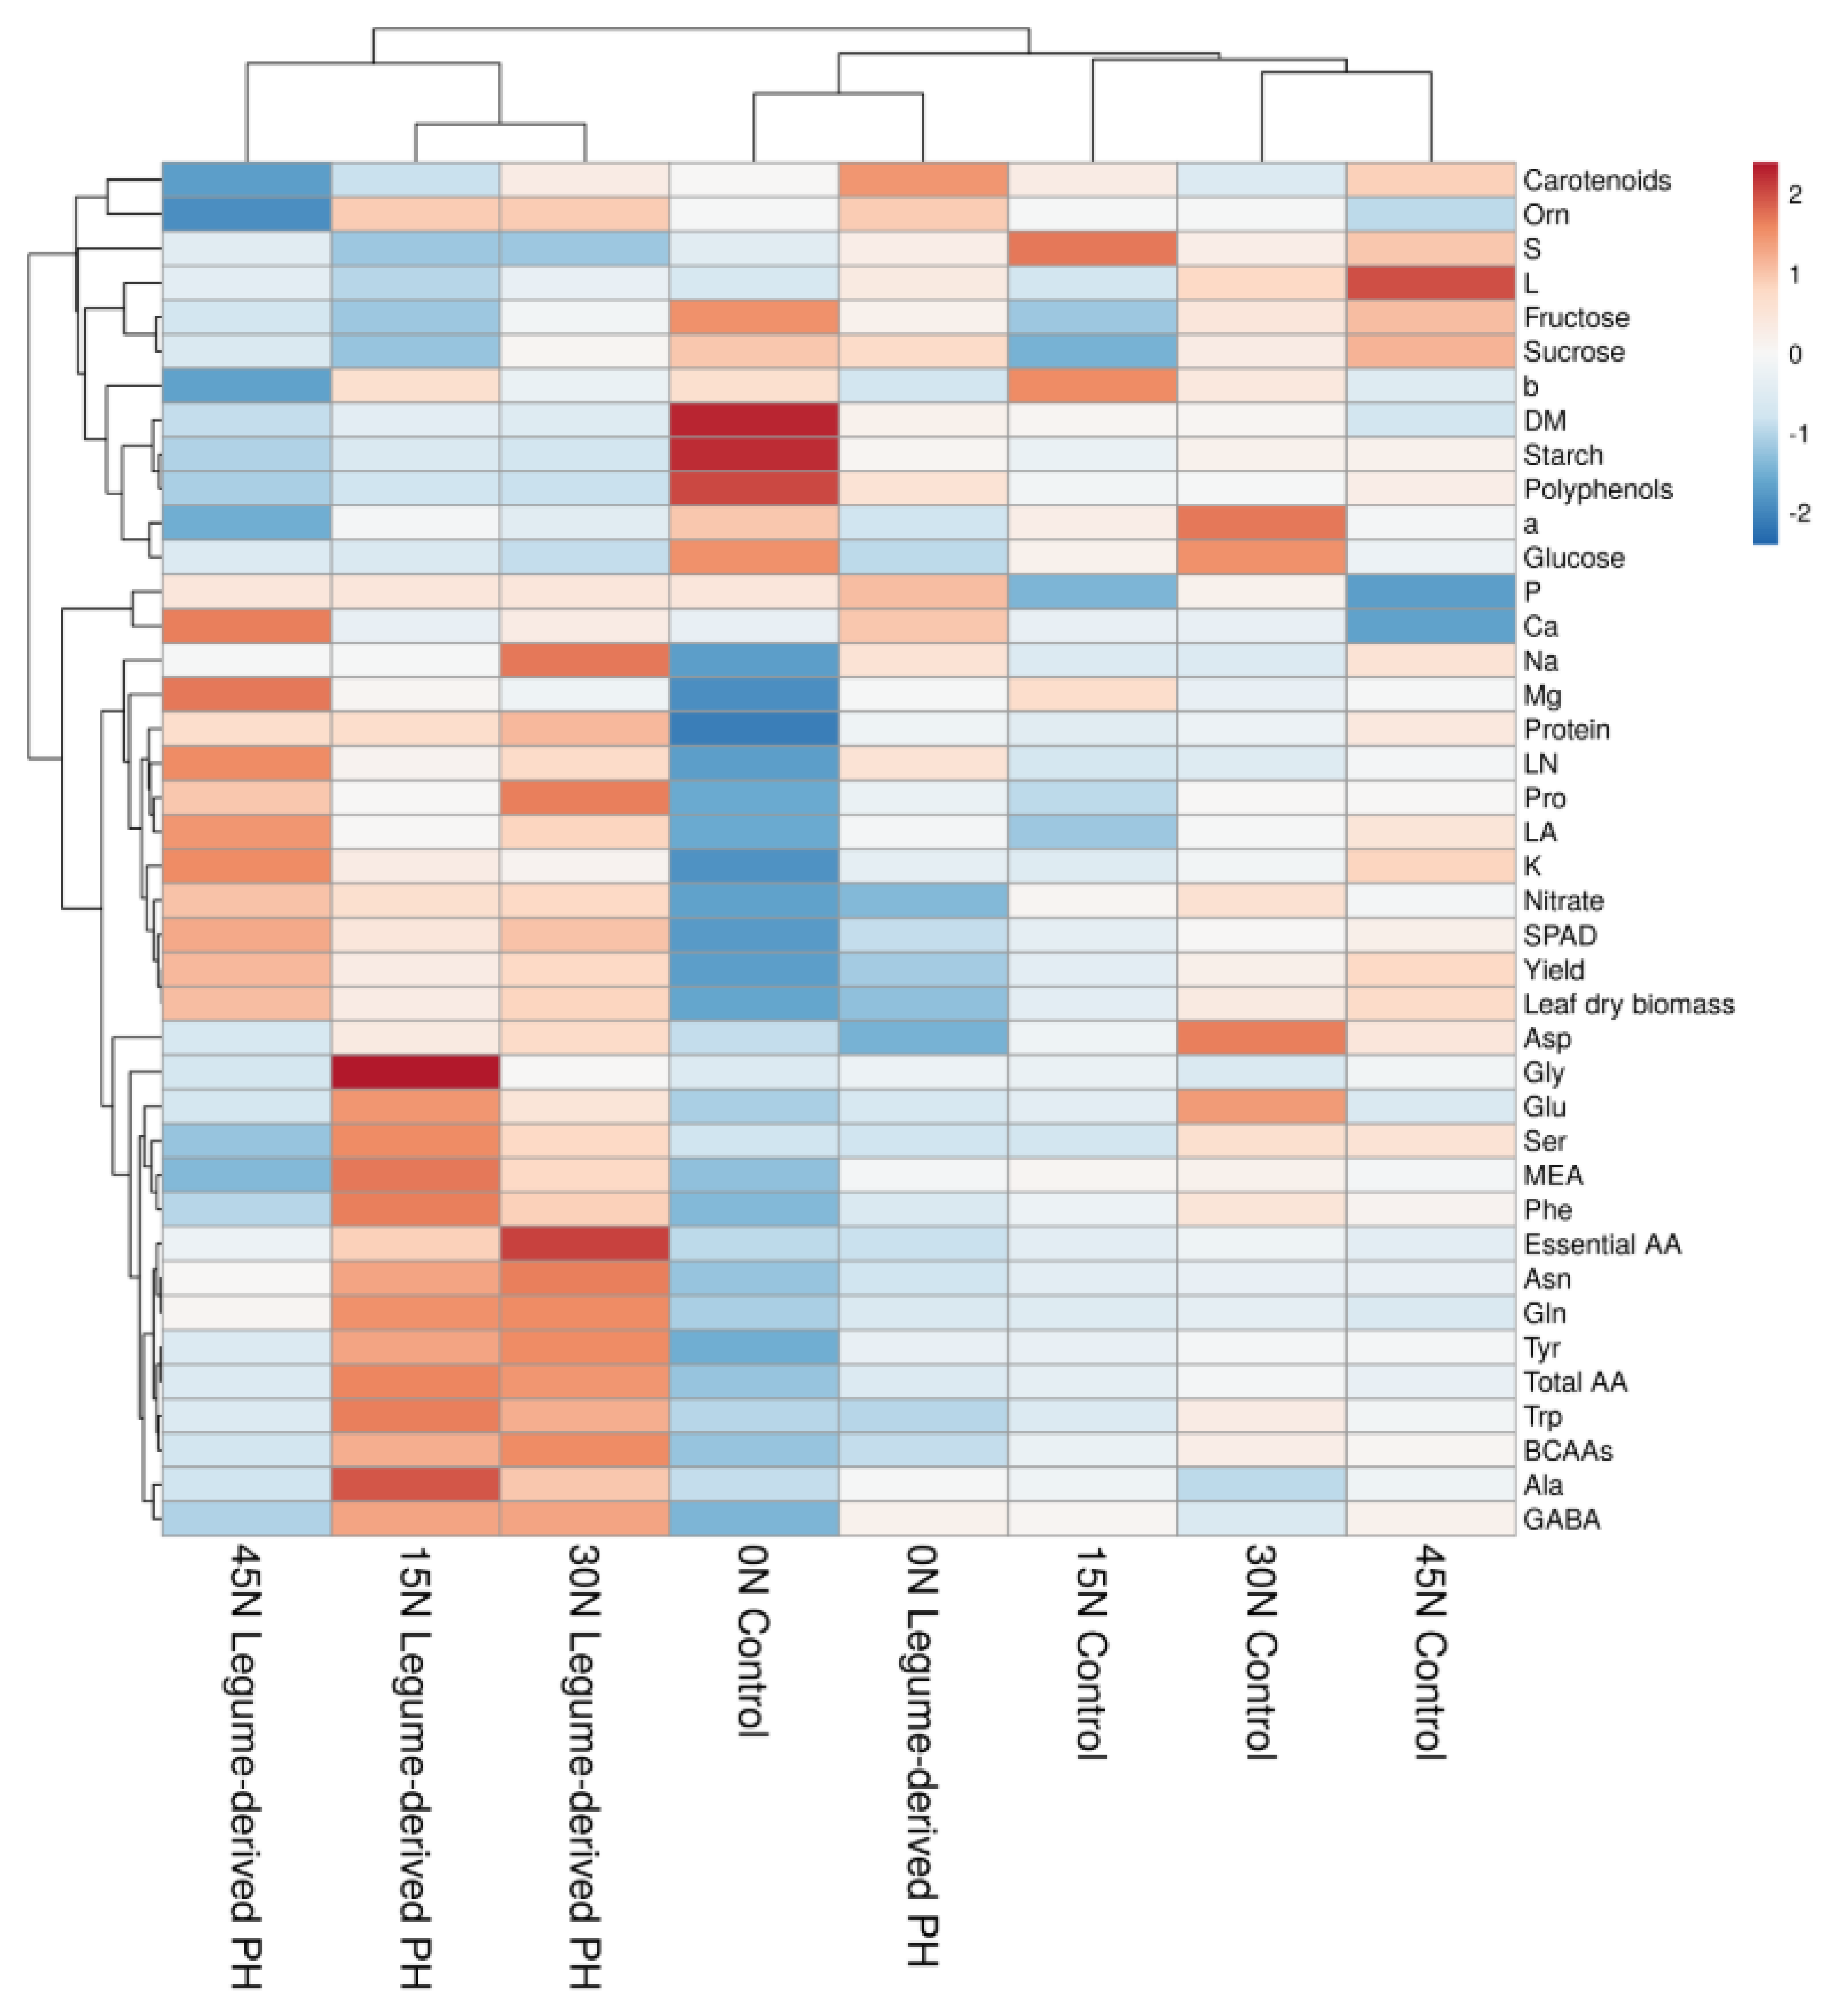
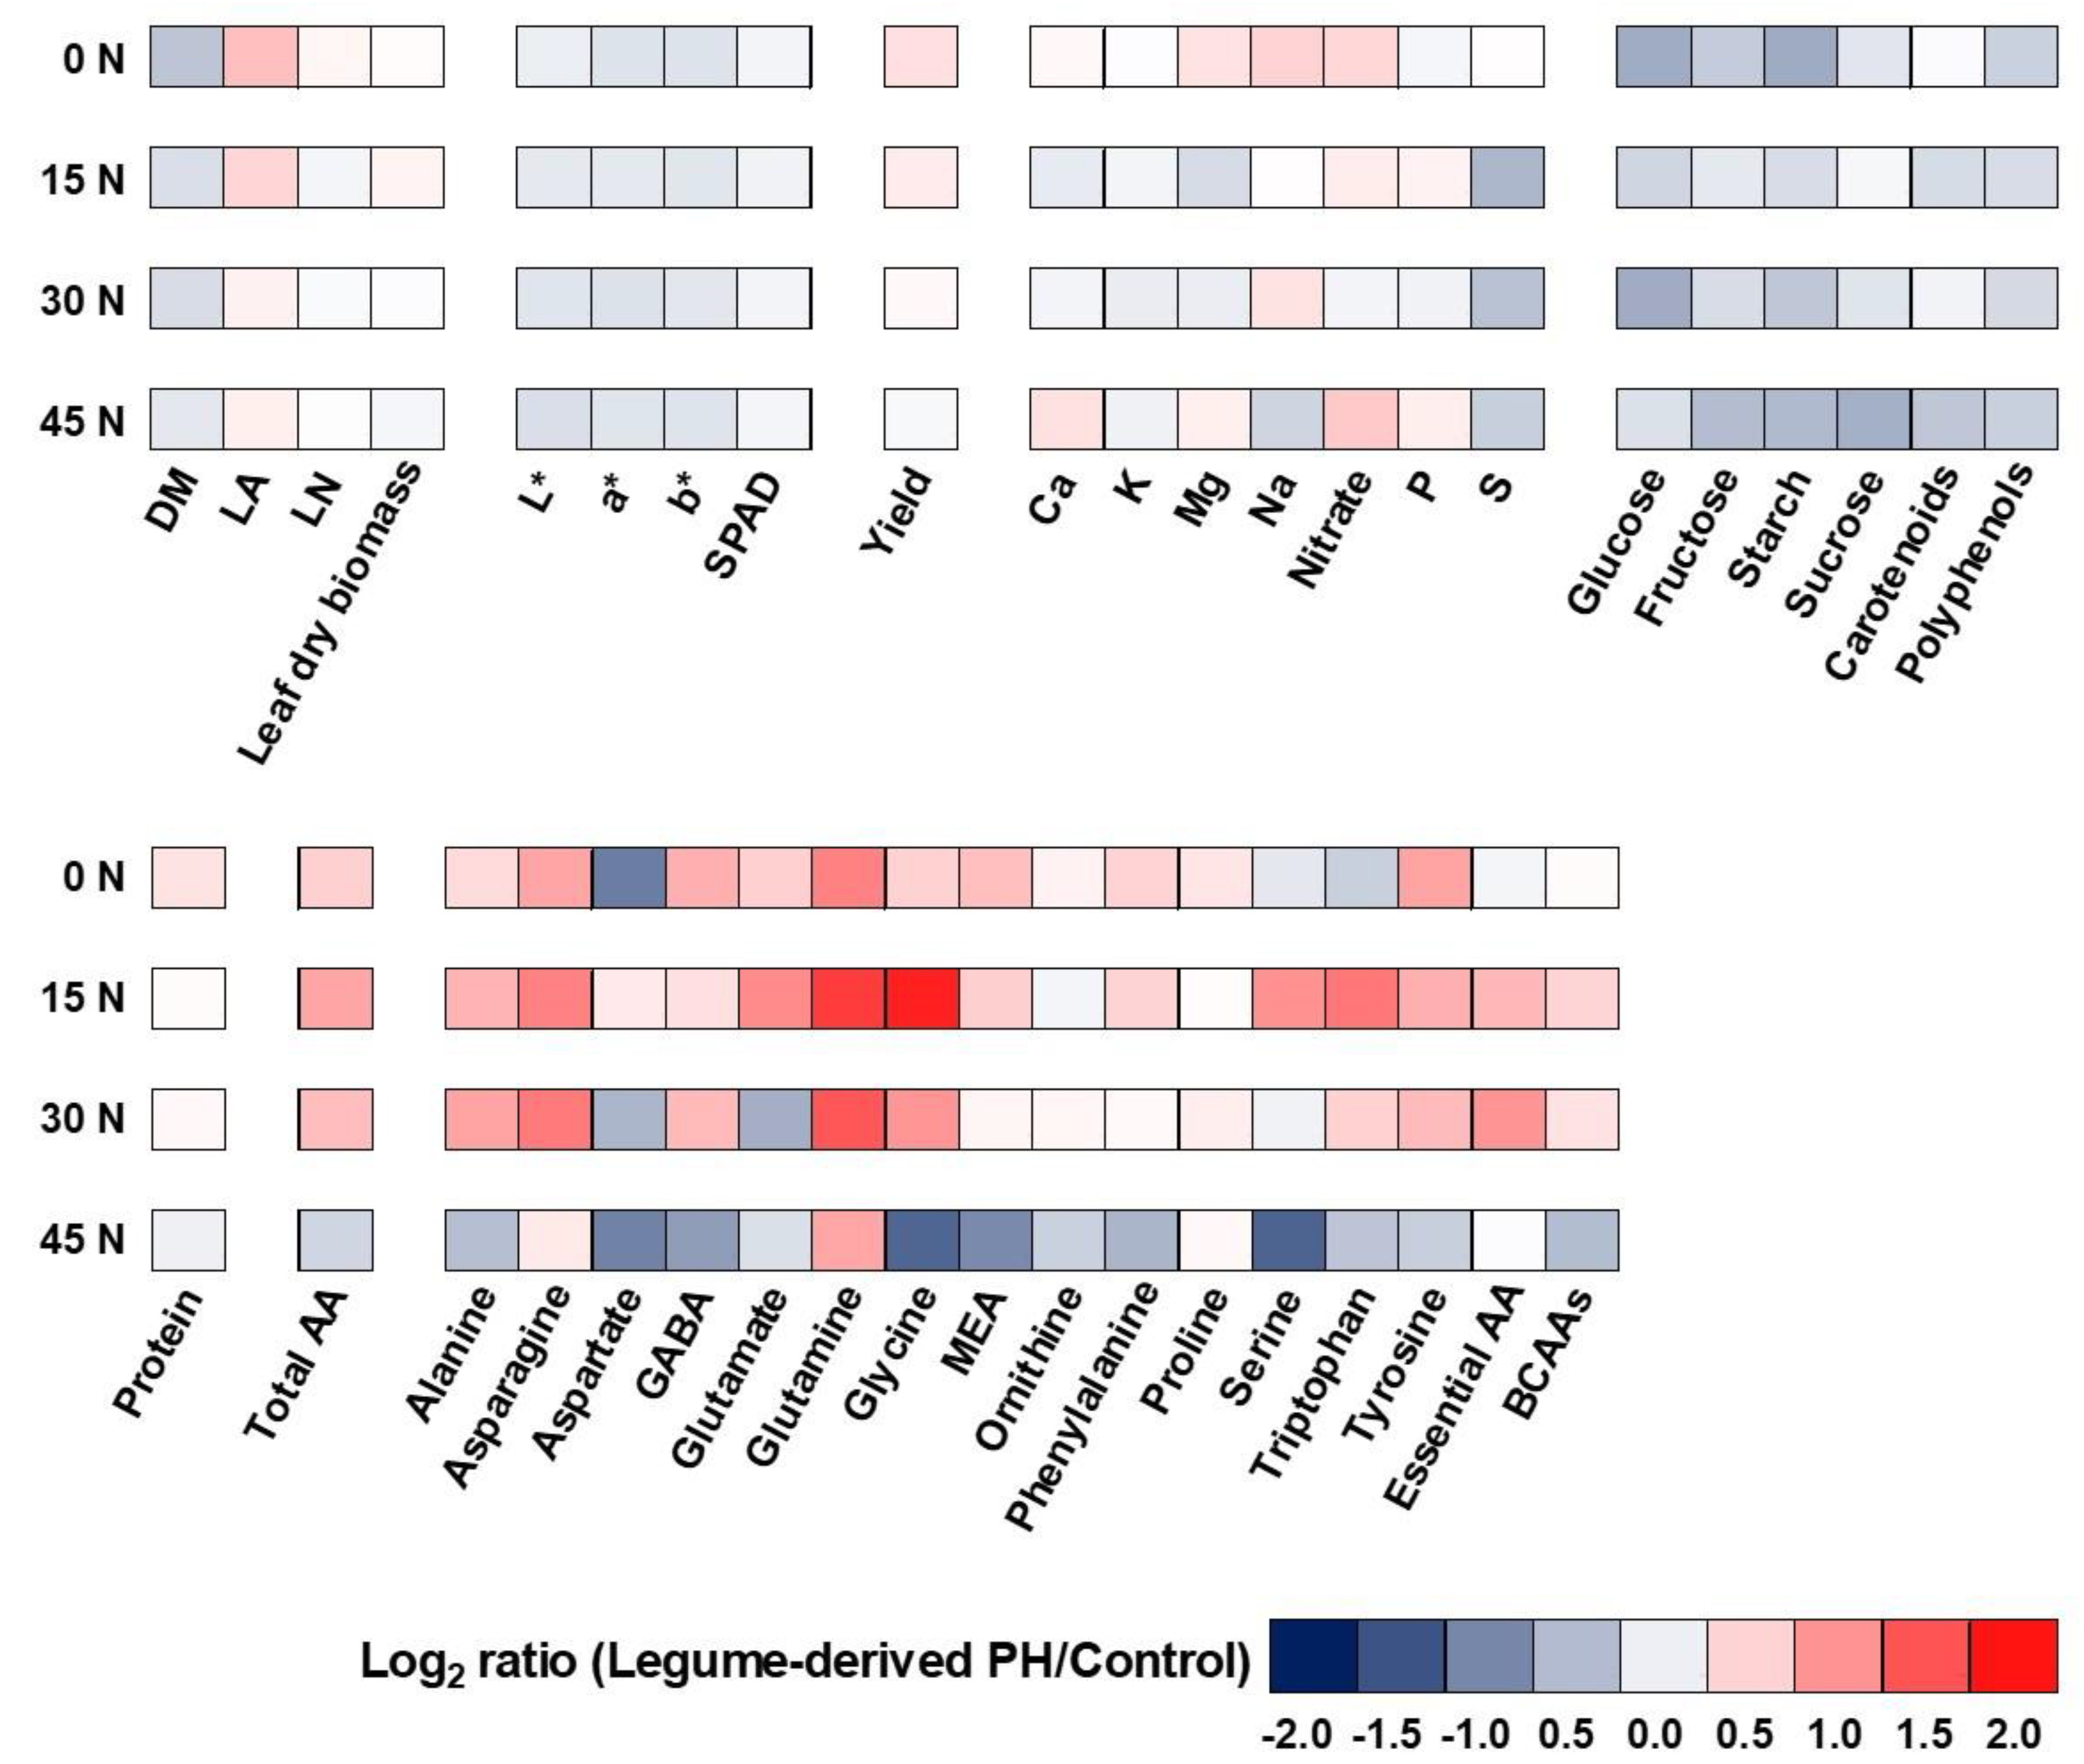
3.6. Heat Map Analysis

The aggregated data heat-map analysis (Figure 2) identified two main clusters corresponding to the 15 N, 30 N, and 45 N under PH treatment on the left and all the other treatments on the right. Two separated sub-clusters could be defined under the second cluster, which fundamentally depended on the N-rates. The 0 N-rates with and without PH biostimulant treatments sub-clustered separately from the 15 N, 30 N, and 45 N control treatments on the right because of their lower nitrate and free amino acids content, SPAD index, yield, and leaf dry biomass. This indicated that the PH was the main clustering factor. The cluster on the left was separated by the sub-cluster on the right because the PH treatment determined a much higher protein and free amino acids content but lower carbohydrates and S in 15 and 30 N + PH compared to the respective controls. While 45 N + PH showed the highest nitrate, SPAD index, yield, leaf dry biomass, leaf area, K, leaf number, Mg, and Ca but lowest b* and a* colorimetric parameters, carotenoids, and polyphenols. On the contrary, 45 N control showed the highest carotenoids, glucose and fructose after 0 N treatments, the highest L*, but the lowest P- and Ca content (Figure 2).
A different heat map analysis was realized because the first one evidenced big variation also for little numerical differences. The second heat map evaluated the changes in the analyzed parameters in terms of dependence on the PH ‘Trainer®’ application at different N-rates (Figure 3). PH application at 0 N and 15 N increased leaf area, nitrate and marketable yield as well. Total amino acids were strongly increased at 0–30 N, in particular, asparagine, alanine, glutamine, glycine, tyrosine, and essential amino acids. However, at 45 N + PH determined a decrease or left unvaried the most of the parameters, with the exception of nitrate, glutamine, Ca, Mg, and P which increased. Finally, the foliar application with PH-based biostimulant strongly decreased carbohydrates content, polyphenols, leaf dry matter percentage, and colorimetric parameters independently of N-rates.

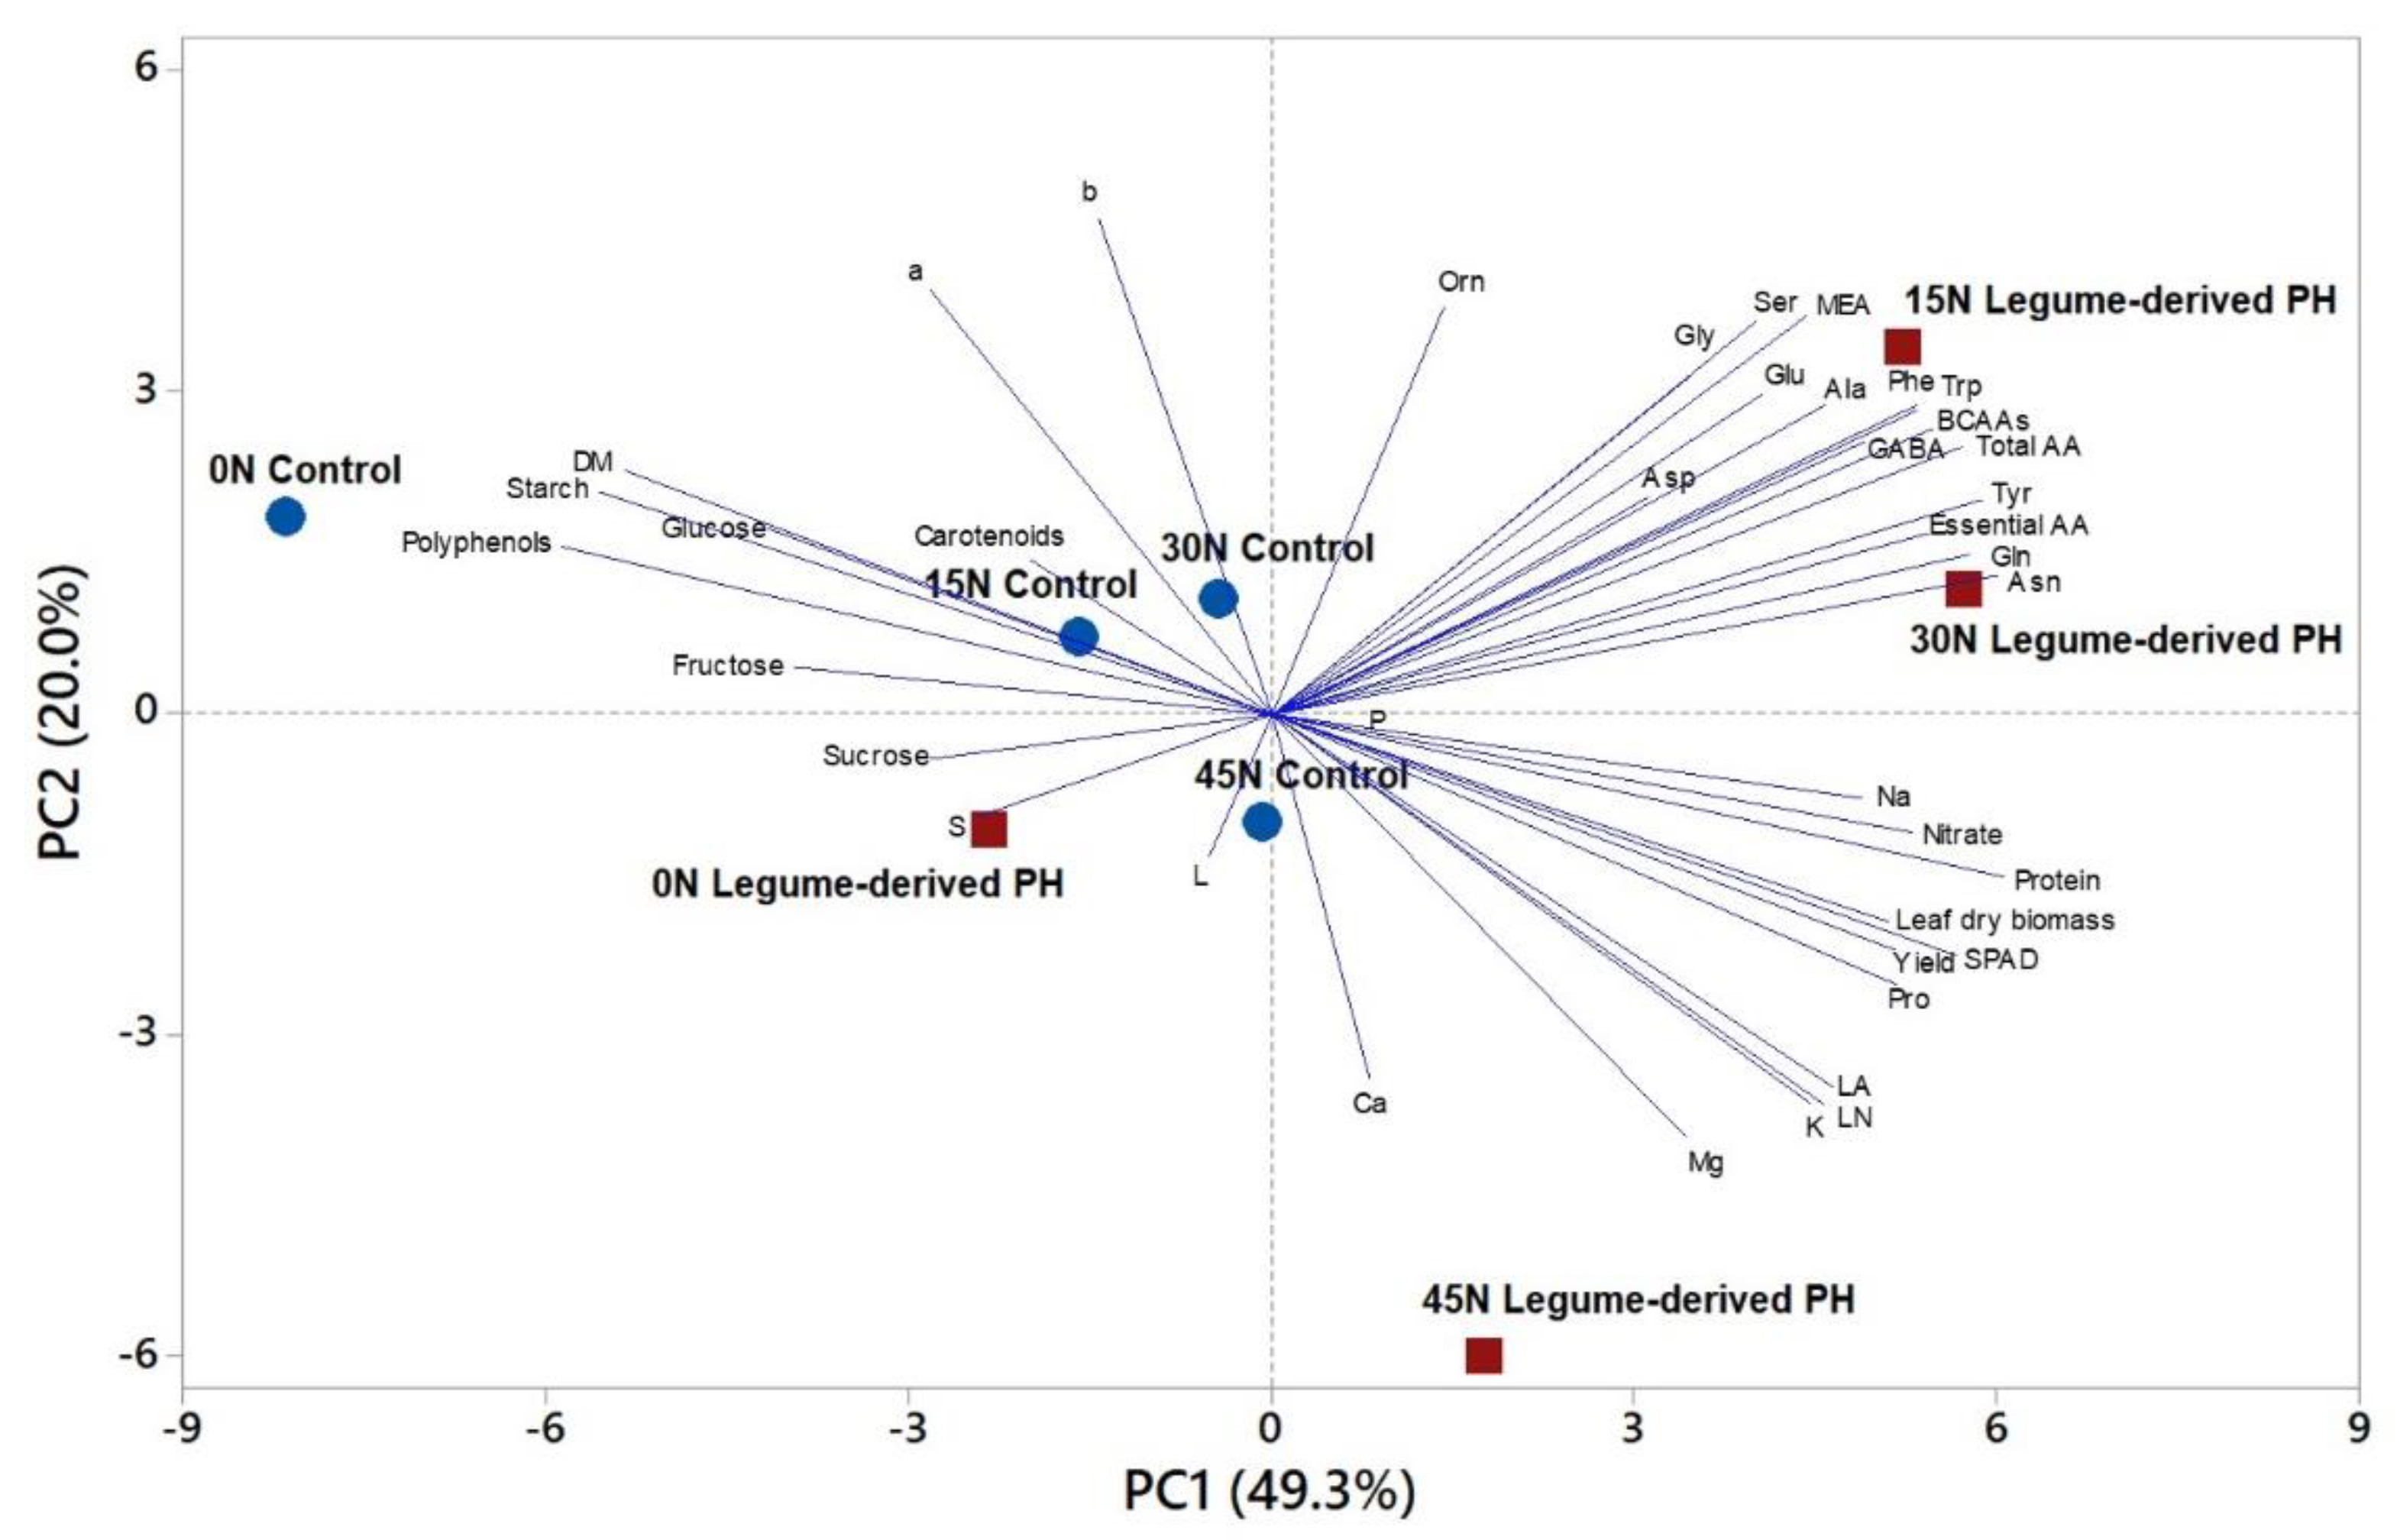
3.7. Principal Component Analysis

To obtain an in-depth overview of crop productivity, growth parameters, mineral profile as well as nutritional and functional quality traits of the studied baby spinach in response to nutrient N fertilization rate and PH-based biostimulant application a principal component analysis (PCA) was conducted for all the morpho-physiological and biochemical parameters measured and discussed above. The first three principal components (PCs) were related with eigen values higher than 1 and explained 79.9% of the total variance, with PC1, PC2, and PC3 accounting for 49.3%, 20.0%, and 10.7%, respectively (data not shown).
The increase in fertilization rate and PH-based biostimulant contributed to the clear separation of PC1, whereas the distribution on PC2 was more linked to an efficient use of N with the 15 N–45 N control plants and 0 N + PH concentrated at the axes’ intersection, and PH treated plants at 15 N and 30 N in the positive side of PC2 in the upper right quadrant (Figure 4). On the contrary, 0 N untreated control was isolated in the negative side of PC1 in the upper left quadrant, while 45 N + PH was located in the negative side of PC2 in the lower right quadrant (Figure 4). PC1 was positively correlated to total amino acids, in particular the amides glutamine and asparagine, essential amino acids, BCAAs, and GABA, in addition to SPAD index, yield, leaf dry weight and nitrate (Figure 4). PC1 was also negatively correlated with polyphenols, starch, leaf DM percentage, glucose, and fructose. PC2 was positively correlated with the colorimetric parameters a* and b*, ornithine, MEA, serine and glycine; and negatively correlated with LN, LA and macronutrients (K, Ca, and Mg; Figure 4). In addition, spinach plants treated with 15 N and 30 N + PH positioned on the upper right quadrant of the PCA score plot, produced leaves of premium quality with high concentrations of total amino acids, and in particular essential amino acids. On the positive side of PC1, in particular in the lower right quadrant, plants treated with 45 N + PH were characterized by high leaf area and leaf number and beneficial macronutrients content, in particular K, Ca, and Mg. Both treatments 15 N and 30 N in untreated control plants were clustered together with 0 N + PH and were characterized by higher sugars, carotenoids, P, and S content. Finally, the untreated spinach plants grown at 0 N were positioned in the upper left quadrant and were characterized by high levels of polyphenols, starch, DM, glucose and fructose (Figure 4).

4. Discussion

Notwithstanding the high cost of nitrate and the well-known adverse environmental and health effects caused by its leaching into groundwater, it is the mineral nutrient that horticulture industry uses in the highest amount [58]. However, to meet food demands and, at the same time, enhance the sustainability of greenhouse systems, it is necessary to reduce the excessive inputs of N fertilizers, improving NUE and consequently maintaining reasonable yield and profit margin for the farmers [59]. The use of natural plant biostimulants including PH have been proven, when applied at low doses, to regulate and enhance the crop resources use efficiency (RUE), in addition to their ability to increase yields and abiotic stress tolerance [4,22,38,41]. It is therefore essential that we increase our knowledge of the possible “mode of action” of these biostimulants in controlling plant N economy even under reduced nutrient fertilization. In this view, we used Trainer® a commercial legume derived PH containing amino acids and soluble peptides able to stimulate N uptake and assimilation with a significant increase in crop productivity [38] for cultivating spinach plants at four different N-rates (0, 15, 30, and 45 kg ha−1).
The effectiveness of cluster heat map analysis for simultaneously analyzing and interpreting multiple morpho-functional traits has been reported previously in a series of research papers [4,52,60]. This was the case in the current study, since this analysis has introduced important information on the differences between all treatments. However, for having a quali-quantitative estimation of the efficacy of the legume derived PH plants compared to the respective control plants grown at different N fertilization rates, a different heat map analysis built in Excel by using the Logarithm base 2 (Log2) of ratio between the PH-treated and untreated plants has been introduced [4,48,61]. These analyses clearly evidenced remarkable changes under suboptimal N conditions, in particular at 15 and especially at 0 kg ha−1. The most surprising and evident quali-quantitative result was the strong decrease of leaf area, leaf dry matter, leaf dry weight and SPAD index that decreased spinach fresh yield and marketability. At 0 N, the product had the highest content of polyphenols. Polyphenols confer plants resistance to stress and pathogens and act as powerful antioxidants more than vitamins, since they can easily take part in redox reactions due to their capacity to transport protons and electrons [62,63]. Moreover, plants with low N rates showed also low content of amino acids except for alanine and GABA that were present at very high concentration as also found in jute plants under low N regime [4]. Storing N in the form of alanine through the NADH-GOGAT/AlaAT cycle saves ATP, which is limited under low N, otherwise consumed in higher amounts to assimilate N in glutamine and asparagine, which are more expensive reactions [64]. The decrease of ATPrelated to N starvation, in fact, can affect cytoplasmic pH because of the impairment of the H+ extrusion operated by H+-ATPase. However, the synthesis of alanine, from the decarboxylation of malate to pyruvate as a result of malic enzyme activity, and that of GABA, from the decarboxylation of glutamate, are proton-consuming reactions able to buffer acidosis and regulate cytoplasmic pH [4,65]. In case of relief from N starvation, the two amino acids can be converted in intermediates of citric acid cycle and used to increase the production of ATP [66]. Moreover, GABA has a well-known activity as ROS scavenger useful for the stabilization and protection of macromolecules and photosynthetic membranes [67,68]. In addition, at 15 kg ha−1 while polyphenols decreased, proteins and total amino acids, in particular the two amides glutamine and asparagine, efficient molecules for the transport of N to sink tissues, in particular to roots [69], strongly increased. The further increase of N rate (30 and 45 kg ha−1) strongly increased also glutamate and aspartate. The alpha-amino group of glutamate is transferred to and from other amino acids during the processes of transamination for the synthesis and catabolism of all other amino acids. The overall effect was a strong increase of leaf area, internodes length, leaf dry weight, SPAD index and, therefore, yield.
Foliar application of the legume-derived PH Trainer® (4 mL L−1) improved the status of plants even under suboptimal N rates (0 and 15 kg ha−1), stimulating stems elongation, as reflected by the reduction of compactness of plants, and leaves enlargement with a consequent increase of yield. Similarly, Trainer® application at four concentrations (0.375, 0.75, 1.5, and 3 mL L−1) increased shoot length in gibberellin-dwarf pea plants, similar to a gibberellin-like activity [38]. Colla et al. [38] demonstrated also that PH Trainer® was able to induce coleoptile elongation in detached corn (Zea mays L.) seedlings suggesting that this biostimulant could elicit also an auxin-like activity due to its high tryptophan content equal to 3 g kg−1 [41]. Tryptophan is the main active physiological precursor for the synthesis of indole-3-acetic acid (IAA), which has a crucial role in modulating not only shoot length but also primary root length, root hairs formation and root density, therefore orchestrating the final root architecture [70,71]. In addition, the synergistic action of peptides contained in the PH ‘Trainer®’ also contributed to the auxin- and/or gibberellin-like activities as proved by in vitro bioassays carried out by Ertani et al. [24] and Colla et al. [38]. The consequent modification/improvement of root architecture has been associated with a general increase of nutrient availability due to its better capacity to acquire, translocate and assimilate key macro- and micronutrients, as well as to monitor soil environmental conditions [24,69,72]. Colla et al. [38] described this phenomenon related to the PH-induced reshaping of root favoring N uptake and translocation as “nutrient acquisition response”. In particular, even at low N, PH ‘Trainer®’ was able to increase the gene expression of ferredoxin-GOGAT (Glt) in tomato roots [39], and, similarly, an alfalfa PH was able to enhance GS and NAD(P) H+-GOGAT in corn leaves [72]. Moreover, PH Trainer® was certainly responsible for the enhancement of root assimilation of K, Ca, and Mg and their translocation to shoots in spinach plants under 0 kg ha−1, as also seen in Rouphael et al. [23,28]. Magnesium, in particular, contributes to the stabilization of macromolecules, membranes, and cell walls, since it is involved, as cofactor, in fundamental enzyme activities such as kinases, H+-ATPase, polymerases and transaminases, and it is complexed with the porphyrin ring of chlorophylls and actively involved in the light activation of Calvin cycle enzymes [73,74]. In addition, PH induced in plants at 0, 15, and 30 kg ha−1 the remobilization of N reserves from roots both as nitrate and as amides and their translocation to shoot, consequently improving the leaf nutritional status and yield. The higher availability of Mg, amino acids and nitrate, in particular under 0 kg ha−1 suboptimal conditions, can contribute to improve photosynthesis through arestoration of photosynthetic proteins, in particular RUBISCO that constitutes more than 50% of soluble leaf proteins [75], and pigments, increasing the SPAD index and therefore the photochemical efficiency and activity of photosystem II (PSII) [76]. Moreover, the stimulation of CO2 fixation, together with oxidative pentose phosphate pathway, is crucial for providing metabolic precursors for amino acid synthesis via transaminases [77]. Colla et al. [38] also found that legume-derived PH treatment of tomato plants enhanced growth and N metabolism by improving photosynthetic CO2 assimilation and translocation of newly-synthetized soluble sugars via phloem to sink tissues. Consequently, it is possible that PH Trainer®, rendering the photosynthetic process, the translocation of photosynthates to growing leaves and roots and the synthesis of new amino acids more active, is able to decrease the photooxidative damages [78] and the production of reactive oxygen species (ROS). In these conditions, the synthesis of polyphenols in spinach decreased, also according to the protein competition model [79], proving the amelioration of low N related-physiological disorders by PH.
At 45 kg ha−1rate, PH Trainer® treatment changed plant shape and metabolism and the content of amino acids (GABA, alanine, proline, and branched chain amino acids) and polyphenols decreased. Only the amides glutamine and asparagine were still enhanced by the biostimulant at 45 kg ha−1 rate. The decrease of metabolites in leaves protecting photosystems from photo-oxidation and cytosol from acidosis increased the sensitivity to photo-inhibition, as proven by the return to the more compact shape with shorter internodes as already seen at 0 kg ha−1. In this view, spinach plants could use amides not only as N storage and transport compounds, but also as compatible compounds involved in osmotic adjustment and ROS scavengers for macromolecules protection [4].
Therefore, legume-derived protein hydrolysate was able to enhance yield, photosynthetic and color status, quality attributes, ions content and antioxidant activity of spinach plants as seen in perennial wall rocket [80], but, in particular, under suboptimal N conditions. While, the positive PH effect seen in suboptimal N conditions was reversed under luxury N condition with leaves losing their high premium quality while further increasing the amount of the anti-nutrient nitrate [81].

5. Conclusions

The urgent need to reduce the use of synthetic N fertilizers while increasing the NUE and maximizing crop productivity is a great challenge for modern agriculture [82]. At the moment, biostimulants represent a promising strategy to boost sustainable agricultural production. Spinach plants were submitted to a factorial combination treatments accounting for different N fertilization levels and the influence of the PH-biostimulant Trainer®. Our results showed that suboptimal N treatment strongly affected growth parameters, visual shape and marketable fresh yield, but increased the nutritional and nutraceutical value of plants. The increase of N even only at 15 kg ha−1 strongly improved the plants performance parameters and N content indicating the priority role of N fertilization. The foliar application of PH increased the marketable yield of spinach plants even under suboptimal N treatment. This was associated to the presence of amino acids and small peptides in PH Trainer®, which act as signaling molecules eliciting auxin- and/or gibberellin-like activities on both leaves and roots, thus inducing a “nutrient acquisition response” that enhances nutrients acquisition and assimilation. Unexpectedly, the application of PH at high N-rates (45 kg ha−1) increased the levels of nitrate while changing the distribution patterns of metabolites, increasing amides while decreasing the content of GABA, alanine, essential amino acids and polyphenols, thus determining a strong reduction of spinach antioxidant properties as well as the functional quality. Finally, the application of plant biostimulants have often being considered as a useful tool for alleviating/reducing the accumulation of anti-nutrients such as nitrate, due to the stimulation of assimilatory nitrate reduction pathway. However, in the case of spinach plants, the reduction of nitrate content related to biostimulant application did not occur. Moreover, while at low or intermediate N rates there were clear benefits of PH for the plants, in particular related to yield, nutritional and nutraceutical properties of the produce. Instead, when PH was applied concomitantly with luxury N rates it worsened the plants premium quality by reducing its antioxidant and nutritional content.
The results of this study underlined the benefits of using legume derived protein hydrolysate in spinach production to improve N-nutritional status and marketable yield even under suboptimal N regimes, and they can potentially be directly translated into the field for designing new protocols for horticultural crops cultivation aimed at reducing N inputs, minimizing pollution and increasing sustainability.

Author Contributions

Conceptualization, Y.R. and G.C.; methodology, Y.R.; software, A.P.; formal analysis, G.M.F., E.D.A., C.E.-N., M.G.,M.C., and A.P.; investigation, E.C., M.M.; resources, H.R.; data curation, P.C., G.M.F., E.D.A., C.E.-N., M.G., and A.P.; writing—original draft preparation, P.C. and Y.R.; writing—review and editing, P.C, Y.R., M.C.K., M.C., and G.C.; visualization, P.C and Y.R; supervision, G.C. and Y.R.; project administration, Y.R.; funding acquisition, H.R., G.C., and Y.R.

Funding

This work was funded by Regione Campania LottaallePatologieOncologicheprogettoiCURE (CUP B21C17000030007—SURF 17061BP000000008).

Acknowledgments

The authors are grateful for Angelo Pedalino for his assistance in the greenhouse experiment.

Conflicts of Interest

The authors declare no conflict of interest.

References

  1. FAO. Global Agriculture towards 2050, High-Level Expert Forum, How to Feed the World 2050, Rome 12–13 October 2009. Food and Agriculture Organization of United Nations (FAO). 2009. Available online: http://www.fao.org/fileadmin/templates/wsfs/docs/Issues_papers/HLEF2050_Global_Agriculture.pdf (accessed on 24 June 2019).
  2. Tilman, D.; Balzer, C.; Hill, J.; Befort, B.L. Global food demand and the sustainable intensification of agriculture. PNAS 2011, 108, 20260–20264. [Google Scholar] [CrossRef] [PubMed] [Green Version]
  3. Lassaletta, L.; Billen, G.; Garnier, J.; Bouwman, L.; Velazquez, E.; Mueller, N.D.; Gerber, J.S. Nitrogen use in the global food system: Past trends and future trajectories of agronomic performance, pollution, trade, and dietary demand. Environ. Res. Lett. 2016, 11, 095007. [Google Scholar] [CrossRef]
  4. Carillo, P.; Colla, G.; El-Nakhel, C.; Bonini, P.; D’Amelia, L.; Dell’Aversana, E.; Pannico, A.; Giordano, M.; Sifola, M.I.; Kyriacou, M.C.; et al. Biostimulant application with a tropical plant extract enhances Corchorus olitorius adaptation to sub-optimal nutrient regimens by improving physiological parameters. Agronomy 2019, 9, 249. [Google Scholar] [CrossRef]
  5. Rouphael, Y.; Colla, G. The influence of drip irrigation or subirrigation on zucchini squash grown in closed-loop substrate culture with high and low nutrient solution concentrations. HortScience 2009, 44, 306–311. [Google Scholar] [CrossRef]
  6. Colla, G.; Cardona Suárez, C.M.; Cardarelli, M.; Rouphael, Y. Improving nitrogen use efficiency in melon by grafting. HortScience 2010, 45, 559–565. [Google Scholar] [CrossRef]
  7. Colla, G.; Rouphael, Y.; Mirabelli, C.; Cardarelli, M. Nitrogen-use efficiency traits of mini-watermelon in response to grafting and nitrogen-fertilization doses. J. Plant Nutr. Soil Sci. 2011, 174, 933–941. [Google Scholar] [CrossRef]
  8. Gupta, S.K.; Gupta, A.B.; Gupta, R. Pathophysiology of nitrate toxicity in humans in view of the changing trends of the global nitrogen cycle with special reference to India. In The Indian nitrogen Assessment; Abrol, Y.P., Adhya, T.K., Aneja, V.P., Eds.; Elsevier: Amsterdam, The Netherlands, 2017; pp. 459–468. [Google Scholar] [CrossRef]
  9. Lassaletta, L.; Billen, G.; Grizzetti, B.; Anglade, J.; Garnier, J. 50 year trends in nitrogen use efficiency of world cropping systems: The relationship between yield and nitrogen input to cropland. Environ. Res. Lett. 2014, 9, 105011. [Google Scholar] [CrossRef]
  10. Sutton, M.A.; Bleeker, A.; Howard, C.M.; Bekunda, M.; Grizzetti, B.; de Vries, W.; van Grinsven, H.J.M.; Abrol, Y.P.; Adhya, T.K.; Billen, G.; et al. Our Nutrient World: The challenge to produce more food and energy with less pollution. Cent. Ecol. Hydrol. 2013, 8, 95–108. [Google Scholar]
  11. Aires, A.; Carvalho, R.; Rosa, E.A.S.; Saavedra, M.J. Effects of agriculture production systems on nitrate and nitrite accumulation on baby-leaf salads. Food Sci. Nutr. 2013, 1, 3–7. [Google Scholar] [CrossRef] [PubMed]
  12. Colla, G.; Kim, H.J.; Kyriacou, M.C.; Rouphael, Y. Nitrate in fruits and vegetables. Sci. Hortic. 2018, 237, 231–238. [Google Scholar] [CrossRef]
  13. Kyriacou, M.C.; Rouphael, Y. Towards a new definition of quality for fresh fruits and vegetables. Sci. Hortic. 2018, 234, 463–469. [Google Scholar] [CrossRef]
  14. Santamaria, P. Nitrate in vegetables: Toxicity, content, intake and EC regulation. Sci. Food Agric. 2006, 86, 10–17. [Google Scholar] [CrossRef]
  15. Fallovo, C.; Rouphael, Y.; Rea, E.; Battistelli, A.; Colla, G. Nutrient solution concentration and growing season affect yield and quality of Lactuca sativa L. var. acephala in floating raft culture. J. Sci. Food Agric. 2009, 89, 1682–1689. [Google Scholar] [CrossRef]
  16. Hirel, B.; Le Gouis, J.; Ney, B.; Gallais, A. The challenge of improving nitrogen use efficiency in crop plants: Towards a more central role for genetic variability and quantitative genetics within integrated approaches. J. Exp. Bot. 2007, 58, 2369–2387. [Google Scholar] [CrossRef] [PubMed]
  17. Hawkesford, M.; Kopriva, S.; De Kok, L. Nutrient use efficiency in plants–Concepts and approaches. In Plant Ecophysiol; Springer International Publishing: Basel, Switzerland, 2014. [Google Scholar] [CrossRef]
  18. Erisman, J.W.; Leach, A.; Bleeker, A.; Atwell, B.; Cattaneo, L.; Galloway, J. An integrated approach to a nitrogen useefficiency (NUE) indicator for the food production–Consumption Chain. Sustainability 2018, 10, 925. [Google Scholar] [CrossRef]
  19. Annunziata, M.G.; Carillo, P.; Fuggi, A.; Troccoli, A.; Woodrow, P. Metabolic profiling of cauliflower under traditional and reduced tillage systems. Aust. J. Crop Sci. 2013, 7, 1317–1323. [Google Scholar]
  20. Rouphael, Y.; Colla, G. Synergistic biostimulatory action: Designing the next generation of plant biostimulants for sustainable agriculture. Front. Plant Sci. 2018, 9. [Google Scholar] [CrossRef]
  21. Fiorentino, N.; Ventorino, V.; Woo, S.L.; Pepe, O.; De Rosa, A.; Gioia, L.; Romano, I.; Lombardi, N.; Napolitano, M.; Colla, G.; et al. Trichoderma-based biostimulants modulate rhizosphere microbial populations and improve N uptake efficiency, yield and nutritional quality of leafy vegetables. Fron. Plant Sci. 2018, 9, 743. [Google Scholar] [CrossRef]
  22. Colla, G.; Hoagland, L.; Ruzzi, M.; Cardarelli, M.; Bonini, P.; Canaguier, R.; Rouphael, Y. Biostimulant action of protein hydrolysates: Unraveling their effects on plant physiology and microbiome. Front. Plant Sci. 2017, 8, 2202. [Google Scholar] [CrossRef]
  23. Rouphael, Y.; Kyriacou, M.C.; Petropoulos, S.A.; De Pascale, S.; Colla, G. Improving vegetable quality in controlled environments. Sci. Hortic. 2018, 234, 275–289. [Google Scholar] [CrossRef]
  24. Ertani, A.; Cavani, L.; Pizzeghello, D.; Brandellero, E.; Altissimo, A.; Ciavatta, C.; Nardi, S. Biostimulant activity of two protein hydrolyzates in the growth and nitrogen metabolism of maize seedlings. J. Plant Nutr. Soil Sci. 2009, 172, 237–244. [Google Scholar] [CrossRef]
  25. Ertani, A.; Schiavon, M.; Muscolo, A.; Nardi, S. Alfalfa plant-derived biostimulant stimulate short-term growth of salt stressed Zea mays L. plants. Plant Soil 2013, 64, 145–158. [Google Scholar] [CrossRef]
  26. Colla, G.; Nardi, S.; Cardarelli, M.; Ertani, A.; Lucini, L.; Canaguier, R.; Rouphael, Y. Protein hydrolysates as biostimulants in horticulture. Sci. Hortic. 2015, 196, 28–38. [Google Scholar] [CrossRef]
  27. Colla, G.; Cardarelli, M.; Bonini, P.; Rouphael, Y. Foliar applications of protein hydrolysate, plant and seaweed extracts increase yield but differentially modulate fruit quality of greenhouse tomato. HortScience 2017, 52, 1214. [Google Scholar] [CrossRef]
  28. Rouphael, Y.; Colla, G.; Giordano, M.; El-Nakhel, C.; Kyriacou, M.C.; De Pascale, S. Foliar applications of a legume-derived protein hydrolysate elicit dose-dependent increases of growth, leaf mineral composition, yield and fruit quality in two greenhouse tomato cultivars. Sci. Hortic. 2017, 226, 353–360. [Google Scholar] [CrossRef]
  29. Ertani, A.; Pizzeghello, D.; Francioso, O.; Sambo, P.; Sanchez-Cortes, S.; Nardi, S. Capsicum chinensis L. growth and nutraceutical properties are enhanced by biostimulants in a long-term period: Chemical and metabolomic approaches. Front. Plant Sci. 2014, 5, 375. [Google Scholar] [CrossRef]
  30. Zhu, K.; Zhou, H.; Qian, H. Antioxidant and free radical-scavenging activities of wheat germ protein hydrolysates (WGPH) prepared with alcalase. Process Biochem. 2006, 41, 1296–1302. [Google Scholar] [CrossRef]
  31. Lucini, L.; Rouphael, Y.; Cardarelli, M.; Canaguier, R.; Kumar, P.; Colla, G. The effect of a plant-derived biostimulant on metabolic profiling and crop performance of lettuce grown under saline conditions. Sci. Hortic. 2015, 182, 124–133. [Google Scholar] [CrossRef]
  32. Lucini, L.; Rouphael, Y.; Cardarelli, M.; Bonini, P.; Baffi, C.; Colla, G. A vegetal biopolymer-based biostimulant promoted root growth in melon while triggering brassinosteroids and stress-related compounds. Front. Plant Sci. 2018, 9, 472. [Google Scholar] [CrossRef]
  33. Halpern, M.; Bar-Tal, A.; Ofek, M.; Minz, D.; Muller, T.; Yermiyahu, U. The use of biostimulants for enhancing nutrient uptake. Adv. Agron. 2015, 130, 141–174. [Google Scholar] [CrossRef]
  34. Li, X.; Zeng, R.; Liao, H. Improving crop nutrient efficiency through root architecture modifications. J. Integr. Plant Biol. 2016, 58, 193–202. [Google Scholar] [CrossRef] [PubMed]
  35. Calvo, P.; Nelson, L.; Kloepper, J.W. Agricultural uses of plant biostimulants. Plant Soil 2014, 383, 3–41. [Google Scholar] [CrossRef] [Green Version]
  36. Du Jardin, P. Plant biostimulants: Definition; concept, main categories and regulation. Sci. Hortic. 2015, 196, 3–14. [Google Scholar] [CrossRef]
  37. Carillo, P.; Morrone, B. Converting Residual Biomasses into Energy through Anaerobic Digestion. In Municipal Solid Waste: Management Strategies, Challenges and Future Directions; Tzortzakis, N., Ed.; Nova Science Publishers: Hauppauge, NY, USA, 2017; pp. 271–292. [Google Scholar]
  38. Colla, G.; Rouphael, Y.; Canaguier, R.; Svecova, E.; Cardarelli, M. Biostimulant action of a plant-derived protein hydrolysate produced through enzymatic hydrolysis. Front. Plant Sci. 2014, 5, 448. [Google Scholar] [CrossRef] [PubMed] [Green Version]
  39. Sestili, F.; Rouphael, Y.; Cardarelli, M.; Pucci, A.; Bonini, P.; Canaguier, R.; Colla, G. Protein hydrolysate stimulates growth in tomato coupled with N-dependent gene expression involved in N assimilation. Front. Plant Sci. 2018, 9, 1233. [Google Scholar] [CrossRef] [PubMed]
  40. Colonna, E.; Rouphael, Y.; Barbieri, G.; De Pascale, S. Nutritional quality of leafy vegetables harvested at two light intensities. Food Chem. 2016, 199, 702–710. [Google Scholar] [CrossRef]
  41. Rouphael, Y.; Giordano, M.; Cardarelli, M.; Cozzolino, E.; Mori, M.; Kyriacou, M.C.; Bonini, P.; Colla, G. Plant and seaweed-based extracts increase yield but differentially modulate nutritional quality of greenhouse spinach through biostimulant Action. Agronomy 2018, 8, 126. [Google Scholar] [CrossRef]
  42. Biemond, H.; Vos, J.; Struik, P. Effects of nitrogen on accumulation and partitioning of dry matter and nitrogen of vegetables. Spinach. Neth. J. Agric. Sci. 1996, 44, 227–239. [Google Scholar]
  43. Smolders, E.; Buysse, J.; Merckx, R. Growth analysis of soil-grown spinach plants at different N-regimes. Plant Soil 1993, 154, 73–80. [Google Scholar] [CrossRef]
  44. Paul, K.; Sorrentino, M.; Lucini, L.; Rouphael, Y.; Cardarelli, M.; Bonini, P.; Miras Moreno, M.B.; Reynaud, H.; Canaguier, R.; Trtílek, M.; et al. A combined phenotypic and metabolomic approach for elucidating the biostimulant action of a plant-derived protein hydrolysate on tomato grown under limited water availability. Front. Plant Sci. 2019, 10, 493. [Google Scholar] [CrossRef]
  45. Kumar, P.; Lucini, L.; Rouphael, Y.; Cardarelli, C.; Kalunke, R.M.; Colla, G. Insight into the role of grafting and arbuscularmycorrhiza on cadmium stress tolerance in tomato. Front. Plant Sci. 2015, 6, 477. [Google Scholar] [CrossRef]
  46. Bremner, J.M. Total nitrogen. In Methods of Soil Analysis; Black, C.A., Evans, D.D., White, D.D., Ensminger, E., Clark, F.E., Eds.; American Society of Agronomy: Madison, WI, USA, 1965; pp. 149–1178. [Google Scholar] [CrossRef]
  47. Kyriacou, M.C.; El-Nakhel, C.; Graziani, G.; Pannico, A.; Soteriou, G.A.; Giordano, M.; Ritieni, A.; De Pascale, S.; Rouphael, Y. Functional quality in novel food sources: Genotypic variation in the nutritive and phytochemical composition of thirteen microgreens species. Food Chem. 2019, 277, 107–118. [Google Scholar] [CrossRef]
  48. Carillo, P.; Cirillo, C.; De Micco, V.; Arena, C.; De Pascale, S.; Rouphael, Y. Morpho-anatomical, physiological and biochemical adaptive responses to saline water of Bougainvillea spectabilis Willd. trained to different canopy shapes. Agric. Water Manag. 2019, 212, 12–22. [Google Scholar] [CrossRef]
  49. Annunziata, M.G.; Attico, A.; Woodrow, P.; Oliva, M.A.; Fuggi, A.; Carillo, P. An improved fluorimetric HPLC method for quantifying tocopherols in Brassica rapa L. subsp. sylvestris after harvest. J. Food Comp. Anal. 2012, 27, 145–150. [Google Scholar] [CrossRef]
  50. Wellburn, A.R. The spectral determination of chlorophylls a and b, as well as total carotenoids, using various solvents with spectrophotometers of different resolution. J. Plant Physiol. 1994, 144, 307–313. [Google Scholar] [CrossRef]
  51. Singleton, V.L.; Orthofer, R.; Lamuela-Raventós, R.M. Analysis of total phenols and other oxidation substrates and antioxidants by means of Folin-Ciocalteu reagent. In Methods in Enzymology; Academic Press: Cambridge, MA, USA, 1999; Volume 299, pp. 152–178. [Google Scholar] [CrossRef]
  52. Carillo, P.; Raimondi, G.; Kyriacou, M.C.; Pannico, A.; El-Nakhel, C.; Cirillo, V.; Colla, G.; De Pascale, S.; Rouphael, Y. Morpho-physiological and homeostatic adaptive responses triggered by omeprazole enhance lettuce tolerance to salt stress. Sci. Hortic. 2019, 249, 22–30. [Google Scholar] [CrossRef]
  53. Ferchichi, S.; Hessini, K.; Dell’Aversana, E.; D’Amelia, L.; Woodrow, P.; Ciarmiello, L.F.; Fuggi, A.; Carillo, P. Hordeum vulgare and Hordeum maritimum respond to extended salinity stress displaying different temporal accumulation pattern of metabolites. Funct. Plant Biol. 2018, 11, 1096–1109. [Google Scholar] [CrossRef]
  54. Woodrow, P.; Ciarmiello, L.F.; Annunziata, M.G.; Pacifico, S.; Iannuzzi, F.; Mirto, A.; D’Amelia, L.; Dell’Aversana, E.; Piccolella, S.; Fuggi, A.; et al. Durum wheat seedling responses to simultaneous high light and salinity involve a fine reconfiguration of amino acids and carbohydrate metabolism. Physiol. Plant 2017, 159, 290–312. [Google Scholar] [CrossRef]
  55. Bates, L.S.; Waldren, R.P.; Teare, I.D. Rapid determination of free proline for water-stress studies. Plant Soil. 1973, 39, 205–207. [Google Scholar] [CrossRef]
  56. Ciarmiello, L.F.; Piccirillo, P.; Carillo, P.; De Luca, A.; Woodrow, P. Determination of the genetic relatedness of fig (Ficuscarica L.) accessions using RAPD fingerprint and their agro-morphological characterization. S. Afr. J. Bot. 2015, 97, 40–47. [Google Scholar] [CrossRef]
  57. Mirto, A.; Iannuzzi, F.; Carillo, P.; Ciarmiello, L.F.; Woodrow, P.; Fuggi, A. Metabolic characterization and antioxidant activity in sweet cherry (Prunusavium L.) Campania accessions: Metabolic characterization of sweet cherry accessions. Food Chem. 2018, 240, 559–566. [Google Scholar] [CrossRef]
  58. Ganeshamurthy, A.N.; Rupa, T.R.; Kalaivanan, D.; Radha, T.K. Nitrogen management paradigm in horticulture systems in India. In The Indian Nitrogen Assessment; Abrol, Y.P., Adhya, T.K., Aneja, V.P., Eds.; Elsevier: Amsterdam, The Netherlands, 2017; pp. 133–147. [Google Scholar] [CrossRef]
  59. Hirel, B.; Tétu, T.; Lea, P.J.; Dubois, F. Improving nitrogen use efficiency in crops for sustainable agriculture. Sustainability 2011, 9, 1452–1485. [Google Scholar] [CrossRef]
  60. Cirillo, C.; De Micco, V.; Arena, C.; Carillo, P.; Pannico, A.; De Pascale, S.; Rouphael, Y. Biochemical, physiological and anatomical mechanisms of adaptation of Callistemon citrinus and Viburnum lucidum to NaCl and CaCl2 salinization. Front. Plant Sci. 2019, 10, 742. [Google Scholar] [CrossRef]
  61. Rouphael, Y.; Raimondi, G.; Lucini, L.; Carillo, P.; Kyriacou, M.C.; Colla, G.; Cirillo, V.; Pannico, A.; El-Nakhel, C.; De Pascale, S. Physiological and metabolic responses triggered by omeprazole improve tomato plant tolerance to NaCl stress. Front. Plant Sci. 2018, 9, 249. [Google Scholar] [CrossRef]
  62. Shahidi, F.; Ambigaipalan, P. Phenolics and polyphenolics in foods, beverages and spices: Antioxidant activity and health effects—A review. J. Funct. Foods 2015, 18, 820–897. [Google Scholar] [CrossRef]
  63. Carillo, P.; Kyriacou, M.C.; El-Nakhel, C.; Pannico, A.; dell’Aversana, E.; D’Amelia, L.; Colla, G.; Caruso, G.; De Pascale, S.; Rouphael, Y. Sensory and functional quality characterization of protected designation of origin ‘Piennolo del Vesuvio’ cherry tomato landraces from Campania-Italy. Food Chem. 2019, 292, 166–175. [Google Scholar] [CrossRef]
  64. Diab, H.; Limami, A.M. Reconfiguration of N metabolism upon hypoxia stress and recovery: Roles of alanine aminotransferase (AlaAT) and glutamate dehydrogenase (GDH). Plants 2016, 5, 25. [Google Scholar] [CrossRef]
  65. Carillo, P. GABA Shunt in durum wheat. Front. Plant Sci. 2018, 9, 100. [Google Scholar] [CrossRef]
  66. Bouché, N.; Fromm, H. GABA in plants: Just a metabolite? Trends Plant Sci. 2004, 9, 110–115. [Google Scholar] [CrossRef]
  67. Molina-Rueda, J.J.; Garrido-Aranda, A.; Gallardo, F. Glutamate decarboxylase. In Amino Acids in Higher Plants; D’Mello, J.P.F., Ed.; CABI: Wallingford, UK, 2015. [Google Scholar]
  68. Liu, C.; Zhao, L.; Yu, G. The dominant glutamic acid metabolic flux to produce γ-amino butyric acid over proline in Nicotianatabacum leaves under water stress relates to its significant role in antioxidant activity. J. Integr. Plant Biol. 2011, 53, 608–618. [Google Scholar] [CrossRef]
  69. Lea, P.J.; Sodek, L.; Parry, M.A.J.; Shewry, P.R.; Halford, N.G. Asparagine in plants. Ann. Appl. Biol. 2007, 150, 1–26. [Google Scholar] [CrossRef]
  70. Fukaki, H.; Tasaka, M. Hormone interactions during lateral root formation. Plant Mol. Biol. 2008, 69, 437. [Google Scholar] [CrossRef]
  71. Overvoorde, P.; Fukaki, H.; Beeckman, T. Auxin control of root development. Cold Spring HarbPerspect Biol. 2010, 2, a001537. [Google Scholar] [CrossRef]
  72. Schiavon, M.; Ertani, A.; Nardi, S. Effects of an alfalfa protein hydrolysate on the gene expression and activity of enzymes of the tricarboxylic acid (TCA) cycle and nitrogen metabolism in Zea mays L. J. Agric. Food Chem. 2008, 56, 11800–11808. [Google Scholar] [CrossRef]
  73. Buchanan, B.B. The carbon (formerly dark) reactions of photosynthesis. Photosynthesis Res. 2016, 128, 215–217. [Google Scholar] [CrossRef]
  74. Guo, W.; Nazim, H.; Liang, Z.; Yang, D. Magnesium deficiency in plants: An urgent problem. Crop J. 2016, 4, 83–91. [Google Scholar] [CrossRef] [Green Version]
  75. Sudhakar, P.; Latha, P.; Reddy, P.V. Chapter 4–Photosynthetic rates. In Phenotyping Crop Plants for Physiological and Biochemicaltraits; Sudhakar, P., Latha, P., Reddyeds, P.V., Eds.; Academic Press: Cambridge, MA, USA, 2016; pp. 33–39. [Google Scholar] [CrossRef]
  76. Bassi, D.; Menossi, M.; Mattiello, L. Nitrogen supply influences photosynthesis establishment along the sugarcane leaf. Sci. Rep. 2018, 8, 2327. [Google Scholar] [CrossRef] [Green Version]
  77. Esposito, S.; Carillo, P.; Carfagna, S. Ammonium metabolism stimulation of glucose-6P dehydrogenase and phosphoenolpyruvate carboxylase in young barley roots. J. Plant Physiol. 1998, 153, 61–66. [Google Scholar] [CrossRef]
  78. Zhao, L.S.; Li, K.; Wang, Q.M.; Song, X.Y.; Su, H.N.; Xie, B.B.; Zhang, X.Y.; Huang, F.; Chen, X.L.; Zhou, B.C.; et al. Nitrogen starvation impacts the photosynthetic performance of Porphyridium cruentum as revealed by chlorophyll a fluorescence. Sci. Rep. 2017, 7, 8542. [Google Scholar] [CrossRef]
  79. Jones, C.G.; Hartley, S.E. A protein competition model of phenolic allocation. Oiko 1999, 86, 27–44. [Google Scholar] [CrossRef]
  80. Caruso, G.; De Pascale, S.; Cozzolino, E.; Giordano, M.; El-Nakhel, C.; Cuciniello, A.; Cenvinzo, V.; Colla, G.; Rouphael, Y. Protein hydrolysate or plant extract-based biostimulants enhanced yield and quality performances of greenhouse perennial wall rocket grown in different seasons. Plants 2019, 8, 208. [Google Scholar] [CrossRef]
  81. Rouphael, Y.; Kyriacou, M.C.; Carillo, P.; Pizzolongo, F.; Romano, R.; Sifola, M.I. Chemical eustress elicits tailored responses and enhances the functional quality of novel food Perilla Frutescens. Molecules 2019, 24, 185. [Google Scholar] [CrossRef]
  82. Rossini, F.; Provenzano, M.E.; Sestili, F.; Ruggeri, R. Synergistic effect of sulfur and nitrogen in the organic and mineral fertilization of durum wheat: Grain yield and quality traits in the Mediterranean environment. Agronomy 2018, 8, 189. [Google Scholar] [CrossRef]
Figure 1. Effects of nitrogen (N) fertilization rate and protein hydrolysate-based biostimulant application on marketable fresh yield (A) and leaf dry biomass (B) of greenhouse spinach (cv. Platypus RZ). Different letters indicate significant differences according to Duncan’s multiple-range test (p = 0.05). The values are means of three replicates. Vertical bars indicate ± standard error of means.
Agronomy 09 00450 g001
Figure 2. heat map analysis summarizing plant responses to different fertilization rates (0, 15, 30, and 45 kg ha−1) and protein hydrolysate-based biostimulant application. The figure was generated using the https://biit.cs.ut.ee/clustvis/online program package with Euclidean distance as the similarity measure and hierarchical clustering with complete linkage.
Agronomy 09 00450 g002
Figure 3. Heat map analysis summarizingplant response to different N fertilization rates concentration (0, 15, 30, and 45 kg ha−1) and protein hydrolysate-based biostimulant application. Results were calculated as Logarithm base 2 (Log2) of legume derived PH plants/respective control plants grown at different N fertilization rates, andare visualized using a false color scale with red indicating an increase and blue a decrease. White squares indicate no differences.
Agronomy 09 00450 g003
Figure 4. Principal component loading plot and scores of principal component analysis (PCA) of growth parameters, mineral elements, SPAD index, starch, soluble carbohydrates, carotenoids, polyphenols, amino acids profile, and total amino acids in spinach (cv. Platypus RZ) leaves treated with different N fertilization rates (0, 15, 30, and 45 kg ha−1) and legume derived PH-based biostimulant.
Agronomy 09 00450 g004
Table 1. Leaf number, total leaf area and leaf dry matter percentage of greenhouse spinach (cv. Platypus RZ) in relation to N fertilization rate and protein hydrolysate-based biostimulant application.
Source of VarianceLeaf NumberLeaf AreaLeaf Dry Matter
(no. plant−1)(cm2 plant−1)(%)
Nitrogen (kg ha−1) (N)
06.9 ± 0.363.6 ± 6.7 c9.8 ± 0.6 a
157.1 ± 0.168.4 ± 5.3 c8.6 ± 0.3 b
307.3 ± 0.287.1 ± 4.9 b8.5 ± 0.3 b
457.6 ± 0.297.5 ± 6.5 a8.1 ± 0.2 b
NS******
Biostimulant (B)
Control6.9 ± 0.168.3 ± 5.09.1 ± 0.4
Legume-derived PH7.6 ± 0.190.0 ± 4.58.4 ± 0.1
t-test0.0020.0040.094
N × B
0N Control6.4 ± 0.249.3 ± 0.910.7 ± 0.9
15N Control6.9 ± 0.156.8 ± 1.58.8 ± 0.5
30N Control7.0 ± 0.079.0 ± 4.58.8 ± 0.7
45N Control7.2 ± 0.188.2 ± 3.98.1 ± 0.4
0N Legume-derived PH7.5 ± 0.477.9 ± 4.78.9 ± 0.1
15N Legume-derived PH7.3 ± 0.179.9 ± 2.08.4 ± 0.3
30N Legume-derived PH7.6 ± 0.495.1 ± 5.78.3 ± 0.1
45N Legume-derived PH8.0 ± 0.1106.9 ± 10.48.0 ± 0.3
NSNSNS
NS, *** Nonsignificant or significant at p ≤ 0.001, respectively. Different letters within each column indicate significant differences according to Duncan’s multiple-range test (p = 0.05). Biostimulant application main effects were compared by Student’s t-test. All data are expressed as mean ± standard error, n = 3.
Table 2. Soil Plant Analysis Development (SPAD) index and Hunter color parameters L* (brightness), a* (+a*= red; a* = green) and b* (+b* = yellow; b*= blue) of greenhouse spinach (cv. Platypus RZ) in relation to N fertilization rate and protein hydrolysate-based biostimulant application.
Source of VarianceSPAD IndexL*a*b*
33 DAS41 DAS48 DAS
Nitrogen (kg ha−1) (N)
039.92 ± 0.5 d40.61 ± 0.5 d41.11 ± 0.8 d39.22 ± 0.813.78 ± 0.318.61 ± 0.5
1543.36 ± 0.5 c43.65 ± 0.6 c44.55 ± 0.4 c38.60 ± 0.413.79 ± 0.219.14 ± 0.5
3044.56 ± 0.6 b45.51 ± 0.6 b46.12 ± 0.4 b39.58 ± 0.713.88 ± 0.618.68 ± 0.8
4545.12 ± 0.6 a46.95 ± 0.5 a47.85 ± 0.4 a40.11 ± 1.413.50 ± 0.518.16 ± 1.1
*********NSNSNS
Biostimulant (B)
Control42.08 ± 0.643.13 ± 0.843.94 ± 0.939.70 ± 0.713.93 ± 0.318.89 ± 0.6
Legume-derived PH44.40 ± 0.745.23 ± 0.745.88 ± 0.739.05 ± 0.513.54 ± 0.218.41 ± 0.4
t-test0.0160.0500.0910.4690.3230.519
N × B
0N Control38.85 ± 0.339.57 ± 0.139.57 ± 0.738.78 ± 0.714.03 ± 0.418.93 ± 0.4
15N Control42.35 ± 0.342.39 ± 0.443.61 ± 0.238.71 ± 0.613.83 ± 0.019.34 ± 0.5
30N Control43.35 ± 0.144.36 ± 0.745.39 ± 0.240.09 ± 1.314.18 ± 1.118.83 ± 1.3
45N Control43.79 ± 0.346.19 ± 0.647.17 ± 0.541.23 ± 2.413.69 ± 1.018.44 ± 2.3
0N Legume-derived PH40.99 ± 0.541.64 ± 0.142.64 ± 0.139.66 ± 1.513.53 ± 0.418.28 ± 1.0
15N Legume-derived PH44.37 ± 0.444.91 ± 0.345.50 ± 0.238.49 ± 0.713.74 ± 0.418.93 ± 0.8
30N Legume-derived PH45.78 ± 0.246.65 ± 0.446.84 ± 0.639.06 ± 0.913.59 ± 0.618.53 ± 1.4
45N Legume-derived PH46.45 ± 0.447.71 ± 0.448.53 ± 0.138.99 ± 1.613.30 ± 0.317.88 ± 0.6
NSNSNSNSNSNS
NS, *** Nonsignificant or significant at p ≤ 0.001, respectively. Different letters within each column indicate significant differences according to Duncan’s multiple-range test (p = 0.05). Biostimulant application main effects were compared by Student’s t-test. All data are expressed as mean ± standard error, n = 3.
Table 3. Nitrate, phosphorus (P), potassium (K), calcium (Ca), magnesium (Mg), sulfur (S), and sodium concentrations (Na) of greenhouse spinach (cv. Platypus RZ) in relation to N fertilization rate and protein hydrolysate-based biostimulant application.
Source of VarianceProteinNitrateMineral Elements (g kg−1dw)
(g kg−1dw)(mg kg−1fw)PKCaMgSNa
Nitrogen (kg ha−1) (N)
025.6 ± 1.8 b968 ± 132 b3.80 ± 0.291.3 ± 3.61.81 ± 0.28.88 ± 0.7 c1.26 ± 0.11.08 ± 0.1
1529.9 ± 1.6 a3198 ± 254 a3.37 ± 0.297.8 ± 3.41.70 ± 0.110.57 ± 0.8 ab1.31 ± 0.11.13 ± 0.1
3031.1 ± 1.7 a3620 ± 224 a3.66 ± 0.298.3 ± 3.21.73 ± 0.19.75 ± 0.4 bc1.22 ± 0.11.31 ± 0.1
4531.4 ± 0.6 a3342 ± 348 a3.36 ± 0.2106.2 ± 2.21.75 ± 0.111.17 ± 0.6 a1.30 ± 0.01.25 ± 0.2
****NSNSNS**NSNS
Biostimulant (B)
Control27.4 ± 1.32478 ± 3673.33 ± 0.195.8 ± 2.71.64 ± 0.09.60 ± 0.51.35 ± 0.11.10 ± 0.1
Legume-derived PH31.6 ± 0.73044 ± 3933.76 ± 0.1101.0 ± 2.41.85 ± 0.110.59 ± 0.41.20 ± 0.01.28 ± 0.1
t-test0.0120.3150.0210.1630.0490.0500.0620.141
N × B
0N Control22.3 ± 2.2784 ± 3033.67 ± 0.386.6 ± 6.51.67 ± 0.07.70 ± 0.9 b1.18 ± 0.10.90 ± 0.1
15N Control27.9 ± 2.32854 ± 3873.06 ± 0.295.2 ± 4.21.70 ± 0.110.96 ± 1.4 a1.48 ± 0.11.06 ± 0.2
30N Control28.8 ± 2.83498 ± 4873.58 ± 0.497.6 ± 4.11.68 ± 0.09.65 ± 0.8 ab1.34 ± 0.21.13 ± 0.2
45N Control30.9 ± 0.22677 ± 2933.02 ± 0.1104.0 ± 2.31.51 ± 0.110.08 ± 0.7 ab1.39 ± 0.01.31 ± 0.4
0N Legume-derived PH28.9 ± 0.51091 ± 923.93 ± 0.296.0 ± 0.51.94 ± 0.410.06 ± 0.6 ab1.34 ± 0.21.27 ± 0.1
15N Legume-derived PH32.0 ± 1.93543 ± 123.68 ± 0.2100.5 ± 5.91.70 ± 0.110.18 ± 0.9 ab1.14 ± 0.11.20 ± 0.2
30N Legume-derived PH33.4 ± 0.93701 ± 2823.74 ± 0.399.1 ± 5.81.77 ± 0.19.85 ± 0.3 ab1.10 ± 0.01.48 ± 0.1
45N Legume-derived PH32.0 ± 1.34007 ± 2803.71 ± 0.2108.5 ± 3.71.99 ± 0.112.26 ± 0.6 a1.21 ± 0.01.18 ± 0.0
NSNSNSNSNS*NSNS
NS, *, **, *** Nonsignificant or significant at p ≤ at 0.05, 0.01 and 0.001, respectively. Different letters within each column indicate significant differences according to Duncan’s multiple-range test (p = 0.05). Biostimulant application main effects were compared by Student’s t-test. All data are expressed as mean ± standard error, n = 3.
Table 4. Starch, soluble carbohydrates, carotenoids and polyphenols contents in leaves of greenhouse spinach (cv. Platypus RZ) in relation to N fertilization rate and protein hydrolysate-based biostimulant application.
Source of VarianceStarchGlucoseFructoseSucroseCarotenoidsPolyphenols
(mg g−1dw)(mg g−1dw)(mg g−1dw)(mg g−1dw)(µg g−1dw)(µg GAE g−1dw)
Nitrogen (kg ha−1) (N)
08.95 ± 1.233.85 ± 4.014.52 ± 1.43.03 ± 0.35.49 ± 0.332.16 ± 1.7 a
156.81 ± 0.731.53 ± 3.911.20 ± 0.92.06 ± 0.45.12 ± 0.327.37 ± 1.0 b
307.00 ± 1.033.95 ± 3.113.40 ± 1.02.74 ± 0.45.18 ± 0.327.45 ± 0.7 b
456.78 ± 0.630.78 ± 2.413.41 ± 1.52.79 ± 0.35.08 ± 0.427.52 ± 1.4 b
NSNSNSNSNS*
Biostimulant (B)
Control8.15 ± 0.835.77 ± 2.413.92 ± 0.92.76 ± 0.35.28 ± 0.230.09 ± 1.2
Legume-derived PH6.61 ± 0.529.29 ± 1.712.34 ± 0.82.55 ± 0.25.16 ± 0.227.16 ± 0.6
t-test0.0940.0410.2180.5650.6850.040
N × B
0N Control10.37 ± 2.239.18 ± 7.015.64 ± 2.53.06 ± 0.65.24 ± 0.534.16 ± 3.0
15N Control7.04 ± 1.333.17 ± 6.611.22 ± 1.11.99 ± 0.55.30 ± 0.328.29 ± 1.7
30N Control7.61 ± 1.539.23 ± 2.813.86 ± 1.82.77 ± 0.75.05 ± 0.628.58 ± 1.0
45N Control7.60 ± 0.731.48 ± 2.214.95 ± 1.53.21 ± 0.35.53 ± 0.529.31 ± 2.5
0N Legume-derived PH7.52 ± 0.828.52 ± 1.513.39 ± 1.83.00 ± 0.55.74 ± 0.230.15 ± 0.8
15N Legume-derived PH6.58 ± 0.829.89 ± 5.311.18 ± 1.62.13 ± 0.64.94 ± 0.426.45 ± 1.1
30N Legume-derived PH6.39 ± 1.428.67 ± 3.512.93 ± 1.22.70 ± 0.45.32 ± 0.326.32 ± 0.7
45N Legume-derived PH5.95 ± 0.730.09 ± 4.711.87 ± 2.62.38 ± 0.34.63 ± 0.425.73 ± 0.7
NSNSNSNSNSNS
GAE, Gallic acid equivalent. NS, * Nonsignificant or significant at p ≤ 0.05, respectively. Different letters within each column indicate significant differences according to Duncan’s multiple-range test (p = 0.05). Biostimulant application main effects were compared by Student’s t-test. All data are expressed as mean ± standard error, n = 3.
Table 5. Free amino acids profile and total amino acids content in leaves of greenhouse spinach (cv. Platypus RZ) in relation to N fertilization rate and protein hydrolysate-based biostimulant application.
AminoacidNitrogen (kg ha−1) (N)Biostimulant (B)N × B
(µmol g−1dw)0153045Sig.ControlLegume-Derived PHt-Test0N Control15N Control30N Control45N Control0N Legume-Derived PH15N Legume-Derived PH30N Legume-Derived PH45N Legume-Derived PHSig.
Alanine21.43 ± 2.831.55 ± 4.225.08 ± 4.421.18 ± 2.1NS20.70 ± 1.228.91 ± 3.10.02318.23 ± 2.123.46 ± 2.417.65 ± 2.723.47 ± 1.224.63 ± 5.0 39.65 ± 4.232.5 ± 5.818.89 ± 3.9NS
Asparagine3.37 ± 0.5 c9.61 ± 1.8 ab10.57 ± 2.5 a7.05 ± 0.8 b***5.27 ± 0.710.03 ± 1.50.0082.39 ± 0.45.99 ± 1.36.43 ± 1.56.25 ± 1.04.36 ± 0.213.22 ± 0.814.71 ± 3.47.84 ± 1.3NS
Aspartate3.17 ± 0.5 c6.99 ± 0.9 b10.45 ± 0.9 a6.46 ± 1.2 b***7.55 ± 1.05.98 ± 0.90.2644.03 ± 0.36.19 ± 1.111.82 ± 1.28.14 ± 1.82.31 ± 0.57.78 ± 1.59.07 ± 1.14.77 ± 1NS
Mono ethanolamine3.74 ± 0.4 b5.91 ± 0.7 a5.40 ± 0.6 a3.69 ± 0.5 b**4.31 ± 0.45.06 ± 0.60.2772.90 ± 0.3 c4.82 ± 0.7abc4.94 ± 0.8 abc4.58 ± 0.6 bc4.59 ± 0.2bc7.00 ± 0.9 a5.85 ± 1 ab2.81 ± 0.6c*
Phenylalanine0.79 ± 0.1 b1.24 ± 0.1 a1.26 ± 0.1 a0.94 ± 0.1 ab*0.98 ± 0.11.14 ± 0.10.2710.65 ± 0.0 1.02 ± 0.21.17 ± 0.21.07 ± 0.20.93 ± 0.2 1.45 ± 0.11.35 ± 0.20.81 ± 0.1NS
GABA28.95 ± 4.041.62 ± 4.338.43 ± 6.130.75 ± 3.7NS30.73 ± 2.339.14 ± 4.00.08121.25 ± 2.135.67 ± 3.0 29.28 ± 4.7 36.73 ± 2.536.64 ± 4.0 47.58 ± 6.947.58 ± 8.924.77 ± 5NS
Glycine1.27 ± 0.2 b3.28 ± 0.9 a1.39 ± 0.3 b1.18 ± 0.2 b***1.23 ± 0.12.33 ± 0.5 0.0571.04 ± 0.2 bc1.38 ± 0.2 bc0.93 ± 0.1 bc1.57 ± 0.2 bc1.49 ± 0.3 bc5.18 ± 0.5 a1.84 ± 0.5 b0.8 ± 0.1 c***
Glutamate8.31 ± 1.0 b17.74 ± 3.6 a20.75 ± 2.5 a9.73 ± 1.3 b***13.01 ± 2.215.25 ± 2.20.4816.80 ± 1.2 c11.42 ± 2.2 bc23.84 ± 4.0 a9.97 ± 1.7 bc9.81 ± 1.3 bc24.06 ± 4.6 a17.65 ± 2.4 ab9.48 ± 2.3 bc**
Glutamine9.54 ± 1.7 b31.45 ± 7.7 a33.30 ± 8.7 a19.00 ± 3.7 b***12.96 ± 2.033.68 ± 5.30.0015.93 ± 0.5 c14.80 ± 3.0 bc17.61 ± 6.3 bc13.49 ± 2.0 bc13.16 ± 0.7 bc48.10 ± 3.3 a48.98 ± 9.6 a24.5 ± 5.8 b*
Isoleucine1.57 ± 0.2 b2.65 ± 0.2 a3.01 ± 0.4 a2.21 ± 0.3 ab*2.19 ± 0.22.53 ± 0.30.3351.36 ± 0.12.23 ± 0.32.60 ± 0.52.56 ± 0.51.78 ± 0.33.06 ± 0.23.42 ± 0.61.87 ± 0.3NS
Histidine0.46 ± 0.1 b1.15 ± 0.1 a1.23 ± 0.2 a0.93 ± 0.1 a***0.79 ± 0.11.09 ± 0.10.0660.32 ± 0.00.93 ± 0.11.00 ± 0.20.91 ± 0.10.60 ± 0.11.37 ± 0.11.46 ± 0.30.94 ± 0.1NS
Leucine2.54 ± 0.33.26 ± 0.33.46 ± 0.42.65 ± 0.2NS2.92 ± 0.23.04 ± 0.30.7192.73 ± 0.62.85 ± 0.43.20 ± 0.32.88 ± 0.32.36 ± 0.23.66 ± 0.13.72 ± 0.72.41 ± 0.4NS
Lysine2.48 ± 0.32.68 ± 0.12.39 ± 0.21.96 ± 0.2NS2.34 ± 0.12.41 ± 0.20.7152.39 ± 0.32.55 ± 0.02.34 ± 0.22.08 ± 0.12.56 ± 0.52.81 ± 0.12.44 ± 0.31.84 ± 0.3NS
Methionine0.33 ± 0.10.51 ± 0.10.50 ± 0.10.37 ± 0.0NS0.34 ± 0.00.51 ± 0.10.0090.21 ± 0.00.37 ± 0.00.38 ± 0.10.39 ± 0.10.46 ± 0.10.65 ± 0.00.61 ± 0.10.34 ± 0.1NS
Ornhitine0.72 ± 0.10.74 ± 0.00.71 ± 0.00.58 ± 0.0NS0.66 ± 0.00.72 ± 0.10.3460.66 ± 0.00.72 ± 0.00.65 ± 0.00.61 ± 0.10.79 ± 0.20.76 ± 0.00.77 ± 0.10.54 ± 0.1NS
Proline1.82 ± 0.1 c1.94 ± 0.1 bc2.33 ± 0.2 a2.27 ± 0.2 ab*1.90 ± 0.12.28 ± 0.10.0111.60 ± 0.11.82 ± 0.12.09 ± 0.22.09 ± 0.12.05 ± 0.22.07 ± 0.22.57 ± 0.12.44 ± 0.3NS
Serine5.72 ± 0.5 b8.76 ± 1.7 a9.53 ± 0.6 a6.84 ± 1.3 ab*7.49 ± 0.77.93 ± 1.00.7285.74 ± 0.9 bc5.78 ± 1.1 bc9.33 ± 0.7 ab9.11 ± 1.6 ab5.69 ± 0.7 bc11.73 ± 2.0 a9.74 ± 1.2 ab4.57 ± 1 c**
Tyrosine0.84 ± 0.1 b1.43 ± 0.2 a1.53 ± 0.2 a1.08 ± 0.1 ab*0.99 ± 0.11.45 ± 0.20.0200.59 ± 0.0 1.05 ± 0.21.17 ± 0.21.15 ± 0.2 1.09 ± 0.21.82 ± 0.11.89 ± 0.41 ± 0.2NS
Threonine1.69 ± 0.4 c6.35 ± 2.0 b9.42 ± 3.0 a4.58 ± 1.6 b***1.87 ± 0.29.15 ± 1.60.0001.00 ± 0.1 d2.16 ± 0.2 d2.88 ± 0.3 d1.45 ± 0.2 d2.39 ± 0.5 d10.55 ± 1.4 b15.96 ± 1.3 a7.7 ± 1.5 c***
Tryptophan0.21 ± 0.0 b0.58 ± 0.1 a0.61 ± 0.1 a0.36 ± 0.1b***0.37 ± 0.00.51 ± 0.10.1530.22 ± 0.0 cd0.35 ± 0.1 cd0.50 ± 0.1 bc0.39 ± 0.1 cd0.19 ± 0.0 d0.81 ± 0.2 a0.72 ± 0.1 ab0.33 ± 0.1 cd*
Valine2.06 ± 0.2 c3.73 ± 0.4 ab4.18 ± 0.6 a2.94 ± 0.3 bc**2.82 ± 0.33.64 ± 0.40.1061.67 ± 0.22.91 ± 0.4 3.43 ± 0.7 3.26 ± 0.5 2.46 ± 0.34.55 ± 0.3 4.93 ± 0.82.63 ± 0.4NS
Total amino acids102 ± 10 b184 ± 25 a189 ± 24 a128 ± 12 b***124 ± 10 178 ± 190.01783 ± 7 c131 ± 14 bc146 ± 22 b135 ± 14 bc120 ± 11 bc238 ± 9 a232 ± 23 a121 ± 22 bc*
NS, *, **, *** Nonsignificant or significant at p ≤ 0.05, 0.01 or 0.001 respectively. Different letters within each row indicate significant differences according to Duncan’s multiple-range test (p = 0.05). Biostimulant application main effects were compared by Student’s t-test. All data are expressed as mean ± standard error, n = 3.

