Article

Interrupted Wet Period (IWP) to Forecast the Aerial Alternaria in Potato Crops of A Limia (Spain)

by
Laura Meno
,
Olga Escuredo
*,
María Shantal Rodríguez-Flores
and
María Carmen Seijo
Department of Vegetal Biology and Soil Science, Faculty of Science, University of Vigo, As Lagoas, 32004 Ourense, Spain
*
Author to whom correspondence should be addressed.
Submission received: 30 August 2019 / Revised: 23 September 2019 / Accepted: 25 September 2019 / Published: 26 September 2019
(This article belongs to the Special Issue Information Technologies for Precision Plant and Crop Protection)

Abstract

:
Potato early blight caused by Alternaria solani generates significant economic losses in crops worldwide. Forecasting the risk of infection on crops is indispensable for the management of the fungal disease, ensuring maximum economic benefit but with minimal environmental impact. This work aimed to calculate the interrupted wet periods (IWP) according to the climate conditions of A Limia (Northwest of Spain) to optimize the prediction against early blight in potatoes. The study was performed during nine crop cycles. The relative hourly humidity and Alternaria concentration in the crop environment were taken into account. Alternaria levels were monitored by aerobiological techniques using a LANZONI VPPS-2000 volumetric trap. The relationships between weather conditions and airborne Alternaria concentration were statistically analyzed using Spearman correlations. To establish the effectiveness of wetness periods, the first important Alternaria peak was taken into account in each crop cycle (with a concentration greater than 70 spores/m3). Considering the six interrupted wet periods of the system, it was possible to predict the first peak of Alternaria several days in advance (between 6 and 38 days), except in 2007 and 2018. Automated systems to predict the initiation of early blight in potato crop, such as interrupted wet periods, could be an effective basis for developing decision support systems. The incorporation of aerobiological data for the calculation of interrupted wet periods improved the results of this system.

1. Introduction

Potato crops are affected by numerous pests and diseases, of which early blight is one of major and destructive diseases of Solanum tuberosum L. in the world [1,2,3]. Early blight caused by Alternaria solani (Ellis and Martin) Jones and Grant, develops necrotic lesions on leaves, stems, fruits, and tubers [4,5]. Wind, water, and insects are the key factors for the dispersal of conidia, and they penetrate directly or through stomata of plants [6]. The symptoms can be observed at any stage of the plant’s development, but the greatest intensity is usually observed on senescence plants [7,8]. Premature defoliation of the leaves of potato plants caused by early blight limits the yield of the field crop and causes important economic losses [5,9,10,11,12]. Moreover, the tuber size is greatly reduced because the leaf defoliation restricts photosynthetic activity [13,14], with yield losses higher than 20% [6,9]. During storage early blight is also responsible for economic losses. On potato tubers, early blight results in darker surface lesions, which are usually slightly sunken; and internally, the tissue shows a brown to black corky [15].
The severity of the infection of early blight is variable each year, depending on specific climatic conditions throughout the growing season and plant characteristics [8]. Early blight is widespread in most areas where potatoes or tomatoes are grown but is particularly prevalent in tropical and temperate zones [9]. Actually, the solution is routine application of fungicides, regardless of the disease severity or how favorable the environment is for early blight outbreak, which results in excessive fungicide applications [16]. This practice increases the cost of potato production and has a negative impact on the environment. Concerns about the environment, health risk, cost, and resistance development associated with excessive use of fungicides make the regulation of fungicide application necessary. For a more sustainable agriculture, improvement of the methods to control diseases is a real need. Farmers demand tools to make adequate decisions about the management of their crops. One of the ways to regulate the application of fungicides is to use forecasting models or rules to suggest the optimal time when fungicide is actually needed and apply them accordingly [17,18].
Crop disease infection models are useful as producer advice systems. These systems provide information on the probability of actual occurrence of the disease, periods of infection, and recommendations at the time of application of fungicides. The development of these models to use as early assessments of disease severity can potentially assist potato growers in making economic decisions such as the optimal time to apply fungicides [19]. However, these decision support systems need to be validated considering the particular conditions of the geographical area where potatoes are cultivated [18].
Interrupted wet periods (IWP) are used to optimize the application of fungicides against early blight in potato [13,18,20,21]. IWP considers the alternation of the relative humidity occurring during the night and day. However, wetness periods long enough for infection and disease development are not always continuous under field conditions. The interruption of wetness periods occurs in cases of nocturnal wetting and diurnal drying cycles and intermittent rain showers [22]. This situation occurs with frequency, and consequently, alternating wet and dry periods before host infection favors the germination of fungal spores [8,21,22]. This fact was reported in fungal diseases caused in the leaves and fruits of multiple fruit trees or cereals [22,23,24,25,26]. In the case of conidia of A. solani and other Alternaria species, despite a lack of prolonged humidity, several short and wet periods (usually at night) interrupted by dry intervals during the day favor the sporulation [4,20,21,23,27]. Therefore, the wetness period (using the air relative humidity) is employed in disease warning systems as a critical determinant of infection risk [22].
Decision support systems only take into account meteorological records, to establish periods of risk of infection but not the presence of inoculum in the environment. However, perspectives for model improvement have been taken into account for plant, pathogen, and environment [12]. The search for the best development of the crop guaranteeing the highest quality and the maximum yield of the tubers is a task that every year worries the producers of the potato sector. Hence, the objective of the present work was to calculate the IWP system to a Spanish geographical area of greater potato production (A Limia). For this, the climatic conditions and the levels of Alternaria in the crop environment were monitored by aerobiological methods during nine potato growth cycles. The conditions given during the first phenological stages of crop development are crucial for a good fit of the models. In this sense, this period was analyzed in greater detail.

2. Material and Methods

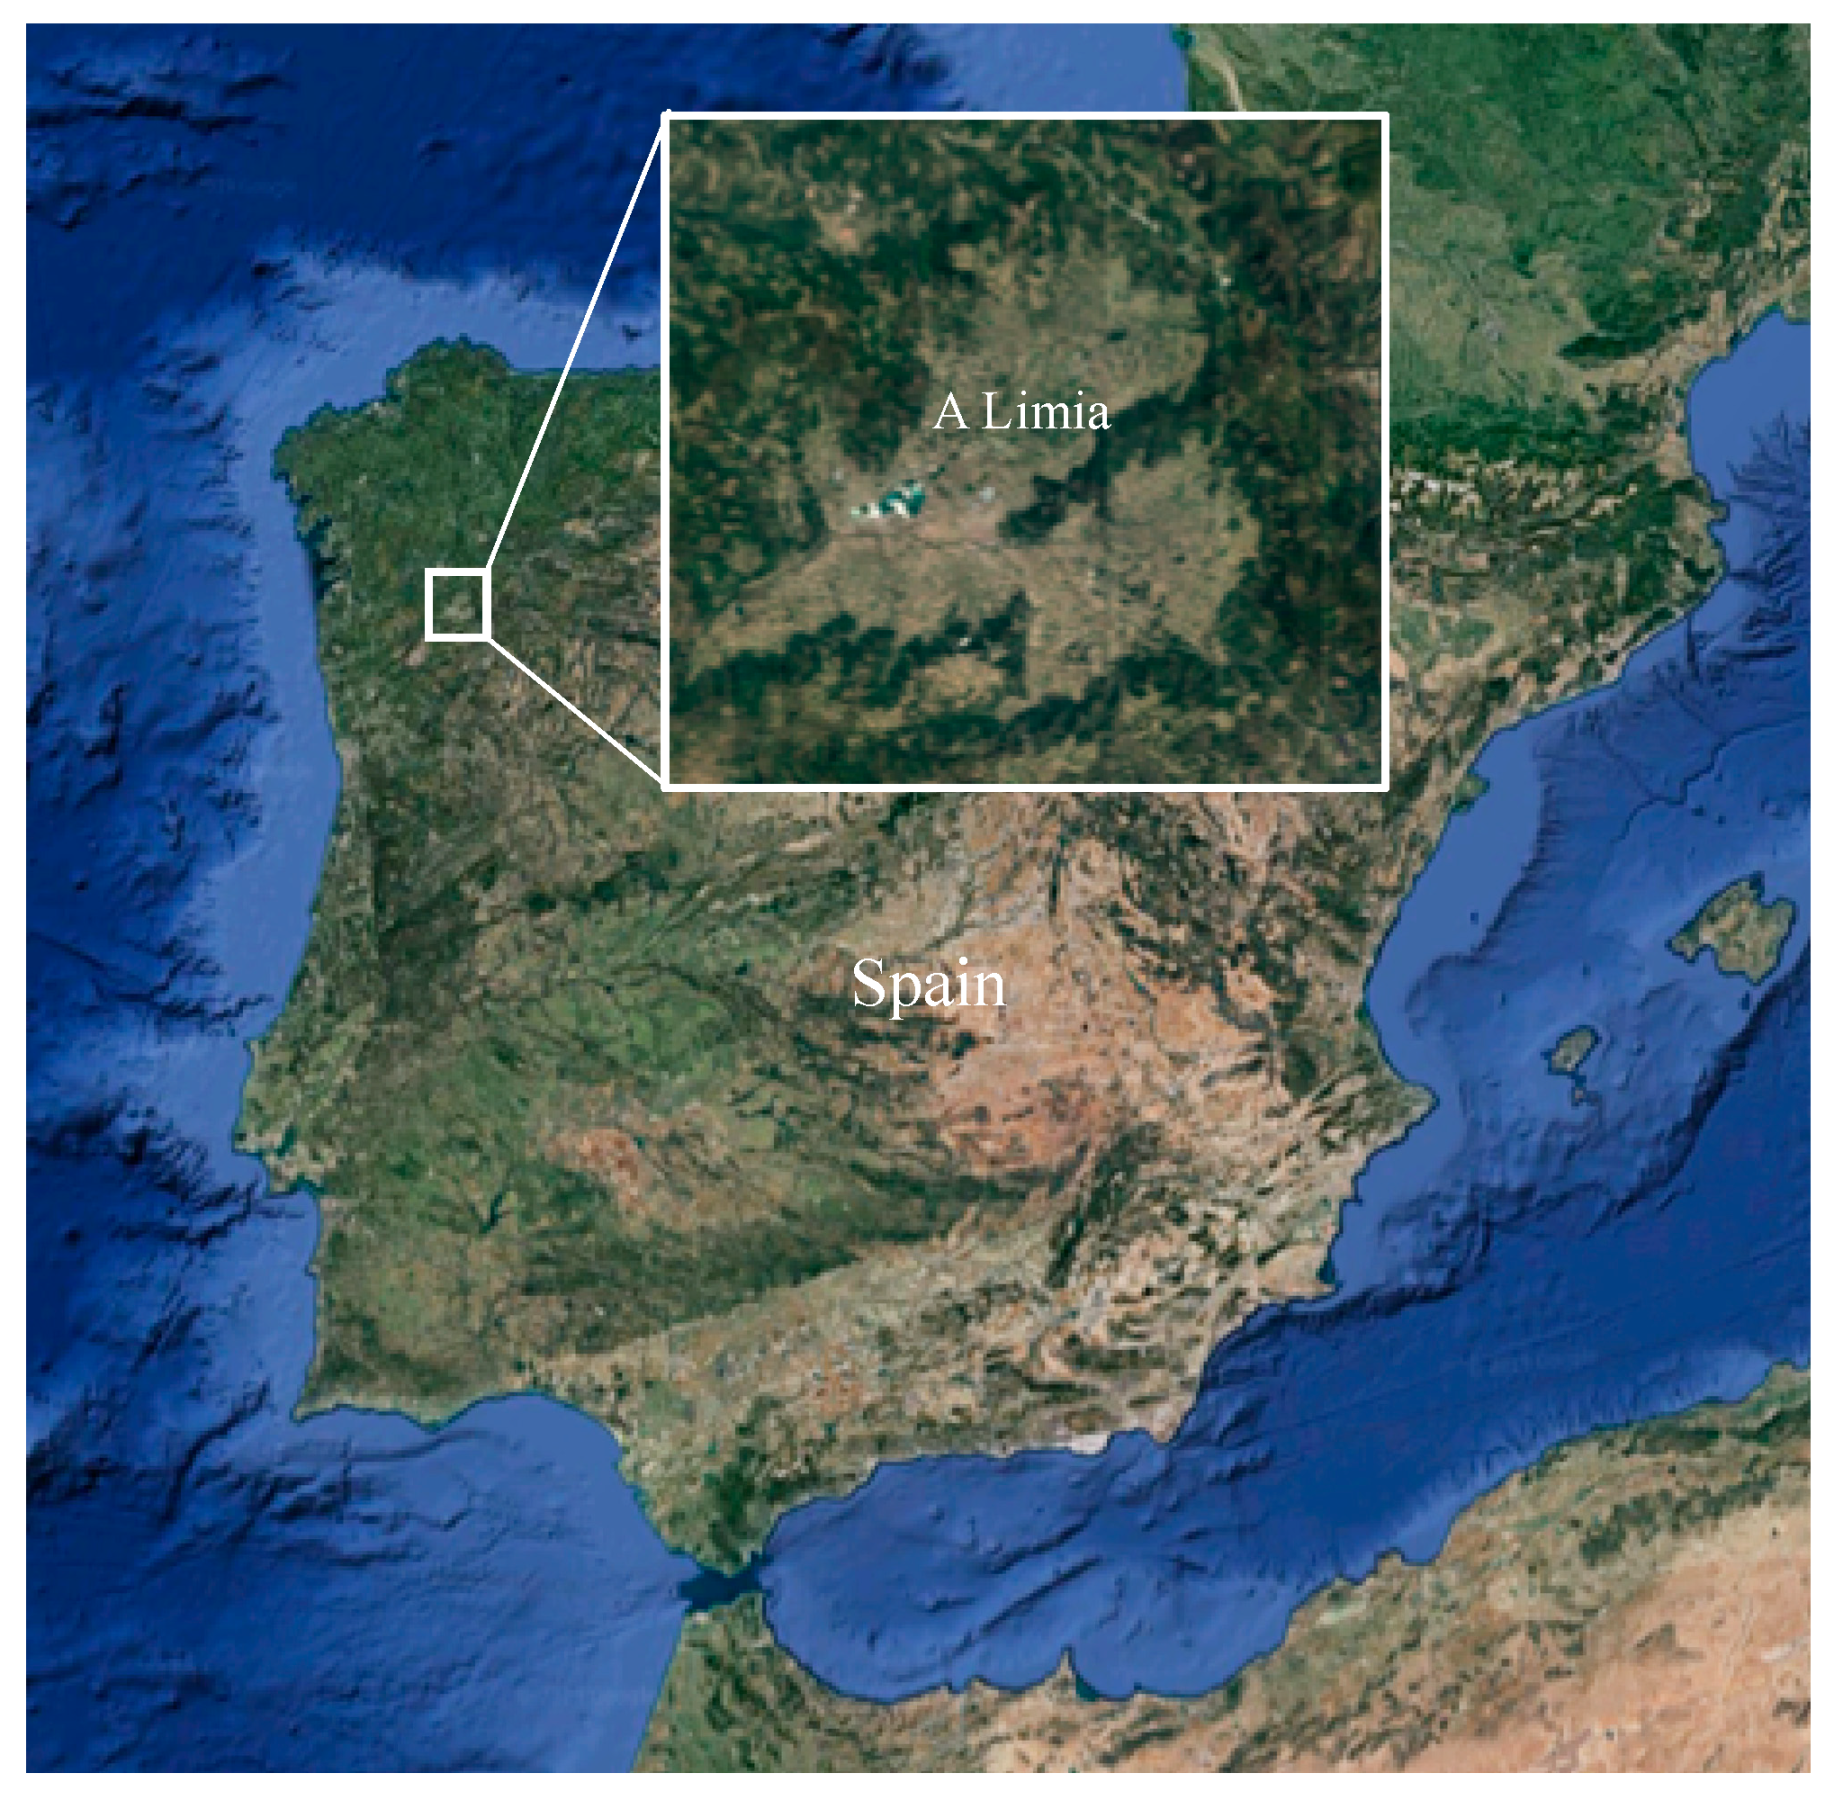
2.1. Period and Study Area

The study was carried out during nine crop cycles (2007, 2008, 2009, 2010, 2014, 2015, 2016, 2017, and 2018) in potato field located in A Limia (Galicia, Northwest Spain) (Figure 1). Sowing date was between the end of April (2017, 2015, and 2009), during May (2018, 2014, 2010, and 2007) and the start of June (2016 and 2008).

2.2. Aerobiological Sampling

An aerobiological sampler Lanzoni VPPS 2000 (Lanzoni S.r.l., Bologna, Italia) based on the principle of impact was placed 1.5 m above ground in the potato crop. Inside the central body of the sampler a drum was placed, provided with a Melinex tape covered with an adhesive substance, which trapped spores in air. The continuous movement of this drum was produced by displacement of 2 mm/h, obtaining the registration of particles hourly. Following the counting method proposed by the Spanish Network of Aerobiology (R.E.A.) [28] the concentration of Alternaria was expressed in spores/m3.

2.3. Weather Monitoring

The meteorological parameters (temperature and relative humidity) were recorded by using a portable weather station ONSET HOBO Pro Series H08-032-08 placed in the study field positioned at a 1.5 m height. The records were extracted every hour. The rain data were obtained from the National Weather Service website [29].

2.4. Interrupted Wet Period (IWP)

IWP by crop cycle were calculated. IWP was characterized by relative humidity of 95% for at least 6 h at night and <80% during the day [20]. These requirements of relative humidity were calculated since sowing date in each crop cycle. Leaf wetness showed similar trends to relative humidity, but was not used in the calculation of IWPs. When a day is preceded by 6 IWP days, the fungicide treatment is recommended, regardless of the inoculum present in the crop environment [20].

2.5. Statistical Analysis

Analysis of variance (ANOVA) was performed using the Bonferroni test (p < 0.05) to compare the means of the data. The correlation coefficients between mean daily Alternaria concentrations and meteorological parameter values were calculated using Spearman’s correlation test for the statistical significance of p < 0.01 and p < 0.05. Values were computed by the IBM SPSS Statistics 22 program for the statistical treatments.

3. Results

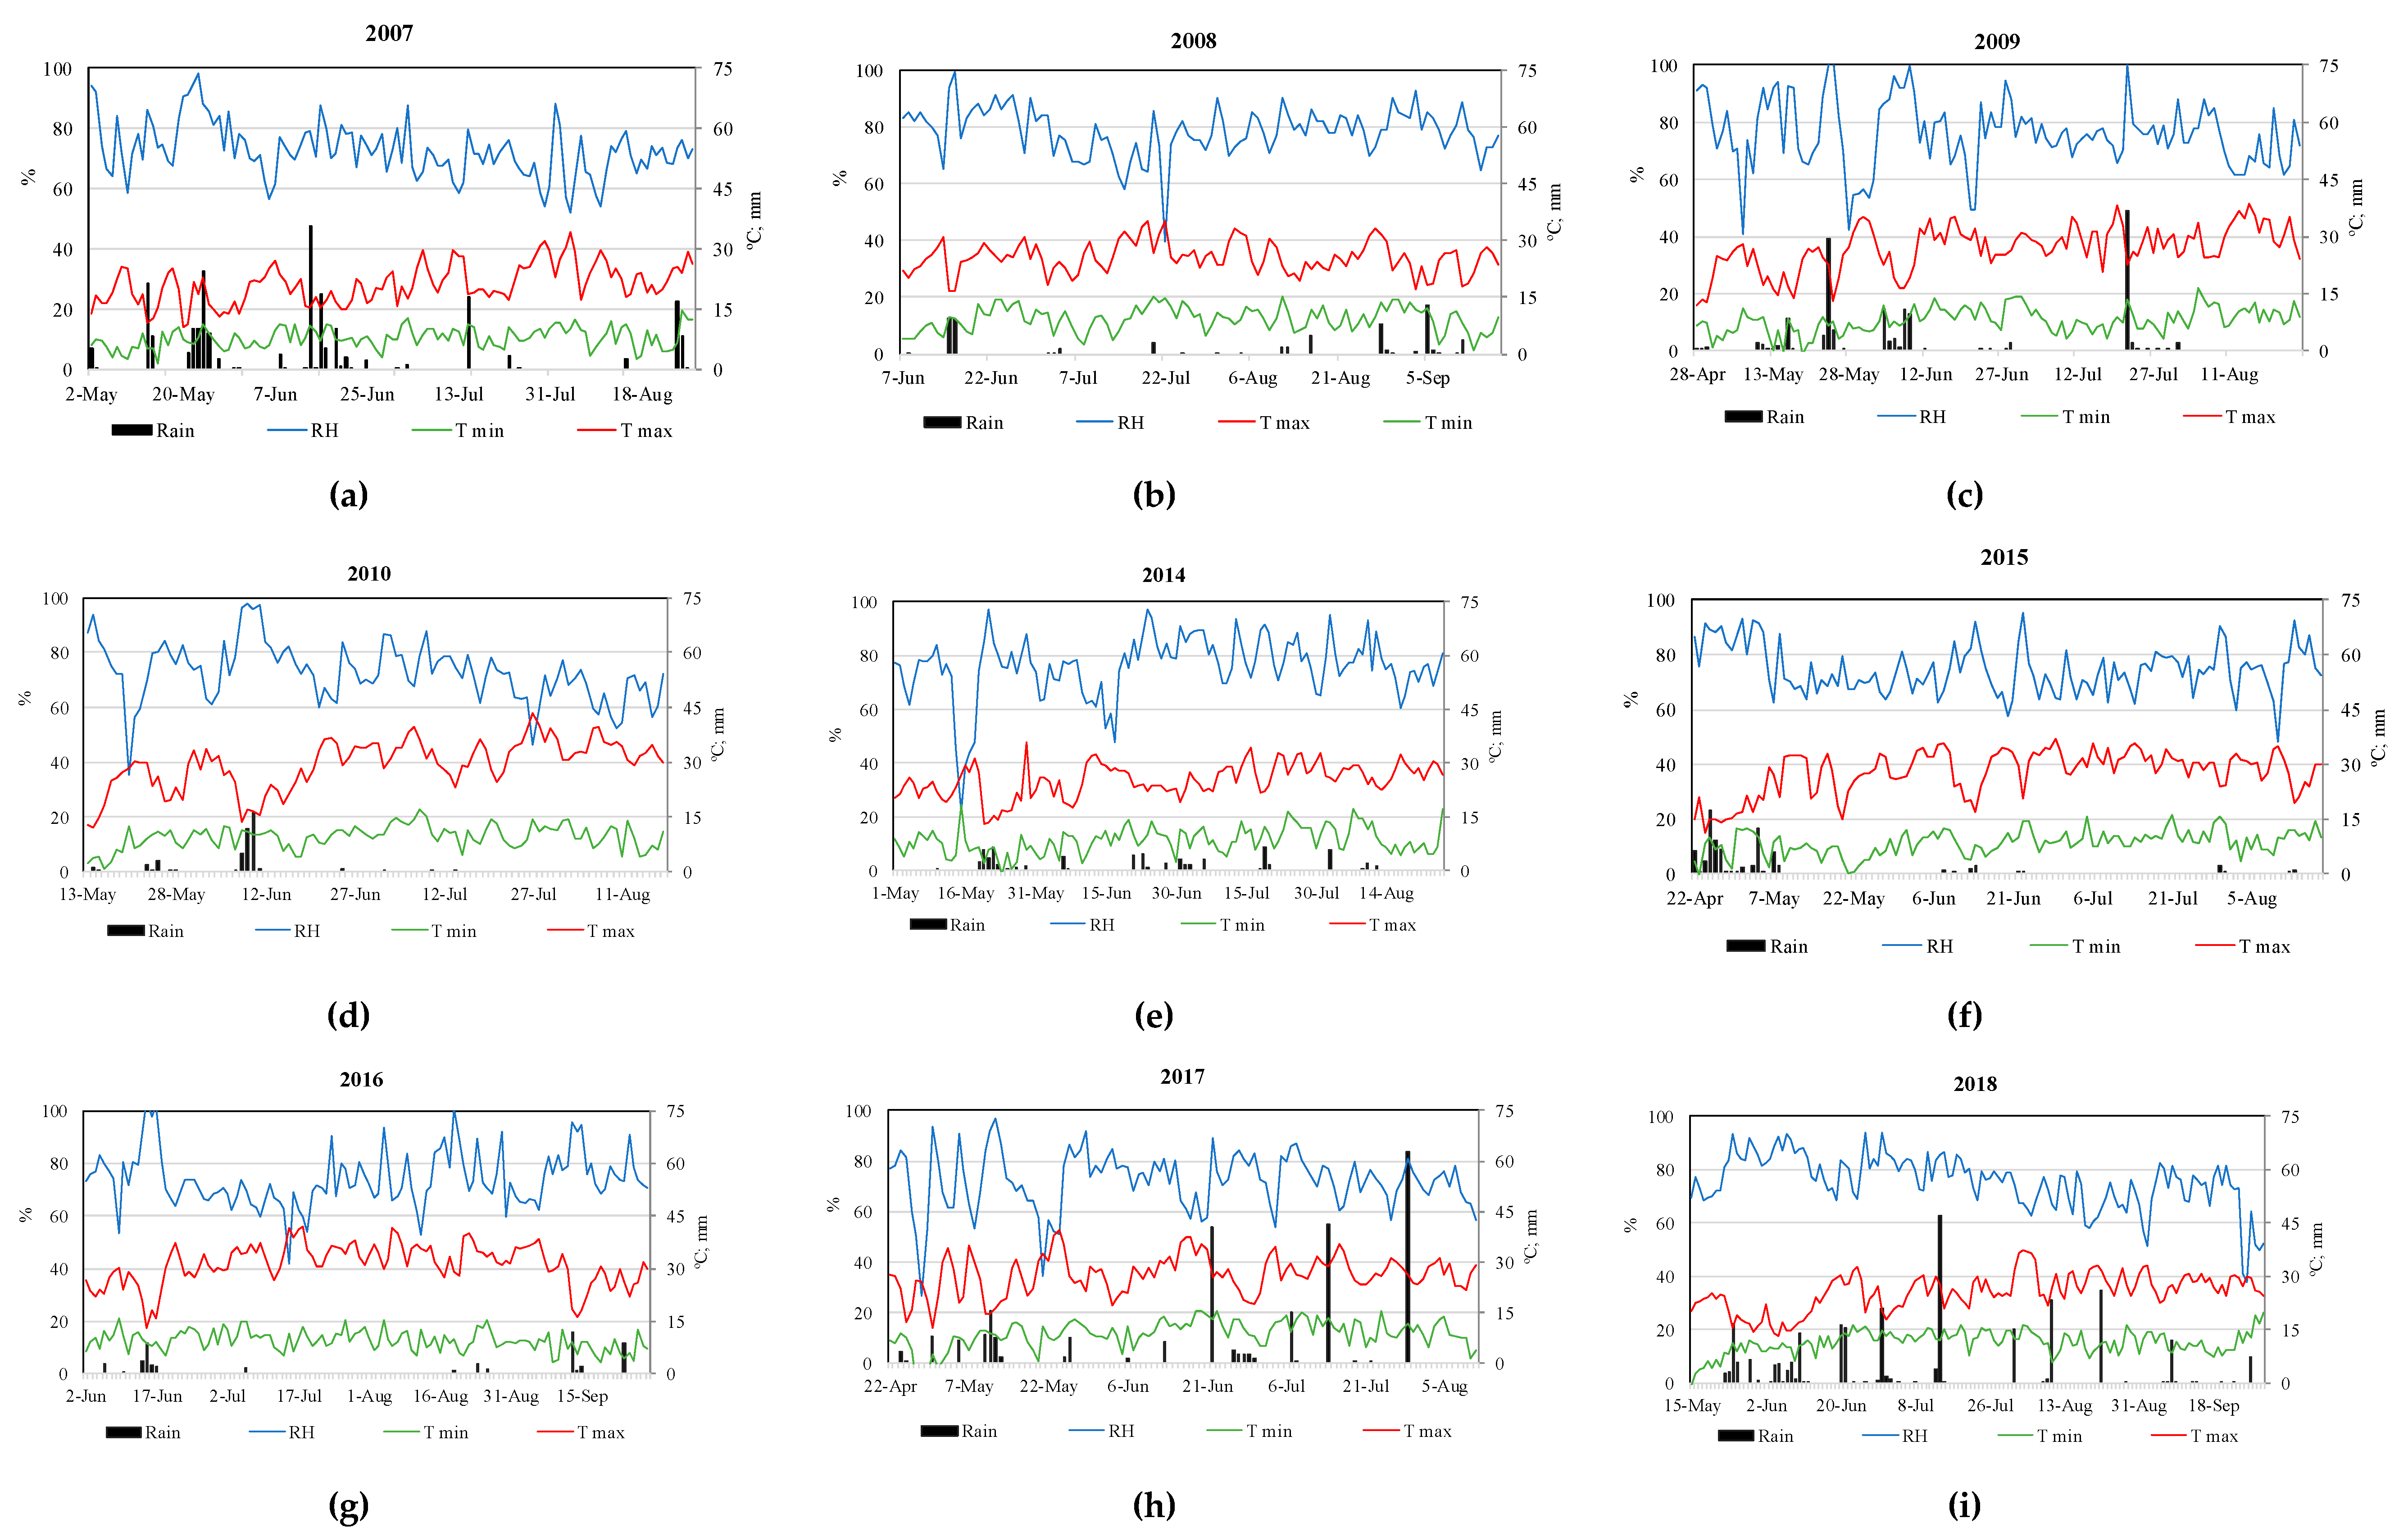
3.1. Weather Conditions

The meteorology recorded in the nine crop cycles showed an irregular pattern, both in temperature and relative humidity. The fluctuations of the weather data of each year are shown in Figure 2. The mean temperature ranged from 14.6 °C in 2007 to 18.7 °C in 2016. The year 2007 was the coldest, with the mean temperature significantly lower than other years, while that the mean temperature of 2016 was significantly higher than in the years 2007, 2008, 2009, 2014, and 2017 (p < 0.05). Therefore, the years 2016, 2010, 2015, and 2018 had significantly higher mean temperatures (p < 0.05), with a mean value above 16.5 °C.
The mean minimum temperature of nine years of study oscillated between 7.8 °C (2007) and 11.4 °C (2018). The years 2007, 2009, 2014, and 2015 had a lower average minimum temperature (below 8.5 °C), while the mean maximum values recorded in 2010 and 2016 were the highest (with mean values of 43.4 °C and 42.0 °C, respectively). Thermal oscillation during the growing season was frequent in the studied area, with a thermal amplitude higher than 13 °C. The cycles of 2016 and 2010 presented the higher oscillation in the temperature, with mean values of 21.8 °C and 19.9 °C, respectively.
Mean relative humidity varied between 70.8% in 2017 and 78.9% in 2008. There are several significant differences between the average humidity of the nine years. However, it should be noted that the 2017 year cycle presented the significantly lowest mean value with respect to 2008, 2009, 2014, and 2018 (p < 0.05). On the contrary, 2008 had the significantly highest mean value with respect to 2007, 2010, 2016, and 2017 (p < 0.05).
Rain was sporadic during the potato growing season. The crop cycles of higher accumulated rain were 2007, 2017, and 2018, with values of 229.8 mm, 323.6 mm, and 340.2 mm, respectively (coinciding with the higher mean values). While, the years 2010 and 2014 accumulated lower rain, with values of 55.2 mm, and 86.1 mm, respectively. Frequent stormy rains occurred in the initial stage of crop growth, mainly in 2007, 2008, 2015, and 2016.

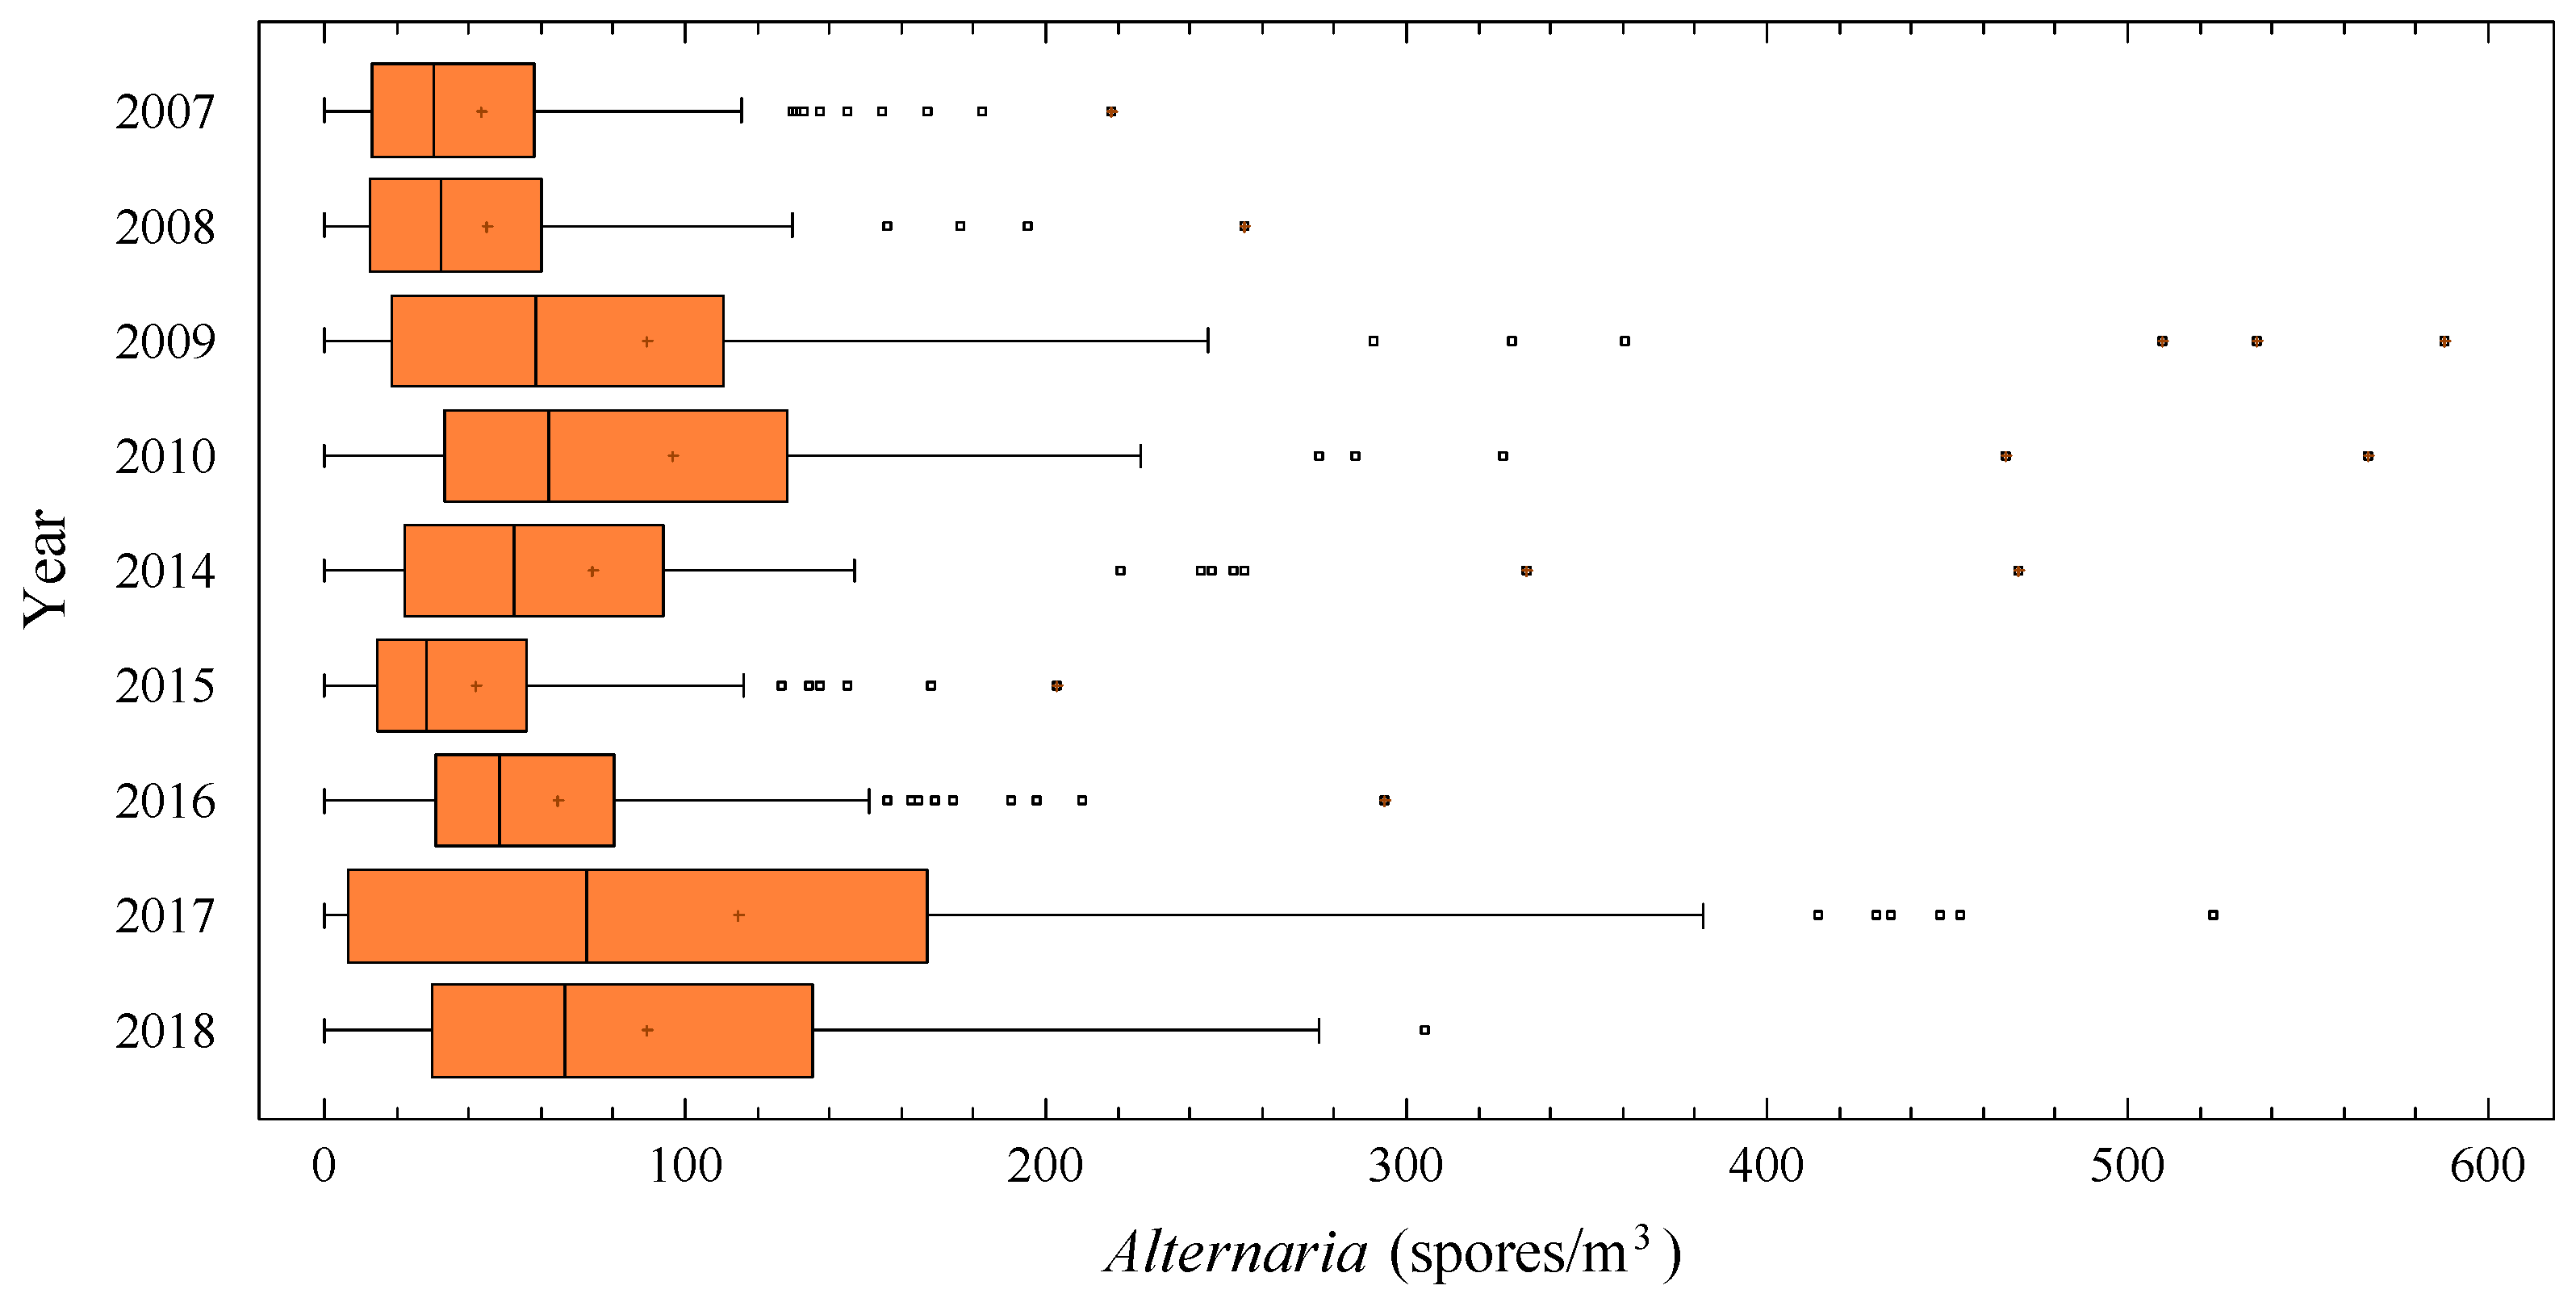
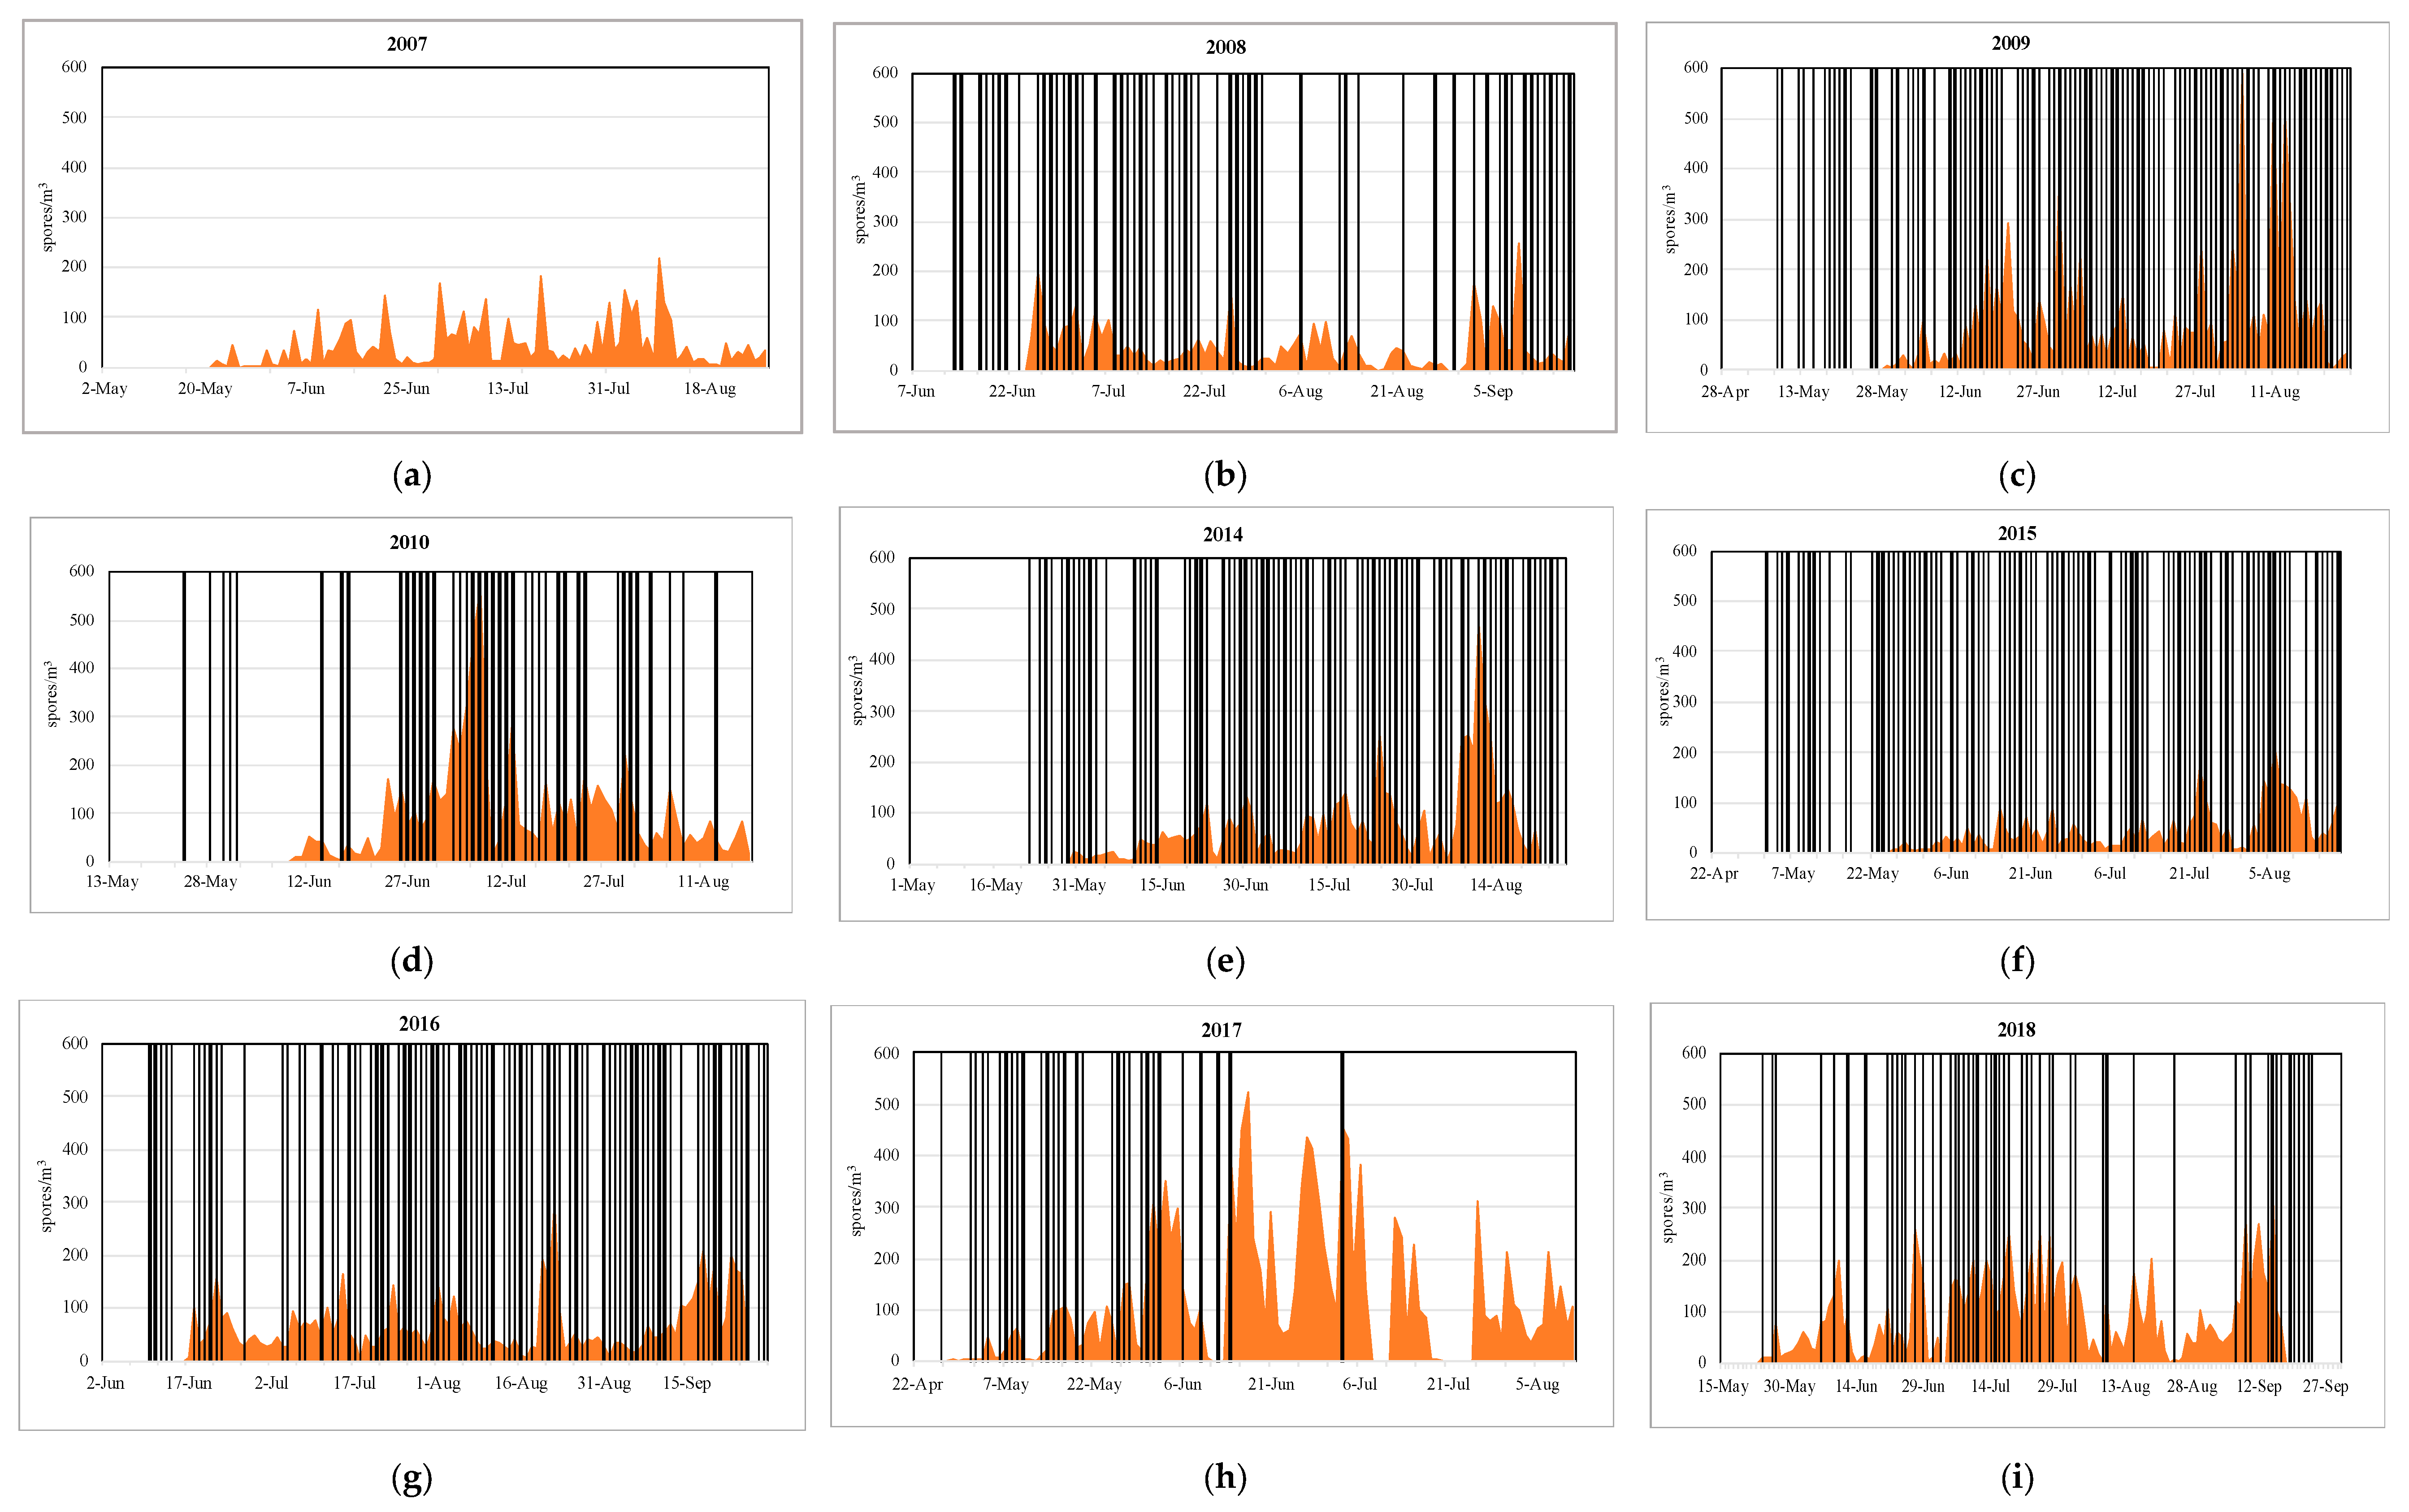
3.2. Alternaria Levels in the Environment of Potato Crop

Alternaria spores were present throughout the entire cycle of potato growth. The years with the higher concentration of spores were 2017 and 2018, with 12,155 spores and 10,454 spores, respectively (Table 1). The lower total Alternaria spore concentration was found in 2015 (with 3651 spores), and 2008 (with 3813 spores). The mean Alternaria levels were significantly different between years (p < 0.05). The cycles of 2010 and 2017 had the higher mean values (83 and 69 spores/m3). On contrary, the lower mean values of Alternaria were in 2015 and 2007, with values lower than 20 spores/m3. The years with higher dispersion in the data were 2009, 2010, and 2017, with maximum values above 500 spores/m3 (Figure 3). These years coincided with the higher mean concentration of the complete cycle.
Regarding the first important peak (considered as a critical day for a possible infection of the disease in the field), the date was between 20 and 55 days after the date of planting, concretely, during the month of June, except in the year 2017, in which the first peak in mid-May was recorded. Therefore, high Alternaria levels during the emergency phase of plants were found in all years, with concentrations greater than 70 spores/m3. These Alternaria levels are considered alarming due to the possible risk of infection of potato plants referred to as the first peak (Table 1). Moreover, in previous days to first peak, Alternaria conidia was found in the environment of crop, with a daily mean concentration between 9 and 68 spores/m3 in 2009 and 2016, respectively. In the years 2008 and 2016, the first peak had a higher concentration, recorded as the higher mean temperature before days (16.3 °C in 2008 and 17.1 °C in 2016) and mean maximum temperatures higher than 24 °C. In addition, a high relative humidity in the previous days (with mean value above 78%) was recorded.
The maximum concentrations were found near to senescence, between August and September (about 75 and 125 days after sowing), except in 2010 and 2017 which counted in July and June, respectively (57 days after sowing). The highest values of maximum peaks were found in the cycles of 2009, 2010, and 2017, with values above 500 spores/m3.
The relationships between the daily Alternaria concentration and the meteorological factors (mean, maximum, and minimum temperatures; mean relative humidity; and rain) were analyzed by Spearman correlation analysis. The aerial Alternaria concentrations and meteorological conditions were recorded during the same day and with the previous days considered (Table 2). The presence of conidia of Alternaria in environment during previous days was influenced positively by the concentration of the day (p < 0.01). The correlation coefficients showed a strong relation of the minimum, mean, and maximum temperature with Alternaria concentration. The temperature (both of the same day and previous days) was positively correlated with the levels of conidia with positive coefficients (p < 0.01). However, the relative humidity only was positively correlated with Alternaria the 3 and 4 days prior (p < 0.05). No significant correlation was found between the concentration of Alternaria and rain.

3.3. Alternaria Forecast Using Interrupted Wet Periods (IWP)

Taking into account the concentration of Alternaria in air by aerobiological sampling and the main meteorological parameters recorded in the studied plot, the IWPs were calculated. One IWP was characterized by a relative humidity of 95% for at least 6 h at night and a value of less than 80% during the day. The years with the highest accumulated IWPs were 2008, 2009, 2014, 2015, and 2016 (Figure 4). However, IWP days were reached in the early stages of crop growth in the analyzed years (except to 2007). Due to the cold conditions that occurred throughout the cycle, the year 2007 did not meet the model requirement (Table 3). This crop cycle was the coldest, and relative humidity during the day exceeded 80% in most hours. This is the reason for the lack of IWP during the development of the crop.
The first peak of Alternaria was considered calculating the wet periods of previous days to the first peak. According to the literature, when a day is preceded by 6 IWP days, the fungicide treatment is recommended. The first IWPs occurred during the emergence of plants. Six IWP occurred during the months of May and June, between 6 and 21 days prior to the first peaks of Alternaria found (Table 3), except in the cycles of the year 2018 which were days later.
The days with IWP prior to the first peak of Alternaria were between 3 and 21 in the years 2018 and 2014, respectively. Considering 6 IWP, it was possible to predict the first peak of Alternaria several days in advance (between 6 and 38 days), except in 2018. Despite the existence of differences in the accumulated IWP days between the crop cycles studied, there are many favorable days for the infection of the pathogen. The results showed the importance of the relative humidity of the environment in the proliferation of conidia of Alternaria. In the studied years, there were several days in advance that predicted this IWP system, except in two years (2007 and 2018). Therefore, it is possible to apply IWP to the area of A Limia.

4. Discussion

In recent years, there has been a concern about the increase of early blight in potato fields, even in areas where the disease barely caused problems. The climatic tendency of increases in the temperature has shown changes in the behavior of Alternaria, with a higher severity of early potato blight [17,30]. The fact was manifested in this study, in the region of A Limia, with a notable increase in total Alternaria spores in the last two years. The irregularity of temperature and relative humidity is present from the early stages of crop growth. The climate of A Limia is characterized by short, hot, dry, and mostly clear summers and very cold, wet, and partly cloudy winters. Considering the increased high temperature events in Spain, we could expect a longer duration and an increased intensity of early blight epidemics in potato crops in future years. Variations in climate regimes may change the critical temperature and infection thresholds related to the prognosis of the presence of pathogens [31]. Therefore, tools that allow controlling the ideal conditions for disease infection and treating them effectively are highly desired. Crop rotation is used as a control measure for fungal diseases, but it is not effective in many regions, and timely spray of fungicide is recommended for a better control [6]. A correct fungicide application is performed with an adequate adjustment of the decision systems. Decision systems are used as part of crop disease management in response to the climatic conditions of the specific area. Hence, the adjustment of these systems to the specific environmental characteristics of the area is crucial to the success of forecasting.
Elements such as economic damage thresholds, monitoring, and risk forecasting systems are valuable tools to rationally define these disease management and control strategies [32]. Most decision support systems predict the occurrence of the first symptoms of the disease, monitoring certain environmental conditions favorable to infection [18,32,33]. The most used parameter in forecasting is temperature [21]. However, germination and infection of Alternaria are highly favored by high relative humidity, close to saturation [11,20,21,22]. Specifically, a high relative humidity recorded for several days favors the development of conidia, as reflected in the results of this work. Relative humidity influences most stages in early blight development, but its effects on critical stages like sporulation and infection make it very important considering a minimum relative humidity of 85% for early blight epidemics [21]. Van der Waals et al. [20] denoted that IWPs are more important than high leaf wetness in spore formation and dispersal of A. solani. IWP mechanism is premised on the ability of the germinating spores to survive the dry conditions or interruptions, which other fungi would not be able to survive, and resume germination when it is wet again [4]. A. solani is able to produce seven times more conidia under IWP than during a continuous wetting period of the same duration [4,20]. This fact facilitates its adaptation in areas of the Northwest of Spain, in which the alternation of air relative humidity is common during the months of crop. Therefore, IWP is an interesting system to include in the decision system for early blight control. Despite its rare use for forecasting diseases in potato crops, some researchers validated it in predicting the outbreak of early blight in advance with IWPs in South Africa [20], Denmark [21], and Northwest Spain [8,13]. But the IWP system was classified as a poor model in potato crops in Denmark [21]. During rainy times, it was difficult to meet the lower <80% threshold stablished by the model, since rain causes humidity to exceed by 80% during the day, and thus, the model did not make any recommendation [21]. The suggestion of the researchers for the validation of the model in Denmark was to use relative humidity below 88% at night, and consider the effect of rain on the dispersion of the pathogen [21]. Therefore, in colder areas, the IWP model needs an adjustment of relative humidity thresholds. Hence, it is important to adapt these prediction systems according to the particular meteorological conditions of the area in which it can be implemented.
Forecasting the risk of infection by a pathogen in cultivars is indispensable for the correct management of agricultural crops [18]. The susceptibility of the cultivars, the presence of primary inoculum, and the variations in disease sensitivity depending on environmental conditions are fundamental factors for improvement in fungal control [18,34,35,36]. In recent years, diverse modelling approaches such as control strategies for the prediction of fungal diseases have been proposed. Among them, linear regression models, the autoregressive integrated model of running mean time-series, and neural network models were applied in potato, grapevine, rice, and wheat [8,35,37,38,39]. As a first approximation, it can be concluded that the combination of aerobiological data with weather data (specially wet periods) collected during nine crop cycles in A Limia was efficient in that it could predict several days of attack in advance during the development of the crop. Considering that for the control of potato early blight in this region the farmers generally use established calendars for the application of fungicides, an alert system based on meteorological factors and aerobiological data would help predict the risk of infection and avoid unnecessary applications. In the case of IWP, it is a suitable system to protect the early stages of crop, predicting the first risk of infection. Including a greater number of years in these studies is essential to improve and validate these decision systems.

Author Contributions

O.E. and M.C.S. conceived and designed experiments. L.M., O.E., and M.S.R.-F. performed field experiments and field tracking. L.M., O.E., and M.C.S. analyzed data. L.M., O.E., M.S.R.-F., and M.C.S. wrote the paper.

Funding

This study was supported by Xunta de Galicia (Rural Development Program 2014/2020-FEADER).

Conflicts of Interest

The authors declare no conflict of interest.

References

  1. Shuman, J.L.; Christ, B.J. Integrating a host resistance factor into the fast system to forecast early blight of potato. Am. J. Potato Res. 2005, 82, 9–19. [Google Scholar] [CrossRef]
  2. Duarte, H.S.S.; Zambolim, L.; Capucho, A.S.; Júnior, A.F.N.; Rosado, A.W.C.; Cardoso, C.R.; Paul, P.A.; Mizubuti, E.S.G. Development and validation of a set of standard area diagrams to estimate severity of potato early blight. Eur. J. Plant Pathol. 2013, 137, 249–257. [Google Scholar] [CrossRef]
  3. Taheri, P. Disease resistance and virulence screen in Solanum tuberosumAlternaria tenuissima interaction: The role of pathogenicity factors. Euphytica 2019, 215, 15. [Google Scholar] [CrossRef]
  4. Rotem, J. The Genus Alternaria: Biology, Epidemiology, and Pathogenicity; APS Press: St Paul, MN, USA, 1994; p. 326. [Google Scholar]
  5. Singh, V.; Shrivastava, A.; Jadon, S.; Wahi, N.; Singh, A.; Sharma, N. Alternaria diseases of vegetable crops and its management control to reduce the low production. Int. J. Agric. Sci. 2015, 7, 834–840. [Google Scholar]
  6. Abbas, M.F.; Naz, F.; Irshad, G. Important fungal diseases of potato and their management—A brief review. Mycopath 2013, 11, 45–50. [Google Scholar]
  7. Dita-Rodríguez, M.A.; Brommonschenkel, S.H.; Matsuoka, K.; Mizubuti, E.S.G. Components of resistance to early blight in four potato cultivars: Effect of leaf position. J. Phytopathol. 2006, 154, 230–235. [Google Scholar] [CrossRef]
  8. Escuredo, O.; Seijo, M.C.; Fernández-González, M.; Iglesias, I. Effects of meteorological factors on the levels of Alternaria spores on a potato crop. Int. J. Biometeorol. 2011, 55, 243–252. [Google Scholar] [CrossRef] [PubMed]
  9. Van der Waals, J.E.; Korsten, L.; Aveling, T.A.S. A review of early blight of potato. Afr. Plant Protec. 2001, 7, 91–102. [Google Scholar]
  10. Batista, D.C.; Lima, M.A.; Haddad, F.; Maffia, L.A.; Mizubuti, E.S.G. Validation of decision support systems for tomato early blight and potato late blight, under Brazilian conditions. Crop Protec. 2006, 24, 664–670. [Google Scholar] [CrossRef]
  11. Chaerani, R.; Voorrips, R.E. Tomato early blight (Alternaria solani): The pathogen, genetics, and breeding for resistance. J. Gen. Plant Pathol. 2006, 72, 335–347. [Google Scholar] [CrossRef]
  12. Landschoot, S.; De Reu, J.; Audenaert, K.; Vanhaverbeke, P.; Haesaert, G.; De Baets, B.; Waegeman, W. Potentials and limitations of existing gorecasting models for Alternaria on potatoes: Challenges for model improvement. Potato Res. 2017, 60, 61–76. [Google Scholar] [CrossRef]
  13. Iglesias, I.; Rodríguez-Rajo, F.J.; Méndez, J. Evaluation of the different Alternaria prediction models on a potato crop in A Limia (NW of Spain). Aerobiologia 2007, 23, 27–34. [Google Scholar] [CrossRef]
  14. Horsfield, A.; Wicks, T.; Davies, K.; Wilson, D.; Paton, S. Effect of fungicide use strategies on the control of early blight (Alternaria solani) and potato yield. Australas. Plant Pathol. 2010, 39, 368–375. [Google Scholar] [CrossRef]
  15. Tsedaley, B. Review on Early Blight (Alternaria spp.) of potato disease and its management options. J. Biol. 2014, 4, 191–198. [Google Scholar]
  16. Leiminger, J.H.; Hausladen, H. Early blight control in potato using disease-orientated threshold values. Plant Dis. 2012, 96, 124–130. [Google Scholar] [CrossRef] [PubMed]
  17. Abuley, I.K.; Nielsen, B.J. Evaluation of models to control potato early blight (Alternaria solani) in Denmark. Crop Prot. 2017, 102, 118–128. [Google Scholar] [CrossRef]
  18. Escuredo, O.; Seijo-Rodríguez, A.; Rodríguez-Flores, M.S.; Seijo, M.C. Decision support systems for detecting aerial potato Phytophthora infestans sporangia in North-West Spain. Agron. J. 2019, 111, 354–361. [Google Scholar] [CrossRef]
  19. Yellareddygari, S.K.R.; Taylor, R.J.; Pasche, J.S.; Zhang, A.; Gudmestad, N.C. Predicting potato tuber yield loss due to early blight severity in the Midwestern United States. Eur. J. Plant Pathol. 2018, 152, 71–79. [Google Scholar] [CrossRef]
  20. Van der Waals, J.E.; Korsten, L.; Aveling, T.A.S.; Denner, F.D.N. Influence of environmental factors on field concentrations of Alternaria solani conidia above a South African potato crop. Phytoparasitica 2003, 31, 353–364. [Google Scholar] [CrossRef]
  21. Abuley, I.K. Decision Support System in the Control of Potato Early Blight (Alternaria solani and Alternaria alternata). Ph.D. Thesis, Agrobiology Plant Nutrition and Health, Aarhus University, Aarhus, Denmark, 2015; p. 145. [Google Scholar]
  22. Kim, K.W.; Kim, K.R.; Park, E.W. Effects of interrupted wetness periods on conidial germination, germ tube elongation and infection periods of Botryosphaeria dothidea causing apple white rot. Plant Pathol. J. 2016, 32, 1–7. [Google Scholar] [CrossRef] [PubMed]
  23. Vloutoglou, I.; Kalogerakis, S.N. Effects of inoculum concentration, wetness duration and plant age on development of early blight (Alternaria solani) and on shedding of leaves in tomato plants. Plant Pathol. 2000, 49, 339–345. [Google Scholar] [CrossRef]
  24. Grove, G.G. Influence of temperature and wetness period on infection of cherry and peach foliage by Wilsonomyces carpophilus. Can. J. Plant Pathol. 2002, 24, 40–45. [Google Scholar] [CrossRef]
  25. Llorente, I.; Montesinos, E. Effect of relative humidity and interrupted wetness periods on brown spot severity of pear caused by Stemphylium vesicarium. Phytopathology 2002, 92, 99–104. [Google Scholar] [CrossRef] [PubMed]
  26. Xu, X.M.; Monger, W.; Ritieni, A.; Nicholson, P. Effect of temperature and duration of wetness during initial infection periods on disease development, fungal biomass and mycotoxin concentrations on wheat inoculated with single, or combinations of Fusarium species. Plant Pathol. 2007, 56, 943–956. [Google Scholar] [CrossRef]
  27. Everts, K.L.; Lacy, M.L. The influence of dew duration, relative humidity, and leaf senescence on conidial formation and infection of onion by Alternaria porri. Phytopathology 1990, 80, 1203–1207. [Google Scholar] [CrossRef]
  28. Galán-Soldevilla, C.; Gonzalez, P.C.; Teno, P.A.; Vilches, E.D. Spanish Aerobiology Network (REA): Management and Quality Manual.; Servicio de publicaciones de la Universidad de Córdoba: Córdoba, Spain, 2007; pp. 1–300. [Google Scholar]
  29. National Weather Service Website. Meteogalicia: Xunta de Galicia. Available online: http://www.meteogalicia.es/ (accessed on 15 October 2018).
  30. Adavi, Z.; Moradi, R.; Saeidnejad, A.S.; Tadayon, M.R.; Mansouri, H. Assessment of potato response to climate change and adaptation strategies. Sci. Hortic. 2018, 228, 91–102. [Google Scholar] [CrossRef]
  31. Kapsa, J.S. Important threats in potato production and integrated pathogen/pest management. Pot. Res. 2008, 51, 385–401. [Google Scholar] [CrossRef]
  32. Moschini, R.C.; Martínez, M.I.; Sepulcri, M.G. Sistemas de pronóstico de enfermedades. In Agrometeorología, 2nd ed.; Guillermo, M.M., Rafael, H.H., Eds.; Facultad de Agronomía UBA: Buenos Aires, Argentina, 2013; pp. 409–441. [Google Scholar]
  33. Pacilly, F.C.; Groot, J.C.; Hofstede, G.J.; Schaap, B.F.; van Bueren, E.T.L. Analyzing potato late blight control as a social-ecological system using fuzzy cognitive mapping. Agron. Sustain. Dev. 2016, 36, 35. [Google Scholar] [CrossRef]
  34. Iglesias, I.; Escuredo, O.; Seijo, M.C.; Méndez, J. Phytophthora infestans prediction for a potato crop. Am. J. Potato Res. 2010, 87, 32–40. [Google Scholar] [CrossRef]
  35. Fernández-González, M.; Rodríguez-Rajo, F.J.; Escuredo, O.; Aira, M.J. Optimization of integrated pest management for powdery mildew (Uncinula necator) control in a vineyard based on a combination of phenological, meteorological and aerobiological data. J. Agric. Sci. 2013, 151, 648–658. [Google Scholar] [CrossRef]
  36. Fry, W.E. Phytophthora infestans: New tools (and old ones) lead to new understanding and precision management. Annu. Rev. Phytopathol. 2016, 54, 529–547. [Google Scholar] [CrossRef] [PubMed]
  37. Kaundal, R.; Kapoor, A.S.; Raghava, G.P.S. Machine learning techniques in disease forecasting: A case study on rice blast prediction. BMC Bioinform. 2006, 7, 485. [Google Scholar] [CrossRef] [PubMed]
  38. Klem, K.; Vánová, M.; Hajšlová, J.; Lancová, K.; Sehnalová, M. A neural network model for prediction of deoxynivalenol content in wheat grain based on weather data and preceding crops. Plant Soil Environ. 2007, 53, 421–429. [Google Scholar] [CrossRef]
  39. Seijo-Rodríguez, A.; Escuredo, O.; Rodríguez-Flores, M.S.; Seijo, M.C. Improving the use of aerobiological and phenoclimatological data to forecast the risk of late blight in a potato crop. Aerobiologia 2018, 34, 315–324. [Google Scholar] [CrossRef]
Figure 1. Location of the study area.
Agronomy 09 00585 g001
Figure 2. Daily data of the meteorological conditions recorded by potato growing season. Each subfigure (ai) includes the mean, minimum and maximum temperature, mean relative humidity and accumulated rain recorded in each crop cycle studied.
Agronomy 09 00585 g002
Figure 3. Plot of Alternaria concentration by year recorded during the period of potato crop.
Agronomy 09 00585 g003
Figure 4. Days with interrupted wet periods (bars) by crop cycle. Each subfigure (ai) includes the results of interrupted wet periods by crop cycle studied.
Agronomy 09 00585 g004
Table 1. Airborne Alternaria spores in the environment crop by year. Values of the first and maximum peak of Alternaria with the corresponding date and number of days from sowing. Average values of the environmental conditions given up to the first peak of Alternaria considered.
Year200720082009201020142015201620172018
Total cycle
Total Alternaria42793813815368496290365161431215510454
Mean concentration43 a45 a90 bd97 bcd74 ab42 a65 abc115 de89 bde
First peak
Date05 Jun26 Jun05 Jun24 Jun22 Jun15 Jun23 Jun16 May06 Jun
Alternaria (spores/m3)71195941737788799878
Days352039435355222523
Mean Alternaria (spores/m3) *11619222915681730
Minimum temperature (°C) *6.58.25.78.27.07.09.55.17.7
Mean temperature (°C) *12.216.314.315.714.915.317.112.513.6
Maximum temperature (°C) *18.024.622.824.623.424.825.622.219.5
Mean thermal amplitude (°C) *11.516.317.216.316.417.916.117.111.8
Mean relative humidity (%) *78.584.275.976.070.676.078.672.180.9
Rain (mm) *2.91.02.31.30.81.81.32.92.8
Maximum peak
Date09 Aug09 Sep05 Aug08 Jul11 Aug06 Aug22 Aug17 Jun15 Sep
Alternaria (spores/m3)218255588567470203294534359
Days10075100571031078257126
Different letter shows significant differences in mean values (p < 0.05). * Mean data until the first peak of Alternaria considered.
Table 2. Number of days and date with interrupted wet periods (IWP) considering the first peak Alternaria and the days with 6 IWP by crop cycle.
200720082009201020142015201620172018
Considering the first peak of Alternaria
Date of first peak05 Jun26 Jun05 Jun24 Jun22 Jun15 Jun23 Jun16 May06 Jun
IWP previous to first peak (number of days)7198211011143
Considering 6 IWP
Date20 Jun17 May14 Jun29 May09 May18 Jun06 May12 Jun
6 IWP previous to first peak (number of days)6201125386110
Table 3. Spearman correlation coefficients between Alternaria concentration and weather parameters, and Alternaria concentration of the same day, and on 1 to 4 days prior (−1, −2, −3, and −4). ** p < 0.01; * p < 0.05.
R2p
Alternaria−1 day0.553 **0.000
−2 day0.461 **0.000
−3 day0.340 **0.000
−4 day0.305 **0.000
Minimum temperatureSame day0.181 **0.000
−1 day0.157 **0.000
−2 day0.182 **0.000
−3 day0.200 **0.000
−4 day0.217 **0.000
Mean temperatureSame day0.223 **0.000
−1 day0.206 **0.000
−2 day0.167 **0.000
−3 day0.161 **0.000
−4 day0.174 **0.000
Maximum temperatureSame day0.185 **0.000
−1 day0.178 **0.000
−2 day0.119 **0.001
−3 day0.088 **0.012
−4 day0.091 **0.010
Mean relative humiditySame day−0.0310.385
−1 day−0.0090.808
−2 day0.0620.078
−3 day0.090 *0.010
−4 day0.075 *0.034
RainSame day−0.0470.187
−1 day−0.0560.114
−2 day−0.0280.425
−3 day−0.0320.371
−4 day−0.0320.371

