Article

Organic Manure Coupled with Inorganic Fertilizer: An Approach for the Sustainable Production of Rice by Improving Soil Properties and Nitrogen Use Efficiency

1
Key Laboratory of Crop Cultivation and Farming Systems, College of Agriculture, Guangxi University, Nanning 530004, China
2
Institute of Nuclear Agricultural Sciences, College of Agriculture and Biotechnology, Zhejiang University, Hangzhou 310058, China
3
Department of Agronomy, Amir Muhammad Khan Campus Mardan, University of Agriculture, Peshawar 25130, Pakistan
*
Author to whom correspondence should be addressed.
Submission received: 30 September 2019 / Revised: 11 October 2019 / Accepted: 16 October 2019 / Published: 18 October 2019
(This article belongs to the Special Issue Organic vs. Conventional Cropping Systems)

Abstract

:
The current farming system is heavily reliant on chemical fertilizers, which negatively affect soil health, the environment, and crop productivity. Improving crop production on a sustainable basis is a challenging issue in the present agricultural system. To address this issue, we assumed that the combined use of organic manure and inorganic nitrogen (N) fertilizers can improve rice grain yield and soil properties without the expense of the environment. This study explores the combined effects of cattle manure (CM), poultry manure (PM), and chemical fertilizer (CF) on soil properties, rice growth, physiology, and grain yield and quality. Six treatments in the following combinations were included: T1—no N fertilizer; T2—100% CF; T3—60% CM + 40% CF; T4—30% CM + 70% CF; T5—60% PM + 40% CF; and T6—30% PM + 70% CF. Results showed that across the seasons, treatment T6 increased the net photosynthesis rate, total biomass, grain yield, and amylose content by 23%, 90%, 95%, and 10%, respectively, compared with control. This increment in net photosynthetic rate and growth was the result of 24%, 14%, 19%, and 20% higher total root length, root surface area, root volume, and root diameter, respectively. Improvements in these attributes further enhanced the grain yield and nitrogen use efficiency of rice. No significant difference between T4 and T6 was observed. The correlation analysis also confirmed that root morphological traits were positively correlated with grain yield, N uptake, and biomass accumulation. Similarly, improvement in grain yield and NUE was also associated with improved soil properties, i.e., bulk density, soil porosity, soil organic carbon, and total N under combined organic and inorganic N fertilizers treatment. Conclusively, the integration of 30% N from PM or CM with 70% N from CF (urea) is a promising option not only for higher grain yield and quality of rice but also for improved soil health. This study provides a sustainable nutrient management strategy to improve crop yield with high nutrient use efficiency.

1. Introduction

Recently, the increase in world population has resulted in a demand for more food; hence, enhancing crop production is challenging work in present conventional farming systems [1,2]. Conventional farming increases crop productivity, but strongly depends on chemical fertilizer (CF) input and pesticides [2,3], and thus adversely affects soil quality and nutrient use efficiency (NUE) [4,5]. Despite the excessive use of mineral N fertilizer, a huge amount is lost and/or unavailable to plants in most present farming systems. Applied N losses produces serious environmental problems, such as water pollution and enhanced greenhouse gas emission, and particularly leads to degradation of soil physiochemical and biological properties [6,7,8]. Furthermore, the overuse of CF causes soil acidification and reduced soil microbial biomass, which ultimately reduces soil fertility [9,10]. Moreover, sole mineral fertilization enhances the decomposition of soil organic matter (SOM), which leads to degraded soil structure and declined soil aggregation and loss of nutrients through leaching, fixation, and greenhouse gases emission [11,12]. Additionally, the use of CF on soil over long periods of time may affect its capability to maintain healthy crop growth and productivity [13]. Therefore, our continued overreliance on CF for crop production is not sustainable.
Accordingly, there is growing interest in developing NUE for advanced farming to decrease the associated problems without compromising crop productivity. Currently, the most challenging issue is to enhance grain yield, in order to feed the population on a sustainable basis with the least cost to the environment [14,15]. Previous investigations have recommended several N fertilizer management strategies, including optimal CF dosage [16], side-deep placement [17], and slow-release fertilization [18]. However, the development of these practices was restricted because they are labor-intensive and there is a lack of improved technology [19]. In contrast to CF application, organic manure, a byproduct derived from animal waste, has been utilized to increase crop productivity [20,21]. The application of organic manure has multiple benefits due to the balanced supply of both macroand micronutrients. This can enhance soil nutrients due to enhanced soil microbial activity, improving soil physical and chemical properties [22,23]. The slow and gradual release of N from organic manure is an advantage over sole chemical fertilization for achieving higher NUE, grain yield, and quality of rice [24,25]. Furthermore, manure fertilization not only provides soil organic carbon (SOC), but the residual effect of manure fertilization is higher soil nutrient availability for crop growth and development [26]. The alkaline nature of organic manure is the main reason for increased soil pH, while mineral N nitrification can develop protons to decrease soil pH [27]. However, organic fertilizer is quite low in nutrient content and its nutrient releasing ability is also low to meet crop requirements in a short time, hence the sole application of manure could not meet the usual intensity of agriculture production. Organic manure coupled with synthetic fertilizers has been confirmed to be a better approach to improve and sustain soil fertility and crop production than the sole application of mineral or organic manure [28,29].
Rice (Oryza sativa L.) is the third most consumed staple food by half of the world’s population and nearly 60% of China’s population [30,31]. China is a major rice producer and consumer and is ranked first in the world [32]. The increasing population has created a demand for 20% more rice production by 2030 to meet domestic need [33]. In China, rice producers mainly rely on the heavy use of CF to increase crop yield. In 2013, the N fertilization amount in China was 33.50Tg, accounting for 33% of the world’s N fertilizer application [33]. In order to enhance NUE and decrease the harmful impacts of mineral fertilizer on soil properties and improve rice production and quality, sustainable management practices are needed. However, there have been limited studies evaluating the influence of organic manure (from cattle or poultry) with inorganic fertilizer (urea) on paddy soil properties, rice production, root morphological traits and its relationship with N uptake, biomass production, and grain yield, especially under Ultisols in southern China.
Importantly, many investigations were performed on a weight basis rather than the application of manure on specific N concentration integrated with chemical fertilizer in rice [34,35]. Furthermore, we used the Zhenguiai, an inbred cultivar which is widely cultivated in southern China, Guangxi Province for rice noodles. This cultivar is characterized by short growth duration and a good morphological structure with high grain filling percentage [36]. It was assumed for the current work that organic manure coupled with inorganic fertilizers could improve soil properties and root growth, which in turn has a positive correlation with N uptake, biomass production, and grain yield. The specific objective of the present research was to determine the most effective and economical combination of organic and inorganic N fertilizer to improve crop growth, N uptake, grain yield, and quality of the Zhenguiai cultivar.

2. Materials and Methods

2.1. Experimental Site and Weather Details

The experiment was performed at the experimental station of Guangxi University, Nanning, China (22°49′12″ N, 108°19′11″ E; 75 m) during the early season (March to July) and late season (August to December) of 2018. The climate is categorized as subtropical with a monsoon zone, with a mean annual precipitation of 1190 mm. The ranges of mean maximum and minimum temperatures are 30.9–36.7 °C and 23.8–27.3 °C during the early season and 23.32–27.34 °C and 11.5–18.1 °C in the late the season. The early season received 660 mm rain fall, and the late season 335 mm. The range of average relative humidity is 78.5–86.6% in the early season and 72.8–90.0% in the late season (Table 1). The soil (0–20 cm) is Ultisols, which is acidic with a 5.90 (H2O), comprising 17.0 g kg−1 organic matter, 1.35 g kg−1 total N (TN), 23.5 mg kg−1 available phosphorous (AP), 232.6 mg kg−1 available potassium (AK) with 1.37 g cm−3 soil bulk density (BD) (Table 2).

2.2. Experimental Design and Field Management

An outdoor pot experiment was conducted during the early and late rice growing seasons. Soil was collected from the uppermost 20 cm layer of the experimental site. Plastic pots (29.4 cm width, 19.4 cm depth, and 26.5 cm height) were filled after the soil was air dried and pulverized. Pots were arranged in a completely randomized design with 12 replications and placed under natural field conditions with 35 cm distance between them. In order to minimize experimental error, the size and weight of the soil samples were strictly controlled during the collection process, and it was ensured that the soil in each pot remained at the same volume and each pot received 15 kg of soil. Cattle manure (CM) and poultry manure (PM) were the organic sources and urea was used as the chemical fertilizer (CF). The study consisted of six treatments and the percentage composition of organic manure and CF was as follows: T1—no N fertilizer; T2—100% CF; T3—60% CM + 40% CF; T4—30% CM + 70% CF, T5—60% PM + 40% CF; and T6—30%PM + 70% CF.
Zhenguiai cultivar seeds were grown in plastic seedling trays, and two of the 25-day-old uniform size seedlings were transplanted per hill and two hills per pot. The recommended rate of NPK 300:150:300 (kg ha−1) was used and each pot received 0.90 g P2O5 from superphosphate, 2.20 g KCl from potassium chloride, and 1.80 g N from both organic manure (PM or CM) and inorganic source urea. Nutrient content and amount for each treatment are shown in Table 3. Nitrogen and potassium were applied in three splits, 60% as a basal dose, 20% at early tillering stage, and 20% at panicle initiation, whereas all P was applied as a basal dose one day before transplanting (Table 3). Cattle and poultry manure were collected the from the cattle and poultry farms located in Nanning city and uniformly mixed with soil 20 days before transplanting. The control pots received no N fertilizer, but they received P and K fertilizers, similar to N treated pots. Uniform flood water about 4 cm deep was continued from transplanting until physiological maturity. Throughout the growing season, standard agricultural practices, such as irrigation, insecticides, and herbicides, were done similarly for all pots during both seasons.

2.3. Physical and Chemical Features of Soil and Organic Manure BeforeExperimentation

The physicochemical properties of the site and manure used in this experiment are shown in Table 2. The soil of the experimental site was acidic in nature (pH 5.90), with high bulk density (BD) of 1.38 g cm−3 and lower organic matter (16.51 g kg−1), TN (1.35 g kg−1), AP (22.21 mg kg−1), and AK (230.50 mg kg−1). The pH of CM and PM was 7.75 and 7.95, respectively, indicating alkalinity. PM had higher organic C (164.20 g kg−1), N (12.85 g kg−1), and BD (0.77 g cm−3) than CM.

2.4. Sampling and Analysis

2.4.1. Soil and Manure Sampling and Analysis

The basic soil properties are presented in Table 2. Initial soil and organic manure sub-samples were taken randomly, air-dried, and passed through a 2 mm sieve. Similarly, three replicated samples were taken from up to 20 cm depth for each treatment after harvest in both the early and late seasons to determine the changes in soil physical and chemical properties. Samples were air-dried at room temperature and separated into two sub-samples. The core method was used to determine soil bulk density (BD) [37]. The obtained soil BD was further used to calculate soil total porosity using the method in Equation (1) [38]:
Porosity = (1 − (BD/PS)) × 100
where BD is soil bulk density and PS is particle density, assumed to be 2.65 mg m−3. Soil moisture content was determined by the method described in [39]. Initially, air-dried soil was taken and passed through a 0.5 mm sieve, and the weight of tin (g) was taken as W1, then 1 g soil sample was taken along with then tin and weighed as W2. The soil samples were kept in an oven for 2 h at 105 °C to obtain a constant weight as W3. Soil moisture content (%) was determined by the following formula (Equation (2)):
MC   % = W 2 W 3 W 3 W 1
The pHs of soil and organic fertilizer were determined after shaking the soil and manure with distilled water at a 1:2.5 (w/v) solid-to-water ratio for 1 h with the help of a digital pH meter (Thunderbolt PHS-3C, Shangai, China) [40]. For total organic carbon, sub samples were ground and again made to pass through a 0.25 mm sieve. Total organic carbon was determined by the method in [41]. Soil organic matter was measured by multiplying total organic carbon by 1.72. For total N (TN) analysis, 200 mg samples were weighted and digested using the salicylic acid–sulfuric acid–hydrogen peroxide method [42], then TN was analyzed using the micro-Kjeldahl procedure [43], and total phosphorous (TP) was tested using the ascorbic acid method [44]. Standard stock solution was prepared by dissolving KCl in distal water. Potassium was determined by using an atomic absorption spectrophotometer (Z-5300; Hitachi, Tokyo, Japan) after samples were digested. Available N (AN) was extracted from the soil samples using the hot water extraction method [45]. Furthermore, available P (AP) was extracted by Olsen’s method with 0.5 m NaHCO3 solution adjusted to pH 8.5 [46]. Finally, available K (AK) was found from air-dried soil samples that passed through a 2 mm sieve. Then, transferred to a 100 mL polyethylene bottle, together with 50 mL of the ammonium acetate/acetic acid solution, AP was extracted by the method outlined in [47].

2.4.2. Leaf Gas Exchange Attributes

The photosynthesis parameters, including net photosynthetic rate (Pn), stomatal conductance (gs), transpiration rate (Tr), and intercellular CO2 content (Ci), were determined attillering, heading, and milking stages during both the early and late seasons. For each pot, fully expanded flag leaves were selected for photosynthesis measurement using a portable photosynthesis system (Li-6400, Li-COR Inc., Lincoln, NE, USA). The measurements were done on a sunny day, from 09:30 to 12:30 under the following conditions: light intensity—1200 µmol m−2 s−1; air humidity—70%; CO2—375 μmol mol−1; and leaf temperature—28 °C.

2.4.3. Biomass and Nitrogen Accumulation

Samples were collected from each pot at tillering, heading, and maturity stages for the measurement of total biomass and N accumulation. These samples were divided into roots, stems, leaves, and panicles and then oven-dried at 85 °C. Total N content was determined according to the micro-Kjeldhal method [43]. Nitrogen use efficiency (NUE) was calculated using Equation (3):
NUE = N   uptake   in   fertilized   pots N   uptake   in   unfertilized   pots × 100 N   applied

2.4.4. Root Morphological Traits

Rice root morphological traits included total root length (m hill−1) (TRL), total root surface area (m−2 hill−1) (TRSA), total average root diameter (m−3 hill−1) (TARD), and total root volume (mm hill−1) (TRV). Root samples were taken from three hills of each treatment with an equal number of tillers, carefully cut the roots from plant and washed to remove soil dirt with running water. The measurements were done at tillering, heading, and maturity stages using an Epson Expression 10000XL scanner and root analysis software (WinRHIZO Prov. 2009c, Regent Instruments, Quebec, Canada). After scanning, root samples were dried at 75 °C for three days to measure root dry weight. Root-to-shoot ratio was determined by dividing root dry weight by shoot dry weight.

2.4.5. Growth, Yield, and Yield Components

Rice growth, yield, and yielding attributes were calculated for each treatment. The crop was harvested manually and then threshed by the thresher. Grain yield was expressed as grams per hill at 14% moisture content, while harvest index (HI) was determined as the ratio of grain yield to and to total biomass at maturity. Both hills were selected from each pot to obtain the agronomic traits, including plant height, number of tillers, flag leaf area, panicle length, number of spikelets (panicle−1), filled grain (%), and 1000-grain weight.

2.4.6. Nutritive Quality

After harvesting, rice grains were air-dried to up to 10–12% moisture content and flour was made from the milled rice for quality assessment. Amylose content was measured by the method in [48]. Protein content was found by total grain N content multiplied by a protein conversion coefficient of 5.95. Gel consistency was found by the method in [49]. For alkali spreading value (gelatinization temperature (GT)), six milled rice grains were soaked for 24 h in 10 mL potassium hydroxide of 1.5% and 1.7%. Scores of 2 to 7 were given: 2 meant no reaction (high gel temperature) and 7 meant low gel temperature [50].

2.4.7. Statistical Analysis

Analysis of variance was conducted to test the differences in physiological, morphological, and grain quality attributes of rice using Statistics 8.1 analytical software. The collected data were first check for normal distribution and after following the assumptions. Data were analyzed in a completely randomized design using one-way ANOVA. Data (in percentage) were arcsine transformed to normalize the variables before analysis. For multiple comparison tests among the treatments of both experiments, the least significant difference (LSD) test at p < 0.05 was used to detect significant differences among the means. For correlation analysis, Pearson’s linear correlation was used to evaluate the relationships between response variables.

3. Results

3.1. Physiochemical Properties of Soil

The combined application of CF with either cattle or poultry manure had a significant effect on soil physical and chemical properties (Table 4 and Table 5). Soil physical features, such as porosity (POR), moisture content (MC), and bulk density (BD), were recorded to be considerably varied in the soil after harvesting the rice during early and late seasons. The combined application of CM 60% + CF40% (T3) significantly reduced soil BD by 7% and 13%compared with baseline soil during the early and late seasons, respectively, followed by pots with CM or PM application (30% + CF 70%; T4 and T6). Similarly, compared with sole urea application, T3 increased soil porosity by 7.5% and 14.5%, and moisture content by 10% and 16%, followed by T5, T4, and T6 during the early and late seasons, respectively.
Soil chemical properties, including pH, SOC, SOM, TN, AP, and AK ratio were significantly different among the treatments at up to 15 cm depth post-harvest during both seasons (Table 5). The combined application of CM or PM with CF significantly increased soil chemical properties compared to sole inorganic fertilizer treatment. Compared with sole urea fertilizer, T3 increased soil pH by 6.2% and 8.4%, SOC by 17% and 33%, SOM by 17% and 33%, and soil TN by 20% and 35% during the early and late seasons, respectively. However, no significant differences were observed in T3 and T5. The minimum values were observed in T2 and T1. Similarly, T3 enhanced soil AP by 10% and 17% and AK 22% and 64% compared with T2 during the early and late seasons, respectively. T5 was to be found statistically at par (p < 0.05) with T3.

3.2. Root Morphological Features

Rice root morphological attributes, including total root length (TRL), total root surface area (TRSA), total root volume (TRV), and average root diameter (ARD), were significantly different among N embedded treatments during the early and late season (Table 6). Root morphological traits showed upward and downward trends throughout the growing season, higher at heading and lower at maturity. Root morphological traits showed the same behavior across the seasons, and the average increased in TRL, TRSA, TRV, and ARD by 22%, 17%, 28%, and 19%, respectively, observed in T4 compared to control at maturity. T2 and T6 were found to be statistically non-significant with T4. Lower root morphological traits were noted in control pots during both seasons. The root-to-shoot ratio reflects plant growth and development and the coordination of the below-and-above ground parts of the plant. The root-to-shoot ratio of rice decreased gradually with the growth process (Figure 2G–H). Compared with control, N embedded treatment increased the root-to-shoot ratio significantly during both seasons. Across the stages, T3 treatment showed maximum root-to-shoot ratio during both seasons. T3 was statically on par (p < 0.05) with all treatments except control. The results show that combined organic manure and inorganic fertilizer affected the root-to-shoot ratio.

3.3. Leaf Gas Exchange Attributes

Photosynthesis traits, including net photosynthesis rate (Pn), transpiration rate (Tr), stomatal conductance (gs), and intercellular CO2 concentration (Ci), at the tillering, heading, and milking stages, were significantly influenced by N treatments during the early and late seasons (Figure 1A–H). All traits showed a quadratic trend across growth, with maximum values at heading and lower values at the milking stage in both seasons. Across the seasons at the tillering stage, Pn was significantly higher in T2 by 21%, while at the heading and milking stage, Pn was 23% and 19%, respectively, in T6 compared with control. T2 and T4 were statistically similar (p < 0.05) to T6. The differences in Tr, gs, and Ci were non-significant among N embedded treatments and control at tillering, while at heading and milking stages they were found to be significantly higher than control during both seasons. Tr, gs, and Ci were considerably higher by 24%, 30%, and 9% at heading and 7%, 23%, and 8% at milking stage in T6 than control across the seasons. However, no significant differences were observed between the T2 and T4 treatments and T6.

3.4. Biomass, Nitrogen Accumulation, and NUE

Dry matter production and N uptake, which reflect the growth and metabolic ability of a crop, conclusively control the economic yield. Biomass and N accumulation increased progressively with improved growth and attained the highest weight at maturity. Biomass and N accumulation (NA) differed significantly between control and N embedded treatment (Figure 2A–D). The differences among treatments showed a similar trend for both seasons. Sole urea application (T2) resulted in a higher biomass (18.14 g hill−1 and NA 0.38 g hill−1) at the tillering stage across the seasons, while at heading and maturity, there was maximum biomass accumulation (43.32 and 66.22 g hill−1) and NA (0.43 and 0.67.56 g hill−1), respectively, in T6 across the seasons. In-addition, T2 and T4 were statistically comparable with T6. The lowest biomass and NA were observed in control, followed by T5 and T3, during both seasons. Co-applied organic and inorganic fertilizer had significantly increased nitrogen use efficiency (NUE) compared with sole inorganic fertilizer application. Among the treatments, T6 showed higher NUE by 43.5%, followed by T4at 42.8%, across the seasons (Figure 2E–F). Similarly, T3 and T5 also increased the NUE, and lower NUE was noted in sole urea fertilizer treatment during both seasons.

3.5. Growth, Yield, and Yield Attributes

Combined manure and synthetic fertilizer application had a significant effect on crop growth, grain yield, and yield components of rice during both seasons (Table 7). Growth attributes such as plant height (cm), flag leaf area (cm2), and panicle length (cm) were considerably varied at physiological maturity. In both seasons, T6 and T4 produced maximum growth traits compared with control. At maturity, T6 had greater plant height by 14%, flag leaf area by 34% and panicle length by 16% than control across the seasons. T2 and T4 were statistically at par (p < 0.05) with T6. Compared to control, T6 had increased tillers by 61%, filled grains by 15.5%, and 1000 grain weight by 23% during both seasons. No significant difference was observed between T4 and T6. The highest grain yield (45.4 and 43.5 g hill−1) and biological yield (90.2 and 86.6 g hill−1) were achieved in T6 during early and late seasons, respectively. T4 was statistically non-significant with T6. PM or CM at 30% + CF 70% increased grain yield by 10% over sole urea fertilizer across the seasons.

3.6. Nutritive Quality

Nutritive quality is a primary feature of rice, including amylose content (AC), protein content (PC), gel consistency (GC), and alkali spreading value (GT). In the N embedded treatment, a significant increase in the nutritive quality of rice was observed except GT across the seasons. Differences in nutritive quality are shown in Figure 3A–D. Compared with control, T6 increased AC and PC by 10% and 32% across the seasons. However, T2 and T4 were statistically comparable with T6. Compared to control, GC was found to be significantly higher and statistically comparable in all treatments during both seasons. No significant differences in GT were observed among the treatment during both seasons.

3.7. Correlation Analysis of Root Morphological Traits with Yield, N Uptake, and Biomass

The relationship of rice root morphological attributes with yield, N uptake, and dry matter accumulation is presented in Table 8. Correlation analysis results were significant for root morphological features with yield, N uptake, and total dry mater across the growth stages. At heading and maturity stage, TRL, TRSA, TARD, TRV, and root dry weight (RDW) were positively correlated with yield, N uptake, and dry matter accumulation, whereas at the tillering stage, all traits, except for TARD with yield and N uptake, were highly correlated with yield. All other root traits were positively correlated with total dry matter except TRV and TRL. These results indicate that increments in rice yield, N uptake, and dry matter production directly depend on root growth.

4. Discussion

The current agricultural system heavily depends on chemical fertilizers, which negatively affect soil health, environment, and crop productivity [4,5,51]. In order to improve soil quality, crop production, and quality on a sustainable basis, chemical fertilizer management has recently become an essential aspect of today’s research [10,52]. Organic fertilizer can improve soil health, but its sole application could not meet the plants requirements in a short time due to its low nutrient content and slow release rate of plant nutrient’s [22,52]. Thus, the objective of this study was to determine the effect of a combined application organic manure and synthetic fertilizer on rice growth, physiology, yield, and quality, and soil properties. In the present study, the combined application of cattle and poultry manure with inorganic fertilizer significantly improved paddy soil physicochemical properties (Table 4 and Table 5). The increased soil physical properties indices in the combined application of organic and chemical fertilizer might have been allied with the effect of soil organic matter, which improved soil fertility and pore structure, transportation, and storage traits. Organic manure coupled with mineral fertilizer has been generally accepted as an effective means of enhancing microbial activity, soil aggregation, structure, and water retention capacity [53,54]. Moreover, in this study, differences in SMC could be due to differences in BD between treatments, because higher BD decreased the spaces where water could be retained. A similar finding was stated by Mahmood et al. [54], who reported that manure application reduced BD, and increased soil porosity and water holding capacity.
Soil chemical properties, including pH, SOC, SOM, TN, AP, and AK, were significantly increased in combined treatment compared with baseline soil properties in the current work (Table 5). We observed that the decomposition of manure slowly released nutrients to the soil and showed that increasing the organic manure amount from 30% to 60% improved soil chemical properties. In the current study, sole chemical N fertilization reduced soil pH, while combined treatment significantly enhanced soil pH. A possible explanation for this is that organic manure affects soil acidity, because it often contains sufficient basic cations and carbonate ions to neutralize the acidification effect [55,56]. Furthermore, the alkaline nature of manure is one of the main reasons for the increasing soil pH [27]. The SOC concentration in the surface layer increased significantly under the combined manure and mineral N treatment (Table 5). In fact, the SOC at any given location largely depends on the annual turnover of organics, root and shoot stubbles, and root exudates, and their recycling [22,26]. The significant increment of SOC in this study could be associated with the positive effects of organic manure application. The SOC change rate is derived from both direct C input from manure and indirect C input from incremental crop biomass return to the soil, such as root and crop residue [2]. Our results are in accordance with Purakayastha et al. [57], who reported that combined manure and inorganic fertilizer enhanced SOC by 1180% and soil TN by 56–92% in top soil. Additionally, manure in combination with mineral fertilizer significantly improved the nutrient status of soil (Table 5), tested after harvest in both seasons in the present work. This enhancement in soil nutrient’s (NPK) was obviously associated with organic manure (cattle or poultry) absorbing more leachate generated during the process, which resulted in enhanced water holding capacity, reduced nutrient leaching, and consequentially more available N, P, and K [22,23,24,25,26,27,28,29,30,31,32,33,34,35,36,37,38,39,40,41,42,43,44,45,46,47,48,49,50,51,52,53,54,55,56,57,58].
The favorable effects of organic manure on soil N supply have already been documented [22,23,24]. In this investigation, the highest increase in available P under combined CF, CM, and PM treatment, as shown in Table 5, was very much expected under regular P addition through fertilizer, as cereal crops utilize only a fraction of the applied P [59]. Manure supplies a huge amount of P to soil, and decreases the fixation of applied P in the soil, resulting in increased competition of organic molecules with PO43 ions for P retention sites under combined treatment, which could be another explanation for this finding [60].
The leaching loss of potassium (K) with percolating water is one of the major reasons of K removal from the rhizosphere, especially under irrigated ecology. The greater K fixing ability of illite-dominant soil is the main reason for the decrease in available K in soil [61,62]. On the other hand, the higher available K content under combined manure and mineral treatment in the current study may be ascribed to the release of organic acids during decomposition, which generates negative electron charges in the soil with a preference for di or tri valent cations, such as Al3+, Ca2+, and Mg2+, leaving K+ to be absorbed by negatively-charged soil colloids [63]. This phenomenon might help to reduce K fixation and enhance its availability in soil.
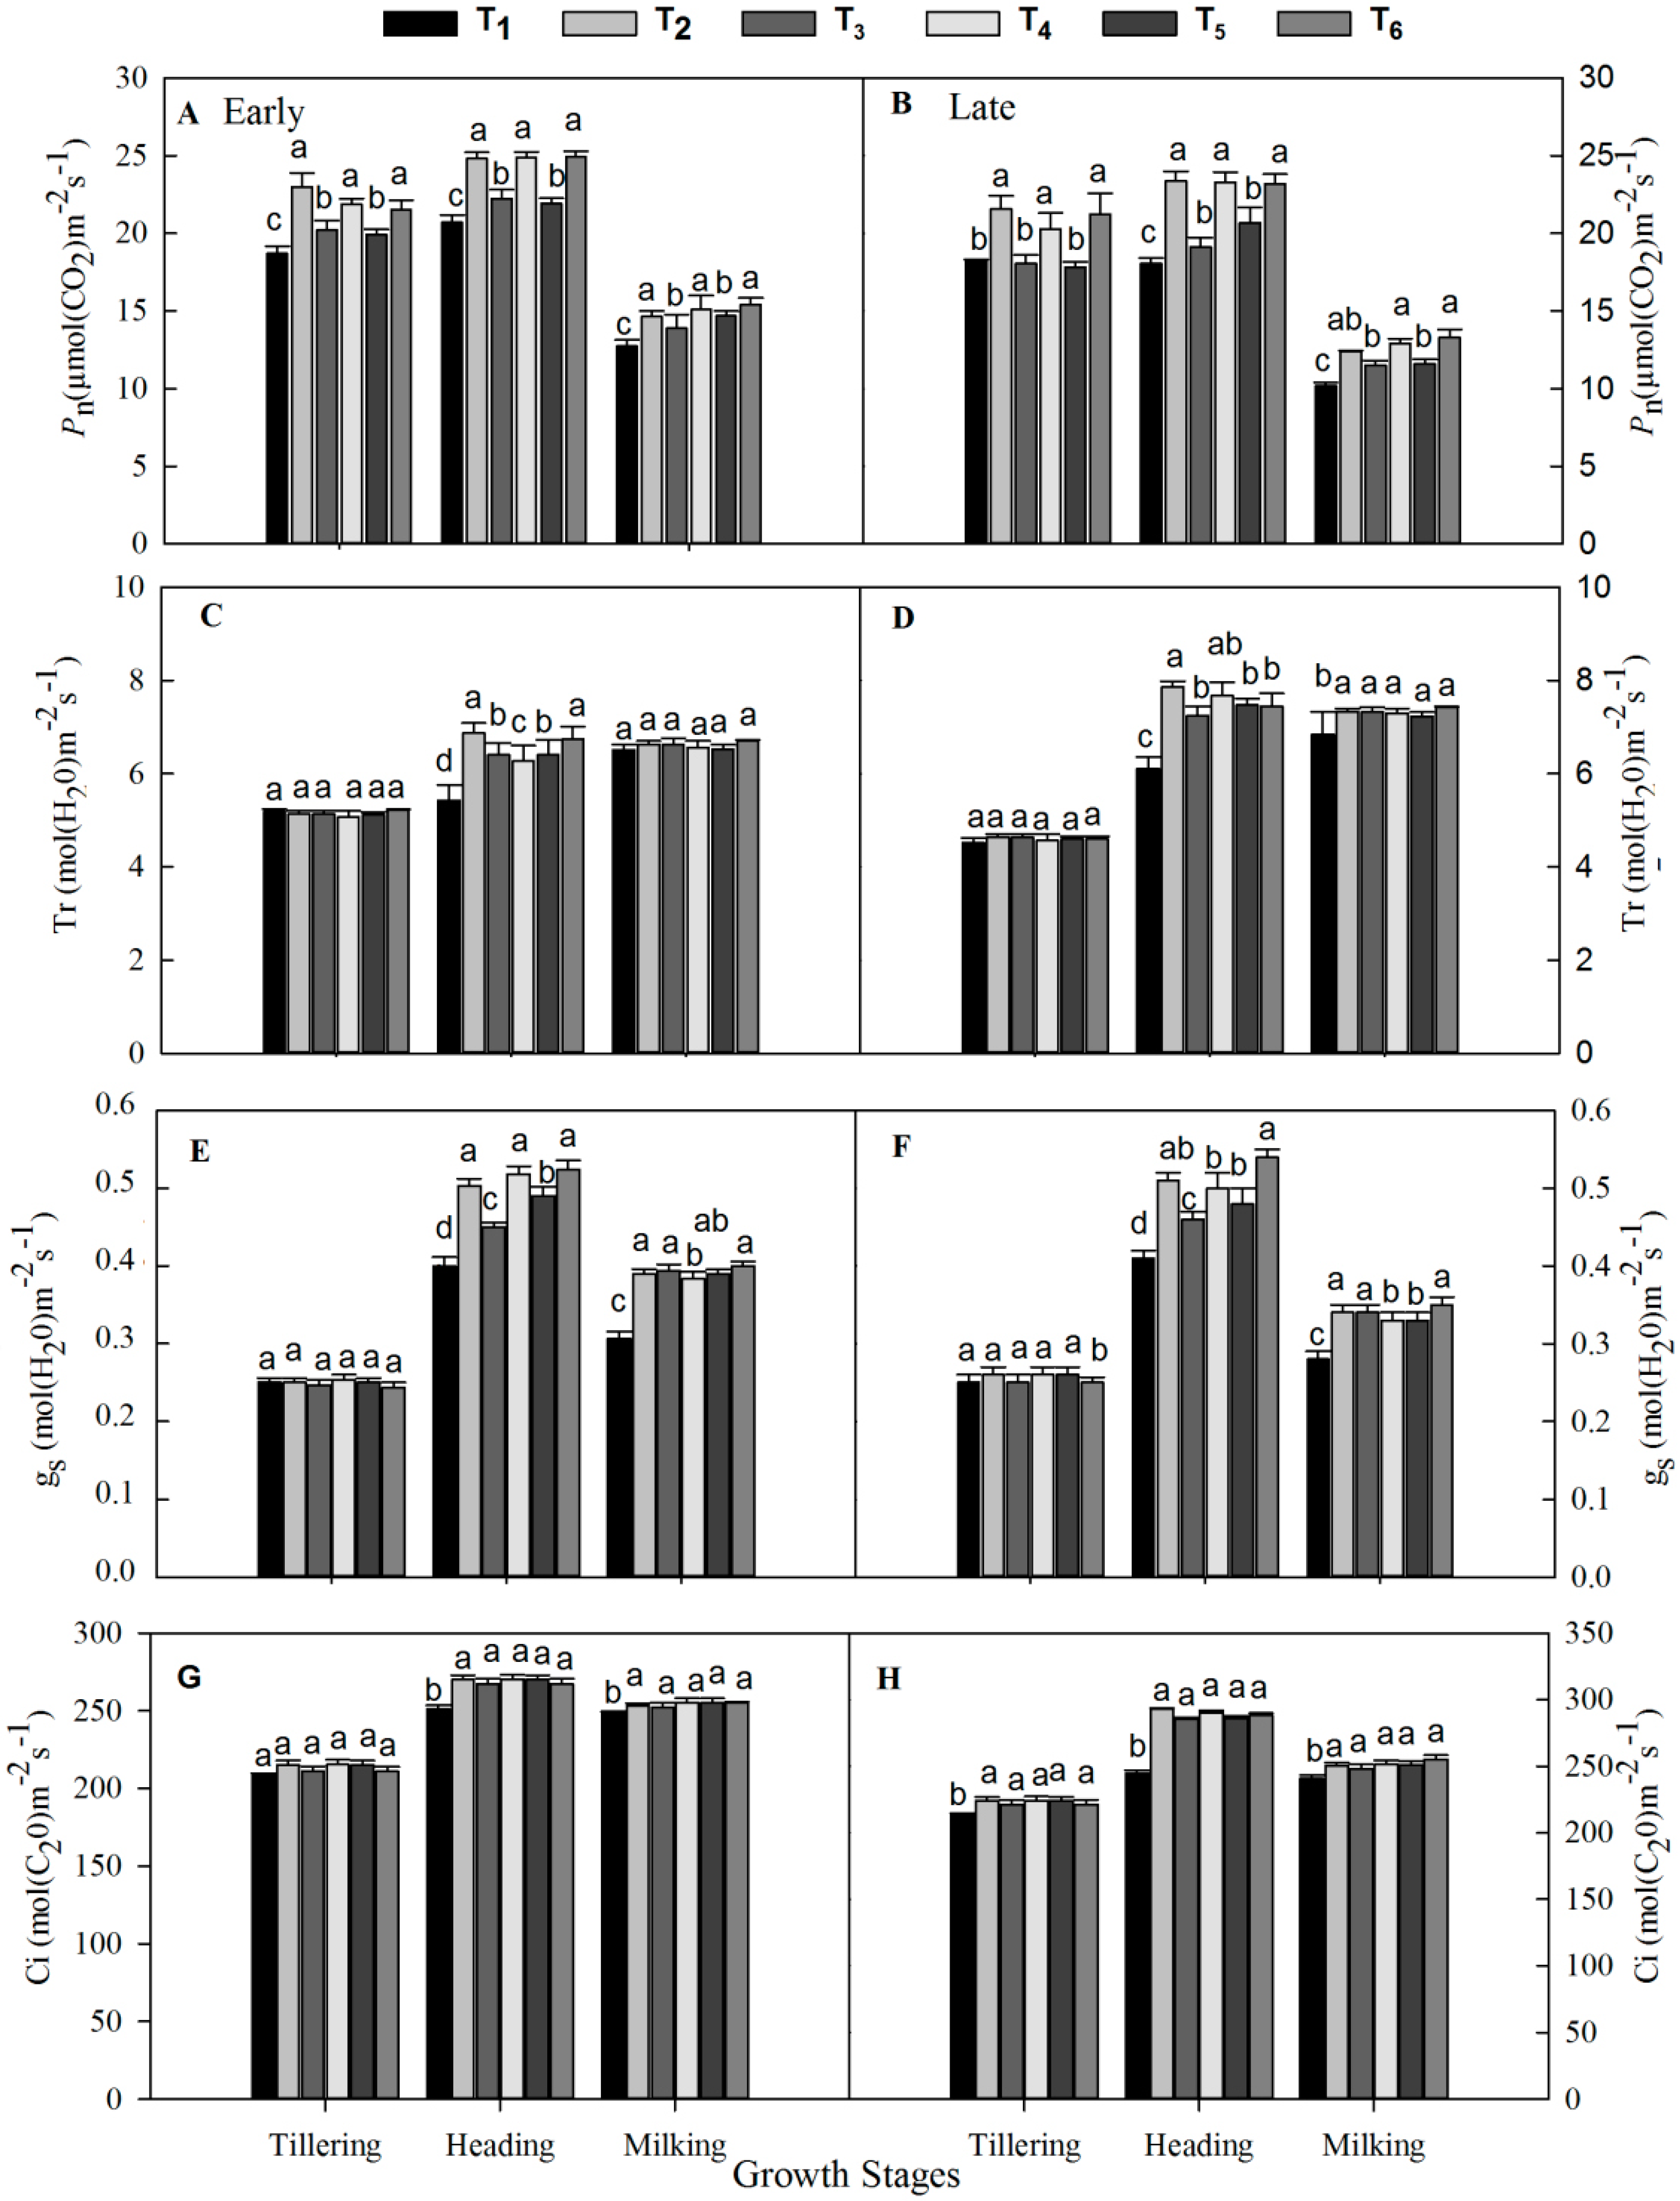
Photosynthesis is the main driver of crop production by improving plant growth and biomass production [64]. Photosynthesis showed a strong response to water and N-supply and uptake [59]. In the present study, the Pn, Tr, gs, and Ci were found to be higher under N treatment compared with control (Figure 1A–G). The increase in photosynthesis indices under organic manure coupled with inorganic fertilizer treatment might be allied to the faster release of nutrients from mineral fertilizer increasing the photosynthetic capacity at early growth, while the slow and gradual release of nutrients from organic manure throughout the growing season enhanced photosynthetic ability, especially at the grain filling stage [65]. A sufficient water and nitrogen supply will decrease water soluble nutrients, and stress producing root-sourced signal (ABA) leads to stomatal opening and improved leaf water potential and physical activity in leaves [66]. From the present results, we demonstrated thatthe combined manure and mineral fertilizer treatment improved soil fertility and root growth (Table 6), which ultimately boosted the root’s ability to absorb water and nutrients, leading to enhanced stomatal conductance, which enhanced the leaf gas exchange attributes and CO2 fixing prior to the heading and milking stages.
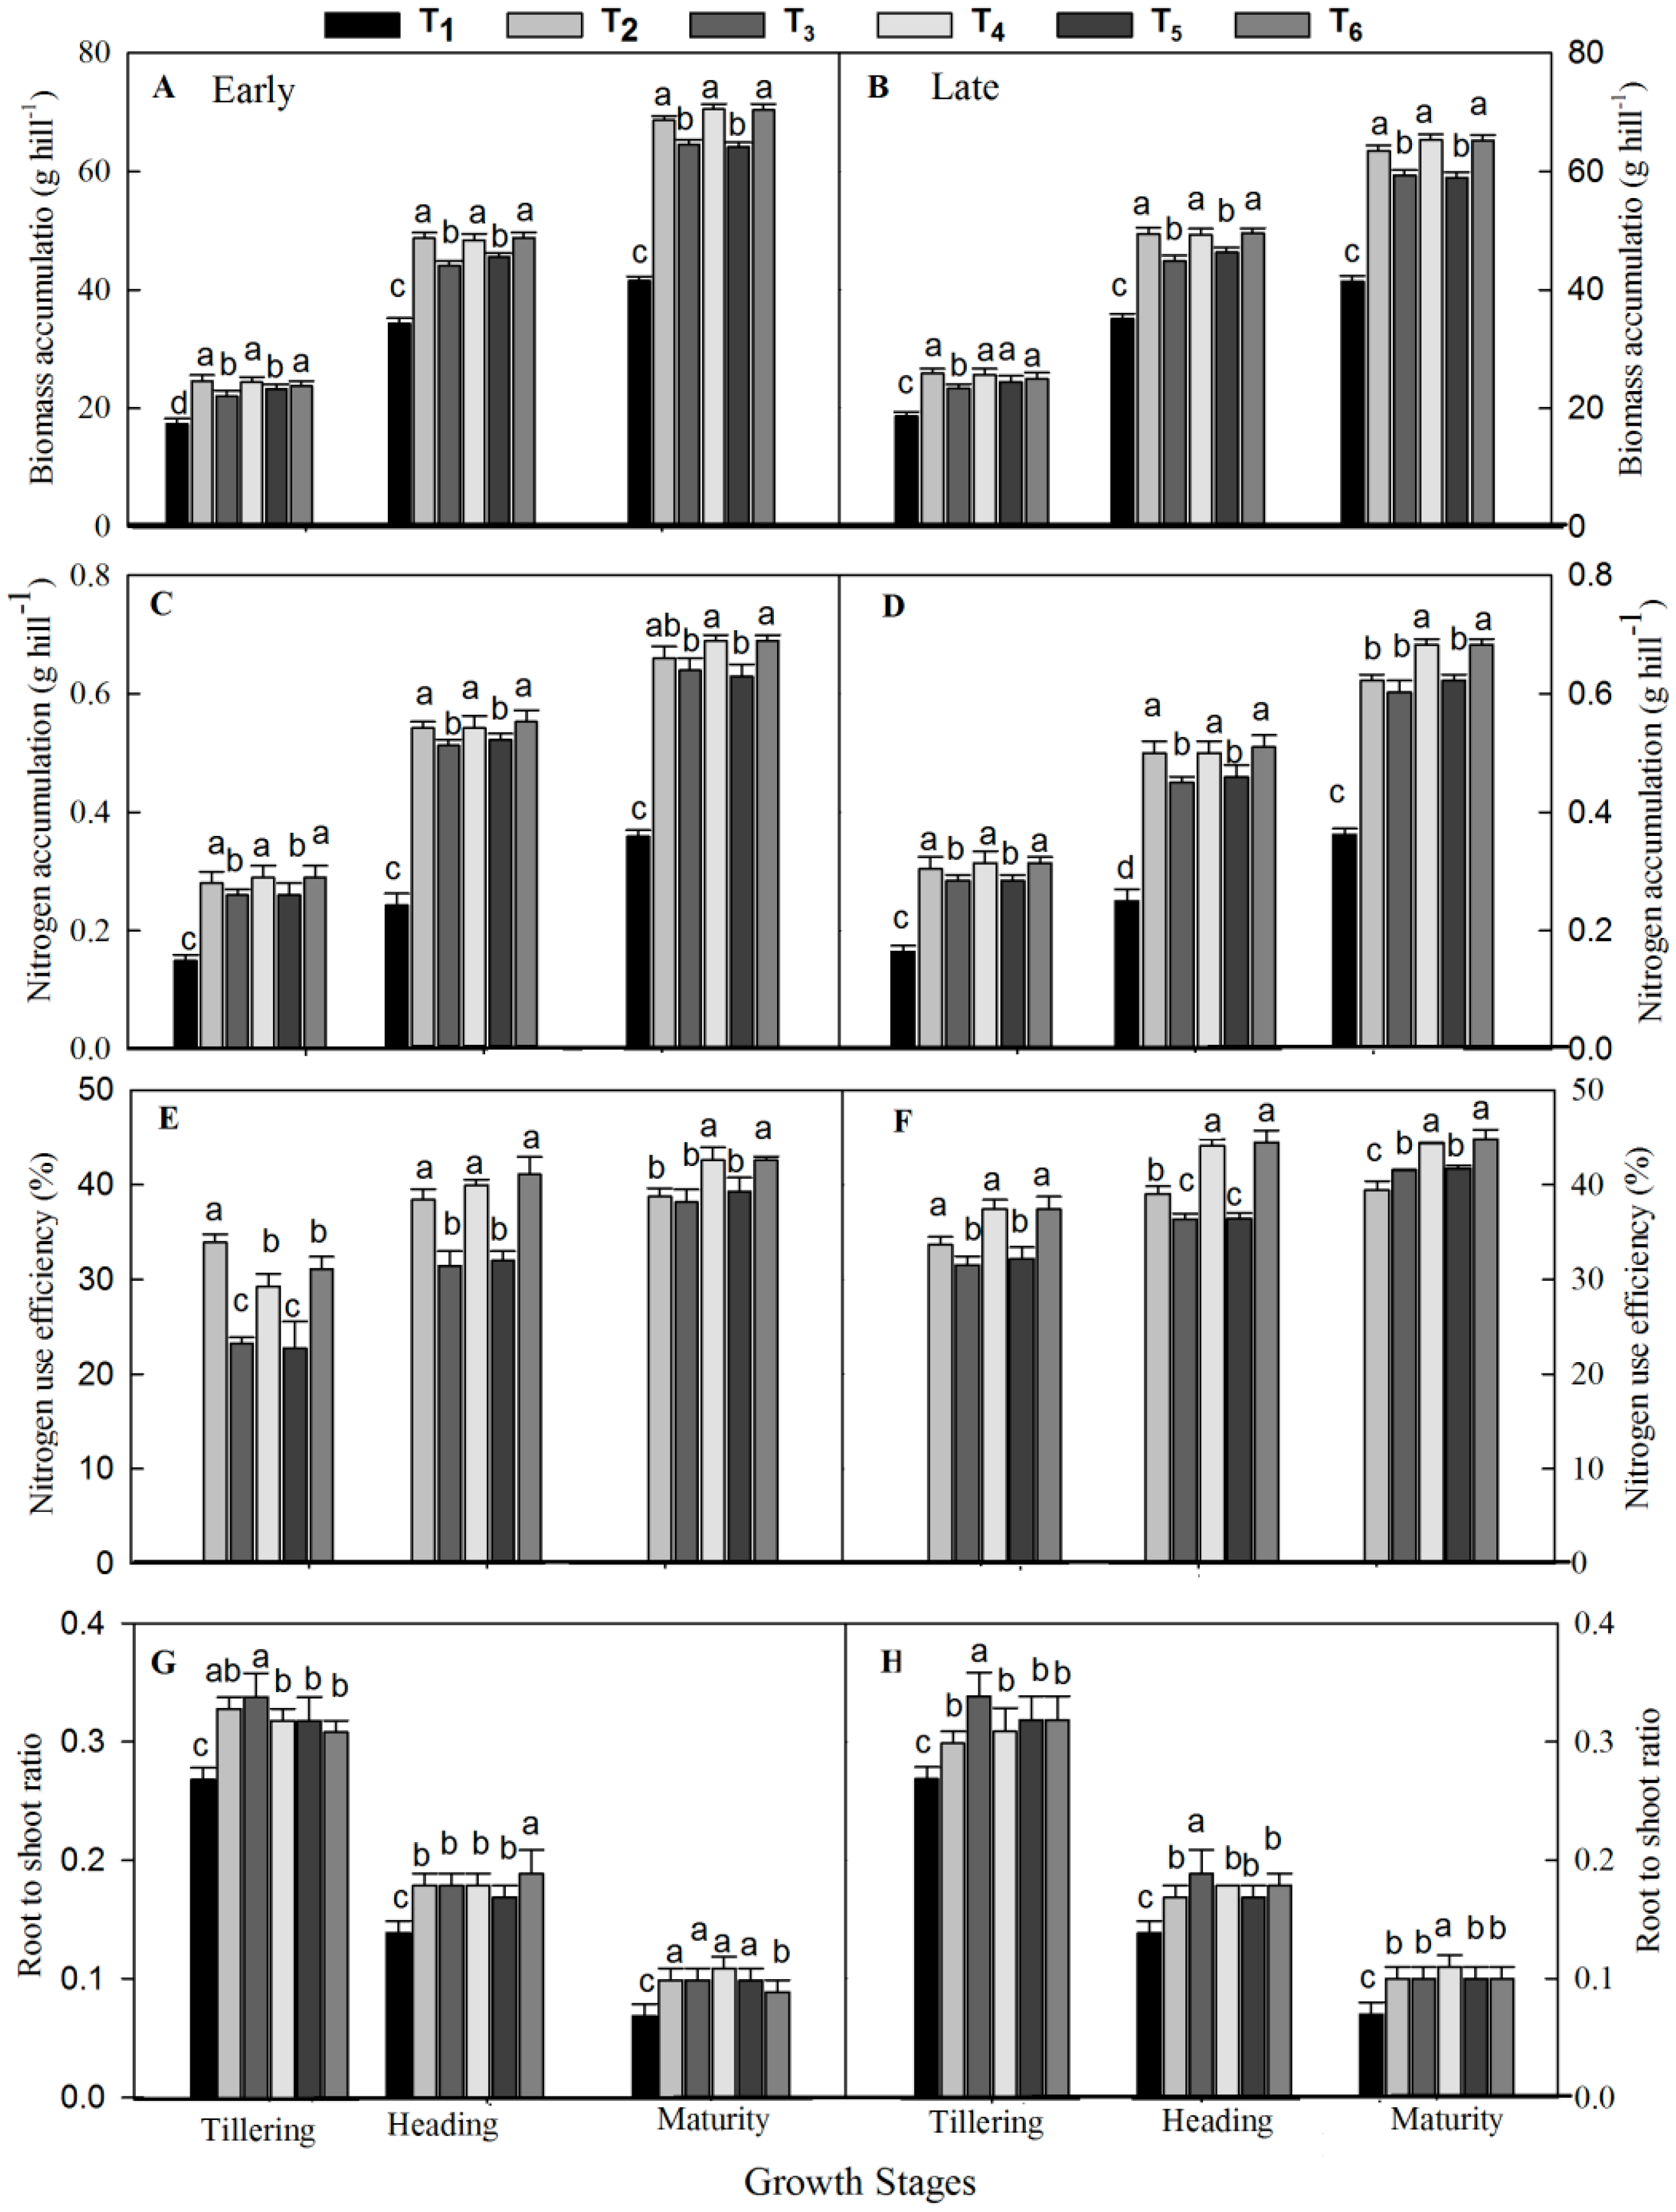
In the current study, sole mineral fertilizer treatments considerably improved biomass and N uptake at the tillering stage, whereas at the heading and maturity stages organic manure coupled with inorganic treatments significantly enhanced biomass accumulation and N uptake across the seasons, compared with control (Figure 2A–D). This may be because manure decomposition at early growth did not provide sufficient nutrients for plant growth as compared to inorganic fertilizer. Moreover, chemical fertilizers release nutrients rapidly, which makes them easily available to plants at early growth, while the slow and steady release of nutrients from organic manure provides sufficient nutrients throughout growth, particularly at the grain filling stage [67]. In this study, taller plants, larger stem girth of plants, and broad leaf areas were produced under combined fertilization compared to sole urea application (Table 7), which ultimately positively correlated with biomass. Similar to our study, Mehasen et al. [68] stated that the co-applied use of manure and chemical fertilizer sustained soil fertility and improved nutrient uptake and plant growth. We observed in this study that organic manure and inorganic amendments significantly increased NUE in all pots, particularly where we applied 30% CM or PM and 70% CF compared to sole urea fertilization. This could be attributed to higher N uptake in manure embedded treatments in the present study (Figure 2E–F). Moreover, organic manure application enhanced the nutrient preserving capability of the soil and reduced N leaching [69]. N recovery was higher in the late season than early under combined CM or PM with urea in the present study. This may be due to organic manure fertilization having a residual effect on later crops [70].
As an essential part of the plant organs, rice roots are involved in gaining water and nutrients, synthesizing organic acids, amino acids, and plant hormones [70]. Root morphological and physiological features are closely associated with soil nitrogen acquisition and the development of plants [71,72,73]. In the current study, compared with control, sole urea application significantly enhanced root growth at the tillering stage, while at heading and maturity; combined amendments notably increased the total root length, surface area, average diameter, and total root volume (Table 6). This could be ascribed to the faster and easier intake of nutrients from mineral fertilizer compared with organic manure at the early growth stage [74]. In contrast, at heading and maturity, the combined treatment enhanced the root morphological traits significantly compared to sole urea application. A possible explanation for this that is the inspiring effect of both mineral and organic manure fertilizers on root morphology is probably linked to soil physicochemical properties (sufficient nutrient availability, maintained soil moisture content) (Table 4 and Table 5), that delay root senescence due to the slow and regular release of nutrients from manure across growth, thus ultimately improving root growth and activity in the present study. Similarly, a previous study reported that manure fertilization can enhance soil physicochemical properties and the conservation of nutrients and promote plant growth by improving root morphological traits [70].
The application of organic manure with synthetic fertilizer significantly increased growth, yield, and yield components of rice in the present experiment, as shown in Table 7. Compared with control, taller plants, wider leaf areas, more productive tillers, longer panicles, and maximum filled grain percentage and grain yield were noted in coupled organic and mineral fertilizer treatment (Table 7). This might be due to the improved soil fertility under combined treatment in this study (Table 4 and Table 5), which ultimately improved root growth, nutrient uptake, and leaf photosynthetic capacity by providing sufficient macroand micronutrients from manure and chemical fertilizer throughout the growth period. Our results are also in line with those of Mangalassery et al. [75], who pointed out that the use of manure integrated with chemical fertilizer increased the growth and yield of rice significantly compared to the sole use of chemical fertilizer. The roots are the main source of nutrients supplied to shoots. Hence, roots and shoots are reciprocal to each other [76]. In the present study, total root length was positively correlated with grain yield (0.94 **) and biomass (0.98 **) under combined fertilization, as shown in Table 8. This could be because together, manure and mineral fertilizer improved soil fertility (nutrient availability) throughout the growing season, especially at the later period, which ultimately enhanced root growth and allowed more nutrient uptake for higher photosynthesis activity, resulting in maximum crop growth and biomass production [77,78].
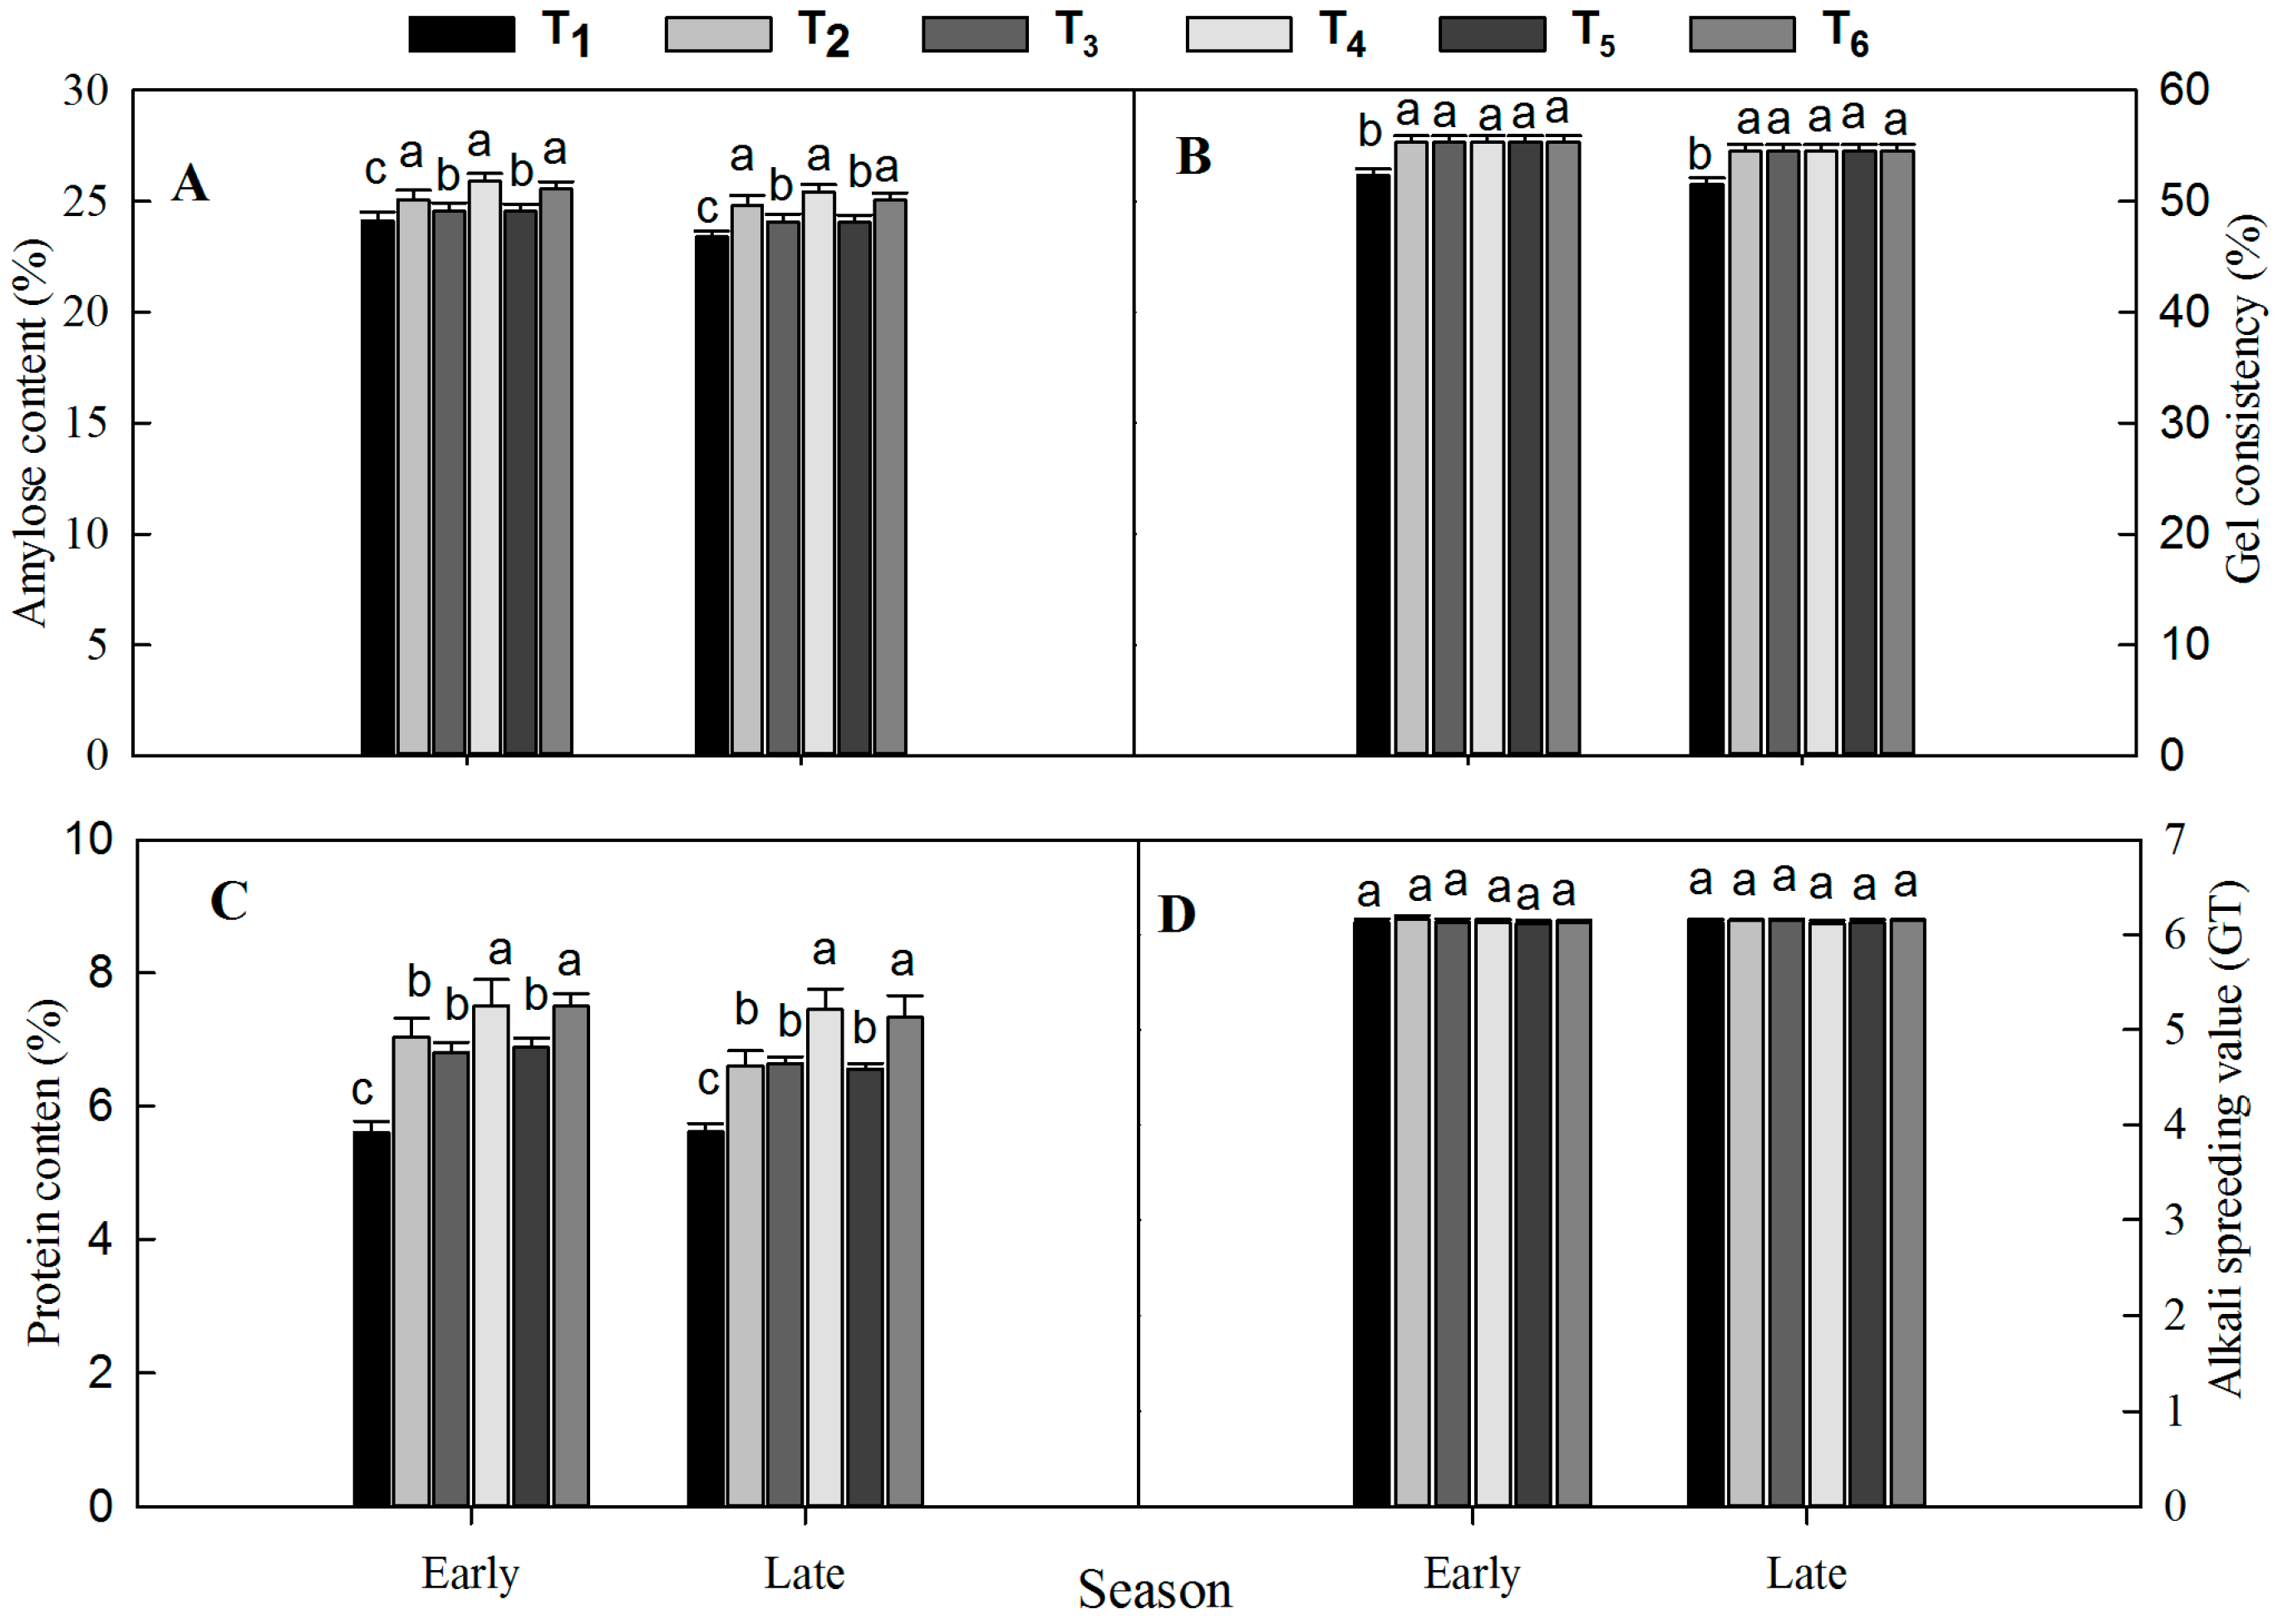
The current study was on rice, especially focused on the amylose content (AC). AC influences the eating and cooking quality of rice noodles; high AC means good eating quality [73]. In this study, combined organic and inorganic treatment produced higher AC compared with sole urea application, as shown in Figure 3A. In addition, protein content (PC) in the grain affects the amount of water absorbed during cooking, which determines the texture of the rice [79]. The differences in the nutritive quality of rice were shown in Figure 3A–D. The observed increment in AC and PC under combined amendments suggests that both fertilizers provide sufficient amounts of macro and micronutrients, particularly N, which is very important for growth and development throughout the season. Moreover, the activity of the starch branching enzyme affects the amylose and protein content of rice during grain filling [80] and glutamine is the key enzyme for protein synthesis, which finally affects the grain nitrogen content [81,82]. Another possible reason that higher AC and PC under combined treatment improved the activity of glutamine synthesis during the grain filling stage may be the sufficient availability of N at later stages. A similar observation was reported by Kumar et al. [28], who noted that manure coupled with synthetic fertilizer enhanced grain quality and amylose content by 7% as compared with sole synthetic fertilization. Gel consistency (GC) and alkali spreading value (ASV) are quality parameters responsible for the texture of rice cooking quality [83]. Moreover, ASV is an indirect indicator of gelatinization affecting temperature, which affects the cooking quality [84]. Our results demonstrate that the application of manure maintains nutrient availability, especially at grain filling, which ultimately improves the GC and ASV of rice.

5. Conclusions

In this study, organic manure coupled with inorganic fertilizer significantly influenced soil physiochemical properties, growth, physiology, grain yield, and quality attributes of rice. Cattle and poultry manure in combination with chemical fertilizer at a 30:70% ratio significantly enhanced rice growth and leaf gas exchange attributes by improving root morphological traits (root length, surface area, diameter, and volume) and NUE. Improvements in these parameters further increased the grain yield and nutritive quality (amylose content, gel consistency, and protein content) of rice. The increased NUE was the result of improved soil physical (bulk density, porosity, moisture content) and chemical (soil pH, soil organic carbon, total N, available phosphorous and potassium) properties under combined organic and inorganic fertilizers application. In addition, grain yield, N uptake, and biomass production were positively correlated with total root length, root average diameter, root surface area, and root volume during the heading and maturity stages. Conclusively, combining the application of cattle or poultry manure with synthetic fertilizer at a 30:70% ratio is a good model for higher rice grain yield by improving root growth and soil properties.

Author Contributions

A.I. and L.J. conceived the main idea of research. A.I. wrote the manuscript. L.H., A.K., K.A. revised the manuscript and provided suggestions. In addition, F.M. and S.W. analyzed the data. I.A., S.U., and Q.Z. assessed and data collection.

Acknowledgments

This research was financially supported by the National Key Research and Development Project of China (2016YFD030050902). We wish to thanks ours cooperates from the Guangxi University, Agriculture Station for the help of conducting and managing this experiment.

Conflicts of Interest

The authors declare no conflict of interest.

Abbreviations

NUE—Nitrogen use efficiency; CF—Inorganic fertilizer; POR—Porosity; BD—Bulk density; SO—Soil organic carbon; SOM—Soil organic matter; N—Nitrogen; TN—Total nitrogen; AP—Available phosphorous; AK—Available potassium; h—Hour; DAT—Day after transplanting; Pn—Net photosynthetic rate; Tr—Transpiration rate; gs—Stomatal conductance; Ci—Intercellular CO2 content; AC—Amylose content; PC—Protein content; GT—Gelatinization temperature; GC—Gel consistency.

References

  1. Valin, H.; Sands, R.D.; Van, M.D.; Nelson, G.C.; Ahammad, H.; Blanc, E.; Bodirsky, B.; Fujimori, S.; Hasegawa, T.; Havlik, P.; et al. The future of food demand: Understanding differences in global economic models. Agric. Econ. 2014, 45, 51–67. [Google Scholar] [CrossRef]
  2. Bitew, Y.; Alemayehu, M. Impact of Crop Production Inputs on Soil Health: A Review. Asian J. Plant Sci. 2017, 16, 109–131. [Google Scholar] [CrossRef] [Green Version]
  3. Li, Y.; Shao, X.; Guan, W.; Ren, L.; Liu, J.; Wang, J.; Wu, Q. Nitrogen-Decreasing and Yield-Increasing Effects of Combined Applications of Organic and Inorganic Fertilizers under Controlled Irrigation in a Paddy Field. Pol. J. Environ. Stud. 2016, 25, 673–680. [Google Scholar] [CrossRef]
  4. Yadav, M.; Kumar, R.; Parihar, C.; Yadav, R.; Jat, S.; Ram, H.; Meena, R.; Singh, M.; Verma, A.; Kumar, U.; et al. Strategies for improving nitrogen use efficiency: A review. Agric. Rev. 2017, 38, 29–40. [Google Scholar] [CrossRef] [Green Version]
  5. Diacono, M.; Montemurro, F. Long-Term Effects of Organic Amendments on Soil Fertility. Sustain. Agric. 2011, 2, 761–786. [Google Scholar]
  6. Akhtar, K.; Wang, W.; Ren, G.; Khan, A.; Feng, Y.; Yang, G. Changes in soil enzymes, soil properties, and maize crop productivity under wheat straw mulching in Guanzhong, China. Soil Tillage Res. 2018, 182, 94–102. [Google Scholar] [CrossRef]
  7. Horrigan, L.; Lawrence, R.S.; Walker, P. How sustainable agriculture can address the environmental and human health harms of industrial agriculture. Environ. Health Perspect. 2002, 110, 445–456. [Google Scholar] [CrossRef]
  8. Pathak, R.; Lochab, S.; Raghuram, N. Plant systems improving plant nitrogen-use efficiency. In Comprehensive Biotechnology, 2nd ed.; Moo-Young, M., Ed.; Elsevier: Amsterdam, The Netherlands, 2011; pp. 209–218. [Google Scholar]
  9. Cai, A.; Zhang, W.; Xu, M.; Wang, B.; Wen, S.; Shah, S.A.A. Soil fertility and crop yield after manure addition to acidic soils in South China. Nutr. Cycl. Agroecosyst. 2018, 111, 1–12. [Google Scholar] [CrossRef]
  10. Lal, R. Restoring Soil Quality to Mitigate Soil Degradation. Sustainability 2015, 7, 5875–5895. [Google Scholar] [CrossRef] [Green Version]
  11. Chen, R.; Senbayram, M.; Blagodatsky, S.; Myachina, O.; Dittert, K.; Lin, X.; Blagodatskaya, E.; Kuzyakov, Y. Soil C and N availability determine the priming effect: Microbial N mining and stoichiometric decomposition theories. Glob. Chang. Boil. 2014, 20, 2356–2367. [Google Scholar] [CrossRef]
  12. Nin, Y.; Diao, P.; Wang, Q.; Zhang, Q.; Zhao, Z.; Li, Z. On-Farm-Produced Organic Amendments on Maintaining and Enhancing Soil Fertility and Nitrogen Availability in Organic or Low Input Agriculture. Org. Fertil. 2016. [Google Scholar] [CrossRef]
  13. Singh, B. Are Nitrogen Fertilizers Deleterious to Soil Health? Agronomy 2018, 8, 48. [Google Scholar] [CrossRef]
  14. Mueller, N.D.; Gerber, J.S.; Johnston, M.; Ray, D.K.; Ramankutty, N.; Foley, J.A. Closing yield gaps through nutrient and water management. Nature 2012, 490, 254–257. [Google Scholar] [CrossRef]
  15. Morone, P.; Falcone, P.M.; Lopolito, A. How to promote a new and sustainable food consumption model: A fuzzy cognitive map study. J. Clean. Prod. 2019, 208, 563–574. [Google Scholar] [CrossRef]
  16. Chen, Y.; Peng, J.; Wang, J.; Fu, P.; Hou, Y.; Zhang, C.; Fahad, S.; Peng, S.; Cui, K.; Nie, L.; et al. Crop management based on multi-split topdressing enhances grain yield and nitrogen use efficiency in irrigated rice in China. Field Crops Res. 2015, 184, 50–57. [Google Scholar] [CrossRef]
  17. Yao, Y.; Zhang, M.; Tian, Y.; Zhao, M.; Zhang, B.; Zeng, K.; Zhao, M.; Yin, B. Urea deep placement in combination with Azolla for reducing nitrogen loss and improving fertilizer nitrogen recovery in rice field. Field Crops Res. 2018, 218, 141–149. [Google Scholar] [CrossRef]
  18. Yang, Y.; Zhang, M.; Li, Y.; Fan, X.; Geng, Y. Controlled Release Urea Improved Nitrogen Use Efficiency, Activities of Leaf Enzymes, and Rice Yield. Soil Sci. Soc. Am. J. 2012, 76, 2307–2317. [Google Scholar] [CrossRef]
  19. Anadon, L.D.; Chan, G.; Harley, A.G.; Matus, K.; Moon, S.; Murthy, S.L.; Clark, W.C. Making technological innovation work for sustainable development. Proc. Natl. Acad. Sci. USA 2016, 113, 9682–9690. [Google Scholar] [CrossRef] [Green Version]
  20. Nkoa, R. Agricultural benefits and environmental risks of soil fertilization with anaerobic digestates: A review. Agron. Sustain. Dev. 2014, 34, 473–492. [Google Scholar] [CrossRef]
  21. Ullah, M.S.; Islam, M.S.; Islam, M.A.; Haque, T. Effects of organic manures and chemical fertilizers on the yield of brinjal and soil properties. J. Bangladesh Agric. Univ. 2008, 6, 271–276. [Google Scholar] [CrossRef]
  22. Adekiya, A.; Agbede, T.; Aboyeji, C.; Dunsin, O.; Simeon, V. Effects of biochar and poultry manure on soil characteristics and the yield of radish. Sci. Hortic. 2019, 243, 457–463. [Google Scholar] [CrossRef]
  23. Araújo, A.; Santos, V.; Monteiro, R. Responses of soil microbial biomass and activity for practices of organic and conventional farming systems in Piauí state, Brazil. Eur. J. Soil Boil. 2008, 44, 225–230. [Google Scholar] [CrossRef]
  24. Ahmad, R.; Arshad, M.; Khalid, A.; Zahir, Z.A. Effectiveness of Organic-/Bio-Fertilizer Supplemented with Chemical Fertilizers for Improving Soil Water Retention, Aggregate Stability, Growth and Nutrient Uptake of Maize (Zea mays L.). J. Sustain. Agric. 2008, 31, 57–77. [Google Scholar] [CrossRef]
  25. Guo, J.; Hu, X.; Gao, L.; Xie, K.; Ling, N.; Shen, Q.; Hu, S.; Guo, S. The rice production practices of high yield and high nitrogen use efficiency in Jiangsu, China. Sci. Rep. 2017, 7, 2101. [Google Scholar] [CrossRef]
  26. Biratu, G.K.; Elias, E.; Ntawuruhunga, P. Soil fertility status of cassava fields treated by integrated application of manure and NPK fertilizer in Zambia. Environ. Syst. Res. 2019, 8, 3. [Google Scholar] [CrossRef] [Green Version]
  27. Xu, J.; Tang, C.; Chen, Z. The role of plant residues in pH change of acid soils differing in initial pH. Soil Boil. Biochem. 2006, 38, 709–719. [Google Scholar] [CrossRef]
  28. Kumar, U.; Shahid, D.M.; Tripathi, R.; Mohanty, S.; Kumar, A.; Bhattacharyya, P.; Lal, B.; Gautam, P.; Raja, R.; Panda, B.B.; et al. Variation of functional diversity of soil microbial community in sub-humid tropical rice-rice cropping system under long-term organic and inorganic fertilization. Ecol. Indic. 2017, 73, 536–543. [Google Scholar] [CrossRef]
  29. Bandyopadhyay, K.; Misra, A.; Ghosh, P.; Hati, K. Effect of integrated use of farmyard manure and chemical fertilizers on soil physical properties and productivity of soybean. Soil Tillage Res. 2010, 110, 115–125. [Google Scholar] [CrossRef]
  30. Carrijo, D.R.; Lundy, M.E.; Linquist, B.A. Rice yields and water use under alternate wetting and drying irrigation: A meta-analysis. Field Crops Res. 2017, 203, 173–180. [Google Scholar] [CrossRef]
  31. Chauhan, B.S.; Jabran, K.; Mahajan, G. Rice Production Worldwide; Springer: Berlin/Heidelberg, Germany, 2017. [Google Scholar]
  32. Peng, S.; Tang, Q.; Zou, Y. Current Status and Challenges of Rice Production in China. Plant Prod. Sci. 2009, 12, 3–8. [Google Scholar] [CrossRef] [Green Version]
  33. FAO. FAOSTAT; Food and Agriculture Organization of the United Nations: Rome, Italy, 2014; Available online: http://faostat.fao.org/default.aspx (accessed on 10 June 2019).
  34. Arif, M.; Tasneem, M.; Bashir, F.; Yassen, G.; Iqbal, R.M. Effect of integrated use of organic manures and inorganic fertilizers on yield and yield components of rice. J. Agric. Res. 2014, 52, 197–206. [Google Scholar]
  35. Zhang, M.; Yao, Y.; Tian, Y.; Ceng, K.; Zhao, M.; Zhao, M.; Yin, B. Increasing yield and N use efficiency with organic fertilizer in Chinese intensive rice cropping systems. Field Crops Res. 2018, 227, 102–109. [Google Scholar] [CrossRef]
  36. Li, R.; Li, M.; Ashraf, U.; Liu, S.; Zhang, J. Yield Analysis of Early Indica Rice Zhenguiai 1 in South China. China Rice 2006, 1, 17. [Google Scholar]
  37. Grossman, R.; Reinsch, T. Bulk density and linear extensibility. Methods Soil Anal. Part 4 Phys. Methods 2002, 2, 201–228. [Google Scholar]
  38. Hillel, D. Introduction to Environmental Soil Physics; Elsevier Academic Press: Amsterdam, The Netherlands, 2004. [Google Scholar]
  39. Ledieu, J.; De Ridder, P.; De Clerck, P.; Dautrebande, S. A method of measuring soil moisture by time-domain reflectometry. J. Hydrol. 1986, 88, 319–328. [Google Scholar] [CrossRef]
  40. Cambardella, C.E.; Gajda, A.M.; Doran, J.W.; Wienhold, B.J.; Kettler, T.A. Estimation of particulate and total organic matter by weight-loss-on ignition. In Assessment Methods for Soil Carbon; Lal, R., Kimble, J.F., Follet, R.F., Stewart, B.A., Eds.; CRC Press: Boca Raton, FL, USA, 2001; pp. 349–359. [Google Scholar]
  41. Rich, C.I.; Black, W.R. Pottasium exchange as affected by cation size, pH, and mineral structure. Soil Sci. 1964, 97, 384–390. [Google Scholar] [CrossRef]
  42. Ohyama, T.; Ito, M.; Kobayashi, K.; Araki, S.; Yasuyoshi, S.; Sasaki, O.; Yamazaki, T.; Soyama, K.; Tanemura, R.; Mizuno, Y.; et al. Analytical procedures of N, P, K contents in plant and manure materials using H2SO4-H2O2 Kjeldahl digestion method. Bull. Fac. Agric. Niigata Univ. 1991, 43, 110–120, (In Japanese with English summary). [Google Scholar]
  43. Jackson, M.L. Soil Chemical Analysis—Advanced Course; University of Wisconsin: Madison, WI, USA, 1956; p. 991. [Google Scholar]
  44. Murphy, J.; Riley, J. A modified single solution method for the determination of phosphate in natural waters. Anal. Chim. Acta 1962, 27, 31–36. [Google Scholar] [CrossRef]
  45. Curtin, D.; Wright, C.E.; Beare, M.; McCallum, F.M. Hot Water-Extractable Nitrogen as an Indicator of Soil Nitrogen Availability. Soil Sci. Soc. Am. J. 2006, 70, 1512. [Google Scholar] [CrossRef]
  46. Olsen, S.R. Estimation of available phosphorus in soils by extraction with sodium bicarbonate. US Dep. Agric. Circ. 1954, 939, 1–19. [Google Scholar]
  47. Leaf, A.L. Determination of Available Potassium in Soils of Forest Plantations. Soil Sci. Soc. Am. J. 1958, 22, 458. [Google Scholar] [CrossRef]
  48. Juliano, B.O.; Perez, C.M.; Blakeney, A.B.; Castillo, T.; Ongseree, N.K.; Laignelet, B.; Lapis, E.T.; Murty, V.V.S.; Paule, C.M.; Webb, B.D. International cooperative testing on the amylose content of milled rice. Starch-Stärke 1981, 33, 157–162. [Google Scholar] [CrossRef]
  49. Cagampang, G.B.; Perez, C.M.; Juliano, B.O. A gel consistency test for eating quality of rice. J. Sci. Food Agric. 1973, 24, 1589–1594. [Google Scholar] [CrossRef] [PubMed]
  50. Bhattacharya, K.; Sowbhagya, C. An improved alkali reaction test for rice quality. Int. J. Food Sci. Technol. 1972, 7, 323–331. [Google Scholar] [CrossRef]
  51. Khan, A.; Tan, D.K.Y.; Munsif, F.; Afridi, M.Z.; Shah, F.; Wei, F.; Fahad, S.; Zhou, R. Nitrogen nutrition in cotton and control strategies for greenhouse gas emissions: A review. Environ. Sci. Pollut. Res. 2017, 24, 23471–23487. [Google Scholar] [CrossRef] [PubMed]
  52. Kwiatkowska-Malina, J. Qualitative and quantitative soil organic matter estimation for sustainable soil management. J. Soils Sediments 2018, 18, 2801–2812. [Google Scholar] [CrossRef]
  53. Walsh, E.; McDonnell, K.P. The influence of added organic matter on soil physical, chemical, and biological properties: A small-scale and short-time experiment using straw. Arch. Agron. Soil Sci. 2012, 58, S201–S205. [Google Scholar] [CrossRef]
  54. Mahmood, F.; Khan, I.; Ashraf, U.; Shahzad, T.; Hussain, S.; Shahid, M.; Abid, M.; Ullah, S. Effects of organic and inorganic manures on maize and their residual impact on soil physico-chemical properties. J. Soil Sci. Plant Nutr. 2017, 17, 22–32. [Google Scholar] [CrossRef] [Green Version]
  55. Whalen, J.K.; Chang, C.; Clayton, G.W.; Carefoot, J.P. Cattle Manure Amendments Can Increase the pH of Acid Soils. Soil Sci. Soc. Am. J. 2000, 64, 962. [Google Scholar] [CrossRef]
  56. Duruigbo, C.; Obiefuna, J.; Onweremadu, E. Effect of poultry manure rates on the soil acidity in an Ultisol. Int. J. Soil Sci. 2007, 2, 154–158. [Google Scholar]
  57. Purakayastha, T.J.; Huggins, D.R.; Smith, J.L. Carbon Sequestration in Native Prairie, Perennial Grass, No-Till, and Cultivated Palouse Silt Loam. Soil Sci. Soc. Am. J. 2008, 72, 534. [Google Scholar] [CrossRef]
  58. Murmu, K.; Swain, D.K.; Ghosh, B.C. Comparative assessment of conventional and organic nutrient management on crop growth and yield and soil fertility in tomato-sweet corn production system. Aust. J. Crop Sci. 2013, 7, 16–17. [Google Scholar]
  59. Makoto, K.; Koike, T. Effects of nitrogen supply on photosynthetic and anatomical changes in current-year needles of Pinus koraiensis seedlings grown under two irradiances. Photosynthetica 2007, 45, 99–104. [Google Scholar] [CrossRef]
  60. Xie, R.J.; Fyles, J.W.; Mckenzie, A.F.; Hollaran, I.P. Ligno-sulphate retention in a clay soil: Casual modeling. Soil Sci. Soc. Am. J. 1991, 55, 711–716. [Google Scholar] [CrossRef]
  61. Tandon, H.L.S.; Sekhon, G.S. Potassium Research and Agricultural Production in India; Fertilizer Development and Consultation Organization: New Delhi, India, 1988. [Google Scholar]
  62. Timsina, J.; Panaullah, G.M.; Saleque, M.A.; Ishaque, M.; Pathan, A.B.M.B.U.; Quayyum, M.A.; Connor, D.J.; Saha, P.K.; Humphreys, E.; Meisner, C.A. Nutrient Uptake and Apparent Balances for Rice-Wheat Sequences. I. Nitrogen. J. Plant Nutr. 2006, 29, 137–155. [Google Scholar] [CrossRef]
  63. Timsina, J.; Singh, V.K.; Majumdar, K. Potassium management in rice-maize systems in South Asia. J. Plant Nutr. Soil Sci. 2013, 176, 317–330. [Google Scholar] [CrossRef]
  64. Khan, A.; Najeeb, U.; Wang, L.; Tan, D.K.Y.; Yang, G.; Munsif, F.; Ali, S.; Hafeez, A. Planting density and sowing date strongly influence growth and lint yield of cotton crops. Field Crops Res. 2017, 209, 129–135. [Google Scholar] [CrossRef]
  65. Yang, B.; Xiong, Z.; Wang, J.; Xu, X.; Huang, Q.; Shen, Q. Mitigating net global warming potential and greenhouse gas intensities by substituting chemical nitrogen fertilizers with organic fertilization strategies in rice–wheat annual rotation systems in China: A 3-year field experiment. Ecol. Eng. 2015, 81, 289–297. [Google Scholar] [CrossRef]
  66. Daszkowska-Golec, A.; Szarejko, I. Open or Close the Gate—Stomata Action under the Control of Phytohormones in Drought Stress Conditions. Front. Plant Sci. 2013, 4, 138. [Google Scholar] [CrossRef]
  67. Roba, T.B. Review on: The Effect of Mixing Organic and Inorganic Fertilizer on Productivity and Soil Fertility. OALib 2018, 5, 1–11. [Google Scholar] [CrossRef]
  68. Mehasen, S.; Gebaly, S.G.; Seoudi, O. Effectiveness of organic and inorganic fertilization in presence of some growth regulators on productivity and quality of egyptian cotton. Asian J. Biol. Sci. 2012, 5, 171–182. [Google Scholar] [CrossRef]
  69. Ren, T.; Wang, J.; Chen, Q.; Zhang, F.; Lu, S. The Effects of Manure and Nitrogen Fertilizer Applications on Soil Organic Carbon and Nitrogen in a High-Input Cropping System. PLoS ONE 2014, 9, e0097732. [Google Scholar] [CrossRef] [PubMed]
  70. Lanna, N.B.; Silva, P.N.L.; Colombari, L.F.; Corrêa, C.V.; Cardoso, A.I.I. Residual effect of organic fertilization on radish production. Hortic. Bras. 2018, 36, 47–53. [Google Scholar] [CrossRef]
  71. Wu, W.; Cheng, S. Root genetic research, an opportunity and challenge to rice improvement. Field Crops Res. 2014, 165, 111–124. [Google Scholar] [CrossRef] [Green Version]
  72. Lynch, J.P. Steep, cheap and deep: An ideotype to optimize water and N acquisition by maize root systems. Ann. Bot. 2013, 112, 347–357. [Google Scholar] [CrossRef]
  73. Garnett, T.; Conn, V.; Kaiser, B.N. Root based approaches to improving nitrogen use efficiency in plants. Plant Cell Environ. 2009, 32, 1272–1283. [Google Scholar] [CrossRef]
  74. Lazcano, C.; Gomez-Brandon, M.; Revilla, P.; Dominguez, J. Short-term effects of organic and inorganic fertilizers on soil microbial community structure and function. Biol. Fertil. Soils 2013, 49, 723–733. [Google Scholar] [CrossRef]
  75. Mangalassery, S.; Kalaivanan, D.; Philip, P.S. Effect of inorganic fertilisers and organic amendments on soil aggregation and biochemical characteristics in a weathered tropical soil. Soil Tillage Res. 2019, 187, 144–151. [Google Scholar] [CrossRef]
  76. Hoch, G. Reciprocal root-shoot cooling and soil fertilization effects on the seasonal growth of two treeline conifer species. Plant Ecol. Divers. 2013, 6, 21–30. [Google Scholar] [CrossRef]
  77. Barison, J.; Uphoff, N. Rice yield and its relation to root growth and nutrient-use efficiency under SRI and conventional cultivation: An evaluation in Madagascar. Paddy Water Environ. 2011, 9, 65–78. [Google Scholar] [CrossRef]
  78. Yousaf, M.; Li, J.; Lu, J.; Ren, T.; Cong, R.; Fahad, S.; Li, X. Effects of fertilization on crop production and nutrient-supplying capacity under rice-oilseed rape rotation system. Sci. Rep. 2017, 7, 1270. [Google Scholar] [CrossRef] [PubMed]
  79. Adu-Kwarteng, E.; Ellis, W.; Oduro, I.; Manful, J. Rice grain quality: A comparison of local varieties with new varieties under study in Ghana. Food Control 2003, 14, 507–514. [Google Scholar] [CrossRef]
  80. Martin, M.; Fitzgerald, M. Proteins in Rice Grains Influence Cooking Properties! J. Cereal Sci. 2002, 36, 285–294. [Google Scholar] [CrossRef]
  81. Li, X.-G.; Liu, H.-Y.; Jin, Z.-X.; Liu, H.-L.; Huang, X.; Xu, M.-L.; Zhang, F.-Z. Changes in Activities of Key Enzymes for Starch Synthesis and Glutamine Synthetase in Grains of Progenies from a Rice Cross During Grain Filling. Rice Sci. 2010, 17, 243–246. [Google Scholar] [CrossRef]
  82. Forde, B.G.; Lea, P.J. Glutamate in plants: Metabolism, regulation, and signalling. J. Exp. Bot. 2007, 58, 2339–2358. [Google Scholar] [CrossRef]
  83. Verma, D.K.; Mohan, M.; Prabhakar, P.K.; Srivastav, P.P. Physico-chemical and cooking characteristics of Azad basmati. Int. Food Res. J. 2015, 22, 1380–1389. [Google Scholar]
  84. Kang, H.J.; Hwang, I.K.; Kim, K.S.; Choi, H.C. Comparison of the physicochemical properties and ultra structure of japonica and indica rice grains. J. Agric. Food Chem. 2006, 54, 4833–4838. [Google Scholar] [CrossRef]
Figure 1. Net photosynthesis rates during season early (A) and late (B), transpiration rate at early (C) and late (D) seasons, stomatal conductance at early (E) and late (F) seasons, and intercellular CO2 concentration at early (G) and late (H) seasons of rice at the tillering, heading, and milking stages under organic manure and inorganic fertilizer application. Vertical bars represent the standard error of mean. Different litters above the column indicate statistical significance at the p < 0.05. Note: Pn—net photosynthesis rate, Tr—transpiration rate, gs—stomatal conductance, and Ci—intercellular CO2 content. T1: no N fertilizer, T2: 100% CF, T3: 60% CM + 40% CF, T4: 30% CM + 70% CF, T5: 60% PM + 40% CF, T6: 30% PM + 70% CF.
Agronomy 09 00651 g001
Figure 2. Changes in biomass accumulation during at early (A) and late season (B), N accumulation during early (C) and late season (D), nitrogen use efficiency during early (E) and late season (F), and root-to-shoot ratio during early (G) and late season (H) of rice at the tillering, heading, and maturity stages under organic manure and inorganic fertilizer application. Vertical bars represent the standard error of mean. Different litters above the column indicate statistical significance at p < 0.05. Note—T1: no N fertilizer, T2: 100% CF, T3: 60% CM + 40% CF, T4: 30% CM + 70% CF, T5: 60% PM + 40% CF, T6: 30% PM + 70% CF.
Agronomy 09 00651 g002
Figure 3. Changes in amylose content (A), gel consistency (B), protein content (C) and alkali spreading value (GT) (D) of rice during both seasons under organic and inorganic fertilizer application. Vertical bars represent the standard error of mean. Different letters above the column indicate statistical significance at the p < 0.05. Note—T1: no N fertilizer, T2: 100%CF, T3: 60% CM + 40% CF, T4: 30% CM + 70% CF, T5: 60% PM + 40% CF, T6: 30% PM + 70% CF.
Agronomy 09 00651 g003
Table 1. Mean maximum and minimum temperature, relative humidity, and total rainfall during both growing seasons.
Months MaximumMinimum Relative Total
Temperature (°C)Temperature (°C)Humidity (%)Rainfall (mm)
March21218074.4
April23237774.5
May282885186.2
June292880223.3
July362681337.8
August342582151.8
September31238799.5
October30218367.4
November24169016.7
December17118513.5
Table 2. Physical and chemical properties of soil and manure before the experiment.
Properties SoilCattle Poultry
Manure Manure
Porosity (%)40.12--
Moisture content (%)11.23--
Bulk density (g cm−3)1.380.810.74
pH (water)5.957.757.95
SOC (g kg−1)9.66146.33164.22
SOM (g kg−1)16.51254.63282.42
Total N (g kg−1)1.349.812.65
Total P (g kg−1)0.6210.127.32
Total K (g kg−1)-14.229.76
Available N (mg kg−1)130.7--
Available P (mg kg−1)22.21--
Available K (mg kg−1)230.5--
C:N ratio7.1614.9212.98
Note: SOC—soil organic carbon, SOM—soil organic matter, N—nitrogen, P—phosphorous, K—potassium, C:N—carbon to nitrogen ratio.
Table 3. Nutrient content and amount provided for each treatment and application time.
TreatmentN (g pot−1)Urea (g pot−1)CM or PM (g pot−1)Basal Fertilization (g pot−1)Tillering (g pot−1)Panicle Initiation (g pot−1)
T1: CK000P2O2: KCl: 1.10KCl: 1.1Urea: 0.78
T2: 100% CF1.83.910Urea: 2.35, P2O2: 4.5, KCl: 1.1Urea: 0.78, KCl: 1.1Urea: 0.78
T3: 60% CM + 40% CF1.81.56125.8Urea: 0, CM: 125.8, P2O2: 4.5, KCl: 1.1Urea: 0.78, KCl: 1.1Urea: 0.78
T4: 30% CM + 70% CF1.82.7362.9Urea:1.17, CM: 62.9, P2O2: 4.5, KCl: 1.1Urea: 0.78, KCl: 1.1Urea: 0.78
T5: 60% PM + 40% CF1.81.56108.2Urea: 0, PM: 108.2, P2O2: 4.5, KCl: 1.1Urea: 0.78, KCl: 1.1Urea: 0.78
T6: 30% PM + 70% CF1.82.7354.1Urea: 0, PM: 54.1, P2O2: 4.5, KCl: 1.1Urea: 0.78, KCl: 1.1Urea: 0.78
Note: N—nitrogen, CK—control, CF—chemical fertilizer (urea), CM—cattle manure, PM—poultry manure, P2O2—superphosphate, KCl—potassium chloride.
Table 4. Changes in soil physical properties under combined organic and inorganic fertilizers.
TreatmentBulk Density (g cm−3)Porosity (%)Moisture Content (%)
SeasonEarlyLateEarlyLateEarlyLate
T11.37 a1.37 a40.21 d40.10 d11.20 d11.33 c
T21.38 a1.37 a40.11 d39.98 d11.23 d11.20 c
T31.29 c1.21 d43.27 a46.20 a12.40 a13.25 a
T41.31 b1.25 b42.80 c45.28 b11.95 c12.56 b
T51.29 c1.23 c43.20 b45.90 b12.25 b12.90 b
T61.32 b1.26 b42.22 c45.55 c11.84 c12.42 b
Note: T1: no N fertilizer, T2: 100% CF, T3: 60%CM + 40%CF, T4: 30%CM + 70%CF, T5: 60% PM + 40%CF, T6: 30%PM + 70%CF. Values followed by the same letters, within column, are not significantly different at p < 0.05.
Table 5. Changes in soil chemical properties under combined organic and inorganic fertilizers.
TreatmentpHSOCSOMTNAPAK
(Water)(g kg−1)(g kg−1)(g kg−1)(mg kg−1)(mg kg−1)
Early season
T15.91 c9.60 d16.50 e1.31 c21.28 d233.20 d
T25.90 c9.65 d16.60 d1.35 c21.76 cd238.53 c
T36.29 a11.83 a19.33 a1.61 a24.51 a285.23 a
T46.15 b10.40 c17.83 c1.46 b22.97 bc271.60 b
T56.27 a11.70 a19.40 a1.62 a23.90 ab275.23 b
T66.11 b10.50 bc18.00 b1.46 b23.34 ab271.62 b
Late season
T15.92 c9.61 d16.52 c1.29 d21.96 c240.53 e
T25.89 d9.66 c16.61 c1.33 d22.35 c282.23 d
T36.36 a13.46 a21.96 a1.83 a26.22 a348.20 a
T46.25 a11.96 b20.56 b1.69 c25.64 ab336.90 b
T56.40 a13.30 a22.00 a1.85 a26.02 a343.20 a
T66.28 b12.00 b20.63 b1.71 b25.04 b320.53 c
Note: T1: no N fertilizer, T2: 100% CF, T3: 60%CM + 40%CF, T4: 30% CM + 70% CF, T5: 60% PM + 40%CF, T6: 30%PM + 70%CF, SOC—soil organic carbon, SOM—soil organic matter, TN—total nitrogen, AP—available phosphorous, AK—available potassium. Values followed by the same letters, within column, are not significantly different at p ≤ 0.05.
Table 6. Changes in root length, surface area, average diameter, and root volume under organic and inorganic fertilizer.
TreatmentsTRL (m hill−1)TRSA (m2 hill−1)TARD (mm hill−1)TRV (cm3 hill−1)
SeasonEarlyLateEarlyLateEarlyLateEarlyLate
Tillering
T174.9 d75.3 d18.2 c18.2 c0.28 b0.21 c22.2 c21.2 c
T289.2 a90.2 a23.1 a24.1 a0.33 a0.28 b27.1 a26.1 a
T380.2 c82.4 c21.2 b22.1 b0.34 a0.34 a25.3 b24.5 b
T486.5 b86.3 b22.1 b22.9 b0.32 a0.33 a26.6 a25.6 b
T582.1 b83.6 c21.9 b21.9 b0.34 a0.33 a24.2 b24.4 b
T685.1 b87.2 b22.1 b22.5 b0.33 a0.32 a26.3 ab25.8 a
Heading
T1130.6 d130.3 c40.1 c41.4 c0.49 c0.45 c49.8 c48.5 c
T2157.0 b150.5 b44.1 b43.8 bb0.63 b0.65 b54.7 b51.4 b
T3146.2 c150.5 b44.2 b45.5 ab0.63 b0.66 a55.1 b56.1 a
T4164.1 a165.3 a44.2 a47.2 a0.67 a0.67 a59.1 a58.5 a
T5150.5 c155.2 b44.4 ab45.4 ab0.66 a0.66 a57.2 a55.3 a
T6158.0 ab166.3 a46.1 a47.5 a0.67 a0.67 a57.5 a58.6 a
Maturity
T1114.4 c112.5 c31.9 c29.3 c0.50 c0.49 c39.4 c39.8 c
T2134.0 b127.4 b34.0 b33.8 b0.55 b0.54 b45.7 b46.4 b
T3124.2 b130.8 a34.2 b34.5 b0.54 b0.55 b49.3 a45.2 b
T4139.8 a137.6 a38.7 a36.3 a0.59 a0.60 a50.1 a51.2 a
T5128.5 b133.2 a34.4 b34.5 b0.58 a0.54 b46.5 b47.8 b
T6136.0 a132.5 a37.7 a34.4 b0.59 a0.59 a48.8 ab47.8 b
Note: T1: no N fertilizer, T2: 100% CF, T3: 60%CM + 40%CF, T4: 30%CM + 70%CF, T5: 60% PM + %40CF, T6: 30%PM + 70%CF, TRL—total root length, TRSA—total root surface area, TARD—total average root diameter, TRV—total root volume. Values followed by the same letters within column are not significantly different at p < 0.05.
Table 7. Changes in growth, grain yield, and yield components of rice under organic and inorganic fertilizer application.
TreatmentFLA (cm2)PH (cm)NT (hill−1)PL (cm)FGP (%)TGW (g)GY (g hill−1)BY (g hill−1)HI (%)
Early Sea
T124.9 c102.1 c9 c23.3 c73.7 c19.4 d22.6 c61.9 d41 c
T233.5 a115.3 a15 a26.5 a82.5 a25.5 a41.7 a89.1 ab50 a
T331.4 b109.3 b13 b24.1 b79.3 b24.7 bc35.6 b84.3 c44 b
T433.6 a114.1 a15 a26.1 a82.4 a24.8 ab43.4 a88.4 b51 a
T533.0 ab108.7 b13 b23.9 b70.1 b23.8 b36.1 b85.2 c46 a
T634.32 a115.3 a15 a26.4 a82.5 a25.2 a43.4 a90.2 a50 a
Late Sea
T124.9 c101.1 b9 c20.9 b72.5 b19.8 d20.8 d58.3 d42 c
T233.4 a113.9 a13 a23.8 a81.8 a25.3 a39.2 b82.7 b49 b
T331.4 b113.6 a12 b24.9 a82.3 a23.6 b33.9 c72.4 c50 ab
T433.6 a113.6 a14 a23.6 a84.2 a24.7 a40.2 a85.1 ab52 a
T533.1 ab112.5 a13 b24.9 a82.9 a23.1 b34.9 c74.1 c50 ab
T633.7 a114.8 a14 b25.2 a83.2 a25.3 a41.3 a86.9 a51 ab
Note. T1: no N fertilizer, T2: 100% CF, T3: 60%CM + 40%CF, T4: 30%CM + 70%CF, T5: 60%PM + 40%CF, T6: 30%PM + 70%CF. Sea—season, FLA—flag leaf area, PH—plant height, NT—number of tillers, PL—panicle length, FGP—filled grain percent, TGW—thousand grain weight, GY—grain yield, BY—biological yield, and HI—harvest index. Values followed by the same letters, within column, are not significantly different at p ≤ 0.05.
Table 8. Correlation coefficients of yield, N uptake, and biomass accumulation with root morphological features at different growth stages under organic and inorganic fertilizer application.
Root Correlation Coefficients between
Traits Grain Yield N UptakeTotal Biomass
TillHeadMatTillHeadMatTillHeadMat
TRL0.76 **0.96 **0.94 **0.51 *0.93 **0.85 **0.32 ns0.97 **0.98 **
TSA0.55 *0.82 **0.86 **0.62 *0.87 **0.93 **0.55 *0.96 **0.95 **
TARD0.24 ns0.84 **0.78 **0.44 ns0.84 **0.80 **0.55 *0.90 **0.93 **
TRV0.54 *0.64 *0.70 *0.81 **0.83 **0.87 **0.32 ns0.78 **0.74 *
TRDW0.78 **0.78 **0.81 **0.97 **0.89 **0.97 **0.95 **0.85 **0.82 **
Note: Till—tillering, Head—heading, Mat—maturity, N—nitrogen, TRL—total root length, TRSA—total root surface area, TARD—total average root diameter, TRV—total root volume, and TRDW—total root dry weight. ns—non-significant, * and ** represents statistical significance at p < 0.05 and p < 0.01, respectively. The data were averaged over both seasons, treatments showed the same behavior across the seasons.

