Article

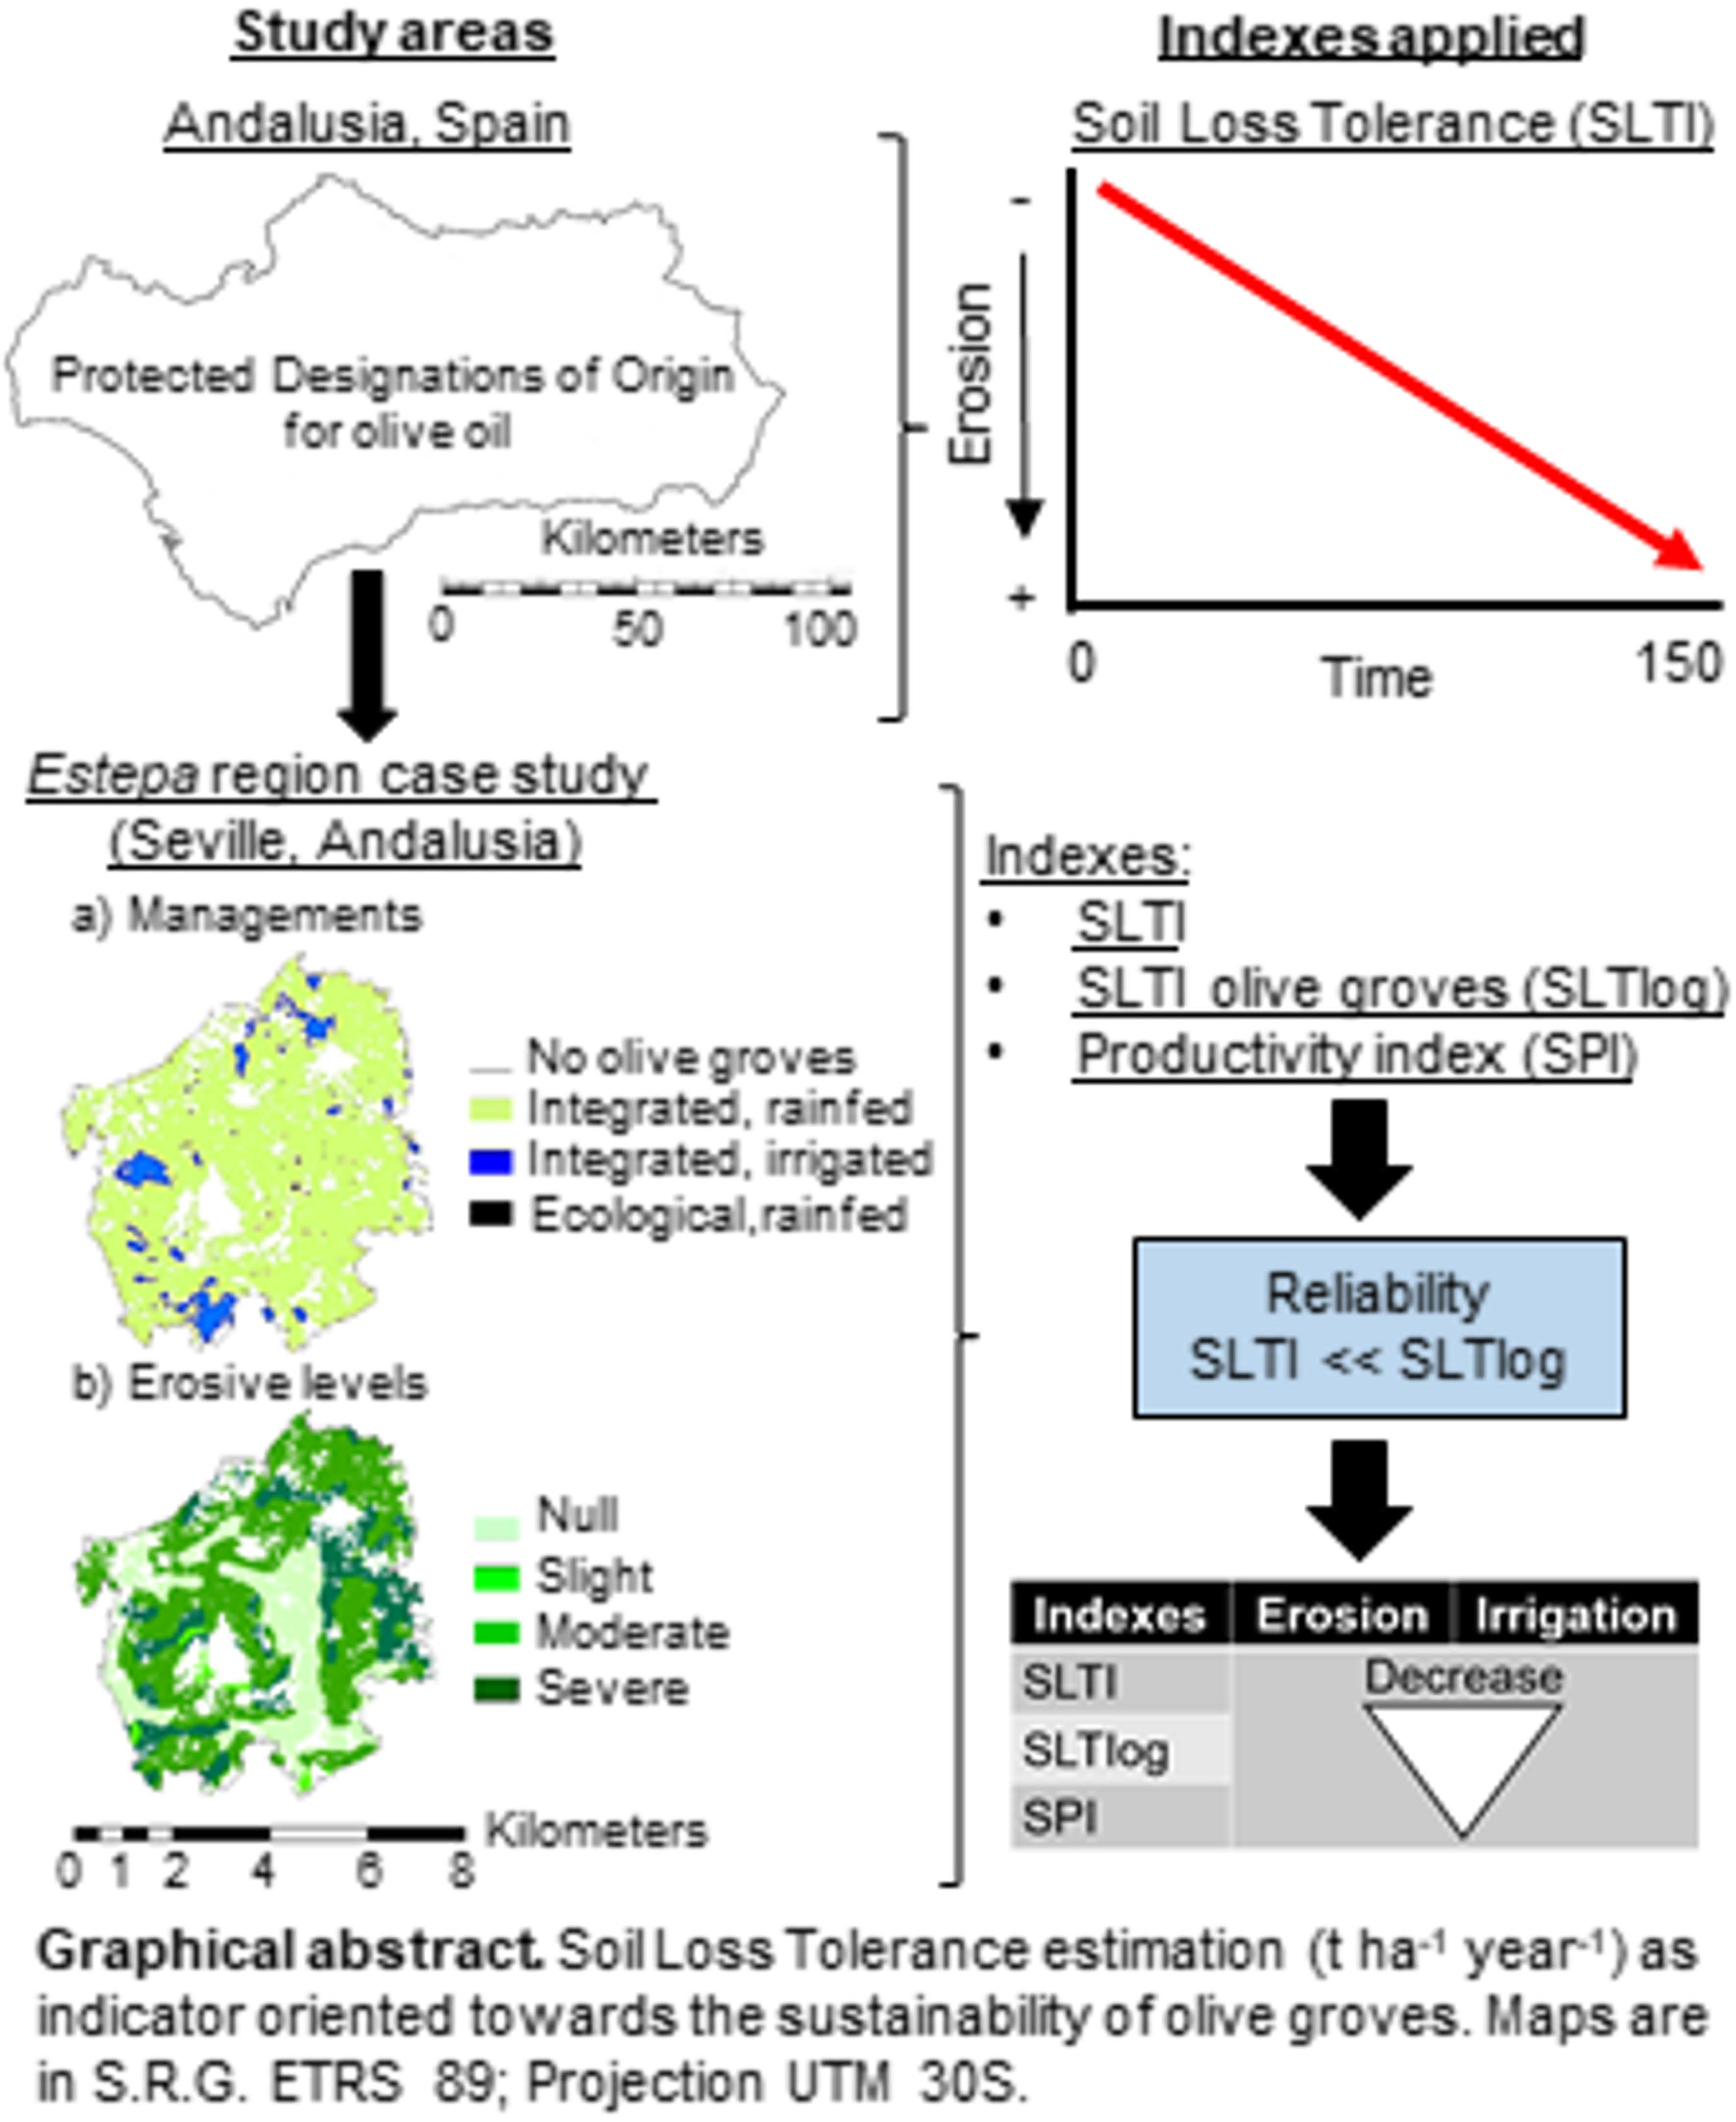
Estimation of Soil Loss Tolerance in Olive Groves as an Indicator of Sustainability: The Case of the Estepa Region (Andalusia, Spain)

by
Antonio Alberto Rodríguez Sousa
*,
Jesús María Barandica
* and
Alejandro J. Rescia
*
Department of Biodiversity, Ecology and Evolution (BEE), Teaching Unit of Ecology (UDECO), Faculty of Biological Sciences, University Complutense of Madrid, 28040 Madrid, Spain
*
Authors to whom correspondence should be addressed.
Submission received: 9 October 2019 / Revised: 14 November 2019 / Accepted: 19 November 2019 / Published: 21 November 2019
(This article belongs to the Special Issue Environmental Sustainability of Crop-Livestock Systems)

Abstract

:
Spain is the world’s leading producer of olive oil, with the largest number of olive agro-systems in the Andalusia region. However, rural migration, low profitability, and biophysical limitations to production have compromised their sustainability. Soil erosion is the main cause of declining production and must be controlled to sustain production and keep soil loss below a threshold (soil loss tolerance, SLT). In this paper, the Soil Loss Tolerance Index (SLTI) for non-specific crops was calculated, theoretically, in different Andalusian olive-growing areas. A new Soil Loss Tolerance Index specifically for olive groves was developed (SLTIog) using soil variables related to erosion corresponding to the Estepa region. This index and the Soil Productive Index (SPI) were estimated. Andalusian olive groves with severe erosion were unsustainable for a 150-year period according to SLTI. However, applying the SLTIog in olive groves of Estepa, soil loss was not unsustainable. Although no statistically significant differences were detected between the two SLT indices, the consideration of specific soil variables in the SLTIog made it more accurate and reliable for the assessment of potential long-term sustainability. The use of specific indices for olive groves can inform the adoption of management measures to maintain productivity and support conservation.

Graphical Abstract

1. Introduction

Olive grove landscapes form socio-ecological systems typical of Mediterranean environments and are particularly notable given their extensive presence in Spain, exceeding 2.5 M ha, 1.5 M in Andalusia [1]. These Andalusian landscapes serve multiple functions, including both olive oil production (around 1 M t year−1) and a socio-economic role in employment generation representing 10% of the agricultural sector, and more than 6% and 20% of agricultural income at national and regional levels, respectively [1,2]. In fact, the Andalusian Regional Government recently asked the United Nations Educational, Scientific and Cultural Organization (UNESCO) to grant olive groves World Heritage status [3,4]. This institutional recognition would have a positive effect on the current market value of the region’s olive oil products and would increase their international relevance [5].
However, despite this encouraging perspective, a more detailed analysis of the sustainability of the olive groves is needed. Sustainability must be evaluated around three main axes, considering demands of farmers, political decision-makers (territorial planning and agricultural management), and practitioners in the olive sector. This means ensuring the economic viability of the crop by maintaining a level of production that sustains a good quality of life for farmers [6,7], and involves management practices that minimize environmental impact due to intensification, allowing farmers to receive environmental subsidies [8,9].
Authors such as Van Vliet et al. [10] have suggested that agricultural intensification and rural abandonment are the most important problems facing rural Europe. In Andalusia, although the abandonment of olive groves has been rare, in recent years many farms have intensified their practices [11]. The negative externalities associated with intensification, such as diffuse pollution, soil erosion, or the loss of ecosystem services (ES), are especially relevant in Andalusian olive groves [12,13], and all of them tend to reduce crop yields [14]. Soil erosion is a natural process that cannot be completely controlled, but various agricultural practices, such as soil cover, contribute to reducing its rates [15]. Soil erosion control is also needed to reduce nutrient losses, to prevent pollution of surface water, and avoid sedimentation or siltation of water bodies [16].
Taking into account the influence of erosive processes on the sustainability of olive farming systems, many studies have been carried out on soil erosion in olive groves and its environmental and economic consequences [15,17,18]. However, in Andalusia, soil erosion rates to maintain a maximum sustained level of production while keeping soil loss below a threshold (soil loss tolerance, SLT) have not been established, except for very general cases [19]. The original SLT Index (SLTI), postulated by Lombardi-Neto and Bertoni in 1975 [20], is a crucial parameter in the evaluation of the sustainability of olive groves. This index reflects, according to the previous studies of Li et al. and Liu et al. [21,22], the maximum acceptable level of soil loss for a crop to maintain balanced production with the current technical means. Given the strong relevance of the implementation of the SLTI, specifically in agricultural crops to ensure sustainability, the present study estimated, for the first time, the state of soil conservation of the Andalusian olive groves with the SLTI and applied a new SLTI specific for olive crops in a case study. Specifically, the objectives were: (a) To estimate, bibliographically, the SLTI of the Protected Designations of Origin (PDOs) of Andalusian olive oil; (b) to estimate, empirically, the SLT for Estepa PDO using a new index of soil loss tolerance in olive groves developed ad hoc (SLTIog); and (c) to estimate, with the previous ad hoc calibration of factors considered, the Soil Productivity Index (SPI).

2. Material and Methods
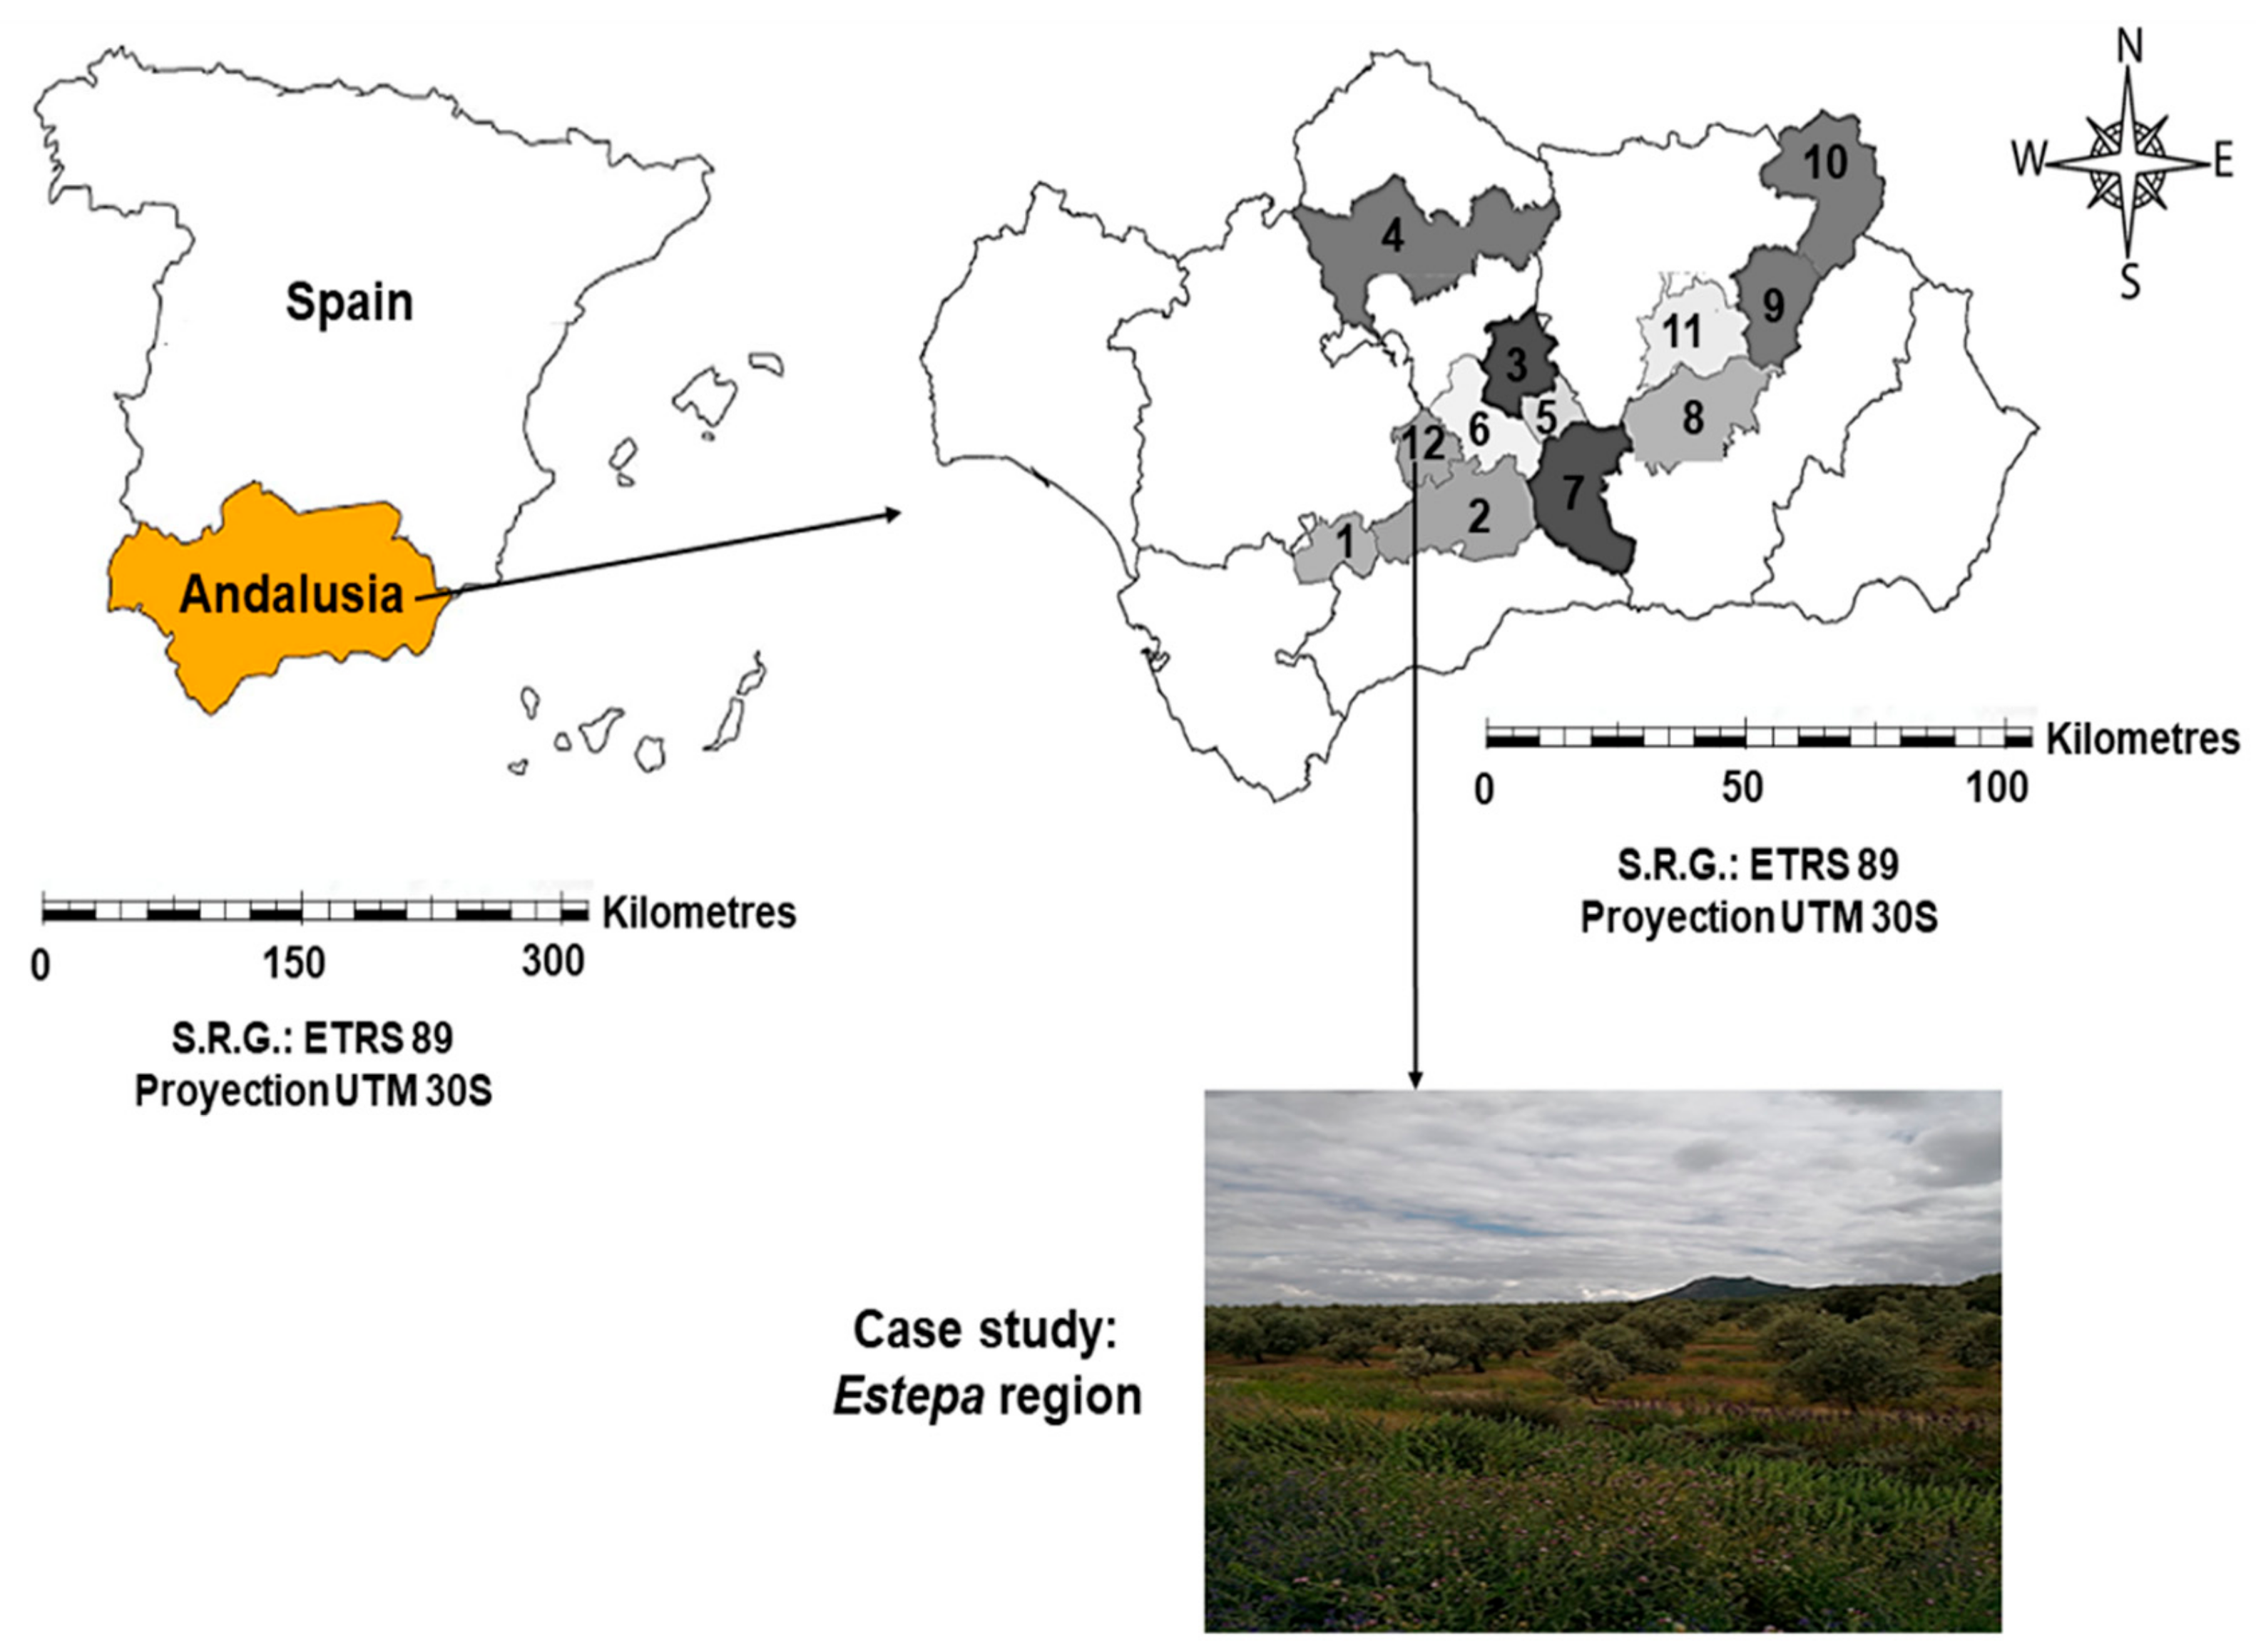
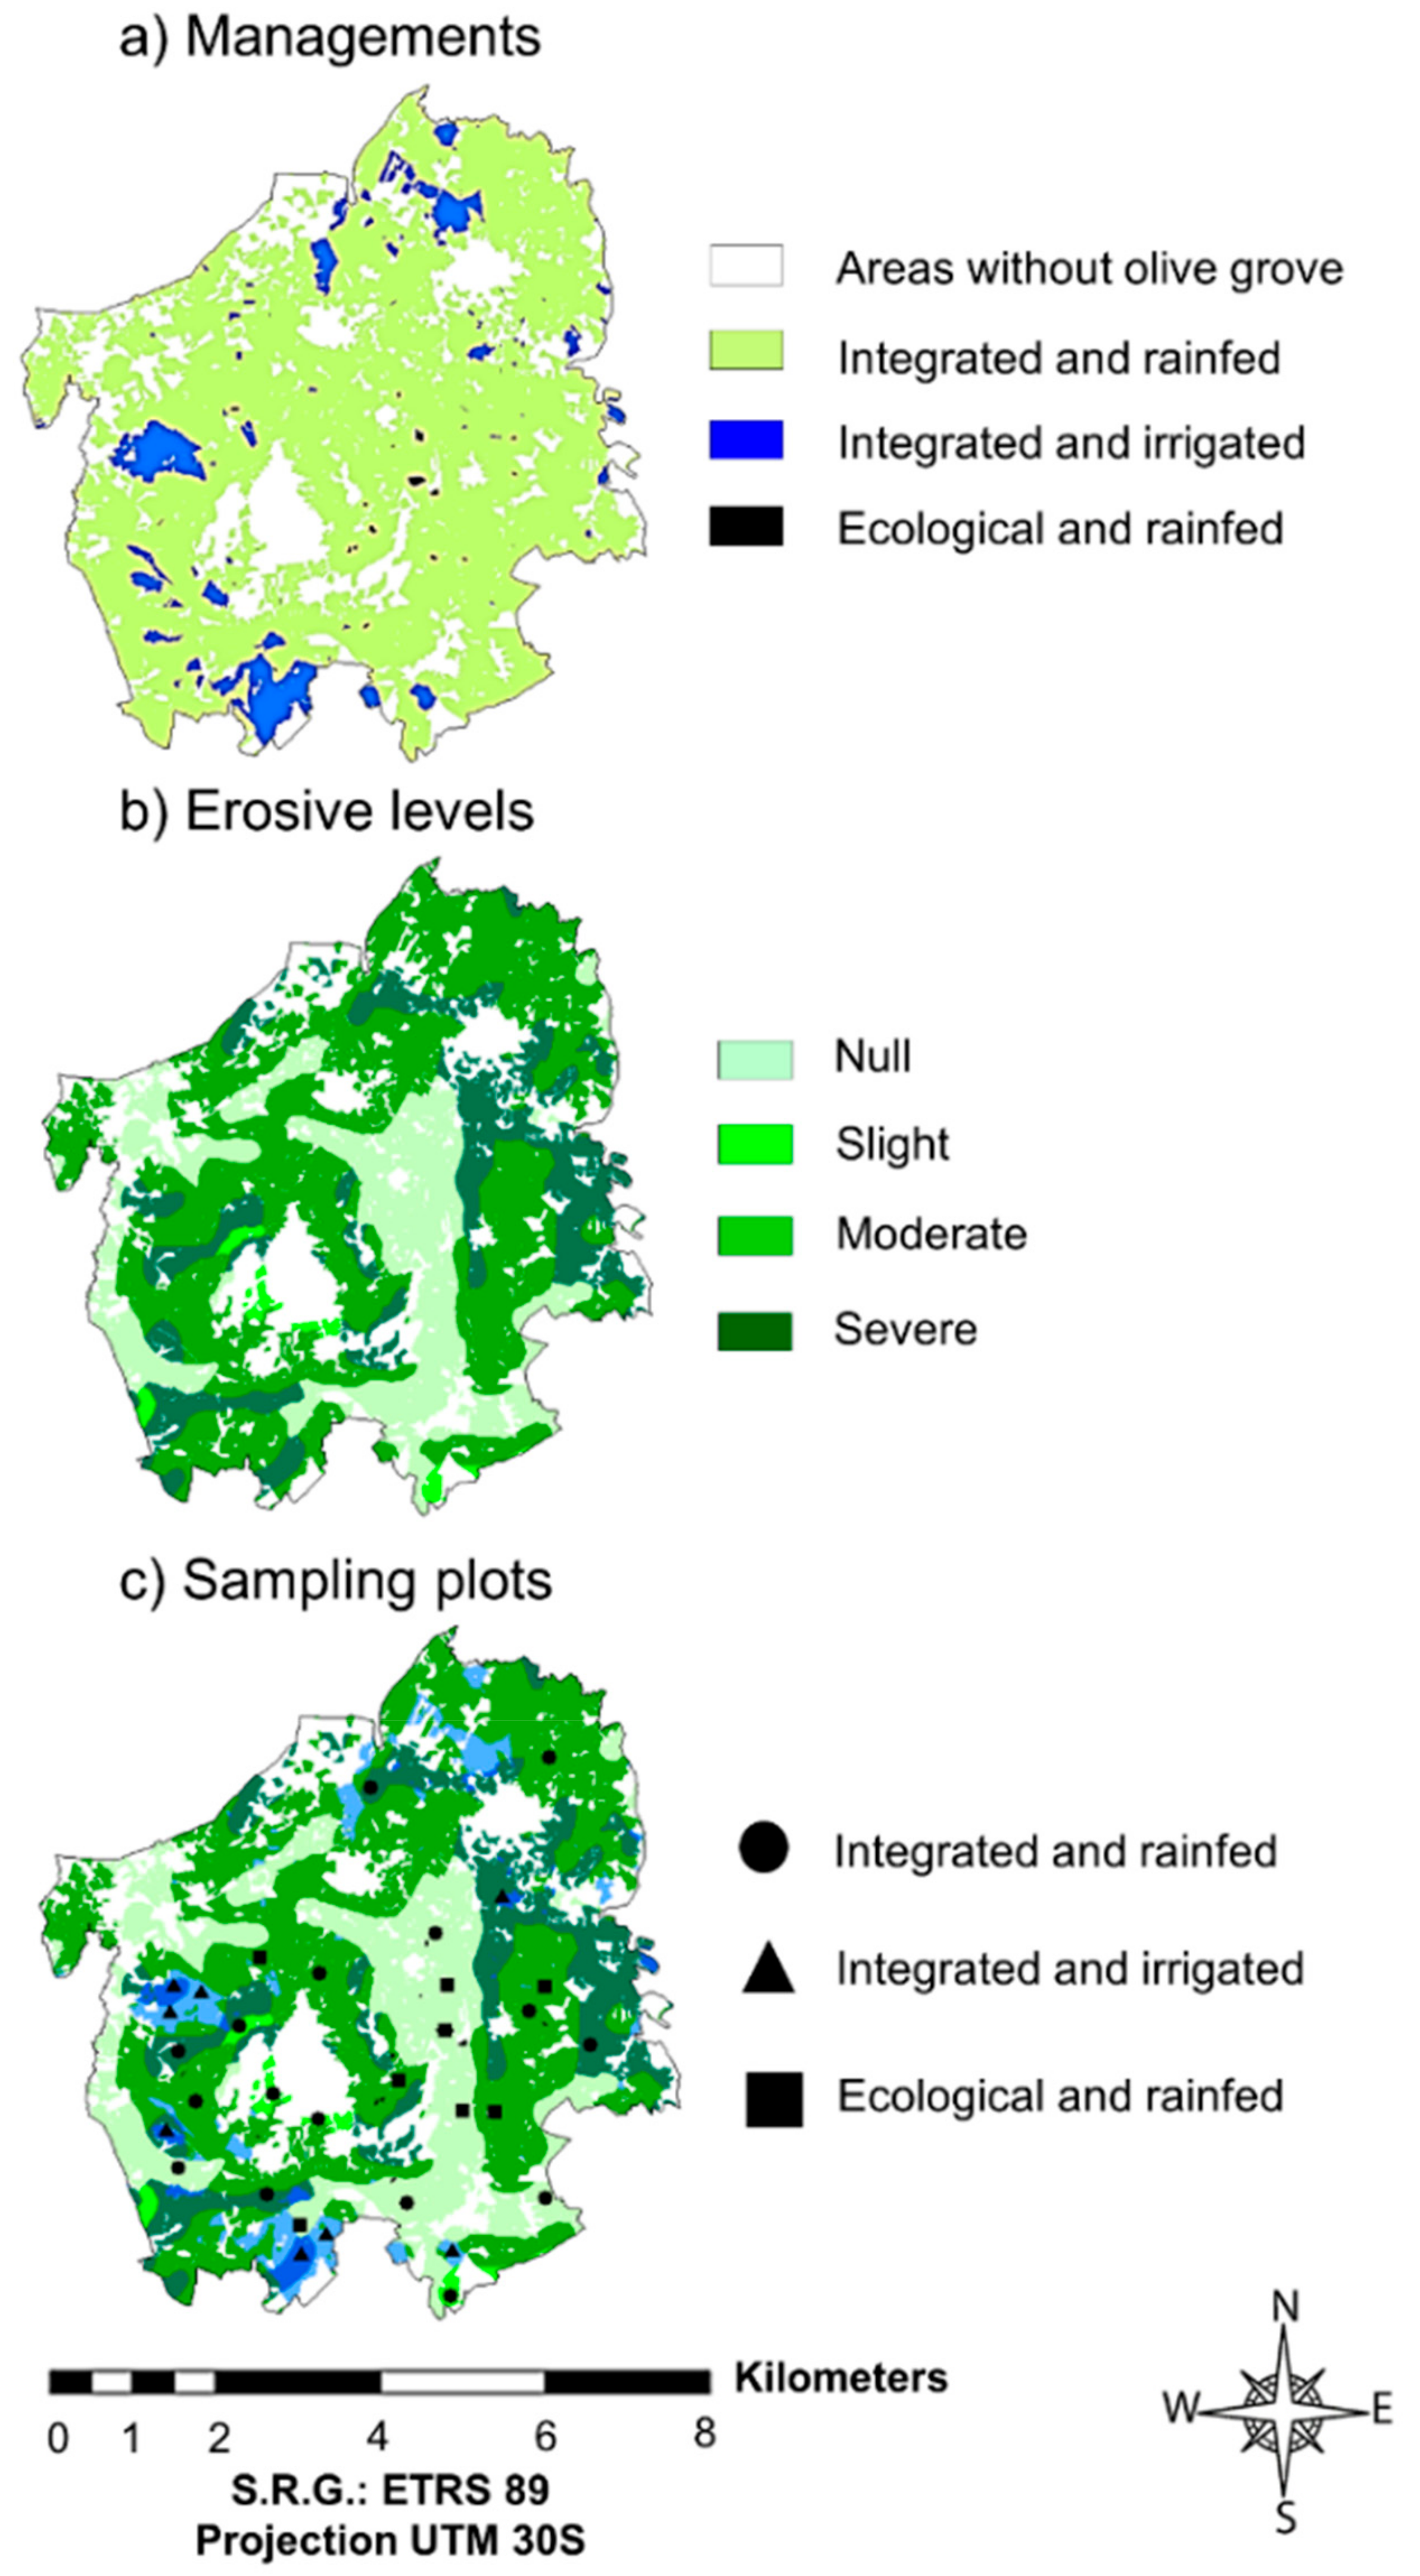
2.1. Study Area

The areas of study considered for the estimation of the SLTI were the main Andalusian PDOs for olive oil (Figure 1). These PDOs (abbreviation, olive grove area) were: (1) Sierra de Cádiz (SCA, 31,500 ha); (2) Antequera (AN, 75,000 ha); (3) Baena (BA, 37,532 ha); (4) Montoro-Adamuz (MA, 53,126 ha); (5) Priego (PR, 28,628 ha); (6) Lucena (LU, 72,438 ha); (7) Poniente de Granada (PG, 71,000 ha); (8) Montes de Granada (MG, 56,000 ha); (9) Sierra de Cazorla (SCZ, 31,500 ha); (10) Sierra de Segura (SS, 38,819 ha); (11) Sierra Mágina (SM, 61,000 ha); and (12) Estepa (ES, 40,000 ha). PDOs are geographical regions, recognized by official standards, in which certain foods with special characteristics related to the region or area are produced. PDO Estepa was used as a case study to calibrate and estimate a new SLTI for olive groves (SLTIog) and an adapted SPI.
The PDOs studied are characterized by a Mediterranean climate with variations in rainfall between 200 to 800 mm, and crops distributed over a wide range of altitudes (i.e. 400–1200 meters above sea level (m.a.s.l.)) and soil types [23]; see Table 1 for more details that characterize the topographical, lithological, and geological data of the PDOs analyzed.

2.2. Estepa PDO: Estimation of Soil Erosion Rates to Experimental Design, Data Collection, and Treatments

The PDO of Estepa, where Soil Loss Tolerance Index postulated for olive groves (SLTIog) was applied, presented two types of olive grove management. The most widespread is integrated management, with a predominantly rainfed regime and a limited number of plots (olive groves) with localized and deficit irrigation [24,25,26]. Under integrated management, the use of chemical fertilizers is allowed and regulated by the Technical Control Agencies [24]. On the other hand, ecological management allows the use of organic agro-products exclusively [24,27,28,29]. It is a minority in the study area and is only applied by farmers in a rainfed regime.
According to the erosion levels postulated by Moreira-Madueño [19] and the calibration of the Universal Soil Loss Equation (USLE) (Equation (1)) [30,31,32] (see Table 1), the soil losses (A, in t ha−1 year−1) were calculated for each erosion level in each olive grove management type in the PDO of Estepa.
A = R × K × L S × C × P
where A is annual soil losses; R is rain erosivity; K is soil erodibility; LS is length and grade of the slope of the territory; C is ground cover; P is agricultural conservation practices.
The erosion levels were estimated with the calibration method outlined by Rodríguez Sousa et al. [33] using the cartography of the Spanish Land Occupancy Information System and the Andalusia Government, respectively [34,35]. Specific bibliographic information published for the study area was used to calibrate rain erosivity and length and grade of the slope of the territory [8,36]. Factor K (soil erodibility) was estimated according to Gisbert Blanquer et al. [37]. Factor C was calibrated for the Estepa region following the Gómez et al. criterion [38]. Factor C varies with the type of management depending on tree density (minimum in both integrated and ecological management types), canopy diameter (maximum at integrated and ecological management types), and with the extent (width) of ground cover (partial in integrated and maximum in ecological management type). Thus, this factor took on a value of 0.16 in integrated olive groves, due to the presence of partial vegetation cover and adult olive groves of approximately 2.5 m radius and corridors of 4 m between the trees. Factor C took on a value of 0.06 for the ecological olive groves in the study area due to the maintenance of the structural characteristics of the olive grove (i.e., canopy diameter and width of crop corridors) and the presence of total vegetation cover in the sampled plots. Finally, factor P was considered to be equal to 1 for all erosion situations, as it was assumed that all plots are subject to tillage practices and none are subject to specific mechanical or soil manipulation erosion control practices [36]. Table 2 shows the parameters of the USLE–RUSLE model adapted and calibrated for the Estepa region according to the criteria described above.
In this case, the categories of erosion vary depending, essentially, on the ground cover factor (C). It should be noted that, based on cadastral information [34,35,39], plots of integrated olive groves with deficit irrigation showed only moderate and severe erosion levels; and plots with ecological olive groves showed only null and moderate erosion levels.
After the estimation of the erosion levels, sampling was carried out in each olive grove management (i.e., rainfed or irrigated integrated olive groves or rainfed ecological olive groves) for each erosive level that was identified. In this way, within each treatment, four plots were randomly sampled. Therefore, eight final treatments were obtained: Integrated rainfed and null erosion; integrated rainfed and slight erosion; integrated rainfed and moderate erosion; integrated rainfed and severe erosion; integrated irrigation and moderate erosion; integrated irrigation and severe erosion; ecological rainfed and null erosion; and ecological rainfed and moderate erosion. A final sample size of n = 32 plots was obtained (Figure 2).
In each sampled plot, a transect 1-km long and 5-m wide was established, taking three equidistant soil samples with a core weight of 112.40 g and a volume of 141.37 cm3. The soil depth was obtained by means of an edaphic core, and edaphic samples were dried at 105 °C for 24 hours. For each treatment, porosity and moisture percentages were calculated based on the soil fraction lower than 2 mm, using dry and wet saturated soil weight estimations, and dry bulk density was measured according to Helson et al. [40] (Equation (2)):
D B D = D S M × V i 1
where DBD is dry bulk density (g cm−3); DSM is dry soil mass (g); Vi is initial sample volume (cm3).
In addition, the percentage of gravel (soil particles between 2 mm to 6 cm) in each treatment was estimated, and a textural soil profile was made using the Bouyoucos method [41,42] and following the USDA criterion (sands: 2 mm–50 μm; silts: 50–2 μm; clays: <2 μm). Chemically, edaphic pH was evaluated by direct estimation (i.e., pH-meter) in water solution. In addition, the potassium of the sampled soils (mg kg−1) was estimated by means of flame photometry [43]. Finally, from the estimation of the carbon percentage of the samples by colorimetry [44], organic matter was calculated following Equation (3):
O M = a × C
where OM is organic matter in the sample (%); a is dimensionless coefficient of variation between organic matter and organic carbon, being 1.724; C is organic carbon in the sample (%).

2.3. Estimation of the Soil Loss Tolerance Index (SLTI) Adapted for Crops

To apply the SLTI, we considered the soil formation and degradation rates over time [21], a soil depth (D SLTI) resulting from the difference between the total soil depth (D) and the useful soil depth of 20 cm assumed as a tillage layer (favorable soil layer for the root system of the plants) and the dry bulk density [40,45]. To calculate the SLTI, it is necessary to first estimate the weight of the soil per unit area according to the Moreira-Madueño criterion [19], following Equation (4):
W = 100 × D × D B D
where W is soil weight (t ha−1); D is soil depth (cm); DBD is dry bulk density (g cm−3).
In addition, based on the SLTI postulated by Lombardi-Neto and Bertoni [20], and modified by Moreira-Madueño for its specific use in crops [19], some assumptions were made to adapt this index to the short-term demands of farmers. These assumptions were: (a) The time period over which crop yields should be constant is 100 years; and (b) erosion rates will be assumed to be constant in the time simulations. These times were: Close to present (year 1); short-term future (year 10); medium-term future (year 25); long-term future (year 50); and distant future (year 150). Thus, the SLTI for crops was calculated as follows (Equation (5)):
S L T I = W E × Y R × Y × 100 1
where SLTI is soil loss tolerance index for crops (t ha−1 year−1); W is weight of soil (t ha−1); E is accumulated erosion over the number of years in which yields are similar to current yields (t ha-1); R is soil regeneration rate (t ha−1 year−1); Y is number of years in which yields are similar to current yields; 100 is time interval, in years, when yields should remain similar to current yields. For the calibration of the E factor of Equation (2), four erosion levels were established according to the MAPAMA report [39]: Minimum erosion (up to 5 t ha−1 year−1); low erosion (up to 25 t ha−1 year−1); medium erosion (up to 100 t ha−1 year−1); and maximum erosion (up to 200 t ha−1 year−1).
Refer to Table 1 in order to see the data needed to complete the SLTI, which have been compiled for each PDO from different technical and scientific sources [19,23,27,28,46,47,48,49]. The soil formed (SF), considered as a natural rate of soil regeneration and a variable that attenuates soil loss due to erosion, was transformed from mm year−1 to t ha−1 year−1 (Equation (6)):
S F = S F m m × D B D × 10
where SF is soil formed (t ha−1 year−1); SFmm is soil formed in mm year−1; DBD is dry bulk density (g cm−3).

2.4. Development and Calibration of a New Adapted Soil Loss Tolerance Index for Olive Groves (SLTIog)

The SLTI was modified to generate a specific index for olive groves (SLTIog). This index was developed from experimental data from Estepa PDO (see Table 4) and applied on this region, using the soil loss rates estimated by the USLE equation (see Table 2). The influence of soil variables on the erosion of olive agro-systems was implemented considering variables not included in the estimation of USLE factors and trying not to over-weight the influence of specific variables on erosive processes (i.e., textural parameters such as clay content in the soil [31,50]). Thus, according to Díaz et al. and Lal [16,51,52], the selected variables contribute to increasing fertility and soil conservation and mitigate the loss of materials by erosion. They are as follows: The percentage of gravel, which creates greater resistance to soil loss due to runoff and wind erosion; porosity, a variable that contributes to the generation of edaphic aggregates, creating structures of resistance against erosive processes; and organic matter, whose percentage is closely related to the increase in carbon and soil fertility. Prior to developing the new index, it was essential to normalize their values to a range from 0 to 1, in order to compare the erosive mitigating potential correctly and to form a normalized erosion retardation factor (nERF) applicable to all treatments (i.e., erosive states and olive-growing management) sampled. Thus, the Feature scaling or MinMax scaler methodology was used (Equation (7)) [53]:
n X = X X m i n × ( X m a x X m i n ) 1
where nX is the normalized variable (dimensionless, value ranging from 0 to 1); X is the original variable; Xmin is the minimum value of the original variable; Xmax is the maximum value of the original variable.
From the normalized values, a linear regression model was applied, following the principle of parsimony, formulating, in Equation (8), a normalized erosion retardation factor (nERFi), which will be annulled with no erosion:
n E R F i = α + β × n G i + γ × n P o r i + δ × n O M i . E i > 0      n E R F i = 0 E i = 0
where nERFi is the normalized erosion retardation factor of erosion level i (t ha−1 year−1); α is the model intercept, dimensionless; β, γ, δ are the variation coefficients of each independent variable in the model with erosion, dimensionless; nGi is the normalized gravel content values of erosion level i; nPori is the normalized porosity values of erosion level i; nOMi is the normalized organic matter values of the erosion level i.
Additionally, for the correct implementation in the SLTIog of the mitigating potential of erosive processes resulting from the combination of the selected soil variables, the normalization of the nERFi factor was removed according to Equation (9), giving rise to the generation of the erosion retardation factor (ERFi):
E R F i = n E R F i × n E R F m a x n E R F m i n + n E R F m i n
where ERFi is the erosion retardation factor of erosion level i (t ha−1 year−1); nERFi is the normalized erosion retardation factor of erosion level i (t ha−1 year−1); nERFmax is the maximum value of the normalized erosion retardation factor (t ha−1 year−1); nERFmin is the minimum value of the normalized erosion retardation factor (t ha−1 year−1).
Fuentes Yagüe [54] and Duan et al. [55] point out that the erosion retardation factor (ERFi) will only be reliable for crops where soil variables present non-normalized values with gravels ranging from 0 to 40%, porosity between 30 to 90%, and a range of organic matter from 0 to 4%.
Finally, the SLTIog postulated is detailed in Equation (10):
S L T I o g = ( W i + R × t E i × t ) ( E R F i × t × 100 1
where SLTIog is the Soil Loss Tolerance Index for Olive Groves (t ha−1 year−1); Wi is the weight of soil for erosive category i (t ha−1); R is the regeneration soil rate (t ha−1 year−1); t is the simulation time (years); Ei is the erosion of level i for Estepa region (t ha−1 year−1); ERFi is the erosion retardation factor of erosion level i (t ha−1 year−1); 100 is the time period over which crop yields should be constant.

2.5. Calibration of the Soil Productivity Index (SPI) for Olive Groves

The Soil Productivity Index (SPI), postulated and modified by Duan et al. [55,56,57], was calibrated and adapted for each treatment and erosion level of the olive groves of the PDO Estepa (Equation (11)). To estimate this index, it is necessary to consider the influence of the main variables closely linked to edaphic productivity: pH, organic matter, potassium, and clays. To properly calibrate the SPI, the sufficiency values of these variables must be used, rather than their values obtained from direct measurements. These sufficiency values (dimensionless quantity normalized to 0–1) reflect the relative suitability of the index to crop growth: The higher the value, the more suitable for crop growth [57]. Sufficiency values were estimated from the empirical data obtained (see Table 3) according Duan et al. [55,56].
S P I i = ( S M i × S p H i × S O M i × S K i × S C l i ) × ( ( ( W i E i R × t ) ) × W m a x i m u m 1 )
where SPIi is the Soil Productivity Index of the erosion level i (dimensionless, value ranging from 0 to 1); SMi is the moisture sufficiency value of erosion level i; SpHi is the pH sufficiency value of erosion level i; SOMi is the organic matter sufficiency value of erosion level i; SKi is the potassium sufficiency value of erosion level i; SCli is the clay sufficiency value of erosion level i; Wi is the weight of soil of erosion category i (t ha−1 year−1); Ei is the erosion of erosion category i (t ha−1 year−1); R is the regeneration soil rate (t ha−1 year−1); t is the simulation time (years); Wmaximum is the maximum soil weight among all treatments (t ha−1 year−1).
Finally, SPI values lower than 0.4 correspond to a low productivity, while SPI values between 0.4 to 0.8 indicate an average productivity and values higher than 0.8 correspond to high productivity [55].

3. Results and Discussion

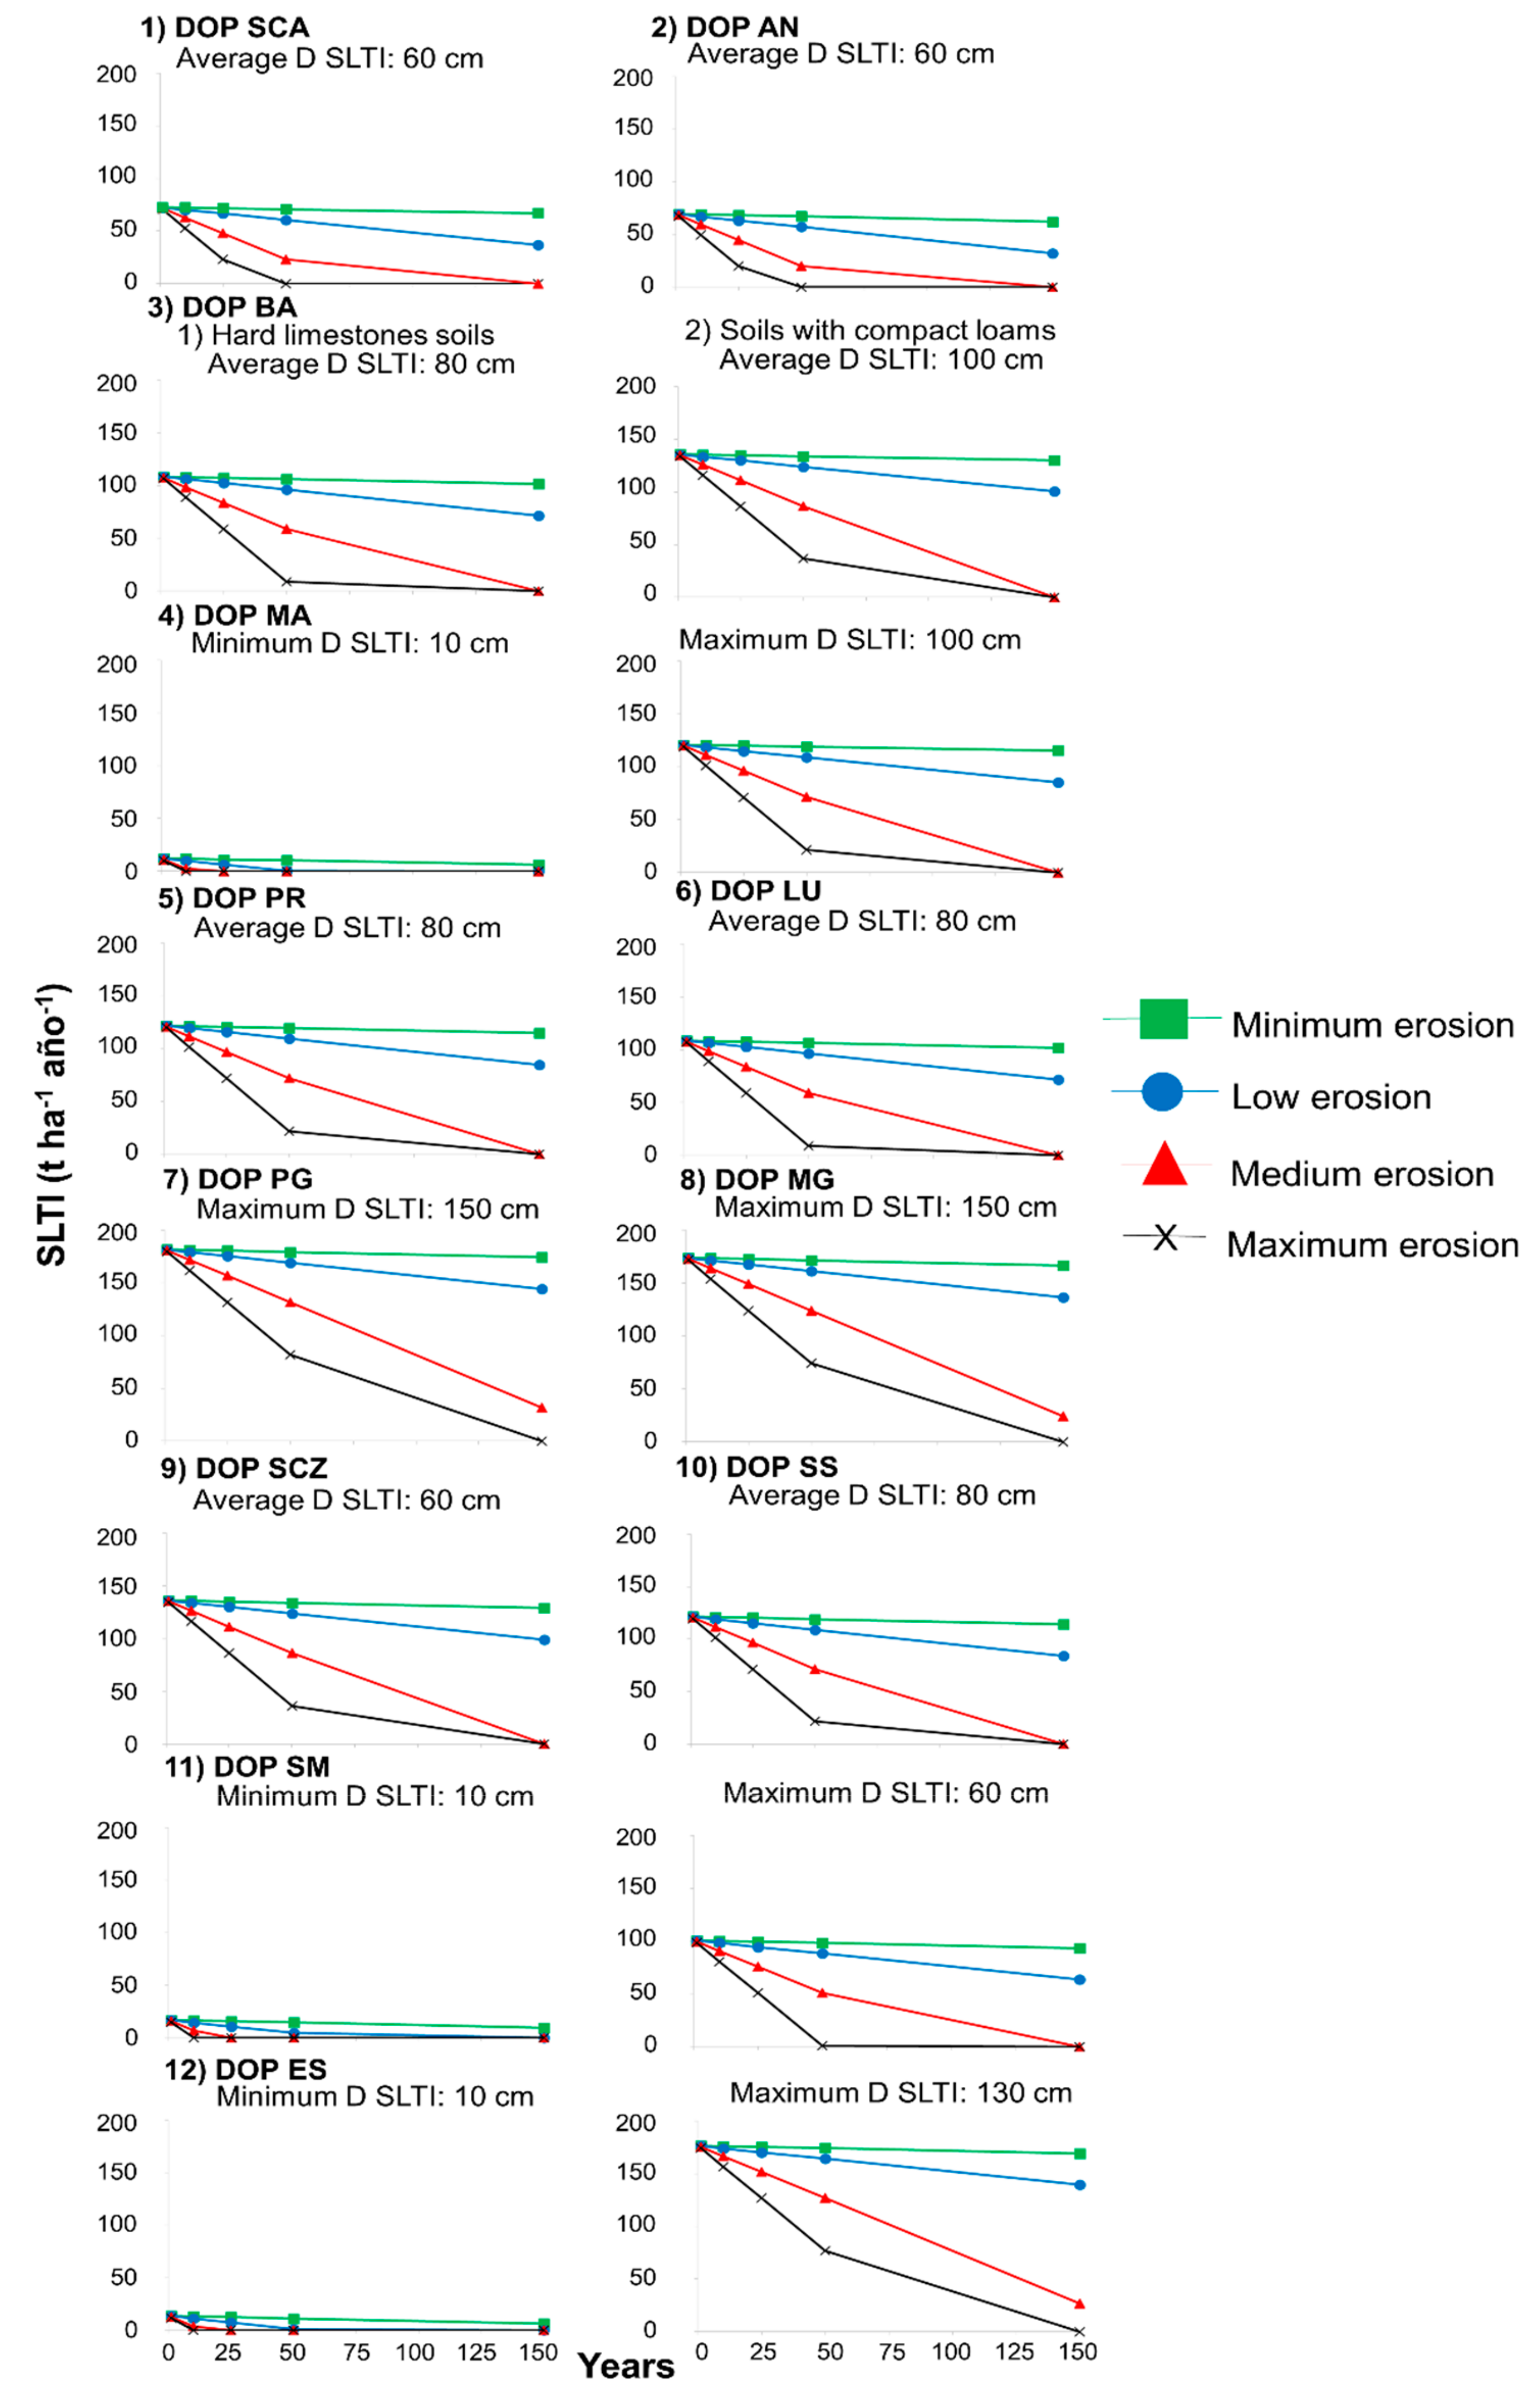
3.1. Estimation of the Soil Loss Tolerance Index (SLTI) for the Theoretical Erosion Levels of Andalusian Protected Denominations of Origin

Figure 3 summarizes the SLTI values considering bibliographic empirical soil parameters according to technical and institutional (i.e., official) data from Moreira-Madueño and BOJA [19,23,27], referring to the olive groves of Andalusia and represented by the different PDOs considered (see data in Table 1). These SLTI values given in the figure could be viewed as guideline references. Taking into account these estimations, none of the study olive grove areas would be sustainable in the case of maximum erosion (or nearly for medium erosion as well) measured by the SLTI for crops for the time projections into the distant future (150 years).
The differences observed for the SLTI in the PDOs studied were caused by the risk of erosion, estimated using data from BOJA in 2002 [58]. Soil loss by erosion depends mainly on tillage practices, directly linked to the presence of ground cover and the impact (i.e., kinetic energy) of rainfall [14]. According to Rodrigo-Comino et al. [59], vegetation ground cover of more than 40% in the autumn and spring months is essential to limiting soil loss. Pagliai et al. [60] highlighted the positive relationship between inappropriate irrigation practices and soil degradation with declining structural stability. However, in the case of olive groves, where almost all irrigation is localized drip and deficit irrigation (only at times of hydric stress), this relationship is not relevant. This consideration is important, since currently more than 30% of Andalusian olive groves are under irrigation [27,34], potentially contributing to soil degradation [61,62].
According to BOJA [58], it is generically stipulated for each PDO that soil losses of up to 60 t ha−1 year−1 would correspond to a low erosion, losses of between 61 to 125 t ha−1 year−1 to an intermediate level, and losses greater than 130 t ha−1 year−1 to a high erosion. In this way, PDOs SCA and AN showed low–intermediate values of SLTI, with olive-growing areas having a relatively medium–high erosion risk (134.2 and 67.8 t ha−1 year−1, respectively), but only with 7–7.5% of its surface managed under irrigation [25,58]. Although both PDOs presented admissible soil losses of around 72.56–67.70 t ha−1 year−1 at the beginning of the projections, as simulation time increased, the long-term viability of the olive grove was compromised. Thus, in 150-year projections, a soil loss tolerance of 66.92–62.27 t ha−1 year−1 was observed for minimum erosion exploitations, being the SLTI of 36.92–32.27 t ha−1 year−1 for plots of low erosion. The olive groves with moderate erosion presented SLTI values between 23.21 to 19.66 t ha−1 year−1 in simulations at 100 years, with a loss of olive groves in 150 years. Finally, plots with maximum erosion presented values of 22.90–19.63 t ha−1 year−1 in simulations at 25 years, with the crop being unsustainable in longer simulation time intervals.
On the other hand, BA PDO, a region with an intermediate erosion risk oscillating around 78.5 t ha−1 year−1, and with only 5% of the area irrigated [25,58], presented SLTI values of 108.75–106.80 t ha−1 year−1 for olive groves with minimum erosion set on limestone soils. However, these values were 135.96–134.01 t ha−1 year−1 for crops on compact loams. For long simulation times, the influence of erosive processes increased, decreasing the index values to 101.50 t ha−1 year−1 for minimum erosion plots and 71.50 t ha−1 year−1 for plots of low erosion in 150-year projections in olive groves on limestone soils. These decreases were up to 130.54 t ha−1 year−1 and 100.54 t ha−1 year−1 in olive groves on compact loams. Although moderate and maximum erosion plots were sustainable for 100 years, with SLTI values of 58.87 and 8.87 t ha−1 year−1 for olive groves on limestone soils, and 86.68–36.68 t ha−1 year−1 for olive groves on compact loams, no crop was viable in the distant future (150 years).
MA PDO, the only region with olives on acidic soils and a granitic substratum [27], presented a high risk of erosion (values of up to 400.9 t ha−1 year−1), with only 5% of its olives under irrigation [25,58]. Thus, minimum values of SLTI (i.e., poorly developed and shallow soils) were obtained at the beginning of the simulation at 12.06–10.11 t ha−1 year−1, and maximum values of SLTI about 120.96–119.01 t ha−1 year−1 were estimated on well-developed soils. However, in longer projections, these values decreased to 6.42 t ha−1 year−1 and 115.32 t ha−1 year−1, respectively, in plots with minimum erosion, and 85.32 t ha−1 year−1 in plots with low erosion in projections at 150 years. Plots with medium and maximum erosion were only sustainable for well-developed soils in 50-year projections, showing values of 71.61 and 21.61 t ha−1 year−1, respectively, losing olive cultivation in shallow soils in 25 years.
PDOs PR and LU (areas with the same characteristics as BA PDO [25,58]) showed, in 1-year projections, acceptable soil losses of 121.55–119.60 t ha−1 year−1 and 108.75–106.80 t ha−1 year−1, respectively. However, as simulation time increased, a loss of tolerance to soil loss was observed. In this sense, the decline in the SLT index for PDOs PR and LU in projections at 150 years, was to 114.33–101.50 t ha−1 year−1 for minimum erosion plots and 84.33–71.50 t ha−1 year−1 for plots of low erosion, respectively. Lastly, although plots with medium and maximum erosion obtained SLTI values, in 100-year projections, of 71.68 and 21.68 t ha−1 year−1, respectively, for PDO PR, and 58.87 and 8.87 t ha−1 year−1 for PDO LU, the olive-growing was not compatible with 150-year viability.
The Granada PDOs (i.e., PG and MG) also presented a wide range of soil depths, making it difficult to achieve an accurate estimate of SLTI (from null values to almost 200 t ha−1 year−1). Special attention should be paid to the fact that in both PDOs, there are soils of equal or less depth than the minimum tillage layer considered for the maintenance of agricultural activity (20 cm) [19,63,64], presenting an average risk erosion value of 53.3 t ha−1 year−1 (i.e., low level), along with approximately 24% of the surface area under irrigation [25,58]. While for PDO PG, a maximum SLTI at the beginning of the simulation of 181.45–179.50 t ha−1 year−1 was found, for MG, these values were 173.95–172.00 t ha−1 year−1. However, these ranges decreased over time, indicating a soil loss tolerance for PG, with 174.18 t ha−1 year−1 for minimum erosion plots, 144.18 t ha−1 year−1 for low erosion plots, and 31.68 t ha−1 year−1 for medium erosion plots in projections at 150 years. Comparatively, for PDO MG, these values were 166.67 t ha−1 year−1, 136.67 t ha−1 year−1, and 24.17 t ha−1 year−1, respectively. Finally, the olive groves with maximum erosion gave rise to an SLTI value of 81.56 t ha−1 year−1 for PDO PG and 74.06 t ha−1 year−1 for PDO MG in simulations over 100 years, losing the crop in longer temporal projections.
For SCZ and SS PDOs, olive-growing areas with a low erosion risk (59.1 t ha−1 year−1) and more than 32% of the olives under irrigation [25], all territories presented, at the beginning of the simulation, admissible soil losses of 135.95–134.00 t ha−1 year−1 and 121.55–119.60 t ha−1 year−1, respectively. However, for PDO SCZ, these values decreased to 128.75 t ha−1 year−1 for minimum erosion exploitations and to 98.75 t ha−1 year−1 for plots with low erosion in projections at 150 years. Similarly, for the PDO SS, these estimated values were 114.33 t ha−1 year−1 and 84.33 t ha−1 year−1, respectively. On the other hand, although moderate and maximum erosion plots were sustainable at 100 years, presenting in PDO SCZ values of 86.08 and 36.08 t ha−1 year−1, respectively, and for PDO SS, values of 71.68 and 21.68 t ha−1 year−1, the maintenance of the olive crop did not appear viable at 150 years. On the other hand, for PDO SM, a region with the same erosion risk and irrigated area as SCZ and SS PDOs [58], minimum and maximum values were established for the SLTI. Thus, for 1-year simulations, olive groves presented minimum values of soil losses of 16.75–14.80 t ha−1 year−1, and maximum values of 100.75–98.80 t ha−1 year−1. However, in longer simulation times, these soil loss thresholds decreased to minimum values of 9.55 t ha−1 year−1 and maximum values of 93.55 t ha−1 year−1 in plots with minimum erosion and 63.55 t ha−1 year−1 in plots with low erosion in projections at 150 years. On the other hand, plots of low, medium, and maximum erosion were only sustainable for well-developed soils, with a loss of olive cultivation in soils of little depth in projections greater than 10 years. Thus, although the plots of moderate and maximum erosion did not appear sustainable at 150 years, the cultivation of olive groves did indicate viability at 50 years, obtaining maximum results of soil loss tolerance of 50.88 and 0.88 t ha-1 year-1, respectively.
Finally, for ES PDO, there was again great variability in soil depth, showing an average risk erosion value of 28.9 t ha−1 year−1 (i.e., low level), and 10% of its surface area under irrigation [58]. This PDO showed, in 1-year simulations, minimum values of soil losses between 13.55 to 11.60 t ha−1 year−1, and maximum values of 176.75–174.80 t ha−1 year−1. However, in projections of 150 years, these values decreased to reach minimum values of 6.30 t ha−1 year−1, and maximum values of 169.50 t ha−1 year−1 in plots with minimum erosion, with those olive groves with higher erosive levels not sustainable in more distant projections. Conversely, on developed soils, SLTI values of 139.50 t ha−1 year−1 and 27.00 t ha−1 year−1 were seen in plots with low erosion and medium erosion, respectively, in this temporal projection. Finally, plots with maximum erosion showed a limit value of SLTI of 76.87 t ha−1 year−1 in 50-year projections, with the olive cultivation unsustainable in higher temporal projections.
These general results, in which SLTI ranges from values more than 10 to almost 200 t ha−1 year−1, show that it would be convenient to apply a more adjusted form to quantify this soil loss tolerance and, on the other hand, that according to these SLTI values, it would be convenient to adopt measures to increase the sustainability of Andalusian olive groves. Soil erosion, at basin (regional) and annual or decennial scales, is a net source of greenhouse gases, and the adoption of preventive erosion measures is increasingly relevant due to the lack of highly fertile agricultural land, competition for soil among different land uses, and population growth with better living conditions [52]. At the crop scale, it would be highly recommended, for example, to apply a permanent vegetation cover, especially as specified above, during spring and autumn, when soil loss is greater [65].

3.2. Tolerance to Soil Erosion and Soil Productivity of Estepa PDO

3.2.1. Physical–Chemical Characteristics of the Soils Related to Their Erosion Level and Management

The soil texture of Estepa PDO was sandy-loam (with a predominance of calcareous material) with an average content of 50.92% sands, 33.30% silts, and 15.78% clays (see Table 3 for a more in-depth granulometric analysis). These soils are highly susceptible to erosion due to the low proportion of fine particles that can form stabilizing aggregates [23,60]. There is no direct trend regarding granulometric parameters depending on the agricultural management or erosion levels of the sampled plots. In general, there is a low clay content in the PDO, not exceeding 25.18%
Table 4 shows the values of physical–chemical edaphic parameters for the different management types and erosion levels for the calibration of the applied indices.
Firstly, it is necessary to highlight that the maximum soil weight value (Wmaximum) obtained was 16,173.15 t ha−1, corresponding to plots under ecological management with no erosion. However, excluding the tillage layer of 20 cm, this maximum value was 14,073.15 t ha−1. According to these results, there was a positive relationship between erosion and dry bulk density, leading to a greater soil compaction [50,59]. A higher erosion level is often observed in areas where tillage and management practices increase soil compaction, resulting in high bulk density and reduced soil porosity [66,67]. Consequently, in the case of integrated rainfed management and severe erosion, an increase of 20.72% in the compaction of soils and decrease of up to 12.44% in the porosity was observed with respect to the values of rainfed integrated olive groves with null erosion, being a variable that contributes to mitigating soil loss by allowing rainwater infiltration into the subsoil [16,68]. In the integrated and rainfed olive groves with the greatest erosion, the soil depth decreased by 51.16%. Comparing these average values to the soil depth of the rainfed integrated plots with null erosion resulted in proportional decreases in the weight of soil per unit area, due to the acceleration of soil loss from the increase of erosive processes [33]. In irrigated olive crops, the density of the soil increased by up to 15%, with decreases in the weight of the soil by up to 15.13% with respect to the rainfed integrated olive grove, due to the implementation of irrigation as a practice of agrarian intensification leading to an increase in soil loss from runoff [62,69]. On the other hand, soil moisture with hydric incorporation to the crop was also higher, presenting plots with moderate and severe erosion with 63.64% and 56.73% more water content, compared to rainfed plots and equivalent erosion. Ecological management gave rise to soils of greater depth (increases of up to 5.40%) and lower dry bulk density than plots under integrated management (decreases of between 8.70 to 9.31%), due to the agrarian management characteristics that promote soil conservation and fertility [33].
Chemically, decreases of 7.60% and 62.43% were observed for pH and organic matter of the soil, respectively, as the erosive level of the rainfed plots increased (i.e., from null to severe), resulting from the loss of cations due to runoff. These observations were greatest in irrigated plots [16,69,70]. Additionally, the implementation of irrigation increased these differences, assuming a decrease of between 0.24 to 0.63% of pH and 18.11 to 23.74% of organic matter content in the moderate and severe erosion levels compared to the values estimated for rainfed olive groves. However, ecological management showed, with respect to integrated management, increases in these variables of 0.58% and 5.67%, respectively, due to the vegetation covers employed [71]. Finally, the concentration of potassium, a fundamental ion in agricultural productivity [55,72], decreased with the erosion level in rainfed integrated crops by 33.64%. However, irrigation led to an increase in the estimated amount of this cation of up to 1.92% and 20.48% in plots of moderate and severe erosion compared to rainfed plots. The concentration of this ion was higher in ecological crops than in integrated farming, due to the minimization of the tillage practices and the use of organic fertilizers, promoting soil conservation and fertility [73]. It showed increases with respect to integrated plots with the same erosion level, of 99.57% for crops without erosion and 126.07% in plantations with moderate erosion.
In summary, soil depth, porosity, organic matter, and potassium content directly decrease with the level of erosion due to soil loss affecting soil productivity. As Díaz et al. emphasized [51], organic matter is one of the most important factors of soil resistance to erosion, due to its contribution to the formation of stable aggregates and facilitation of infiltration. The greater depth of the soil indicates, in most cases, the health of the soil and the greater potential time it has to be eroded. In Estepa, the average soil depth is around 100 cm but shows lower values when soil erosion is severe. Irrigation has a negative effect on the presence of organic matter and potassium, whose values are also higher in ecological management than in integrated management.

3.2.2. Soil Loss Tolerance Indices (SLTI; SLTIog) and Soil Productivity Index (SPI) in the Estepa Region

Table 5 shows the variables corresponding to the linear regression model that defines the normalised erosion retardation factor (nERF). This model presented a R2: 95.5%, which was highly significant (p-value < 0.001 ***; statistical F: 254.925).
Using this calibration, in Table 6, the different estimations of indices considered are shown. Although there were no significant differences between the applied indices (p = 0.983 (> 0.05); F < 0.001), the consideration of soil variables related to erosion in the SLTIog allows us to see that the potential long-term sustainability of these crops is greater than that measured with the SLTI. In this sense, differences between SLTI and SLTIog gradually increased as the erosion level of the plots and the simulation times progressed. For null erosive states, there were no differences between the two indices, as there was no soil loss. For the cases with severe erosion in rainfed regimes, differences between 0.01 to 11.26% were detected for simulations at 1 and 150 years, respectively. Additionally, through the application of the SLTIog, olive groves with irrigation and severe erosion showed a high reduction in the SLTIog value in 150-year simulations, demonstrating the sustainable character of these plots (0.41 t ha−1 year−1). In this sense, it should be noted that this reduction in the value of the SLTIog observed for this treatment is fundamentally due to the magnitude of the erosion (36.68 t ha year), together with a lower content of gravel, porosity, and organic matter than the rest of the evaluated treatments (i.e., erosive states and agricultural management), resulting in the generation of a lower erosive retardation factor (ERFi).
The results show that the current erosion level and irrigation played an important role in soil loss tolerance. The SLTI and SLTIog values exhibited a decrease of around 50 and 90%, to 1 and 150 years, respectively, in the integrated rainfed olive groves. Similarly, both indices showed decreases, with respect to rainfed integrated management, of around 20–25%, showing a negative effect of the irrigation on soil loss tolerance. In the case of ecological management, an increase in tolerance to soil loss can be observed with respect to integrated management, being 4.00–4.17% for olive crops without erosion and 5.87–13.12% with moderate erosion. This shows a greater sustainability of this management type in relation to erosion tolerance [20].
Several studies mention the negative impact of irrigation on erosion, especially through increasing surface runoff and contributing to the infiltration of pollutants (herbicides and pesticides) into groundwater [13,69]. Other studies show that localized and deficit irrigation avoids or minimizes these impacts [47]. Although a considerable number of olive groves under irrigation in Andalusia are subject to this form of application, the results seem to indicate that irrigation in this region with high water stress and relatively degraded soils have a potentiating influence on erosion [74]. Deficit and localized irrigation improve water use efficiency and vegetative growth control (optimizing fruit size and quality); however, soil management remains essential to avoid the synergistic effect of irrigation and erosion. For example, in the Andalusian olive grove a superficial tillage of the soil can be applied that increases its roughness, allowing a short-duration storage of the water from precipitation (that exceeds infiltration speed) in small depressions. Also, conservation tillage can be applied, maintaining mulching with crop residues on the soil surface and a degree of vegetation cover that protects the soil from the direct impact of raindrops, and conserves high levels of organic matter in the soil [75]. Organic matter in the upper soil layers provides better soil aggregation and reduces crusting or compaction by increasing the water-holding capacity of the soil [76].
The results of this study seem to suggest a clear inverse relationship between erosion and irrigation with a tolerance to soil loss of olive groves. To support this relationship, a sampling design, data collection, and analysis with that specific objective should be considered. However, the results do allow us to clearly appreciate that the persistence of the olive groves in Estepa, evaluated under the SLTI, would not be guaranteed in the long term (150 years). However, applying the new SLTIog developed in this study, the olive groves with severe erosion and irrigation may be viable at 150 years (SLTIog: 0.41 t ha−1 year−1). Thus, the differences between SLTI and SLTIog are the result of a more reliable index derived from the incorporation of the influence of different soil variables as mitigating agents of erosive processes. In addition, its validity and calibration can be verified based on the results being within the limits obtained from the SLTI estimated from bibliographic data for the area of study in Figure 3.
The olive groves of Estepa presented low–intermediate values of productivity according to the estimated SPI [55]. The most productive plots were those of ecological management without erosion, whose values corresponded to the range 0.4–0.8. In the olive groves with integrated management and severe erosion, the relatively low yield was essentially due to the combination of low organic matter content (rainfed and irrigated) and a generalized low potassium content (sufficiency values lower than 0.5) [55,56,57]. In our study, the influence of erosive processes resulted in productive decreases of up to 89.47% in integrated rainfed management with severe erosion. In the cases of moderate erosion, the inclusion of irrigation led to a decrease of 40% in the SPI, while in the olive groves with ecological management, there were increases of 136.84% and 153.33% with null and moderate erosion, respectively. As is well known, soil erosion decreases the soil’s natural fertility, as it eliminates in a first stage the finest particles, clays, and organic matter, as well as nutrients, such as potassium, associated with these particles [25,77]. Soil nutrient loss through runoff and sediment is a major driver for soil fertility decline. In fact, erosion-based constraints associated with stressful climatic conditions define significantly the productivity of farming systems [77]. Furthermore, Qiu et al. [72] suggest that potassium plays a critical role in ecosystem functioning and is a limiting factor in the recovery of vegetation, essential for soil cover. The most effective measure to mitigate erosion in olive groves, according to Zuazo and Pleguezuelo [65], would be the planting or development of a vegetation ground cover that would affect the maintenance of organic matter, nutrients, and porosity, reducing the risk of erosion by up to 75% [8,71].

4. Conclusions

Soil erosion is the most important cause of soil productivity reduction, due to soil nutrient loss, worsening soil texture, and a decrease in soil infiltration. The crop-specific SLTI and SPI provide highly relevant information for farmers and decision-makers on sustainability (persistence in time) and crop viability (production). The new SLTIog developed in this study incorporates certain variables that influence erosion and improve the reliability of the SLTI, especially for olive groves. Although there were no significant differences between the values of the two indices, the consideration of different soil variables related to erosion in the SLTIog made it possible to detect that the potential long-term sustainability of Estepa olive groves is greater than that measured with the SLTI. In any case, the values of the indices applied in the Estepa case study, especially the SLTIog, conform to the stipulated theoretical ranges.
In future research, some additional variables (i.e., other nutrients, depth to maximum clay content in the soil profile) could be incorporated or a more precise adjustment could be made to those variables already applied (i.e., mathematical relationships between variables and erosion) to improve the solidity of the index. The impacts of off-site (downstream) soil erosion, such as sediment damage, degradation of water and air quality, and greenhouse gas emissions, are increasingly causing concern in society. In agreement with other authors, such as Lal in 2019 [52], the formal incorporation of the social costs (for example, dredging of waterways or deterioration in the quality of river water) of off-site damage into the concept of tolerance to soil loss is a major challenge for the future.

Author Contributions

Conceptualization, A.A.R.S. and A.J.R.; data curation, A.A.R.S.; formal analysis, A.A.R.S., J.M.B., and A.J.R.; investigation, A.A.R.S., J.M.B., and A.J.R.; methodology, A.A.R.S. and J.M.B.; project administration, A.J.R.; resources, J.M.B. and A.J.R.; software, A.A.R.S. and A.J.R.; supervision, J.M.B. and A.J.R.; validation, J.M.B. and A.J.R.; visualization, A.A.R.S.; writing—original draft, A.A.R.S.; writing—review and editing, A.A.R.S., J.M.B., and A.J.R.

Funding

This research was not funded by any public or private institution.

Acknowledgments

The authors thank Moisés Caballero, Secretary of the Estepa Protected Denomination of Origin, and M.A. Rodríguez Sousa for her comments and suggestions on the first drafts of the manuscript. Antonio Alberto Rodríguez Sousa is a PhD student supported through a scholarship from the Complutense University of Madrid. In Memoriam: Antonio Rodríguez Hermida and Herminda Sousa Cougil.

Conflicts of Interest

The authors declare that they have no conflicts of interest.

References

  1. INE. Agriculture, Forestry and Fishing; INE (Instituto Nacional de Estadística/Statistical Spanish Office): Madrid, Spain, 2013; Available online: http://www.ine.es (accessed on 16 August 2019).
  2. INE. Agriculture and Environment; INE (Instituto Nacional de Estadística/Statistical Spanish Office): Madrid, Spain, 2014; Available online: http://www.ine.es (accessed on 17 August 2019).
  3. JA. Los Paisajes de Olivar en Andalucia: Propuesta Para la Inscripción en la Lista de Patrimonio Mundial 2018; JA (Junta de Andalucía/Regional Government of Andalusia): Andalusia, Spain, 2018; Volume I, p. 714. Available online: https://www.dipujaen.es/export/files/paisajes-del-olivar/propuesta-POAs-Vol1-formulario-y-registro.pdf (accessed on 17 August 2019). (In Spanish)
  4. JA. Los Paisajes de Olivar en Andalucia: Propuesta Para la Inscripción en la Lista de Patrimonio Mundial 2018; JA (Junta de Andalucía/Regional Government of Andalusia): Andalusia, Spain, 2018; Volume II, p. 720. Available online: https://www.dipujaen.es/export/files/paisajes-del-olivar/propuesta-POAs-Vol2-anexos.pdf (accessed on 17 August 2019). (In Spanish)
  5. Velázquez, B.; Buffaria, B. About farmers’ bargaining power within the new CAP. Agric. Food Econ. 2017, 5, 16. [Google Scholar] [CrossRef]
  6. Sayadi, S.; Erraach, Y.; Parra-López, C. Translating consumer’s olive-oil quality-attribute requirements into optimal olive-growing practices: A quality function deployment (QFD) approach. Br. Food J. 2017, 119, 190–214. [Google Scholar] [CrossRef]
  7. Rodríguez-Entrena, M.; Colombo, S.; Arriaza, M. The landscape of olive groves as a driver of the rural economy. Land Use Policy 2017, 65, 164–175. [Google Scholar] [CrossRef]
  8. Gómez-Calero, J.A. Sostenibilidad de la Producción de Olivar en Andalucía; Instituto de Agricultura Sostenible, Instituto de Agricultura Sostenible, Centro Superior de Investigaciones Científicas: Córdoba, Spain, 2010; Available online: https://www.ias.csic.es/sostenibilidad_olivar/Sost_2009/Sostenibilidad_de_la_Producci%F3n_de_Olivar_en_Andaluc%EDa3.pdf (accessed on 1 August 2019). (In Spanish)
  9. Rescia, A.J.; Sanz-Cañada, J.; Del Bosque-González, I. A new mechanism based on landscape diversity for funding farmer subsidies. Agron. Sustain. Dev. 2017, 37, 9. [Google Scholar] [CrossRef]
  10. Van Vliet, J.; de Groot, H.L.F.; Rietveld, P.; Verburg, P.H. Manifestations and underlying drivers of agricultural land use change in Europe. Landsc. Urban Plan. 2015, 133, 24–36. [Google Scholar] [CrossRef]
  11. Rodríguez-Cohard, J.C.; Sánchez-Martínez, J.D.; Gallego-Simón, V.J. Olive crops and rural development: Capital, knowledge and tradition. Reg. Sci. Policy Pract. 2018. [Google Scholar] [CrossRef]
  12. Martínez, J.R.F.; Zuazo, V.H.D.; Raya, A.M. Environmental impact from mountainous olive orchards under different soil-management systems (SE Spain). Sci. Total Environ. 2006, 358, 46–60. [Google Scholar] [CrossRef]
  13. López-Pintor, A.; Salas, E.; Rescia, A. Assessment of Agri-Environmental Externalities in Spanish Socio-Ecological Landscapes of Olive Groves. Sustainability 2018, 10, 2640. [Google Scholar] [CrossRef]
  14. Sastre, B.; Barbero-Sierra, C.; Bienes, R.; Marques, M.J.; García-Díaz, A. Soil loss in an olive grove in Central Spain under cover crops and tillage treatments, and farmer perceptions. J. Soils Sediments 2017, 17, 873–888. [Google Scholar] [CrossRef]
  15. Gómez, J.A.; Infante-Amate, J.; De Molina, M.G.; Vanwalleghem, T.; Taguas, E.V.; Lorite, I. Olive cultivation, its impact on soil erosion and its progression into yield impacts in Southern Spain in the past as a key to a future of increasing climate uncertainty. Agriculture 2014, 4, 170–198. [Google Scholar] [CrossRef]
  16. Lal, R. Soil erosion and carbon dynamics. Soil Tillage Res. 2005, 81, 137–142. [Google Scholar] [CrossRef]
  17. Parras-Alcántara, L.; Lozano-García, B.; Keesstra, S.; Cerdà, A.; Brevik, E.C. Long-term effects of soil management on ecosystem services and soil loss estimation in olive grove top soils. Sci. Total Environ. 2016, 571, 498–506. [Google Scholar] [CrossRef] [PubMed]
  18. Sánchez-Escobar, F.; Coq-Huelva, D.; Sanz-Cañada, J. Measurement of sustainable intensification by the integrated analysis of energy and economic flows: Case study of the olive-oil agricultural system of Estepa, Spain. J. Clean. Prod. 2018, 201, 463–470. [Google Scholar] [CrossRef]
  19. Moreira-Madueño, J.M. Capacidad de uso y erosión de suelos. In Una Aproximación a la Evaluación de Tierras en Andalucía; Junta de Andalucía, Agencia del Medio Ambiente: Sevilla, Spain, 1991; Available online: http://www.juntadeandalucia.es/medioambiente/web/Red_informacion_ambiental/productos/Publicaciones/articulos/articulos_pdf/Paralelo.PDF (accessed on 18 January 2019). (In Spanish)
  20. Lombardi-Neto, F.; Bertoni, J. Tolerância de perdas de terra para solos do Estado de São Paulo. Bol. Tec. Inst. Agron. 1975, 28, 12. [Google Scholar]
  21. Li, L.; Du, S.; Wu, L.; Liu, G. An overview of soil loss tolerance. Catena 2009, 78, 93–99. [Google Scholar] [CrossRef]
  22. Liu, G.; Li, L.; Wu, L.; Wang, G.; Zhou, Z.; Du, S. Determination of soil loss tolerance of an entisol in Southwest China. Soil Sci. Soc. Am. J. 2009, 73, 412–417. [Google Scholar] [CrossRef]
  23. BOJA. Ministry of Employment, Business and Commerce; BOJA (Boletín Oficial de la Junta de Andalucía/Official Regional Government of Andalusia): Andalusia, Spain, 2015. Available online: https://www.juntadeandalucia.es/organismos/empleoempresaycomercio/areas/industria/seguridad/paginas/denominaciones-calidad-aceite-oliva.html (accessed on 15 August 2019). (In Spanish)
  24. BOJA. Pliego de Condiciones de la Denominación de Origen Protegida Estepa; BOJA (Boletín Oficial de la Junta de Andalucía/Official Regional Government of Andalusia Bulletin); Consejería de Agricultura, Pesca y Desarrollo Rural: Andalusia, Spain, 2016. Available online: http://www.webcitation.org/77MOBd5Gh (accessed on 3 April 2019). (In Spanish)
  25. Martínez, J.D.S.; Simón, V.J.G.; Jiménez, E.A. El olivar andaluz y sus transformaciones recientes. Estudios Geográficos 2011, 72, 203–229. (In Spanish) [Google Scholar] [CrossRef]
  26. Connor, D.J. Adaptation of olive (Olea europaea L.) to water-limited environments. Aust. J. Agric. Res. 2005, 56, 1181–1189. [Google Scholar] [CrossRef]
  27. BOJA. Plan director del Olivar Andaluz Decreto 103/2015; BOJA (Boletín Oficial de la Junta de Andalucía/Official Regional Government of Andalusia Bulletin): Andalusia, Spain, 2015. Available online: http://www.webcitation.org/77MO1YwQe (accessed on 3 April 2019). (In Spanish)
  28. Loumou, A.; Giourga, C. Olive groves: “The life and identity of the Mediterranean”. Agric. Hum. Values 2003, 20, 87–95. [Google Scholar] [CrossRef]
  29. BOE. Ley 5/2011, de 6 de octubre, del Olivar de Andalucía; BOE (Boletín Oficial del Estado/State Official Bulletin): Andalusia, Spain, 2011; Available online: https://www.boe.es/buscar/act.php?id=BOE-A-2011-17494 (accessed on 3 August 2019). (In Spanish)
  30. Wischmeier, W.H.; Smith, D.D. A Universal Soil-Loss Equation to Guide Conservation Farm Planning, 1st ed.; International Society of Soil Science: Madison, WI, USA, 1961; pp. 418–425. [Google Scholar]
  31. Diodato, N. Predicting RUSLE (Revised Universal Soil Loss Equation) monthly erosivity index from readily available rainfall data in Mediterranean area. Environmentalist 2006, 26, 63–70. [Google Scholar] [CrossRef]
  32. Onori, F.; De Bonis, P.; Grauso, S. Soil erosion prediction at the basin scale using the revised universal soil loss equation (RUSLE) in a catchment of Sicily (southern Italy). Environ. Geol. 2006, 50, 1129–1140. [Google Scholar] [CrossRef]
  33. Rodríguez Sousa, A.A.; Barandica, J.M.; Sanz-Cañada, J.; Rescia, A.J. Application of a dynamic model using agronomic and economic data to evaluate the sustainability of the olive grove landscape of Estepa (Andalusia, Spain). Landsc. Ecol. 2019, 34, 1547–1563. [Google Scholar] [CrossRef]
  34. IECA. Datos Espaciales de Referencia de Andalucía (DERA): G17 Divisiones Administrativas; IECA (Instituto de Estadística y Cartografía de Andalucía/Institute of Statistics and Cartography of Andalusia): Andalusia, Spain, 2018; Available online: http://www.webcitation.org/77MQd2rHN (accessed on 3 April 2019). (In Spanish)
  35. SIOSE. Plan Nacional Para la Observación del Territorio: Sistema de Información Sobre Ocupación del Suelo de España; SIOSE (Sistema de Información sobre Ocupación del Suelo de España/Information System on Land Use in Spain): Madrid, Spain, 2011; Available online: www.siose.es (accessed on 11 August 2019). (In Spanish)
  36. Sánchez Escobar, F. Sistemas Complejos: Una Aplicación Para el Análisis de los Balances Energéticos y Económicos en el Agrosistema de Olivar de Estepa. Ph.D. Thesis, Universidad de Sevilla, Sevilla, Spain, 2015. [Google Scholar]
  37. Gisbert Blanquer, J.M.; Ibañez Asensio, S.; Moreno Ramón, H. El factor K de la Ecuación Universal de Pérdidas de Suelo (USLE); Universitat Politècnica de València: Valencia, Spain, 2012; Available online: http://hdl.handle.net/10251/16850 (accessed on 12 August 2019). (In Spanish)
  38. Gómez, J.A.; Battany, M.; Renschler, C.S.; Fereres, E. Evaluating the impact of soil management on soil loss in olive orchards. Soil Use Manag. 2003, 19, 127–134. [Google Scholar] [CrossRef]
  39. MAPAMA. Mapa de Estados Erosivos (1987–2001); Ministerio de Agricultura, Alimentación y Medio Ambiente/Ministry of Agriculture, Food and Environment: Madrid, Spain, 2017. Available online: http://www.mapama.gob.es/es/biodiversidad/servicios/banco-datos-naturaleza/informacion-disponible/mapas_estados_erosivos.aspx (accessed on 11 August 2019). (In Spanish)
  40. Helson, O.; Beaucour, A.L.; Eslami, J.; Noumowe, A.; Gotteland, P. Physical and mechanical properties of soilcrete mixtures: Soil clay content and formulation parameters. Constr. Build. Mater. 2017, 131, 775–783. [Google Scholar] [CrossRef]
  41. Bouyoucos, G.J. A recalibration of the hydrometer method for making mechanical analysis of soils. Agron. J. 1951, 43, 434–438. [Google Scholar] [CrossRef]
  42. Beretta, A.N.; Silbermann, A.V.; Paladino, L.; Torres, D.; Bassahun, D.; Musselli, R.; García-Lamohte, A. Soil texture analyses using a hydrometer: Modification of the Bouyoucos method. Ciencia Investigación Agraria 2014, 41, 263–271. [Google Scholar] [CrossRef]
  43. Afolayan, O.S.; Oderinde, F.O. Evaluation of deterioration index in soil nutrients due to cultivation of different cocoa species in southwest Nigeria. J. Appl. Sci. Environ. Manag. 2018, 22, 547–552. [Google Scholar] [CrossRef]
  44. Laudicina, V.A.; Novara, A.; Barbera, V.; Egli, M.; Badalucco, L. Long-term tillage and cropping system effects on chemical and biochemical characteristics of soil organic matter in a Mediterranean semiarid environment. Land Degrad. Dev. 2015, 26, 45–53. [Google Scholar] [CrossRef]
  45. Pérez, J.; Salazar, R.C.; Stokes, A. An open access database of plant species useful for controlling soil erosion and substrate mass movement. Ecol. Eng. 2017, 99, 530–534. [Google Scholar] [CrossRef]
  46. Fleskens, L.; Stroosnijder, L. Is soil erosion in olive groves as bad as often claimed? Geoderma 2007, 141, 260–271. [Google Scholar] [CrossRef]
  47. Álvarez, S.; Soriano, M.A.; Landa, B.B.; Gómez, J.A. Soil properties in organic olive groves compared with that in natural areas in a mountainous landscape in southern Spain. Soil Use Manag. 2007, 23, 404–416. [Google Scholar] [CrossRef]
  48. Soriano, M.A.; Álvarez, S.; Landa, B.B.; Gómez, J.A. Soil properties in organic olive orchards following different weed management in a rolling landscape of Andalusia, Spain. Renew. Agric. Food Syst. 2014, 29, 83–91. [Google Scholar] [CrossRef]
  49. SEISnet. Spanish Soil Information System; CSIC (Consejo Superior de Investigaciones Científicas/Spanish National Research Council): Seville, Spain, 2019; Available online: http://evenor-tech.com/banco/seisnet/seisnet.htm (accessed on 1 November 2019).
  50. Porta Casanellas, J.; López-Acevedo Reguerín, M.; Roquero de Laburu, C. Edafología: Para la Agricultura y el Medio Ambiente, 3rd ed.; Ediciones Mundi-Prensa: Madrid, Spain, 2003; p. 807. (In Spanish) [Google Scholar]
  51. Díaz, A.R.; Rubio, J.Q.; Silla, R.O.; Navarro, A.S.; Juárez, M.F.D.; Vázquez, J.G. El uso de parámetros edáficos como indicadores de riesgo de erosión. Rambla de Las Moreras, Murcia, SE de España. In International Conference on Desertification; Dialnet Foundation: Logroño, Spain, 2009; Available online: https://congresos.um.es/icod/icod2009/paper/viewFile/5241/5461 (accessed on 27 September 2018).
  52. Lal, R. Accelerated soil erosion as a source of atmospheric CO2. Soil Tillage Res 2019, 188, 35–40. [Google Scholar] [CrossRef]
  53. González, C.G.; Lise, A.V.; Felpeto, A.B. Tratamiento de Datos Con R, Statistica y SPSS, 1st ed.; Ediciones Díaz de Santos: Madrid, Spain, 2013; pp. 217–415. (In Spanish) [Google Scholar]
  54. Fuentes Yagüe, J.L. Manual práctico de Manejo del Suelo y de los Fertilizantes, 1st ed.; Ministerio de Agricultura Pesca y Alimentación: Madrid, Spain, 1997; p. 159. (In Spanish) [Google Scholar]
  55. Duan, X.; Shi, X.; Li, Y.; Rong, L.; Fen, D. A new method to calculate soil loss tolerance for sustainable soil productivity in farmland. Agron. Sustain. Dev. 2017, 37, 2. [Google Scholar] [CrossRef] [Green Version]
  56. Duan, X.W.; Yun, X.; Feng, Y.J.; Yin, S.Q. Study on the method of soil productivity assessment in black soil region of Northeast China. Agric. Sci. China 2009, 8, 472–481. [Google Scholar] [CrossRef]
  57. Duan, X.; Xie, Y.; Liu, B.; Liu, G.; Feng, Y.; Gao, X. Soil loss tolerance in the black soil region of Northeast China. J. Geogr. Sci. 2012, 22, 737–751. [Google Scholar] [CrossRef]
  58. BOJA. El Pronóstico de la Erosión de Suelos Como Parte del Proceso de Evaluación; BOJA (Boletín Oficial de la Junta de Andalucía/Official Regional Government of Andalusia Bulletin): Andalusia, Spain, 2002. Available online: https://www.juntadeandalucia.es/medioambiente/documentos_tecnicos/uso_suelo/pronostico.pdf (accessed on 22 August 2019). (In Spanish)
  59. Rodrigo-Comino, J.; Taguas, E.; Seeger, M.; Ries, J.B. Quantification of soil and water losses in an extensive olive orchard catchment in Southern Spain. J. Hydrol. 2018, 556, 749–758. [Google Scholar] [CrossRef]
  60. Pagliai, M.; Vignozzi, N.; Pellegrini, S. Soil structure and the effect of management practices. Soil Tillage Res. 2004, 79, 131–143. [Google Scholar] [CrossRef]
  61. Palese, A.M.; Pasquale, V.; Celano, G.; Figliuolo, G.; Masi, S.; Xiloyannis, C. Irrigation of olive groves in Southern Italy with treated municipal wastewater: Effects on microbiological quality of soil and fruits. Agric. Ecosyst. Environ. 2009, 129, 43–51. [Google Scholar] [CrossRef]
  62. Villanueva, A.J.; Gómez-Limón, J.A.; Arriaza, M.; Nekhay, O. Analysing the provision of agricultural public goods: The case of irrigated olive groves in southern Spain. Land Use Policy 2014, 38, 300–313. [Google Scholar] [CrossRef]
  63. Kairis, O.; Karavitis, C.; Kounalaki, A.; Salvati, L.; Kosmas, C. The effect of land management practices on soil erosion and land desertification in an olive grove. Soil Use Manag. 2013, 29, 597–606. [Google Scholar] [CrossRef]
  64. Rodríguez-Entrena, M.; Arriaza, M. Adoption of conservation agriculture in olive groves: Evidences from southern Spain. Land Use Policy 2013, 34, 294–300. [Google Scholar] [CrossRef]
  65. Zuazo, V.H.D.; Pleguezuelo, C.R.R. Soil-Erosion and Runoff Prevention by Plant Covers: A Review. Agron. Sustain. Dev. 2009, 28, 65–86. [Google Scholar] [CrossRef] [Green Version]
  66. Guzmán, G.; Perea-Moreno, A.J.; Gómez, J.A.; Cabrerizo-Morales, M.Á.; Martínez, G.; Giráldez, J.V. Water Related Properties to Assess Soil Quality in Two Olive Orchards of South Spain under Different Management Strategies. Water 2019, 11, 367. [Google Scholar] [CrossRef] [Green Version]
  67. Capello, G.; Biddoccu, M.; Ferraris, S.; Cavallo, E. Effects of Tractor Passes on Hydrological and Soil Erosion Processes in Tilled and Grassed Vineyards. Water 2019, 11, 2118. [Google Scholar] [CrossRef] [Green Version]
  68. Koulouri, M.; Giourga, C. Land abandonment and slope gradient as key factors of soil erosion in Mediterranean terraced lands. Catena 2007, 69, 274–281. [Google Scholar] [CrossRef]
  69. Rodríguez Sousa, A.A.; Barandica, J.M.; Rescia, A. Ecological and Economic Sustainability in Olive Groves with Different Irrigation Management and Levels of Erosion: A Case Study. Sustainability 2019, 11, 4681. [Google Scholar] [CrossRef] [Green Version]
  70. Belletti, G.; Marescotti, A.; Sanz-Cañada, J.; Vakoufaris, H. Linking protection of geographical indications to the environment: Evidence from the European Union olive-oil sector. Land Use Policy 2015, 48, 94–106. [Google Scholar] [CrossRef]
  71. Pleguezuelo, C.R.R.; Zuazo, V.H.D.; Martínez, J.R.F.; Peinado, F.J.M.; Martín, F.M.; Tejero, I.F.G. Organic olive farming in Andalusia, Spain. A review. Agron. Sustain. Dev. 2018, 38, 20. [Google Scholar] [CrossRef] [Green Version]
  72. Qiu, K.; Xie, Y.; Xu, D.; Pott, R. Ecosystem functions including soil organic carbon, total 473 nitrogen and available potassium are crucial for vegetation recovery. Sci. Rep. 2018, 8, 7607. [Google Scholar] [CrossRef]
  73. Expósito, A.; Berbel, J. Sustainability implications of deficit irrigation in a mature water economy: A case study in southern Spain. Sustainability 2017, 9, 1144. [Google Scholar] [CrossRef] [Green Version]
  74. García-Ruiz, J.M. The effects of land use on soil erosion in Spain: A review. Catena 2010, 81, 1–11. [Google Scholar] [CrossRef]
  75. Hobbs, P.R.; Sayre, K.; Gupta, R. The role of conservation agriculture in sustainable agriculture. Philos. Trans. R. Soc. B Biol. Sci. 2007, 363, 543–555. [Google Scholar] [CrossRef]
  76. Chartzoulakis, K.; Bertaki, M. Sustainable water management in agriculture under climate change. Agric. Sci. Proc. 2015, 4, 88–98. [Google Scholar] [CrossRef] [Green Version]
  77. Bashagaluke, J.B.; Logah, V.; Opoku, A.; Sarkodie-Addo, J.; Quansah, C. Soil nutrient loss through erosion: Impact of different cropping systems and soil amendments in Ghana. PLoS ONE 2018, 13, e0208250. [Google Scholar] [CrossRef] [PubMed] [Green Version]
Figure 1. Location of the olive-growing regions corresponding to the main Protected Designations of Origin (PDOs) of extra virgin olive oil present in Andalusia (Spain). The photograph corresponds to the case study of Estepa PDO (Seville, Andalusia).
Agronomy 09 00785 g001
Figure 2. Maps corresponding to the olive-growing regions and Protected Designations of Origin of extra virgin olive oil of Estepa showing the different management types considered (a), erosion levels (b), and the sampling plots of soil for each erosion level and type of agricultural management (c).
Agronomy 09 00785 g002
Figure 3. Minimum and maximum Soil Loss Tolerance Index (SLTI) for the considered erosion levels in each Protected Designation of Origin (PDOs) of olive oil evaluated. Erosion levels are: Minimum, low, medium, and maximum erosion. When a single value is displayed, it is the mean value or maximum value (minimum value was null) of SLTI depending on its depth (D SLTI). In the case of BA (Baena), the values shown correspond to its two soil types. The rest of the PDOs are: SCA (Sierra de Cádiz); AN (Antequera); MA (Montoro-Adamuz); PR (Priego); LU (Lucena); PG (Poniente de Granada); MG (Montes de Granada); SCZ (Sierra de Cazorla); SS (Sierra de Segura); SM (Sierra Mágina); ES (Estepa). Each mark on the trendlines represents the time projections considered: 1, 10, 25, 50, and 150 years.
Agronomy 09 00785 g003
Table 1. Soil data corresponding to each Protected Denomination of Origin (PDO) evaluated. It is specified the altitude in meters above sea level (m.a.s.l.) and mean annual precipitation in millimeters; predominant substrate type (S); depth of soil (D); depth of soil used in the Soil Loss Tolerance Index (SLTI) estimations (D SLTI); mean dry bulk density of soil (DBD); equivalence of 1 t of soil (Eq); and soil formed (SF). Units of factors are between brackets.
PDOs (Altitude/Precipitation)SD (cm)D SLTI (cm)DBD (g cm−3)Eq (mm)SF (mm year−1)
SCA (500/600)Limestone80601.210.080.10
AN (450–600/200–800)Limestone80601.160.090.01
BA (400–600/600–800)Limestone100801.360.070.01
Loam1201000.10
MA (400–500/600–700)Granite30–12010–1001.210.080.10
PR (1000/200–800)Limestone100801.520.070.01
LU (400–800/200–800)Limestone100801.360.070.01
PG (500–1100/250–800)Calcareous20–1700–1501.210.080.01
MG (750–1200/400–600)Calcareous20–1700–1501.160.090.01
SCZ (800/600)Limestone80601.680.060.01
SS (900/500–700)Limestone100801.520.070.01
SM (850–1000/500–800)Limestone30–8010–601.680.060.01
ES (200–800/400–500)Limestone30–15010–1301.360.070.01
Table 2. Estimation of annual soil loss rates (A) for integrated and ecological management of olive groves present in the Estepa region. Units of factors R and K are in parentheses. The LS, C and P factors are dimensionless (LS factor is also expressed as a percentage).
Management TypeErosion LevelFactorsA (t ha−1 year−1)
R (J ha−1)K (Mg J−1)LSCP
IntegratedNull109.70.820.00 (0%)0.161-
Slight109.70.890.18 (3%)0.1612.81
Moderate109.70.560.70 (7%)0.1616.88
Severe109.70.952.20 (15%)0.16136.68
EcologicalNull109.70.820.00 (0%)0.061-
Moderate109.70.560.70 (7%)0.0612.58
Table 3. Granulometric composition of each treatment evaluated in Estepa PDO. The mean values and standard deviation (x ± SD), in percentage, of sands, silts, and clays is detailed, estimating additionally the texture of the corresponding sampled level.
ManagementIntegrated Olive GrovesEcological Olive Groves
RainfedIrrigationRainfed
Erosion LevelNullSlightModerateSevereModerateSevereNullModerate
Sands36.18 ± 0.1961.51 ± 0.0943.29 ± 0.0868.41 ± 0.0565.52 ± 0.1157.82 ± 0.0646.75 ± 0.0949.40 ± 0.07
Silts52.41 ± 0.0224.05 ± 0.1031.52 ± 0.0319.97 ± 0.0217.23 ± 0.0127.91 ± 0.0440.84 ± 0.0330.95 ± 0.01
Clays11.41 ± 0.1714.44 ± 0.0125.18 ± 0.0911.62 ± 0.0717.25 ± 0.1214.27 ± 0.0212.41 ± 0.0719.65 ± 0.06
Texturesilty-loamsandy-loamloamsandy-loamsandy-loamsandy-loamloamloam
Table 4. Mean values and standard deviation, where possible (x ± SD), of the edaphic variables measured, specifying their abbreviation and unit, for the different management types and levels of erosion. Also shown are the rescaled and sufficiency values (dimensionless) of the corresponding variables used to calibrate the Adapted Soil Loss Tolerance Index for Olive Groves (SLTIog) and Soil Productivity Index (SPI).
Variable (Abbreviation, unit)Integrated Olive GrovesEcological Olive Groves
RainfedIrrigationRainfed
Null ErosionSlight ErosionModerate ErosionSevere ErosionModerate ErosionSevere ErosionNull ErosionModerate Erosion
Dry bulk density (DBD, g cm−3)1.11 ± 0.011.12 ± 0.021.20 ± 0.021.34 ± 0.011.38 ± 0.011.44 ± 0.011.05 ± 0.021.14 ± 0.03
Soil depth (D, cm)141.70 ± 3.00124.30 ± 1.70109.50 ± 1.8769.20 ± 1.5980.81 ± 0.8757.20 ± 0.66154.03 ± 1.12119.70 ± 1.01
Soil weight (W, t ha−1)15,728.70 ± 541.6013,921.60 ± 112.7513,140.00 ± 315.719272.80 ± 266.1811,151.78 ± 150.468236.80 ± 136.8116,173.15 ± 322.1913,645.80 ± 154.37
Equivalence 1 t soil (Eq, mm)0.090.090.080.070.070.070.090.09
Clays (Cl, %)11.41 ± 0.1714.44 ± 0.0125.18 ± 0.0911.62 ± 0.0717.25 ± 0.1214.27 ± 0.0212.41 ± 0.0819.65 ± 0.10
Porosity (Por, %)68.33 ± 0.7762.58 ± 0.0360.04 ± 0.8159.83 ± 0.0658.64 ± 0.0155.41 ± 0.0668.96 ± 0.1766.05 ± 0.12
Moisture (M, %)35.10 ± 0.3531.03 ± 0.0225.30 ± 0.0622.38 ± 0.0141.12 ± 0.2634.27 ± 0.0424.73 ± 0.2123.42 ± 0.17
pH (---)8.55 ± 0.038.27 ± 0.018.18 ± 0.017.90 ± 0.028.16 ± 0.027.85 ± 0.018.60 ± 0.028.21 ± 0.02
Gravel (G, %)11.28 ± 0.427.25 ± 0.043.71 ± 0.060.22 ± 0.010.36 ± 0.020.00 ± 0.0015.73 ± 0.534.06 ± 0.08
Organic matter (OM, %)3.70 ± 0.082.90 ± 0.022.54 ± 0.021.39 ± 0.012.08 ± 0.021.06 ± 0.033.91 ± 0.052.67 ± 0.03
Potassium (K, mg kg−1)84.47 ± 1.4282.64 ± 0.4571.80 ± 0.4956.05 ± 0.7673.18 ± 0.8467.53 ± 0.71168.58 ± 3.48161.32 ± 2.64
Normalized Porosity (nPor, ---)0.990.910.870.870.850.801.000.96
Normalized Gravel (nG, ---)0.720.460.240.010.020.001.000.26
Normalized Organic matter (nOM, ---)0.950.740.650.360.530.271.000.68
Sufficiency Clays (SCl, ---)0.570.711.000.580.860.710.620.98
Sufficiency Moisture (SM, ---)1.001.001.001.001.001.001.001.00
Sufficiency pH (SpH, ---)0.750.750.750.770.750.770.750.75
Sufficiency Organic matter (SOM, ---)0.920.630.630.350.520.260.980.67
Sufficiency Potassium (SK, ---)0.500.490.420.330.430.400.990.95
Table 5. Main calibration parameters corresponding to the linear regression defining the normalized erosion retardation factor (nERF). Significance values are: very significant (<0.01 **); highly significant (<0.001 ***).
InterceptNormalized Variables
GravelPorosityOrganic Matter
Coefficientα1.050β1.252γ0.373δ−2.623
Standard error-0.1170.1050.143
Significance-<0.001 ***0.001 **<0.001 ***
Table 6. Time estimation of the Soil Loss Tolerance Index (SLTI), the Soil Loss Tolerance Index for Olive Groves (SLTIog), and Soil Productivity Index (SPI) for each agricultural management and erosion level in Estepa PDO. If in any of the simulated times, the value of any of the indices is zero (0), it is considered to be an unsustainable situation (US).
ErosionT simSLTISLTIogSPI
t ha−1 year−1yearst ha−1 year−1mm year−1t ha−1 year−1mm year−1
IntegratedRainfed0.001135.0912.16135.0912.160.19
10135.1012.16135.1012.160.19
25135.1112.16135.1112.160.19
50135.1412.16135.1412.160.19
150135.2512.17135.2512.170.19
2.811116.7910.51116.7910.510.14
10116.5510.49116.5710.490.14
25116.1410.45116.2010.460.14
50115.4710.39115.5810.400.13
150112.7710.15113.1210.180.13
6.881107.338.59107.338.590.15
10106.728.54106.758.540.15
25105.718.46105.768.460.15
50104.028.32104.138.330.15
15097.267.7897.587.810.14
36.68165.564.5965.574.590.02
1062.274.3662.374.370.02
2556.793.9857.033.990.02
5047.663.3448.133.370.02
15011.110.7812.520.880.01
Irrigated6.88183.855.8783.855.870.09
1083.245.8383.285.830.09
2582.235.7682.315.760.08
5080.555.6480.715.650.08
15073.805.1774.295.200.08
36.68153.203.7253.213.720.02
1049.913.4950.023.500.02
2544.433.1144.713.130.02
5035.302.4735.852.510.01
150USUS0.410.03US
EcologicalRainfed0.001140.7312.67140.7312.670.45
10140.7412.67140.7412.670.45
25140.7612.67140.7612.670.45
50140.7812.67140.7812.670.45
150140.8912.68140.8912.680.45
2.581113.6310.23113.6410.230.38
10113.4110.21113.4410.210.38
25113.0410.17113.1110.180.37
50112.4310.12112.5710.130.37
150109.969.90110.389.930.36

