Mass Selection for Reduced Deoxynivalenol Concentration Using an Optical Sorter in SRW Wheat

1
Department of Plant and Soil Science, University of Kentucky, 1405 Veterans Drive, Lexington, KY 40546, USA
2
Department of Plant Pathology, University of Minnesota, St. Paul, MN 55108, USA
*
Author to whom correspondence should be addressed.
Agronomy 2019, 9(12), 816; https://0-doi-org.brum.beds.ac.uk/10.3390/agronomy9120816
Submission received: 30 October 2019
/
Revised: 18 November 2019
/
Accepted: 26 November 2019
/
Published: 28 November 2019
(This article belongs to the Special Issue Wheat Breeding: Procedures and Strategies)
Abstract
:Fusarium head blight (FHB) of wheat (Triticum aestivum L.) results in discolored Fusarium damaged kernels (FDK) contaminated with deoxynivalenol (DON). DON accumulation, a primary measure of FHB resistance, can be used as a basis for selection, but testing each genotype in several genetically variable populations is expensive and time-consuming. Therefore, FHB resistance breeding decisions are routinely based on in-field phenotypic evaluation. However, using an optical sorter as an alternative to in-field evaluation, mass selection (MS) for FHB resistance can be quickly performed post-harvest. The objective of this study was to utilize an optical seed sorter to select breeding lines with enhanced FHB resistance (lower DON and FDK values). Three hundred F4 derived breeding lines were grown in an inoculated disease nursery over several years in Lexington, KY. Grain from each breeding line was sorted using an optical seed sorter calibrated to reject scabby (discolored) seed. The accepted (non-scabby) seed was used to plant subsequent generations. DON and kernel damage traits were lowered each cycle of line selection with the optical sorter. Our findings suggest that optically sorting grain may be an effective breeding strategy for lowering DON accumulation and limiting kernel damage associated with FHB.
1. Introduction
Wheat (Triticum aestivum L.), one of the most important calorie sources available to humankind, provides approximately 19% of daily caloric needs worldwide [1]. Furthermore, according to the Foreign Agricultural Service (FAS) a division of the United States Department of Agriculture (USDA), global consumption of wheat was over 730,000,000 metric tons in the 2018/19 marketing year [2]. The demand for wheat and other staple foods is expected to increase as the global population continues to rise. For example, wheat demand is projected to increase by 60% by the year 2050 in developing countries [1]. In addition to increasing production in a sustainable way to meet the growing demand for wheat, preventing contamination and other grain quality and food safety issues caused by diseases are among the most daunting challenges facing agricultural researchers today.
Head scab or Fusarium head blight (FHB) of wheat, caused by Fusarium graminearum, is an example of such a disease. It results in damaged discolored grain contaminated with deoxynivalenol (DON), often referred to as vomitoxin, due to the acute and chronic disease symptoms that develop after consumption of diseased grain. DON toxicity symptoms include nausea, vomiting, diarrhea, abdominal pain, headache, dizziness, fever, and with enough exposure, death [3]. As a result, health organizations around the world have placed stringent regulations on DON levels in wheat products for both direct human consumption and feedstock sources for animals [4,5]. In the US, according to Aakre et al., 2005, the current FDA advisory levels for DON are: 1 ppm in finished wheat products for direct human consumption such as flour, 10–30 ppm in feedstock for consumption by ruminating animals, 10 ppm for chicken feedstock with an additional recommendation that it makes up no more than 50% of the diet, 5 ppm in swine feed and no more than 20% of the diet, and 5 ppm in all other animal feed produced from wheat grain or grain by-products and no more than 40% of the animal’s total diet [5]. In addition to DON contamination, yield reduction and quality diminution are other consequences of severe FHB infection [6,7]. Diseased kernels are less dense than healthy kernels and directly reduce yield. Furthermore, severely damaged kernels are expelled along with chaff during combine harvest resulting in additional yield loss [6,7,8]. Damaged kernels also decrease market value due to reduced test weight and flour yield [9]. Therefore, limiting DON accumulation and reducing the proportion of fusarium damaged kernels (FDK) via genetic resistance are major goals of wheat and other small grain breeders.
DON concentration can be quantified and used as a basis for selection, but testing each genotype in several genetically variable populations is expensive and time-consuming. Thus, plant breeders focused on enhancing FHB resistance in early generation material have traditionally relied on their eyes (extensive in-season field phenotyping-based decisions). Small grain breeders often utilize visual selection schemes such as the pedigree method, the bulk method, and mass selection, to generate improved plant cultivars. Mass selection, an antediluvian, but still extensively used breeding scheme, has been employed in breeding for enhanced disease resistance for many years. Rex Bernardo formally defines mass selection, in Essentials of Plant Breeding, as the “selection of several to a large number of plants on the basis of individual-plant performance” [10]. Furthermore, mass selection is a simple method that exposes a segregating population to different environmental conditions and utilizes intense natural, and/or artificial selection pressure to alter the genotypic frequencies of a population [11]. Deliberately infecting a field with F. graminearum and only harvesting plants that show no signs or symptoms of FHB would be an extreme example of mass selection. Therefore, in theory, mass selection relies on the assumption that only progeny from superior individuals will be present in the next generation. In addition, it is important to note that mass selection is most effective when dealing with a highly heritable trait, improving more complicated traits like yield are not typically goals for the mass selection method [10].
Unfortunately, FHB resistance in wheat is a complex quantitative trait, strongly influenced by the environment, with low to moderate heritability [12]. Consequently, phenotypic mass selection for enhanced head scab resistance done visually is subjective, and effectiveness can vary widely depending on the experience level of the person recording the ratings, disease pressure, natural lighting, maturity level of the plant, and other environmental factors. This is not to say that wheat breeders have been unsuccessful at using phenotypic selection to develop cultivars more resistant to head scab. Wheat breeders have identified and incorporated single QTL, like Fhb1 a major effect gene discovered in the Chinese spring wheat Sumai 3 [8,13], via traditional methods into breeding material. However, resistance to FHB employs both-well studied major genes and other minor genes. Although traditional breeding methods that center around known individual QTL have proven useful in breeding for increased FHB resistance in wheat, these methods can be improved to provide more locally adapted wheat cultivars. Therefore, a scheme that eliminates the inherent subjectivity of the visual selection method and increases the frequency of minor effect QTL is necessary.
Not only is FHB resistance a difficult trait to visually phenotype and select for, but a changing climate will also further complicate things by expediting the need for new cultivars more resistant and adapted to a wider array of environments than those currently available [14]. For example, a European study aimed at predicting wheat phenology and DON indicated that climate change will cause plants to flower and reach maturity 1 to 2 weeks earlier, and DON concentrations will increase up to 3x what is currently considered typical in the regions where the study was conducted [15]. In addition, Backhouse et al. using a modeling approach, found a positive correlation between climate and pathogenic Fusarium species and predicted that future conditions will be conducive for FHB epidemics in regions such as Mexico, North Africa, and Western Siberia where high DON and FDK are not currently a problem [16]. Furthermore, the genetic composition of current varieties provides partial resistance to FHB. However, environmental conditions largely influence whether or not resistance genes will be expressed [17]. Therefore, a higher-throughput less subjective selection method is needed to gradually accumulate new regional smaller effect resistance QTL, and more rapidly enhance head scab resistance in wheat and other small grains [18].
Optically separating diseased from non-diseased grain has potential as an en masse selection method to identify and enhance resistance in genetically variable populations. In addition, small breeding programs can use the proportion of damaged kernels obtained by optically sorting grain (FDKos) as an additional consideration during germplasm development (selecting parent breeding material with enhanced head scab resistance). The objective of this study was to determine if optically sorting seed from breeding material segregating visually for scab resistance over several generations could be used to generate lines with enhanced FHB resistance (lower DON and FDK values). Three-hundred F4 derived breeding lines from five unique 3-way crosses were grown in an inoculated disease nursery, harvested by hand, threshed, sorted, and the accepted (non-scabby) seed used to plant the subsequent filial generation over several years in Lexington, KY.
2. Materials and Methods
2.1. Site Description, Selection Material, and Experimental Design
The study was conducted from 2016–2019 at the University of Kentucky Spindletop Research Farm in Lexington, KY (38°7′37.81″ N, 84°29′44.85″ W). Soil type at the site is a Maury silt loam (fine, mixed, semi-active, mesic Typic Paleudalfs). Maximum, minimum and average temperatures for each harvest year are as follows: 2016 (23, −1, and 11 °C), 2017 (22, 4, and 11 °C), 2018 (24, −2, and 10 °C), 2019 (22, 1, and 10 °C). The selection material consisted of 300 genetically variable F4 derived soft red winter wheat (SRWW) breeding lines generated from five unique three-way crosses with KY06C-11-3-10 (a University of Kentucky breeding line with three FHB resistance QTL) in their pedigree (Table 1). The 300 breeding lines (60 from each of five crosses) differed in characteristics such as level of FHB resistance, heading date, height, and other agronomic traits.
Selection with the optical sorter was conducted from 2016 to 2018 at Spindletop Research Farm in 1 m rows spaced 30 cm apart arranged in a randomized complete block design (RCBD) with one resistant (KY02C-3005-25) and one susceptible (Pioneer Variety 2555) check cultivar repeated throughout the nursery. Cycles of selection 1, 2, and 3 (C1, C2, C3) were evaluated collectively in 2019 at the same location using 1 m six-row mini-plots arranged in a randomized complete block design (RCBD) with one resistant and one susceptible check repeated throughout the field. Three replications per genotype were evaluated in 2018 whereas two replications were used in all other years.
Selection and final evaluation were carried out in an inoculated and irrigated scab nursery to provide the intense disease pressure needed for resistance evaluation and artificial selection. During all years of the experiment (2016–2019), corn (Zea mays L.) kernels infected with F. graminearum were broadcast throughout the nursery to promote infection [19,20]. Inoculum came from 27 isolates taken from scabby wheat seed collected at multiple locations across Kentucky, 2007–2010 [21]. The inoculum was prepared by first allowing dry corn kernels to imbibe water for approximately 16 h. After 16 h, corn kernels were autoclaved, inoculated with potato dextrose agar (PDA) plugs infected with F. graminearum, mixed with 0.2 g of streptomycin in 50 mL of sterile water, covered and allowed to incubate at room temperature [20]. After complete colonization by the fungus (3 weeks), the corn kernels were spread onto a tarp and allowed to dry aided by a dehumidifier. After drying, inoculated corn kernels were placed in mesh bags and stored in a freezer at −18 °C. Each year of the study (2016–2019), at the end of tillering, approximately 21 days prior to flowering of the earliest material (lowest days to heading (DTH) value), inoculated corn kernels were broadcast in the field at a rate of 11.86 g m−2. In addition to inoculating the field, an overhead irrigation system on an automatic timer was used to provide optimal moisture conditions for disease development, and the opportunity to evaluate and select for FHB resistance. The irrigation schedule was as follows: 5 min periods every 15 min from 2000 to 2045 h, 2100 to 2145 h, 0200 to 0245 h, 0500 to 0530 h, and 0830 h [20].
2.2. Phenotypic Measurements
Data collection started in 2016 and spanned multiple growing seasons. Plant height (HT), (DTH), rating, Fusarium damaged kernels determined using a vacuum sorter (FDKvs), and DON accumulation data were collected each season. Fusarium damaged kernels determined using an optical sorter (FDKos) were collected in all years except 2016. HT is the approximate average height, in cm, of all plants in a plot from soil to top of the spike. DTH is the number of days from January 1st to the calendar date corresponding to the day 50% of heads in a plot have emerged. Rating is a visual estimate of the proportion of diseased heads in a plot from 0–9, where 0 = no heads showing disease symptoms and 9 = 90% of heads showing disease symptoms. Rating data is collected 24 days after the day 50% of heads in a plot have emerged (45 days after inoculation for the earliest material, greater than 45 days after inoculation for later material). FDKvs is the proportion of Fusarium damaged kernels in a given sample determined using an air separation sorter. DON is the concentration of deoxynivalenol in ppm determined using gas chromatography with mass spectrometry GC-MS. FDKos is the proportion of Fusarium damaged kernels in a given sample determined using an optical seed sorter.
2.3. FDKvs and DON Determination
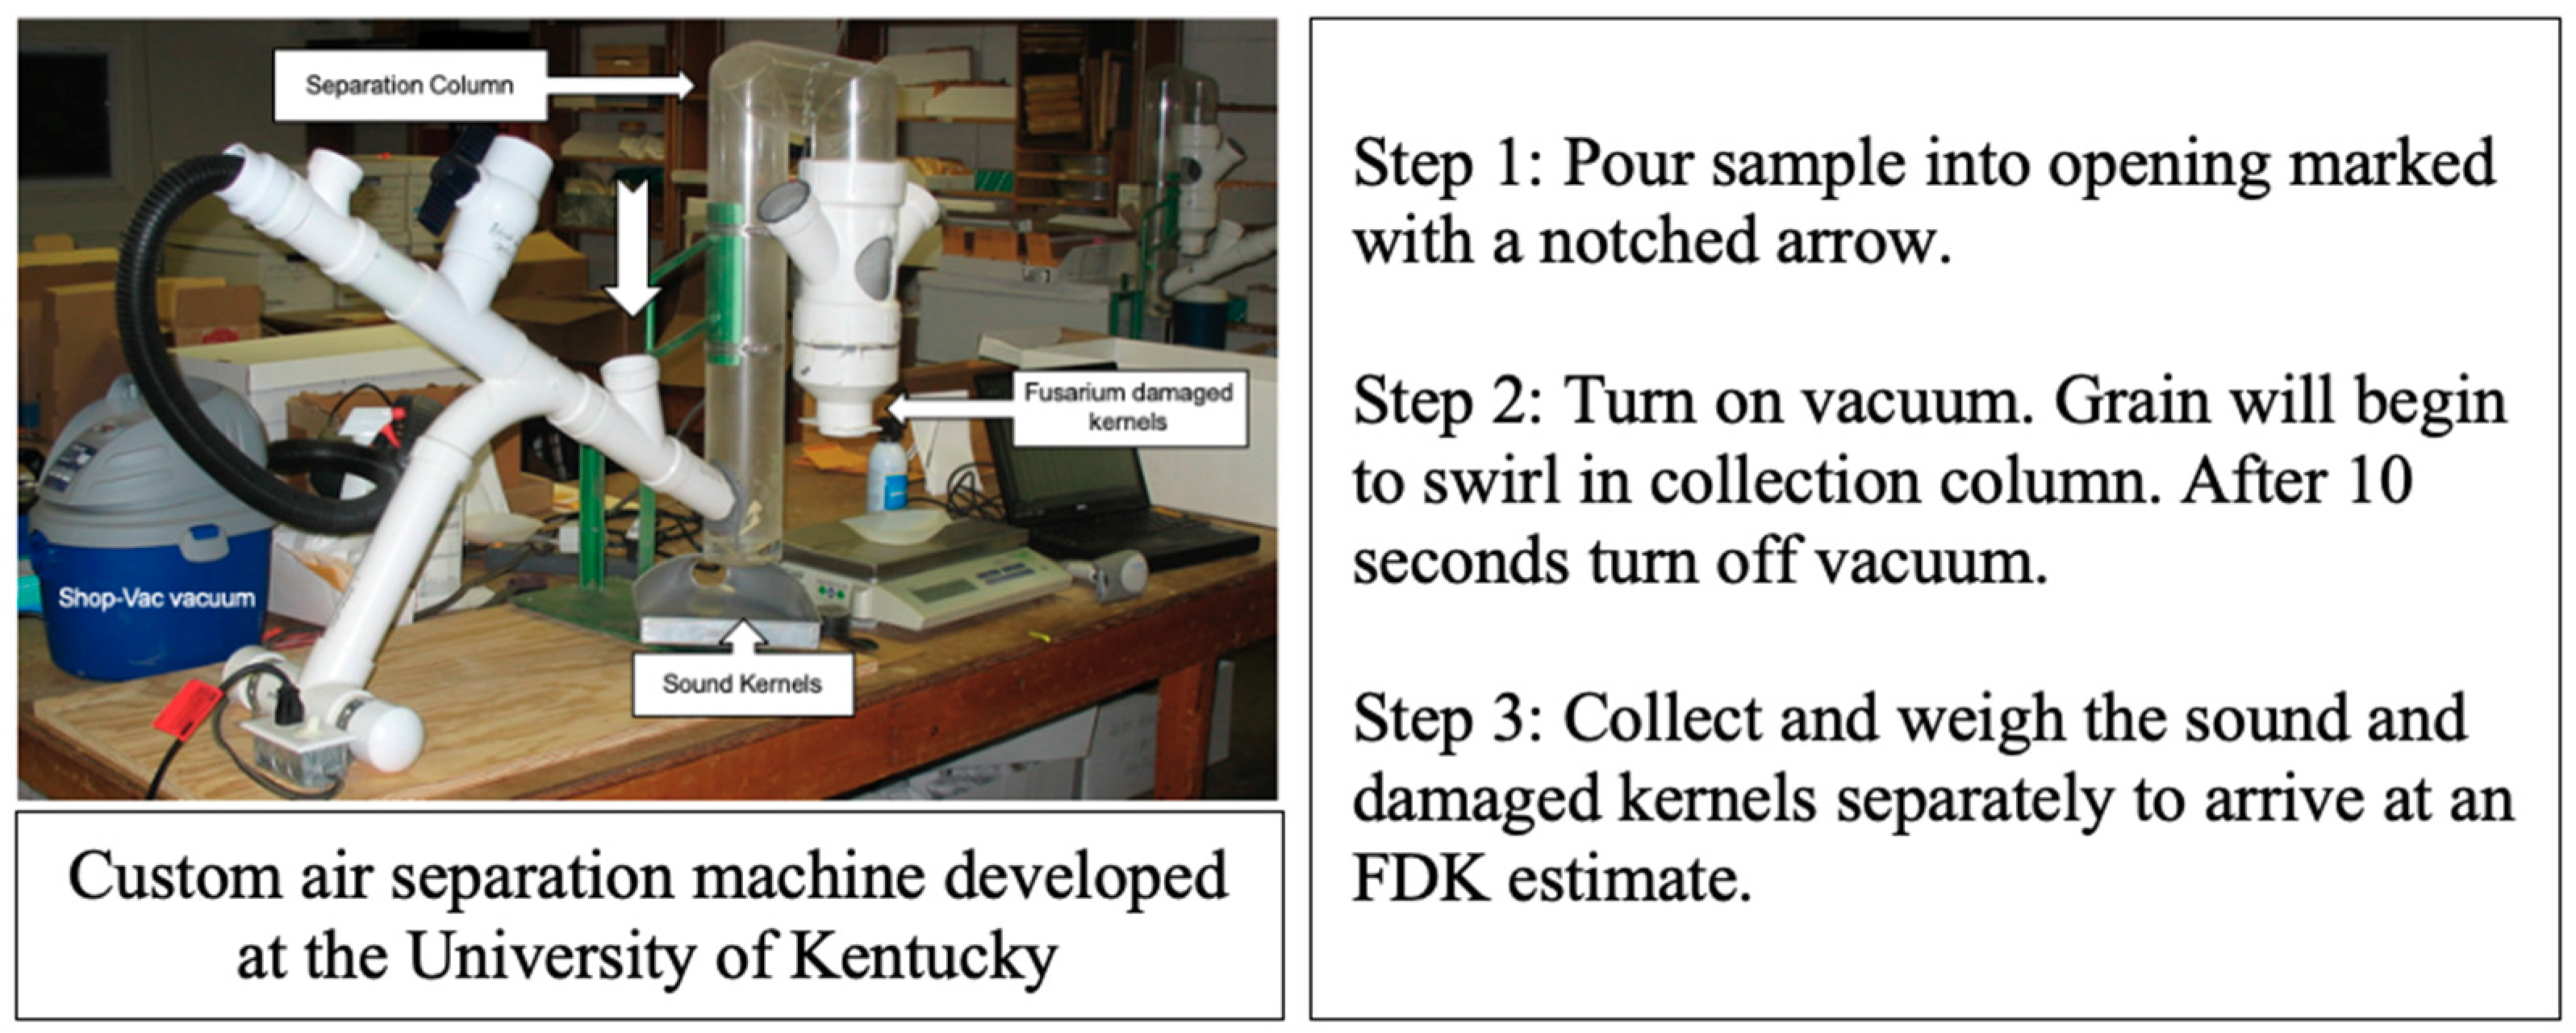
From 2016–2018, each 1-m nursery row was hand-harvested with sickles and all plants in each row were bundled together to avoid mixing breeding lines. Each bundle was threshed separately with a stationary threshing machine. The six-row mini-plots used in 2019 were mechanically harvested with a Hege plot combine. Forty-five gram samples were taken from each line each season and chaff was removed manually. FDKvs was determined for each sample using an air separation machine developed by the University of Kentucky from a precision machine head thresher and a Shop-Vac vacuum (Figure 1) [6,7]. Air separation and FDKvs determination took approximately 1 min per sample and comprised the following procedure: a sample was loaded into the machine, the vacuum was turned on and air-driven elevation of the lighter portion of grain (i.e., Fusarium damaged kernels) occurred until it reached the top of the separation column where it was collected in a receptacle. The heavier portion of grain (i.e., sound kernels) was suspended midair and did not reach the top of the separation column. Once the vacuum was turned off, the sound kernels fell and were collected at the bottom of the column. The sound kernels and damaged kernels were weighed (g) separately, and an FDKvs value was arrived at using the following formula:
FDKvs (%) = (damaged kernels/(damaged + sound kernels)) × 100
The damaged and sound portions of each sample were then comingled and sent in coin envelopes to the University of Minnesota DON testing lab, where DON concentration was determined by gas chromatography with mass spectrometry (GC-MS) following Mirocha et al., 1998 [22].
2.4. The Optical Sorter, within Line Selection, and FDKos Determination
The optical sorter is a USDA/Agricultural Research Service (ARS) and National Manufacturing Seed Sorter System (Figure 2) that uses a high-throughput, high-resolution color camera in combination with compressed air to separate grain [23,24,25,26]. The device recognizes undesirable seeds based on color and generates a burst of air to cast discolored seeds into a collection vessel. Kernels that are deemed as acceptable accumulate in another separate collection vessel. Each cycle of selection was performed in a different year, therefore, the sorter was calibrated each year. The sorter was trained to reject scabby seeds using 201 seeds from the susceptible check (white kernels), and to accept sound kernels using 201 seeds from the resistant check (red kernels).
During within line selection (2016–2018), each 1 m row was hand-harvested with sickles and all plants in each row were bundled together to avoid mixing. Each bundle was threshed separately using a stationary threshing machine, and seeds from all plants in the bundle were collected in bulk and optically sorted. For final evaluation (2019), six-row mini-plots were mechanically harvested with a Hege plot combine. Prior to sorting (2016–2019), 45 g samples to be used for FDKvs and DON determination were taken from each line and rep. After sorting, accepted grain from each rep for each line was comingled, sampled and then used to plant the subsequent filial generation. During the 2017–2019 growing seasons, the optically accepted and rejected portions of grain from each sample were weighed separately (g) and another estimation of the proportion of damaged kernels (FDKos) was arrived at using the following formula
FDKos (%) = (rejected grain/(rejected + accepted grain)) × 100.
2.5. Among Line Selection
During the selection portion of the experiment, all lines were advanced to the next generation after sorting (within line selection). This allowed us to retroactively evaluate the consequences of different among line selection schemes based on phenotypic data obtained with the optical sorter and other phenotypic measurements routine in wheat breeding. In 2019, cycles 1, 2, and 3 from 54 of the 300 F4 derived lines were evaluated in an inoculated and irrigated head scab nursery. The lines evaluated in 2019 were chosen because there was enough remnant seed from previous cycles of selection (C1–C3) to allow all three generations to be planted collectively as six-row mini-plots in the head scab nursery. In addition to within line selection, among line selection was performed using phenotypic measurements obtained with the optical sorter (FDKos), DON, FDKvs, and an index based on DON and FDKos were also used to guide among line selection (Figure 3). For line selection, candidates that had values greater than the resistant check (KY02C-3005-25), for whatever trait used as the basis of selection, are dropped each cycle of selection. Using FDKos as an example, any lines that had FDKos values greater than KY02C-3005-25 were not selected.
2.6. Data Analysis
Analysis of variance (ANOVA) was performed using SAS Procedure GLM to determine population and selection cycle effects. The model used to analyze data collected from 2016–2018 was:
where Yijk = the observation in the ith year in the jth rep of the kth breeding population/line, µ = the overall mean, Yeari = the effect of the ith year, Repj = the effect of the jth replication within the ith year, Genotypek = the effect of the kth breeding population/line, Yeari × Populationk = the effect of the interaction of the ith year and the kth breeding population/line, εijk = the residual error. Since each year represents a different cycle of selection, it is necessary to nest replications in the year. The model used to analyze the final evaluation data collected in 2019 was:
where Yijk = the observation in the ith cycle in the jth rep of the kth breeding population/line, µ = the overall mean, Cyclei = the effect of the ith selection cycle, Repj = the effect of the jth replication, Genotypek = the effect of the kth breeding population/line, Cyclei × Genotypek = the effect of the interaction of the ith selection cycle and the kth breeding population/line, εijk = the residual error. Since all data were collected (all selection cycles were evaluated) in the same year, it is not necessary to nest replications in cycle.
Yijk = µ + Yeari + Rep(Year)ij + Genotypek + Yeari × Genotypek + εijk
Yijk = µ + Cyclei + Repj + Genotypek + Cyclei × Genotypek + εijk
Genotypic and phenotypic variance components were estimated from the expected mean squares (EMS) generated using SAS Procedure VARCOMP, and then used to determine the heritability of the phenotypic traits measured on an entry mean basis. Heritability estimates were computed as:
where H2 = heritability, σ2g = genotypic variance, σ2p = phenotypic variance. Confidence intervals were calculated after Knapp et al., 1985, as:
where UL = upper limit, LL = lower limit, MS1 = entry mean square, MS2 = residual mean square, FUL and FLL = F value for the upper and lower limits, respectively [27]. Broad sense heritability of the traits measured from 2016–2018 was estimated on an entry mean basis using the following model:
where Yijk = the observation in the ith year, jth replication, and kth genotype, µ = the overall mean, Yeari = the effect of the ith year, Rep(Year)ij = the effect of the jth replication nested in the ith year, Genotypek = the effect of the kth genotype, Yeari × Genotypek = the effect of the interaction of the ith year and the kth genotype, εij = the residual error. Broad sense heritability of traits was estimated on an entry mean basis for each year individually using the following model:
where Yij = the observation in the ith rep and jth genotype, µ = the overall mean, Repi = the effect of the ith replication, Genotypej = the effect of the jth genotype, εij = the residual error. In addition, broad-sense heritability was calculated for each trait each cycle of selection using the same model.
H2 = σ2g/σ2p
UL = 1 − (MS1/MS2 × FUL (0.05, v1 and v2 df))−1
LL = 1 − (MS1/MS2 × FLL (0.95, v1 and v2 df))−1
Yijk = µ + Yeari + Rep(Year)ij + Genotypek + Yeari × Genotypek + εijk
Yij = µ + Repi + Genotypej + εij
3. Results
3.1. Mass Selection
Three cycles of within line mass selection using an optical sorter were conducted on a set of University of Kentucky soft red winter wheat breeding lines from 2016–2018. Cycles 1–3 were evaluated in 2019. No remnant seed from the base population (C0) was available, and therefore C0 was not grown in 2019. The results of within line and all among line selection strategies are presented (Table 2 and Table 3). Among line selection decisions for all scenarios were based on data obtained from 2016–2018. The results of the different selection strategies presented in Table 2. Table 3 is based on data obtained during the final evaluation (2019).
3.1.1. Within Line Selection with an Optical Sorter
Means for all traits measured by the cycle of selection are presented in Table 2. Within line selection with the optical sorter in the absence of any among line selection resulted in no significant change in DON concentration. DON was the primary target trait of this experiment. No response to within line selection is likely due to the type of material on which selection was performed. The selected candidates were F4 derived breeding lines and were in the F4:5 generation prior to any within line selection with the optical sorter. The material in an earlier generation may have shown more of a response to within line selection. Interestingly among line selection on FDKos was very successful (Table 2 and Table 3). FDKvs, DTH, and visual rating did not respond to within line selection with the optical sorter. FDKos decreased with each cycle of selection. HT increased slightly with selection. Average DON, FDKvs, and FDKos whenever expressed as a percentage of the resistant check (KY02C-3005-25) display the same trends as described above. DON % resistant check did not respond to within line selection, FDKvs % resistant check increased after one cycle and the decreased after an additional cycle of within line selection, and FDKos % resistant check decreased each cycle with a larger reduction from C2 to C3 (Table 3). Within line selection did not result in DON, FDKvs, or FDKos values expressed as a percentage of the resistant check below 100%.
3.1.2. Selection on FDKos
No among line selection was performed from C0 to C1, because FDKos was not recorded in 2016. From C1 to C2, and C2 to C3, any lines that had FDKos values greater than the resistant check were discarded. Within and among line selection with the optical sorter resulted in a net decrease in DON concentration each cycle (Table 2). Mean DON expressed as a percentage of the resistant check (KY02C-3005-25) showed a similar decrease with each cycle of selection, ending up at 92% for C3 (Table 3). This indicates that the average DON values for the C3 population outperform that of the resistant check used in the experiment. This is a promising result. FDKvs and FDKos also decreased with each cycle of selection, but neither trait fell below 100% of the resistant check. DTH showed no net change. Rating decreased from C1 to C2 but showed no further response. HT increased each cycle of selection.
3.1.3. Selection on FDKvs
Results of among line selection on FDKvs are shown in Table 2. From C0 to C1, C1 to C2, and C2 to C3, any lines that had FDKvs values greater than the resistant check were discarded. In 2016, all lines with FDKvs values greater than the check were dropped. This is why the C1 tested in 2019 based on FDKvs among line selection has a mean value of 0.6 and not 1.1 as had been observed for the previous two scenarios. Using FDKvs as the basis for line selection resulted in average C1 DON levels below, average C2 DON levels above, and average C3 DON levels below that of the resistant check (Table 3). Due to inconsistent response to selection, the results of line selection on FDKvs are less promising than the results of line selection on FDKos. Interestingly, using FDKvs as the basis of line selection actually resulted in a gradual increase in the trait with each cycle of selection. For example, FDKvs as % KY02C-3005-25 was 136 for C1, 164 for C2, and 204 for C3. The response to selection of FDKos was also inconsistent, the mean value increasing for one cycle and then falling from C2 to C3. DTH decreased by 1 day on average with each cycle of selection. The rating showed no net change. It is interesting that the lowest visual ratings and FDKos values were achieved by using FDKvs as the basis for line selection. HT showed no consistent response.
3.1.4. Selection on DON
From C0 to C1, C1 to C2, and C2 to C3, any lines that had DON values greater than the resistant check were discarded. In 2016, all lines with DON values greater than the check were dropped. This is why the C1 tested in 2019 based on DON among line selection has a mean value different than that observed for other scenarios. Results of among line selection on DON are shown in Table 2. Similar to what was observed for FDKvs selection, using DON as the basis of among line selection resulted in an increase in DON concentration from C1 to C2 and a decrease from C2 to C3. However, in the case of DON selection, mean DON values are below that of the resistant check (<100%) for each cycle evaluated in 2019 (Table 3). This indicates that using DON to select for lower DON concentrations in subsequent generations is effective. However, remember that basing selection on FDKos resulted in more consistent decreases in DON concentration, and other scab associated traits (FDKvs and FDKos). When basing selection on DON concentration, FDKvs increased from C1 to C2 and slightly decreased from C2 to C3. FDKos increased each cycle. DTH and visual ratings both increased after one cycle and then decreased from C2 to C3. Mean HT increased from C1 to C2 and showed no further response.
3.1.5. Selection on FDKos/DON Index
With index selection, decisions are based on the sum of the weighted performance of a candidate for each of several traits [10]. FDKos/DON index values were determined using the following formula:
Index = [(FDKos candidate/FDKos KY02C-3005-25) × 100] + [(DON candidate/DON KY02C-3005-25) × 100]
FDKos was not recorded in 2016, therefore, no among line selection was performed from C0 to C1. From C1 to C2, and C2 to C3, any lines that had index values greater than the resistant check (>200%) were discarded. Results of among line selection on the FDKos/DON index are shown in Table 2. DON response to among line selection on the index is very promising. DON concentration in ppm decreased consistently each cycle of selection. Mean DON as a percent of the resistant check also decreased consistently with each cycle of selection and was below 100% after one cycle (Table 3). In addition, both kernel damage traits (FDKvs and FDKos) decreased with each cycle of selection, although neither was below 100% on average for any cycle of selection evaluated in 2019. Seeing both traits consistently decrease is promising and indicates that using both DON concentration and FDKos in an index is more effective than using either trait alone as the basis for among line selection. DTH increased by 2 days on average from C1 to C2 and decreased by 1 day from C2 to C3. Visual rating decreased by 3 from C1 to C2 and showed no further response. HT increased with each cycle of selection.
3.2. Heritability
3.2.1. Heritability Estimates Using Data Gathered during within Line Selection (2016–2018)
Estimates of broad-sense heritability and confidence intervals (95%) are presented in Table 4. For traits measured from 2016–2018 heritability ranged from 0.70 to 0.89 (FDKos was not measured in 2016, H2 = 0.68). DTH and HT were the most heritable traits (H2 = 0.89 for both traits). Estimates of broad-sense heritability and confidence intervals (95%) for each cycle of selection are presented in Table 5. These estimates were based on individual analysis of years (2016 = C0, 2017 = C1, 2018 = C2). For traits measured in the base population (C0) heritability ranged from 0.74 to 0.91, with DTH being the most heritable. Heritability estimates ranged from 0.62 to 0.93 and 0.62 to 0.94 for C1 and C2, respectively. Previous studies have also shown DTH and HT to be highly heritable traits in soft red winter wheat [28]. Heritability estimates for DON from previous studies also agree with what we observed [29,30]. Our broad-sense heritability estimates for visual ratings are slightly higher than what has been previously reported in other studies [30]. Other wheat breeding groups estimate FDK and determine broad-sense heritability for the trait. The methods for FDK estimation are different than what we used for FDKvs and FDKos, but heritability of the trait is close to what we observed [31]. No traits had confidence intervals that enclosed zero and can be considered heritable.
3.2.2. Heritability Estimates Using Data Gathered during the Final Evaluation (2019)
Estimates of broad-sense heritability and confidence intervals (95%) are presented in Table 6. For traits measured on all three cycles of selection in 2019 heritability ranged from 0.80 to 0.97. DTH was the most heritable trait (H2 = 0.97). Estimates of broad-sense heritability and confidence intervals (95%) for each cycle of selection are presented in Table 7. Heritability estimates ranged from 0.50 to 0.95 for C1, with DTH and HT being the most heritable. Heritability estimates ranged from 0.64 to 0.92 for C2, with HT being the most heritable. Heritability estimates ranged from 0.48 to 0.92 for C3 with DTH being the most heritable. The heritability estimates we observed, except for rating, are in the range of other previously published heritability estimates [28,29,30,31]. Based on confidence intervals, all of the traits had heritability estimates significantly different from zero.
3.3. Phenotypic Variation
3.3.1. Phenotypic Variation Observed in Data Gathered during within Line Selection (2016–2018)
Three cycles of within line selection using an optical sorter were performed on a set of University of Kentucky soft red winter wheat breeding lines, with the first occurring in 2016, the second in 2017 and the third in 2018. DTH, rating, HT, FDKvs and DON concentration were measured on the base population in 2016. The same phenotypic measurements plus an additional trait, FDKos, were recorded in 2017 and 2018, respectively. Year, genotype and the year x genotype interaction had a significant (p < 0.05) effect on all traits measured (Table 8). There were significant differences among the genotypes for all traits evaluated.
On average, plants were earlier in 2017 (DTH = 115) than all other years (2016 = 127, 2018 = 132). The average plant height was significantly taller in 2017 (95 cm) and 2018 (95 cm) than in 2016 (81 cm). Visual scab rating significantly increased each year, from an average of 2 in 2016 to 4 and 5 in 2017 and 2018, respectively. FDKvs followed a similar trend to that observed for rating. FDKvs increased from 13.9 in 2016 to 18.8 in 2018. However, 2017 (18.8) and 2018 (18.8) were not significantly different. FDKos was not recorded in 2016 and increased significantly from 2017 (13.1) to 2018 (25.0). Therefore, arithmetically visual rating, FDKvs, and FDKos appear to agree with one another. However, mean DON values measured in parts per million were significantly greater in the first year (2016 = 12.6) than in the latter two years (2017 = 8.7, 2018 = 8.8). Means for all traits are presented in Table 8.
3.3.2. Phenotypic Variation Observed in Data Gathered during the Final Evaluation (2019)
Three cycles of within line selection using an optical sorter were conducted on a set of University of Kentucky soft red winter wheat breeding lines from 2016–2018. Cycles 1–3 were evaluated in 2019. DTH, rating, HT, FDKvs, FDKos and DON concentration were measured. Selection cycle had a significant (p < 0.05) effect on plant HT and FDKos (Table 9). Genotype had a significant effect on all traits measured (Table 9). There was a significant selection cycle by genotype interaction for all traits except visual rating and FDKvs (Table 9).
On average, there was no difference in earliness, visual rating, FDKvs or DON between cycles of selection. The average plant height for C1 was significantly (p < 0.05) lower than the other two cycles of selection evaluated in 2019. Mean FDKos for C3 (18.7) was significantly (p < 0.05) lower than the other two cycles of selection (C1 = 20.9, C2 = 20.7) evaluated in 2019. Means for all traits are presented in Table 9.
4. Discussion
One of the most important challenges of this century is to increase crop yields, in order to maintain access to essential food resources like wheat, under a changing climate [14]. Devastating plant diseases like FHB are major hurdles in the way of solving issues concerning food security, safety, and quality. Yield reduction, low test weight, reduced percentage of high and low molecular weight glutenins and mycotoxin contamination associated with FHB infection threaten food security, diminish food safety and reduce quality [6,7,8,9,32]. Furthermore, the consequences of FHB infection will likely be exacerbated by ongoing climate change [15,16]. This coupled with an ever-increasing global population has expedited the need for new germplasm more resistant to head scab. On the basis of the results of this study, it is our opinion that an optical seed sorter has potential to reduce DON accumulation and kernel damage. In this study, we tested the potential of an optical seed sorter as an en masse selection method to identify and enhance disease resistance, by exposing genetically variable breeding material to a head scab epidemic, optically separating diseased from non-diseased grain, and planting only non-diseased grain the subsequent filial generation.
We observed that within line selection with the optical sorter only (no among line selection) was not effective at lowering average DON accumulation in ppm, our primary target trait (Table 2). These results are not unexpected, considering the selection material was in the F4:5 generation prior to any within line selection with the optical sorter. Genetic variation, necessary for progress in plant breeding, is less within an F4 derived breeding line than, for example, an F2 population [33]. Had these breeding lines been F2 populations, or even F2 derived breeding lines more genetic, variation would have been available and greater within line selection progress (reductions in average DON accumulation each cycle) may have been observed. Indirect within line selection for lower DON with the optical sorter is not supported by the broad sense heritability values of DON (0.91 Table 6, 0.74 Table 4) and FDKos (0.94 Table 6, 0.68 Table 4). Falconer showed that for indirect selection to be superior to direct selection, the genetic correlation must be high and heritability of the trait to be selected must exceed that of the other trait [33]. Whenever phenotypic correlation is substituted for genotypic correlation, Q, the ratio of indirect to direct selection expressed as the product of the phenotypic correlation coefficient and the ratio of the square roots of the heritabilities can be calculated (e.g., Q = rp × h1/h2,, [33]). The phenotypic correlations (DON to FDKos) were 0.55 (2017–2018) and 0.31 (2019). Using data gathered during within line selection Q = 0.55 × (0.82/0.86) = 0.52, and, Q = 0.31 × (0.97/0.95) = 0.32 using data gathered during the final evaluation. Therefore, Q does not support indirect selection for lower DON with the optical sorter (FDKos).
Interestingly, whenever within line selection was coupled with among line selection on FDKos, consistent reductions in DON and kernel damage traits (FDKos and FDKvs) were observed (Table 2). Therefore, in practice, indirect among line selection using FDKos values obtained with the optical sorter successfully reduced DON accumulation each cycle of selection. Indirect selection (C3 DON = 0.7, C3 DON as % KY02C-3005-25 = 92) did not result in final DON concentrations below that of direct selection (C3 DON = 0.4, C3 DON as % KY02C-3005-25 = 53) using DON measurement (Table 2 and Table 3). This result agrees with our estimates of Q, which indicated that direct selection would be more successful than indirect selection on FDKos for lower DON. However, indirect selection using FDKos did consistently reduce DON each cycle of selection (C1 = 1.1, C2 = 0.9, C3 = 0.7), whereas direct selection did not consistently reduce DON each cycle of selection (C1 = 0.6, C2 = 0.7, C3 = 0.4). In addition, indirect selection for lower DON using FDKos as the basis of selection resulted in average DON levels below that of the resistant check and consistent reductions in kernel damage traits (FDKos and FDKvs). Direct selection using DON concentration actually resulted in increases in final average FDKvs and FDKos. Although indirect among line selection with the optical sorter did not result in final DON levels lower than direct selection, final DON levels obtained via indirect among line selection using FDKos were better than that of the resistant check. In addition, kernel damage traits were significantly lower than in previous generations. These findings indicate that the optical sorter is useful for identifying lines with lower DON values while at the same time selecting for lower kernel damage, which are both important traits for ensuring secure access to safe food. The reductions achieved in all three traits using the indirect selection on FDKos were not achieved with direct selection for a lower DON. Furthermore, although indirect within line selection is not supported by estimates of Q obtained in this experiment, performing indirect selection in early generation populations (e.g., F2) for lower DON with the optical sorter is supported by the results of among line selection on FDKos.
FDKvs another measure of kernel damage due to FHB infection in wheat was also used as the basis of indirect among line selection for lower DON. Indirect selection for lower DON using FDKvs determined with the vacuum sorter was not supported by the broad sense heritability values of DON (0.91 Table 6, 0.74 Table 4) and FDKvs (0.80 Table 6, 0.83 Table 4). The phenotypic correlations (DON to FDKvs) were 0.41 (2016–2018) and 0.41 (2019). Therefore, Q = 0.41 × (0.91/0.86) = 0.45 and Q = 0.41 × (0.89/0.95), both estimates are < 1 and do not support indirect selection (using FDKvs as the basis of selection) over direct selection for lower DON accumulation. Our data support this notion (Table 2). Neither indirect selection on FDKvs (C1 = 0.6, C2 = 1.0, C3 = 0.7) or direct selection (C1 = 0.6, C2 = 0.7, C3 = 0.4) consistently reduced DON each cycle of selection. Both selection schemes resulted in average C3 DON levels < 100% of KY02C-3005-25, but direct selection for lower DON (53% of KY02C-3005-25) outperformed indirect selection on FDKvs (92% of KY02C-3005-25). Interestingly, similar to what was observed with direct selection for lower DON, indirect selection on FDKvs resulted in increases in kernel damage traits. Indirect selection for lower DON on FDKvs actually increased FDKvs each cycle of selection, indicating that direct selection for lower FDKvs values does not work. FDKos increased during indirect selection on FDKvs for lower DON from C1 to C2 but then decreased from C2 to C3. These results indicate that single trait direct and indirect selection for lower DON is achievable using DON concentrations, FDKvs and FDKos estimates as the basis of selection, however, single trait indirect selection on FDKos lowers DON, FDKvs, and FDKos simultaneously. The other single trait selection procedures (direct on DON and indirect on FDKvs) do not achieve consistent reductions in both kernel damage traits.
In addition to direct and indirect selection on single traits, an index was created and used to base selection. Both direct selection and indirect selection on FDKos for lower DON achieved promising reductions in DON concentrations with each additional cycle of selection. However, each of the two single trait selection procedures (direct on DON and indirect on FDKos) were better than the other at lowering specific traits. Much lower average C3 DON levels were achieved with direct (0.4 ppm, 53% of KY02C-3005-25) than with indirect selection on FDKos (0.7 ppm, 92% of KY02C-3005-25). Kernel damage traits (FDKvs and FDKos) were lowered when using indirect among line selection on FDKos, whereas kernel damage increased with direct selection on DON. Therefore, we thought it logical to combine the two traits (FDKos and DON) in an index to attempt to lower DON at a level comparable to direct selection on DON concentrations while simultaneously lowering kernel damage traits to the degree observed with indirect selection on FDKos. Index selection was incredibly successful at lowering all three traits (DON, FDKvs, and FDKos) simultaneously (Table 2 and Table 3). Index selection achieved final FDKvs (3.3%, 132% of KY02C-3005-25) values lower than all other selection scenarios we explored. Final average C3 FDKos values (13.5%, 142% of KY02C-3005-25) achieved with the index were slightly lower than values obtained with direct selection for low FDKos (13.7%, 144% of KY02C-3005-25). In addition, index selection resulted in final average DON concentrations of 0.4 ppm, the same as what was observed for direct DON measurement.
These findings suggest that optically sorting grain is an effective breeding strategy for lowering final DON accumulation and limiting kernel damage associated with head scab infection. Average HT increased with additional cycles of sorter selection. This indicates that optically sorting grain to enhance head scab resistance may be most appropriate during pre-breeding (germplasm improvement) for FHB resistance, not improved agronomic characteristics. At a minimum, FDKos values obtained by optically sorting grain can be used as an additional criterion during germplasm development and when selecting parental breeding material with enhanced head scab resistance. In addition, FDKos estimates can be utilized in conjunction with direct DON measurement to form a very successful selection index that effectively lowers DON accumulation and associated kernel damage traits over generations. The optical sorter selection method described herein should provide small breeding programs focused on delivering FHB resistant germplasm with a useful tool to identify and select head scab resistance in wheat and other small grains.
Author Contributions
A.J.C. conceived the experiment and initiated the line derivation, W.J.C. implemented, modified and interpreted the experiments; W.J.C. analyzed the data and wrote the paper; Y.D. carried out the D.O.N. analysis and provided that data; D.A.V.S. assisted in data interpretation and edited the manuscript.
Funding
This work was funded by a grant from the U.S. Department of Agriculture, through the US Wheat and Barley Scab Initiative under Agreement No. 59-0206-9-054.
Acknowledgments
We thank John Conelley and Sandy Swanson for their technical support.
Conflicts of Interest
The authors declare no conflict of interest. The funders had no role in the design of the study; in the collection, analyses, or interpretation of data; in the writing of the manuscript, or in the decision to publish the results.
References
- Shiferaw, B.; Smale, M.; Braun, H.-J.; Duveiller, E.; Reynolds, M.; Muricho, G. Crops that feed the world 10. Past successes and future challenges to the role played by wheat in global food security. Food Secur. 2013, 5, 291–317. [Google Scholar] [CrossRef]
- USDA FAS. Grain: World Markets and Trade; USDA FAS: Washton, DC, USA, 2019.
- Sobrova, P.; Adam, V.; Vasatkova, A.; Beklova, M.; Zeman, L.; Kizek, R. Deoxynivalenol and its toxicity. Interdiscip. Toxicol. 2010, 3, 94–99. [Google Scholar] [CrossRef] [PubMed]
- Bai, G.; Shaner, G. Management and resistance in wheat and barley to fusarium head blight. Annu. Rev. Phytopathol. 2004, 42, 135–161. [Google Scholar] [CrossRef] [PubMed]
- Aakre, D.; Flaskerud, G.K.; Hellevang, K. DON (Vomitoxin) in Wheat: Basic Questions and Answers. 2005. Available online: https://library.ndsu.edu/bitstream/handle/10365/5430/pp1302.pdf (accessed on 30 October 2019).
- Agostinelli, A.M. Phenotypic and Genotypic Selection for Head Scab Resistance in Wheat. Master’s Thesis, University of Kentucky, Lexington, KY, USA, 2009. [Google Scholar]
- Agostinelli, A.M.; Clark, A.J.; Brown-Guedira, G.; Van Sanford, D.A. Optimizing phenotypic and genotypic selection for Fusarium head blight resistance in wheat. Euphytica 2011, 186, 115–126. [Google Scholar] [CrossRef]
- Bai, G.; Shaner, G. Scab of wheat: Prospects for control. Plant Dis. 1994, 78, 760–766. [Google Scholar] [CrossRef]
- McMullen, M.; Jones, J.; Gallenberg, D. Scab of Wheat and Barley: A Re-emerging Disease of Devestating Impact. Plant Dis. 1997, 81, 1340–1348. [Google Scholar] [CrossRef]
- Bernardo, R. Essentials of Plant Breeding; Stemma Press: New Delhi, India, 2014. [Google Scholar]
- Brown, J.; Caligari, P. An Introduction to Plant Breeding; Wiley: Hoboken, NJ, USA, 2011. [Google Scholar]
- Van Sanford, D.; Anderson, J.; Campbell, K.; Costa, J.; Cregan, P.; Griffey, C.; Hayes, P.; Ward, R. Discovery and Deployment of Molecular Markers Linked to Fusarium Head Blight Resistance The investigation reported in this paper (00-06-75) is in connection with a project of the Kentucky Agric. Exp. Stn. and is published with the approval of the director. Crop Sci. 2001, 41, 638–644. [Google Scholar] [CrossRef]
- Niwa, S.; Kubo, K.; Lewis, J.; Kikuchi, R.; Alagu, M.; Ban, T. Variations for Fusarium head blight resistance associated with genomic diversity in different sources of the resistant wheat cultivar ‘Sumai 3’. Breed. Sci. 2014, 64, 90–96. [Google Scholar] [CrossRef]
- Tessmann, E.; Van Sanford, D. GWAS for Fusarium Head Blight Related Traits in Winter Wheat (Triticum Aestivum L.) in an Artificially Warmed Treatment. Agronomy 2018, 8, 68. [Google Scholar] [CrossRef]
- Van der Fels-Klerx, H.J.; Olesen, J.E.; Madsen, M.S.; Goedhart, P.W. Climate change increases deoxynivalenol contamination of wheat in north-western Europe. Food Addit. Contam. Part A Chem. Anal. Control Expo. Risk Assess. 2012, 29, 1593–1604. [Google Scholar] [CrossRef]
- Backhouse, D. Global distribution of Fusarium graminearum, F. asiaticum and F. boothii from wheat in relation to climate. Eur. J. Plant Pathol. 2014, 139, 161–173. [Google Scholar] [CrossRef]
- Vaughan, M.; Backhouse, D.; Ponte, E.M.D. Climate change impacts on the ecology of Fusarium graminearum species complex and susceptibility of wheat to Fusarium head blight: A review. World Mycotoxin J. 2016, 9, 685–700. [Google Scholar] [CrossRef]
- Tessmann, E.W.; Dong, Y.; Van Sanford, D.A. GWAS for Fusarium Head Blight Traits in a Soft Red Winter Wheat Mapping Panel. Crop Sci. 2019, 59. [Google Scholar] [CrossRef]
- Gilbert, J.; Woods, S.M. Strategies and Considerations for Multi-Location FHB Screening Nurseries; CIMMYT: El Batàn, Mexico, 2006. [Google Scholar]
- Balut, A.L.; Clark, A.J.; Brown-Guedira, G.; Souza, E.; Van Sanford, D.A. Validation of Fhb1 and QFhs. nau-2DL in Several Soft Red Winter Wheat Populations. Crop Sci. 2013, 53, 934–945. [Google Scholar] [CrossRef]
- Bec, S.; Ward, T.; Farman, M.; O’Donnell, K.; Hershman, D.; Van Sanford, D.; Vaillancourt, L.J. Characterization of Fusarium Strains Recovered from Wheat With Symptoms of Head Blight in Kentucky. Plant Dis. 2015, 99, 1622–1632. [Google Scholar] [CrossRef] [PubMed]
- Mirocha, C.J.; Kolaczkowski, E.; Xie, W.; Yu, H.; Jelen, H. Analysis of Deoxynivalenol and Its Derivatives (Batch and Single Kernel) Using Gas Chromatography/Mass Spectrometry. J. Agric. Food Chem. 1998, 46, 1414–1418. [Google Scholar] [CrossRef]
- Pearson, T. High-Speed Sorting of Grains by Color and Surface Texture. Appl. Eng. Agric. 2010, 26, 499–505. [Google Scholar] [CrossRef]
- Pasikatan, M.C.; Dowell, F.E. Evaluation of A High-Speed Color Sorter for Segregation of Red and White Wheat. Appl. Eng. Agric. 2003, 19, 71. [Google Scholar] [CrossRef]
- Delwiche, S.R.; Pearson, T.C.; Brabec, D.L. High-Speed Optical Sorting of Soft Wheat for Reduction of Deoxynivalenol. Plant Dis. 2005, 89, 1214–1219. [Google Scholar] [CrossRef]
- Pearson, T.; Brabec, D.; Haley, S. Color image based sorter for separating red and white wheat. Sens. Instrum. Food Qual. Saf. 2008, 2, 280–288. [Google Scholar] [CrossRef]
- Knapp, S.J.; Stroup, W.W.; Ross, W.M. Exact Confidence Intervals for Heritability on a Progeny Mean Basis. Crop Sci. 1985, 25, 192–194. [Google Scholar] [CrossRef]
- Russell, K. Genotype x Environment x Management: Implications for Selection to Heat Stress Tolerance and Nitrogen Use Efficiency in Soft Red Winter Wheat. Ph.D. Thesis, University of Kentucky, Lexington, KY, USA, 2017. [Google Scholar]
- He, X.; Dreisigacker, S.; Singh, R.P.; Singh, P.K. Genetics for low correlation between Fusarium head blight disease and deoxynivalenol (DON) content in a bread wheat mapping population. Theor. Appl. Genet. 2019, 132, 2401–2411. [Google Scholar] [CrossRef] [PubMed]
- Clark, A.J.; Sarti-Dvorjak, D.; Brown-Guedira, G.; Dong, Y.; Baik, B.K.; Van Sanford, D.A. Identifying Rare FHB-Resistant Segregants in Intransigent Backcross and F2 Winter Wheat Populations. Front. Microbiol. 2016, 7, 277. [Google Scholar] [CrossRef] [PubMed]
- Wisniewska, H.; Surma, M.; Krystkowiak, K.; Adamski, T.; Kuczynska, A.; Ogrodowicz, P.; Mikolajczak, K.; Belter, J.; Majka, M.; Kaczmarek, Z.; et al. Simultaneous selection for yield-related traits and susceptibility to Fusarium head blight in spring wheat RIL population. Breed. Sci. 2016, 66, 281–292. [Google Scholar] [CrossRef] [PubMed]
- Spanic, V.; Viljevac Vuletic, M.; Drezner, G.; Zdunic, Z.; Horvat, D. Performance Indices in Wheat Chlorophyll a Fluorescence and Protein Quality Influenced by FHB. Pathogens 2017, 6, 59. [Google Scholar] [CrossRef] [PubMed] [Green Version]
- Falconer, D. Introduction to Quantitative Genetics, 3rd ed.; John Wiley & Sons, Inc.: New York, NY, USA, 1989. [Google Scholar]
Figure 1.
Air separation machine used for fusarium damaged kernels determined using a vacuum sorter (FDKvs) determination and instructions for its use [7].
Figure 1.
Air separation machine used for fusarium damaged kernels determined using a vacuum sorter (FDKvs) determination and instructions for its use [7].

Figure 2.
Diagram of the optical sorter and stepwise instructions used for the mass selection.

Figure 3.
Diagram of the five selection strategies used in the experiment. Numbers in parentheses denote the number of lines selected from the previous generation. Green arrows symbolize the first, black arrows the second, and red arrows the third cycle of selection. No remnant seed was available from C0, therefore, this generation was not evaluated in 2019.


Table 1.
Pedigrees for the five crosses used in the sorter experiment.
| Cross | Pedigree |
|---|---|
| 1 | KY06C-11-3-10//Agripro COKER 9511/PEMBROKE |
| 2 | KY06C-11-3-10//KY97C-0508-01-01A-1/SS MPV-57 |
| 3 | KY06C-11-3-10//PEMBROKE/Excel 234 |
| 4 | KY06C-11-3-10//PEMBROKE/USG 3555 |
| 5 | KY06C-11-3-10//PEMBROKE/VA06W-558 |
Table 2.
Mean deoxynivalenol (DON), FDKvs, Fusarium damaged kernels determined using an optical sorter (FDKos), days to heading (DTH), Rating, and plant height (HT) for each selection strategy and each selection cycle estimated using data collected during the final evaluation (2019), Lexington, KY.
Table 2.
Mean deoxynivalenol (DON), FDKvs, Fusarium damaged kernels determined using an optical sorter (FDKos), days to heading (DTH), Rating, and plant height (HT) for each selection strategy and each selection cycle estimated using data collected during the final evaluation (2019), Lexington, KY.
| Selection Strategy | C | N | DON | FDKvs | FDKos | DTH | Rating | HT |
|---|---|---|---|---|---|---|---|---|
| Within | C1 | 54 | 1.1 ± 0.10 | 4.2 ± 0.27 | 20.9 ± 1.20 | 126 ± 0.40 | 6 ± 0.23 | 92 ± 1.71 |
| C2 | 54 | 1.1 ± 0.10 | 4.4 ± 0.27 | 20.7 ± 1.20 | 126 ± 0.40 | 5 ± 0.23 | 95 ± 1.71 | |
| C3 | 54 | 1.1 ± 0.10 | 4.0 ± 0.27 | 18.7 ± 1.20 | 126 ± 0.40 | 5 ± 0.23 | 96 ± 1.71 | |
| Among on FDKos | C1 | 54 | 1.1 ± 0.10 | 4.2 ± 0.26 | 20.9 ± 1.20 | 126 ± 0.40 | 6 ± 0.22 | 92 ± 1.70 |
| C2 | 25 | 0.9 ± 0.15 | 4.0 ± 0.38 | 18.1 ± 1.77 | 127 ± 0.59 | 4 ± 0.33 | 100 ± 2.50 | |
| C3 | 12 | 0.7 ± 0.22 | 3.7 ± 0.55 | 13.7 ± 2.55 | 126 ± 0.86 | 4 ± 0.47 | 106 ± 3.60 | |
| Among on FDKvs | C1 | 3 | 0.6 ± 0.24 | 3.4 ± 0.80 | 15.6 ± 4.89 | 131 ± 0.49 | 2 ± 0.24 | 106 ± 10.1 |
| C2 | 3 | 1.0 ± 0.24 | 4.1 ± 0.80 | 17.8 ± 4.89 | 130 ± 0.49 | 2 ± 0.24 | 103 ± 10.1 | |
| C3 | 1 | 0.7 ± 0.41 | 5.1 ± 1.39 | 10.4 ± 8.46 | 129 ± 0.84 | 2 ± 0.40 | 108 ± 17.5 | |
| Among on DON | C1 | 19 | 0.6 ± 0.09 | 3.5 ± 0.39 | 18.6 ± 1.8 | 126 ± 0.72 | 5 ± 0.38 | 98 ± 2.82 |
| C2 | 9 | 0.7 ± 0.12 | 4.2 ± 0.56 | 18.9 ± 2.6 | 128 ± 1.05 | 3 ± 0.55 | 104 ± 4.09 | |
| C3 | 5 | 0.4 ± 0.17 | 4.1 ± 0.75 | 20.9 ± 3.5 | 126 ± 1.41 | 4 ± 0.74 | 103 ± 5.49 | |
| Among on Index | C1 | 54 | 1.1 ± 0.10 | 4.2 ± 0.25 | 20.9 ± 1.25 | 126 ± 0.39 | 6 ± 0.24 | 92 ± 1.79 |
| C2 | 6 | 0.7 ± 0.31 | 3.8 ± 0.76 | 16.6 ± 3.76 | 128 ± 1.16 | 3 ± 0.71 | 107 ± 5.37 | |
| C3 | 4 | 0.4 ± 0.38 | 3.3 ± 0.94 | 13.5 ± 4.61 | 127 ± 1.43 | 3 ± 0.87 | 110 ± 6.57 |
C = selection cycle, C1 = 1st cycle of selection, C2 = 2nd cycle of selection, C3 = 3rd cycle of selection, N = number of lines selected in previous generation, (±) = standard error of the mean, DTH = number of days to heading, Rating = visual head scab rating (0–9), HT = plant height (cm), FDKvs = Fusarium damaged kernels determined using a vacuum sorter (%), FDKos = Fusarium damaged kernels determined using an optical sorter (%), DON = deoxynivalenol (ppm).
Table 3.
Mean DON, FDKvs, and FDKos for each selection strategy and each selection cycle expressed as a percentage of the resistant check cultivar KY02C-3005-25 estimated using data collected during the final evaluation (2019), Lexington, KY.
Table 3.
Mean DON, FDKvs, and FDKos for each selection strategy and each selection cycle expressed as a percentage of the resistant check cultivar KY02C-3005-25 estimated using data collected during the final evaluation (2019), Lexington, KY.
| Selection Strategy | C | DON as % KY02C-3005-25 | FDKvs as % KY02C-3005-25 | FDKos as % KY02C-3005-25 |
|---|---|---|---|---|
| Within | C1 | 145 | 168 | 220 |
| C2 | 145 | 176 | 218 | |
| C3 | 145 | 160 | 197 | |
| Among on FDKos | C1 | 145 | 168 | 220 |
| C2 | 118 | 160 | 191 | |
| C3 | 92 | 148 | 144 | |
| Among on FDKvs | C1 | 79 | 136 | 164 |
| C2 | 132 | 164 | 187 | |
| C3 | 92 | 204 | 109 | |
| Among on DON | C1 | 79 | 140 | 196 |
| C2 | 92 | 168 | 199 | |
| C3 | 53 | 164 | 220 | |
| Among on Index | C1 | 145 | 168 | 220 |
| C2 | 92 | 152 | 175 | |
| C3 | 53 | 132 | 142 |
C = selection cycle, C1 = 1st cycle of selection, C2 = 2nd cycle of selection, C3 = 3rd cycle of selection, FDKvs = fusarium damaged kernels determined using a vacuum sorter (%), FDKos = fusarium damaged kernels determined using an optical sorter (%), DON = deoxynivalenol (ppm), KY02C-3005-25 = resistant check cultivar.
Table 4.
Broad-sense heritability (H2) and 95% confidence interval (CI) for all phenotypic traits estimated using data collected from 2016–2018, Lexington, KY.
Table 4.
Broad-sense heritability (H2) and 95% confidence interval (CI) for all phenotypic traits estimated using data collected from 2016–2018, Lexington, KY.
| Trait | H2 | LL | UP |
|---|---|---|---|
| DTH (days) | 0.89 | 0.87 | 0.91 |
| Rating (0–9) | 0.70 | 0.65 | 0.75 |
| HT (cm) | 0.89 | 0.87 | 0.90 |
| FDKvs (%) | 0.83 | 0.79 | 0.85 |
| FDKos (%) | 0.68 | 0.62 | 0.74 |
| DON (ppm) | 0.74 | 0.70 | 0.78 |
H2 = broad sense heritability, LL = lower limit for 95% CI, UP = upper limit for 95% CI, DTH = number of days to heading, Rating = visual head scab rating (0–9), HT = plant height (cm), FDKvs = Fusarium damaged kernels determined using a vacuum sorter (%), FDKos = Fusarium damaged kernels determined using an optical sorter (%), DON = deoxynivalenol (ppm).
Table 5.
Broad sense heritability (H2) and 95% confidence interval (CI) for all phenotypic traits by the cycle of selection with an optical sorter using data collected from 2016-2018, Lexington, KY.
Table 5.
Broad sense heritability (H2) and 95% confidence interval (CI) for all phenotypic traits by the cycle of selection with an optical sorter using data collected from 2016-2018, Lexington, KY.
| C0 | C1 | C2 | |||||||
|---|---|---|---|---|---|---|---|---|---|
| Trait | H2 | LL | UP | H2 | LL | UP | H2 | LL | UP |
| DTH (days) | 0.91 | 0.89 | 0.93 | 0.93 | 0.92 | 0.94 | 0.93 | 0.91 | 0.94 |
| Rating (0–9) | 0.74 | 0.68 | 0.78 | 0.62 | 0.54 | 0.69 | 0.62 | 0.55 | 0.67 |
| HT (cm) | 0.76 | 0.71 | 0.80 | 0.75 | 0.70 | 0.79 | 0.94 | 0.93 | 0.95 |
| FDKvs (%) | 0.87 | 0.84 | 0.89 | 0.79 | 0.74 | 0.82 | 0.79 | 0.76 | 0.82 |
| FDKos (%) | N/A | N/A | N/A | 0.84 | 0.80 | 0.87 | 0.73 | 0.68 | 0.77 |
| DON (ppm) | 0.81 | 0.77 | 0.85 | 0.76 | 0.71 | 0.80 | 0.81 | 0.78 | 0.84 |
C0 = base population (2016), C1 = 1st cycle of selection with optical sorter (2017), C2 = 2nd cycle of selection with optical sorter (2018), H2 = broad sense heritability, LL = lower limit for 95% CI, UP = upper limit for 95% CI, DTH = number of days to heading, Rating = visual head scab rating (0–9), HT = plant height (cm), FDKvs = Fusarium damaged kernels determined using a vacuum sorter (%), FDKos = Fusarium damaged kernels determined using an optical sorter (%), DON = deoxynivalenol (ppm).
Table 6.
Broad-sense heritability (H2) and 95% confidence interval (CI) for all phenotypic traits estimated using data collected in 2019, Lexington, KY.
Table 6.
Broad-sense heritability (H2) and 95% confidence interval (CI) for all phenotypic traits estimated using data collected in 2019, Lexington, KY.
| Trait | H2 | LL | UP |
|---|---|---|---|
| DTH (days) | 0.97 | 0.95 | 0.98 |
| Rating (0–9) | 0.91 | 0.87 | 0.94 |
| HT (cm) | 0.94 | 0.91 | 0.96 |
| FDKvs (%) | 0.80 | 0.71 | 0.85 |
| FDKos (%) | 0.94 | 0.91 | 0.96 |
| DON (ppm) | 0.91 | 0.87 | 0.94 |
H2 = broad-sense heritability, LL = lower limit for 95% CI, UP = upper limit for 95% CI, DTH = number of days to heading, Rating = visual head scab rating (0–9), HT = plant height (cm), FDKvs = Fusarium damaged kernels determined using a vacuum sorter (%), FDKos = Fusarium damaged kernels determined using an optical sorter (%), DON = deoxynivalenol (ppm).
Table 7.
Broad-sense heritability (H2) and 95% confidence interval (CI) for all phenotypic traits estimated by the cycle of selection with an optical sorter using data collected in 2019, Lexington, KY.
Table 7.
Broad-sense heritability (H2) and 95% confidence interval (CI) for all phenotypic traits estimated by the cycle of selection with an optical sorter using data collected in 2019, Lexington, KY.
| C1 | C2 | C3 | |||||||
|---|---|---|---|---|---|---|---|---|---|
| Trait | H2 | LL | UP | H2 | LL | UP | H2 | LL | UP |
| DTH (days) | 0.95 | 0.92 | 0.97 | 0.90 | 0.84 | 0.94 | 0.92 | 0.88 | 0.95 |
| Rating (0–9) | 0.83 | 0.74 | 0.89 | 0.77 | 0.63 | 0.85 | 0.74 | 0.58 | 0.83 |
| HT (cm) | 0.95 | 0.92 | 0.97 | 0.92 | 0.88 | 0.95 | 0.91 | 0.85 | 0.94 |
| FDKvs (%) | 0.50 | 0.20 | 0.68 | 0.64 | 0.44 | 0.77 | 0.48 | 0.18 | 0.67 |
| FDKos (%) | 0.91 | 0.86 | 0.94 | 0.88 | 0.80 | 0.92 | 0.89 | 0.83 | 0.93 |
| DON (ppm) | 0.83 | 0.72 | 0.89 | 0.78 | 0.66 | 0.86 | 0.81 | 0.70 | 0.88 |
C1 = 1st cycle of selection with optical sorter, C2 = 2nd cycle of selection with optical sorter, C3 = 3rd cycle of selection with optical sorter, H2 = broad sense heritability, LL = lower limit for 95% CI, UP = upper limit for 95% CI, DTH = number of days to heading, Rating = visual head scab rating (0–9), HT = plant height (cm), FDKvs = Fusarium damaged kernels determined using a vacuum sorter (%), FDKos = Fusarium damaged kernels determined using an optical sorter (%), DON = deoxynivalenol (ppm).
Table 8.
Means obtained using data from 2016–2018 for all phenotypic traits by year, Lexington, KY. The coefficient of variation, mean squares, and level of significance for year (Y), genotype (G), and year (Y) × genotype (G) are shown below the means for each trait evaluated. In each column, different letters denote significant differences according to Tukey’s Honest Significant Difference (HSD) test performed at α = 0.05.
| DTH (days) | Rating (0–9) | HT (cm) | FDKvs (%) | FDKos (%) | DON (ppm) | |
|---|---|---|---|---|---|---|
| 2016 | 127 B | 2 C | 81 B | 13.9 B | N/A | 12.6 A |
| 2017 | 115 C | 4 B | 95 A | 18.8 A | 13.1 B | 8.7 B |
| 2018 | 132 A | 5 A | 95 A | 18.8 A | 25.0 A | 8.8 B |
| Year | 49,223.72 * | 1597.50 * | 41,738.62 * | 5129.19 * | 50,391.24 * | 3137.80 * |
| Genotype | 75.68 * | 7.37 * | 563.87 * | 255.05 * | 299.37 * | 110.43 * |
| Y × G | 7.82 * | 2.37 * | 71.39 * | 48.69 * | 89.05 * | 28.40 * |
| CV | 1.09 | 33.60 | 6.31 | 30.69 | 38.00 | 33.40 |
DTH = number of days to heading, Rating = visual head scab rating (0–9), HT = plant height (cm), FDKvs = Fusarium damaged kernels determined using a vacuum sorter (%), FDKos = Fusarium damaged kernels determined using an optical sorter (%), DON = deoxynivalenol (ppm), CV = coefficient of variation, * p < 0.05.
Table 9.
Means obtained using data from 2019 for all phenotypic traits by selection cycle, Lexington, KY. The coefficient of variation, mean squares, and level of significance for selection cycle (C), genotype (G), and selection cycle (C) × genotype (G) are shown below the means for each trait evaluated. In each column, different letters denote significant differences according to Tukey’s Honest Significant Difference (HSD) test performed at α = 0.05.
| DTH (days) | Rating (0–9) | HT (cm) | FDKvs (%) | FDKos (%) | DON (ppm) | |
|---|---|---|---|---|---|---|
| C1 | 126 A | 6 A | 92 B | 4.2 A | 20.9 A | 1.1 A |
| C2 | 126 A | 5 A | 95 A | 4.4 A | 20.7 A | 1.1 A |
| C3 | 126 A | 5 A | 96 A | 4.0 A | 18.7 B | 1.1 A |
| Selection Cycle | 0.78 ns | 2.72 ns | 463.80 * | 4.52 ns | 150.60 * | 0.07 ns |
| Genotype | 42.27 * | 15.02 * | 847.90 * | 17.30 * | 403.29 * | 2.60 * |
| C × G | 1.78 * | 1.40 ns | 50.86 * | 3.23 ns | 32.81 * | 0.29 * |
| CV | 0.87 | 21.13 | 5.03 | 45.73 | 20.10 | 39.39 |
DTH = number of days to heading, Rating = visual head scab rating (0–9), HT = plant height (cm), FDKvs = Fusarium damaged kernels determined using a vacuum sorter (%), FDKos = Fusarium damaged kernels determined using an optical sorter (%), DON = deoxynivalenol (ppm), CV = coefficient of variation, * p < 0.05. ns = not significant.
© 2019 by the authors. Licensee MDPI, Basel, Switzerland. This article is an open access article distributed under the terms and conditions of the Creative Commons Attribution (CC BY) license (http://creativecommons.org/licenses/by/4.0/).
Share and Cite
MDPI and ACS Style
Carmack, W.J.; Clark, A.J.; Dong, Y.; Van Sanford, D.A. Mass Selection for Reduced Deoxynivalenol Concentration Using an Optical Sorter in SRW Wheat. Agronomy 2019, 9, 816. https://0-doi-org.brum.beds.ac.uk/10.3390/agronomy9120816
AMA Style
Carmack WJ, Clark AJ, Dong Y, Van Sanford DA. Mass Selection for Reduced Deoxynivalenol Concentration Using an Optical Sorter in SRW Wheat. Agronomy. 2019; 9(12):816. https://0-doi-org.brum.beds.ac.uk/10.3390/agronomy9120816
Chicago/Turabian StyleCarmack, W. Jesse, Anthony J. Clark, Yanhong Dong, and David A. Van Sanford. 2019. "Mass Selection for Reduced Deoxynivalenol Concentration Using an Optical Sorter in SRW Wheat" Agronomy 9, no. 12: 816. https://0-doi-org.brum.beds.ac.uk/10.3390/agronomy9120816
Note that from the first issue of 2016, this journal uses article numbers instead of page numbers. See further details here.