Article

Infrared Thermography to Estimate Vine Water Status: Optimizing Canopy Measurements and Thermal Indices for the Varieties Merlot and Moscato in Northern Italy

1
Council for Agricultural Research and Economics-Research Centre for Viticulture and Enology, Viale 28 Aprile, 26, 31015 Conegliano (TV), Italy
2
National Research Council of Italy-Institute for Sustainable Plant Protection, Strada delle Cacce, 73, 10135 Torino (TO), Italy
3
School of Agriculture, Food and Wine, Waite Research Institute, the University of Adelaide, PMB 1 Glen Osmond, Urrbrae, SA 5064, Australia
4
Department of Agronomy, Food, Natural Resources, Animals and the Environment, University of Padova, 35020 Padova, Italy
*
Authors to whom correspondence should be addressed.
Submission received: 3 October 2019 / Revised: 21 November 2019 / Accepted: 21 November 2019 / Published: 29 November 2019
(This article belongs to the Special Issue Tackling Grapevine Water Relations in a Global Warming Scenario)

Abstract

:
This study investigated the effectiveness of infrared thermography to estimate water status in Merlot and Moscato grown in northeast Italy by comparing the crop water stress index (CWSI) and the stomatal conductance index (IG). The influence of the portion of the canopy in which the thermal images were captured (sunlit or shaded) was also investigated. During the 2018 growing season, potted vines were subjected to three irrigation treatments: T0 = 100% of daily water usage restored; T1 = 50% of daily water usage restored; and T2 = 30% of daily water usage restored. Measurements included stomatal conductance (gs), stem water potential (SWP), and thermal imagery. Results showed that both the CWSI and IG indices were effective in discriminating the irrigation treatments in Moscato and Merlot. CWSI showed higher correlations with gs and SWP compared to IG, especially in Moscato. CWSI was less influenced by the portion of the canopy the image was taken on. In general, Moscato showed greater differences in gs, SWP, and the thermal indices between the three irrigation treatments. This study suggests that the efficacy of thermography in estimating vine water status depends on the variety and its stomatal control physiology.

1. Introduction

Climate change is causing a global increase in temperatures and atmospheric CO2 [1] with climatic models forecasting an exacerbation of these conditions with repercussions on different ecosystems. These new scenarios could translate into positive outcomes for northern European regions that could see a diversification of the agricultural species that could be cultivated [2]. On the other hand, the southern regions will face issues related not only to higher temperatures, but also to water scarcity [3,4,5,6,7]. For viticulture, since summer droughts will become more common, this will translate into a higher dependence on irrigation [7,8,9].
Grapevine is a very plastic species, whose phenology is particularly sensitive and reactive to environmental factors, to the point that it is considered as a model plant to study climate change [10,11,12,13,14,15,16]. Grapevine is known to be well adapted to the Mediterranean climate [17], however, an increase in temperature coupled with water scarcity and other biotic and abiotic stresses could alter both the quality and quantity of the production, traits influenced by both temperature and water availability. As a consequence of ongoing climate change, various authors have already reported an increase in the harvest sugar levels, and a reduction in acidity, increased pH, and a change of the anthocyanin content and aromatic profile of the grapes, to the point of losing the varietal typicity [18,19,20].
Irrigation is becoming more and more common worldwide, especially in areas where it was traditionally not used, in order to ameliorate the above-mentioned issues. With a wider use of irrigation, access to techniques and tools for accurate irrigation scheduling has also become critical to growers.
Available techniques to assess plant water status and decide on irrigation scheduling rely on the use of a pressure chamber to measure leaf or stem water potentials [21,22] or the measure of leaf conductance using a porometer or a gas analyzer [23,24]. However, despite these being very sensitive physiological indicators of plant water status, the measures are unpractical, time consuming, and thus often used only within academia.
Since the 1960s, leaf temperature has been proposed as a reliable indicator of grapevine water status [25]. Technological advances have favored the spread of this technology in agriculture to the point that nowadays, infrared thermography (IRT) is recognized as a rapid and non-invasive option for the assessment of canopy temperature [26,27,28] and is widely recommended for irrigation scheduling, especially for precision viticulture [27,28,29,30,31,32,33,34,35,36]. The technique is based on the knowledge that leaf temperature increases in situations of stress causing stomatal closure [28,31,34,37,38]. The link between leaf temperature and stomatal regulation in stress conditions has been well described in grapevine [19,39]. As a general rule, when the vine is under stress, transpiration slows down or stops [40], and the absorbed radiation fails to dissipate, causing an increase in leaf temperature [28,41]. Early studies on the use of IRT proposed that temperature measures were carried out at the leaf level, however, given the patchiness of stomatal behavior, which is typical of grapevine [42], and then a non-consistent response within the leaf, the use of whole canopy images has been recommended instead [43]. According to Idso et al. [43], the use of whole canopy images reduces the variability caused by environmental factors such as solar radiation or even more, wind speed. Wind causes abrupt changes in canopy microclimate, vine transpiration, and stomatal conductance [34], which can cause inaccuracies in the estimation of plant water status [44,45].
Various authors have proposed the use of water stress indices derived from IRT. The best known and most used of these indices is the crop water stress index (CWSI), initially proposed by Idso et al. [46] and Jackson et al. [30], and then modified by Jones [44] and Jones et al. [28], by adding the reference temperatures Tdry and Twet to make the index more reliable. The CWSI is based on the canopy temperature and weather conditions present during the measurement. It compares the canopy temperature with reference thresholds: The canopy temperature of well-irrigated plants and plants under severe water stress, which represent the lowest and highest temperatures that a transpiring and non-transpiring object can reach in those environmental conditions, respectively. [28,30,46]. Numerous authors have proposed the use of CWSI for irrigation scheduling [27,28,29,30,31,34,43,47,48,49]. A more development is the stomatal conductance index (IG), which is also calculated using the average canopy temperature and the reference threshold temperatures [43]. Despite the amount of research conducted in this area, it is yet to be determined which of the two indices is the best suited to determine vine water status [50]. Moreover, an agreement is yet to be reached regarding the portion of the canopy (sunlit or shaded) in which the IRT images should be taken; some authors have obtained better results using the sunlit portion [28], while others found have had more consistent results with the shaded portion [50]. With regard to the time of the day of when to acquire the images, some authors have recommended the hottest part of the day (between 12:00 and 15:30) when the atmospheric demand is the maximum, and clear differences between stressed and non-stressed vines can be seen [35,36].
Moreover, little is still known about the effectiveness of the IRT technique among varieties showing contrasting physiological response to water restrictions, known as isohydric and anisohydric behavior. Varieties classified as isohydric are able to keep their leaf water potential above a certain threshold, regardless of soil water availability or atmospheric water demand [51,52]. On the contrary, anisohydric cultivars drop their water potential with decreasing soil water availability or increasing atmospheric water demand [51,52].
In this study, IRT was used on the varieties Merlot and Moscato Giallo “fiori d’arancio” (Moscato Bianco x Chasselas) grown in northeast Italy. Only a few studies have previously investigated the effectiveness of IRT in monitoring grapevine water status in Merlot, while no thermography studies exist on the latter variety. A controlled water stress experiment was set up using pot-grown vines with the aim to verify the efficacy of IRT, used in the hottest hours of the day, in defining the water status of these two varieties. Moreover, the study aims to identify the most appropriate index (CWSI or IG) to evaluate the vine water status and the most appropriate portion of the canopy (sunlit or shaded) for the measurements.

2. Materials and Methods

2.1. Experimental Set-Up

The study was carried out during the 2018 summer in the experimental farm of the Research Centre for Viticulture and Oenology (CREA-VE), located in Conegliano, in the Veneto region, Northeast Italy (45°51′ N–12°15′ E).
A number of 15 Merlot and 15 Moscato Giallo (Moscato hereafter) vines (Vitis vinifera L.) grafted onto Kober 5BB were used for the experiment. Plants were maintained under natural light conditions and at ambient temperature. All vines were grown in 80 L plastic pots filled with a sand–peat–clay mixture (50%–5%–15% in volume). The top of the pots was covered with plastic waterproof sheets in order to avoid water loss from the soil and the infiltration of rain. Pots were positioned in rows with a spacing of 1 m between vines and 1.5 m between rows, and with an east–west row orientation. Vines were cane pruned with 16–12 buds, at BBCH 69 (end of flowering), a shoot thinning was carried out to standardize the number of shoots to 16–18 for all vines.
Vines were subjected to three irrigation treatments: (i) T0, well irrigated, SWP was maintained above −0.8 MPa by replenishing 100% of the total daily water usage; (ii) T1, medium water stress, SWP was kept between −1.2 and −1 MPa by replenishing 50% of the total daily water usage; and (iii) T2, severe water stress, SWP kept below −1.4 MPa by replenishing 30% of the total daily water usage. Daily water usage was monitored through continuously weighing the T0 vines with Laumas Elettronica ISC scales connected to a D1 Flex log 1.9 datalogger (Tecnopenta PD, Italy). SWP was measured for five days in Merlot (between DOY—Day of Year—206 and 214) and seven days in Moscato (between DOY 200–214). Leaf gas exchange measurements were taken on the same days as the IRT images according to the following schedule: DOY 206, 207, 208 for Merlot and DOY 211, 213, 214 for Moscato. Weather conditions at the experimental site were monitored using the local CREA-VE weather station coupled to Watch Dog 1400 datalogger instrumentation (Spectrum Technologies, Bridgend, UK).

2.2. Water Potential Measurements

Midday stem water potential (SWP, MPa) was measured with a Scholander pressure chamber [53] (model 600; PMS Instrument Company, Albany, OR, USA) during the hottest hours of the day (between 13:00 and 14:30) on all vines. A healthy and intact leaf on the 4th–5th node after the last bunch on a main shoot was selected. The selected leaf was inserted in an aluminum-coated plastic bag for one hour [54] before the measurement, in order to induce stomata closure and stop transpiration until the water potential of the leaf equated that of the whole vine.

2.3. Gas Exchange Measurements

Net photosynthesis (An) (Tables S1 and S2) and stomatal conductance (gs) were measured at the same time as SWP, on a 4th–5th leaf after the last bunch, on both portions of the canopy using a Ciras 2 portable system (PP SYSTEMS Europe, Herts, UK) at a CO2 concentration of 390 ppm, a photosynthetically active radiation (PAR) of 1500 µmol of photons m−2 s−1, and a reference relative humidity of 65%.
In each variety, measurements were taken between 13:00 and 14:30 on 10 leaves per treatment (five on the shaded portion, five on the sunlit portion), for a total of 30 leaves measured on each measurement day.

2.4. Thermal Image Acquisition

Thermal images were taken immediately before measuring gas exchanges and SWP [35] on five plants per treatment on both the sunlit and shaded portions of the canopy for a total of 30 photos per day. IRT images were acquired with an infrared camera (T series model 620 FLIR system, Inc. Wilsonville, OR, USA) with emissivity set to 0.96 [28].
Every image was taken by using a tripod positioned 1 m from the canopy, with the camera placed at a 1.10 m height, perpendicularly to the vine row. For every image, the tripod was moved along the parallel of the row to keep the angle between the camera and the canopy constant at 90°. At the time of the image acquisition, the sun was at its maximum diurnal declination.
Reflected apparent temperature and relative humidity were collected on each measurement day. The reflected temperature was measured on the shiny side of an aluminum sheet that was previously creased and re-distended, and positioned at the same point as the observed object with the emissivity set at 1 [31]. Such a sheet acts like a mirror positioned at various angles, thus reflecting to the camera the radiation from all possible directions.
Thermal images were processed using the FLIR Tools software (version 2.0, FLIR system, Inc. Wilsonville, USA). For each image, in order to exclude non-leaf material from the analysis, areas of different shapes were manually selected (where necessary) and the average temperature of each area was used to calculate the temperature of the canopy [28,34]. The removal of non-leaf material was eased by comparing the IRT images to the simultaneously acquired visible (RGB—Red, Green, Blue) photos [47].
For each treatment, reference surface temperatures (Tdry and Twet) were also acquired simultaneously with the acquisition of the IRT images [31,55,56]. Tdry and Twet represent respectively the maximum and minimum temperatures a non-transpiring leaf (Tdry) or a fully transpiring leaf (Twet) can reach in those specific climatic conditions (wind speed, solar radiation, relative humidity, and air temperature), as introduced by [43]. The reference temperatures were taken on each thermal image on both portions of the canopy. The Tdry and Twet transpiration conditions were simulated by painting both leaf surfaces with water and Vaseline, respectively [35,43].

2.5. Thermal Indices Calculation

The thermal indices, CWSI and IG, were calculated using the reference and canopy temperatures, according to the formulae reported below [28,44]:
CWSI = T canopy T wet T dry T wet
IG = T dry T canopy T canopy T wet
where Tdry is the temperature of the non-transpiring leaf (painted with Vaseline); Twet is the temperature of the fully transpiring leaf (painted with water); and Tcanopy is the temperature of the canopy (non-leaf material excluded). CWSI varies between 0 and 1. Values between 0.8–1 indicate severe water stress, while values close to 0 are indicative of non-stress conditions [50]. As reported by other authors [34,48], some CWSI values slightly above 1 (max 1.2) have also been considered. Values above 1 could be due to the fact that the plants on which Twet was measured might not have been completely hydrated, thus causing higher values of Twet and CWSI. For IG, values should not fall below 0. Values between 0 and 0.5 are considered indicative of severe stress while values greater than 0.5 have been measured in non-stressed vines [50].

2.6. Statistical Analysis

All data analysis was carried out using the STATISTICA analysis software (version 7, StatSoft Inc., Tulsa, OK, USA). Results were subjected to analysis of variance (one-way ANOVA). The post hoc Newman–Keuls–Student (NKS) test was used to separate the means (p ≤ 0.05). The significance of the correlation between thermal indices, physiological measurements, and temperatures was defined by the Pearson correlation coefficient. The software package R (version 3.5.2, R Core Team, Vienna, Austria) was used for principal component analysis (PCA).

3. Results and Discussion

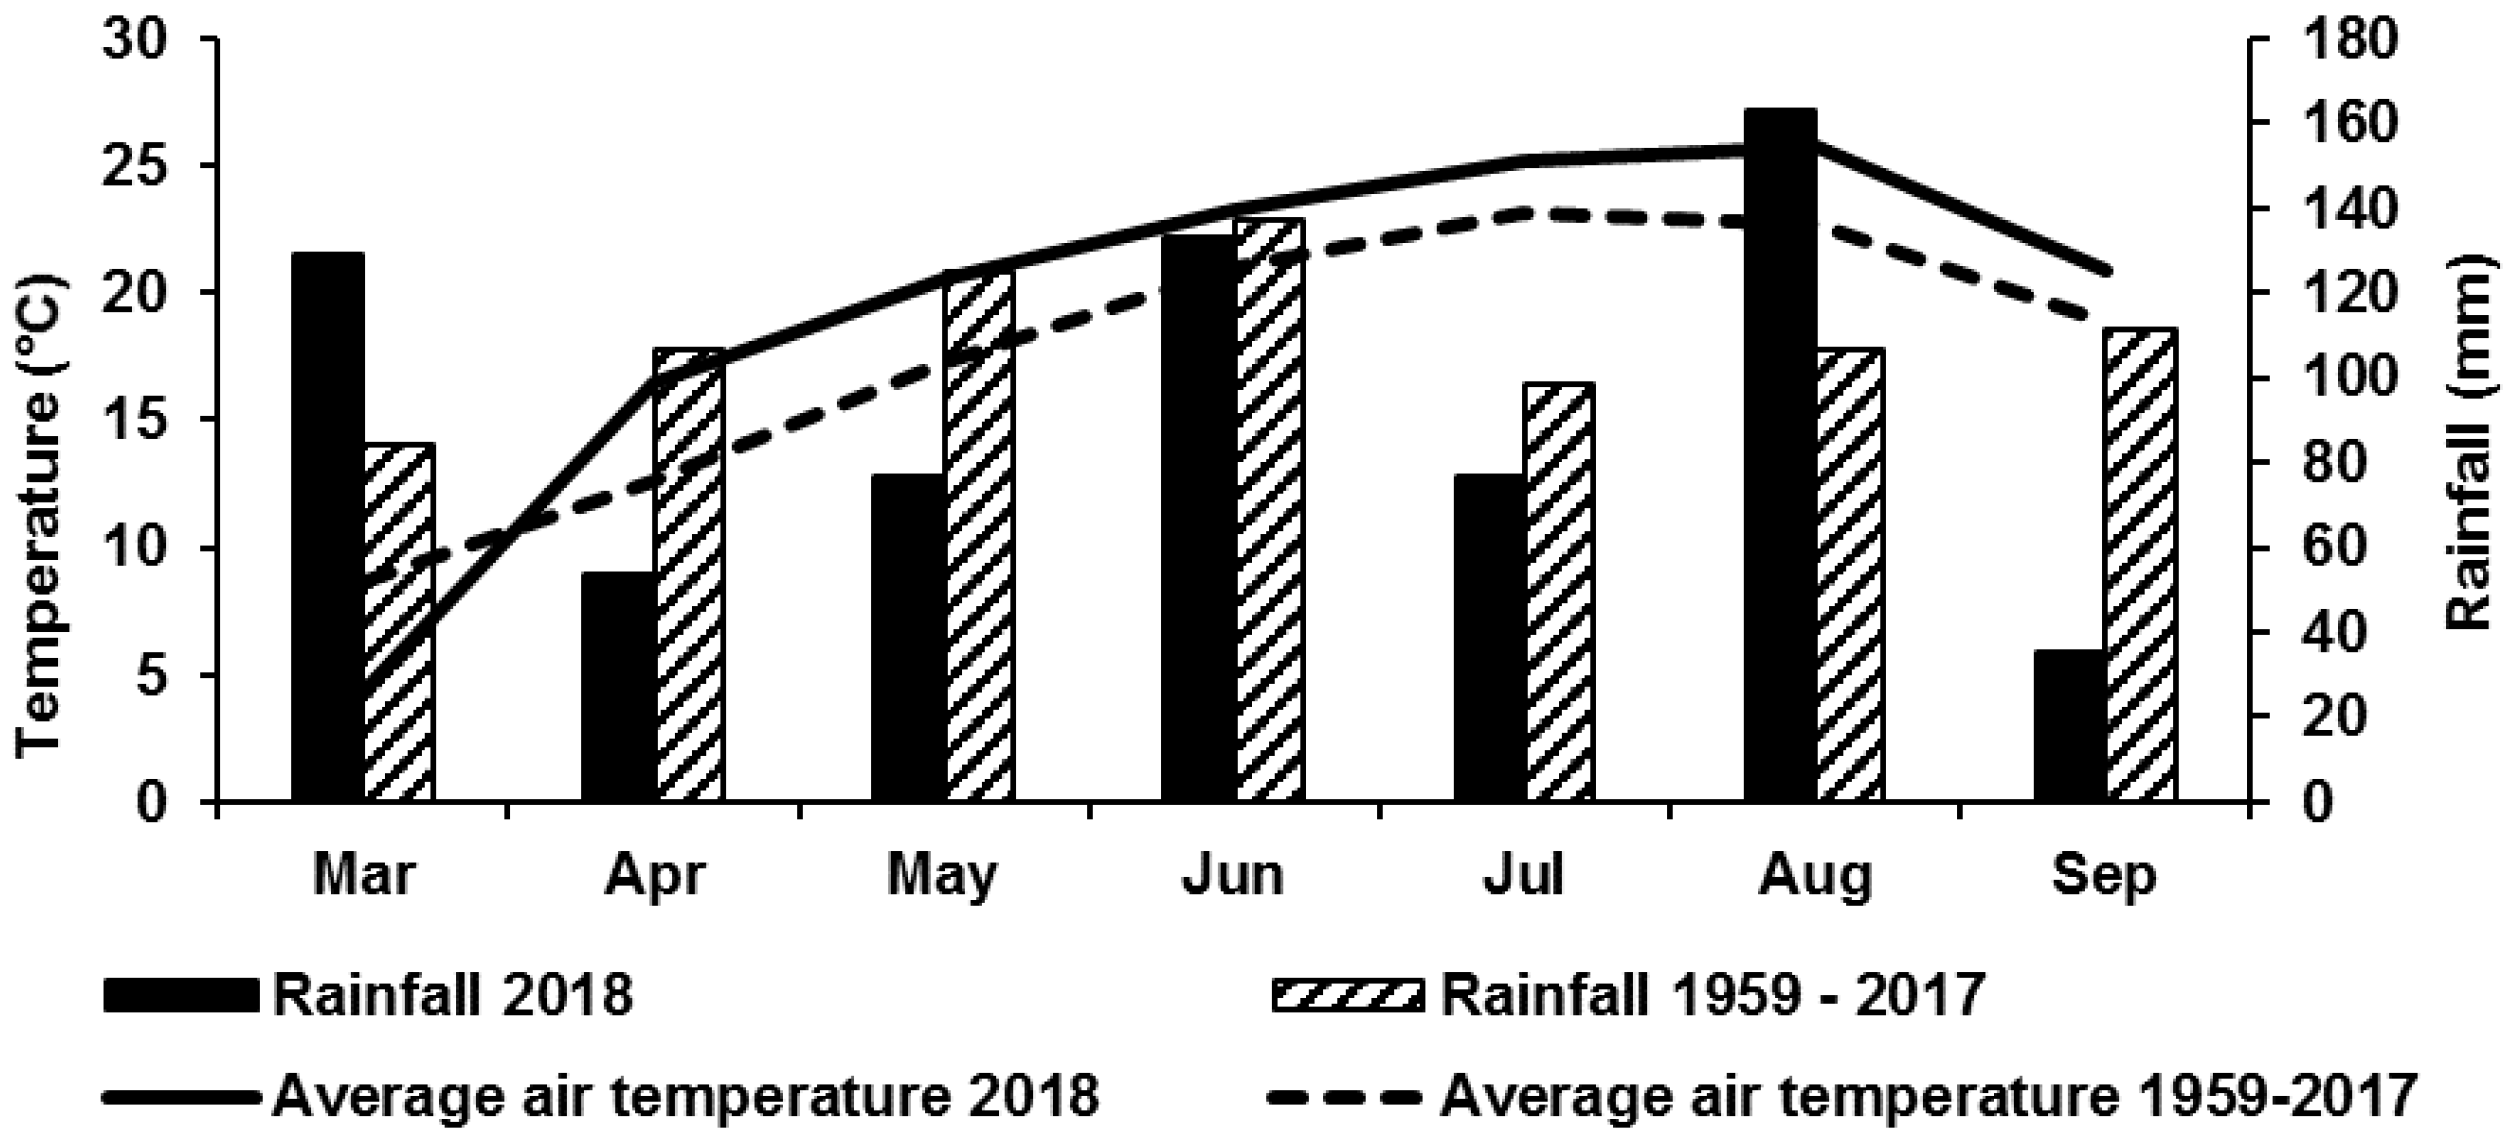
3.1. Weather Conditions During the Trial Period

The 2018 season was warmer than the long-term average (LTA) in Conegliano (1959–2017). The average temperature from March to September was higher by 1.8 °C compared to the same months in the 1959–2017 period. July, August, and September have been the hottest since 1959.
The growing season rainfall (March–September) was 670 mm, 110 mm lower than the LTA. Despite the rainfall being abundant, it was unevenly distributed during the period (Figure 1).
For the length of the trial, DOY 206 to 214, the weather conditions were characterized by clear sky, high solar radiation, low relative humidity, minimal windspeed, high average temperature, and vapor pressure deficit (VPD) values between 1.3 and 2.8 KPa, as shown in Table 1.

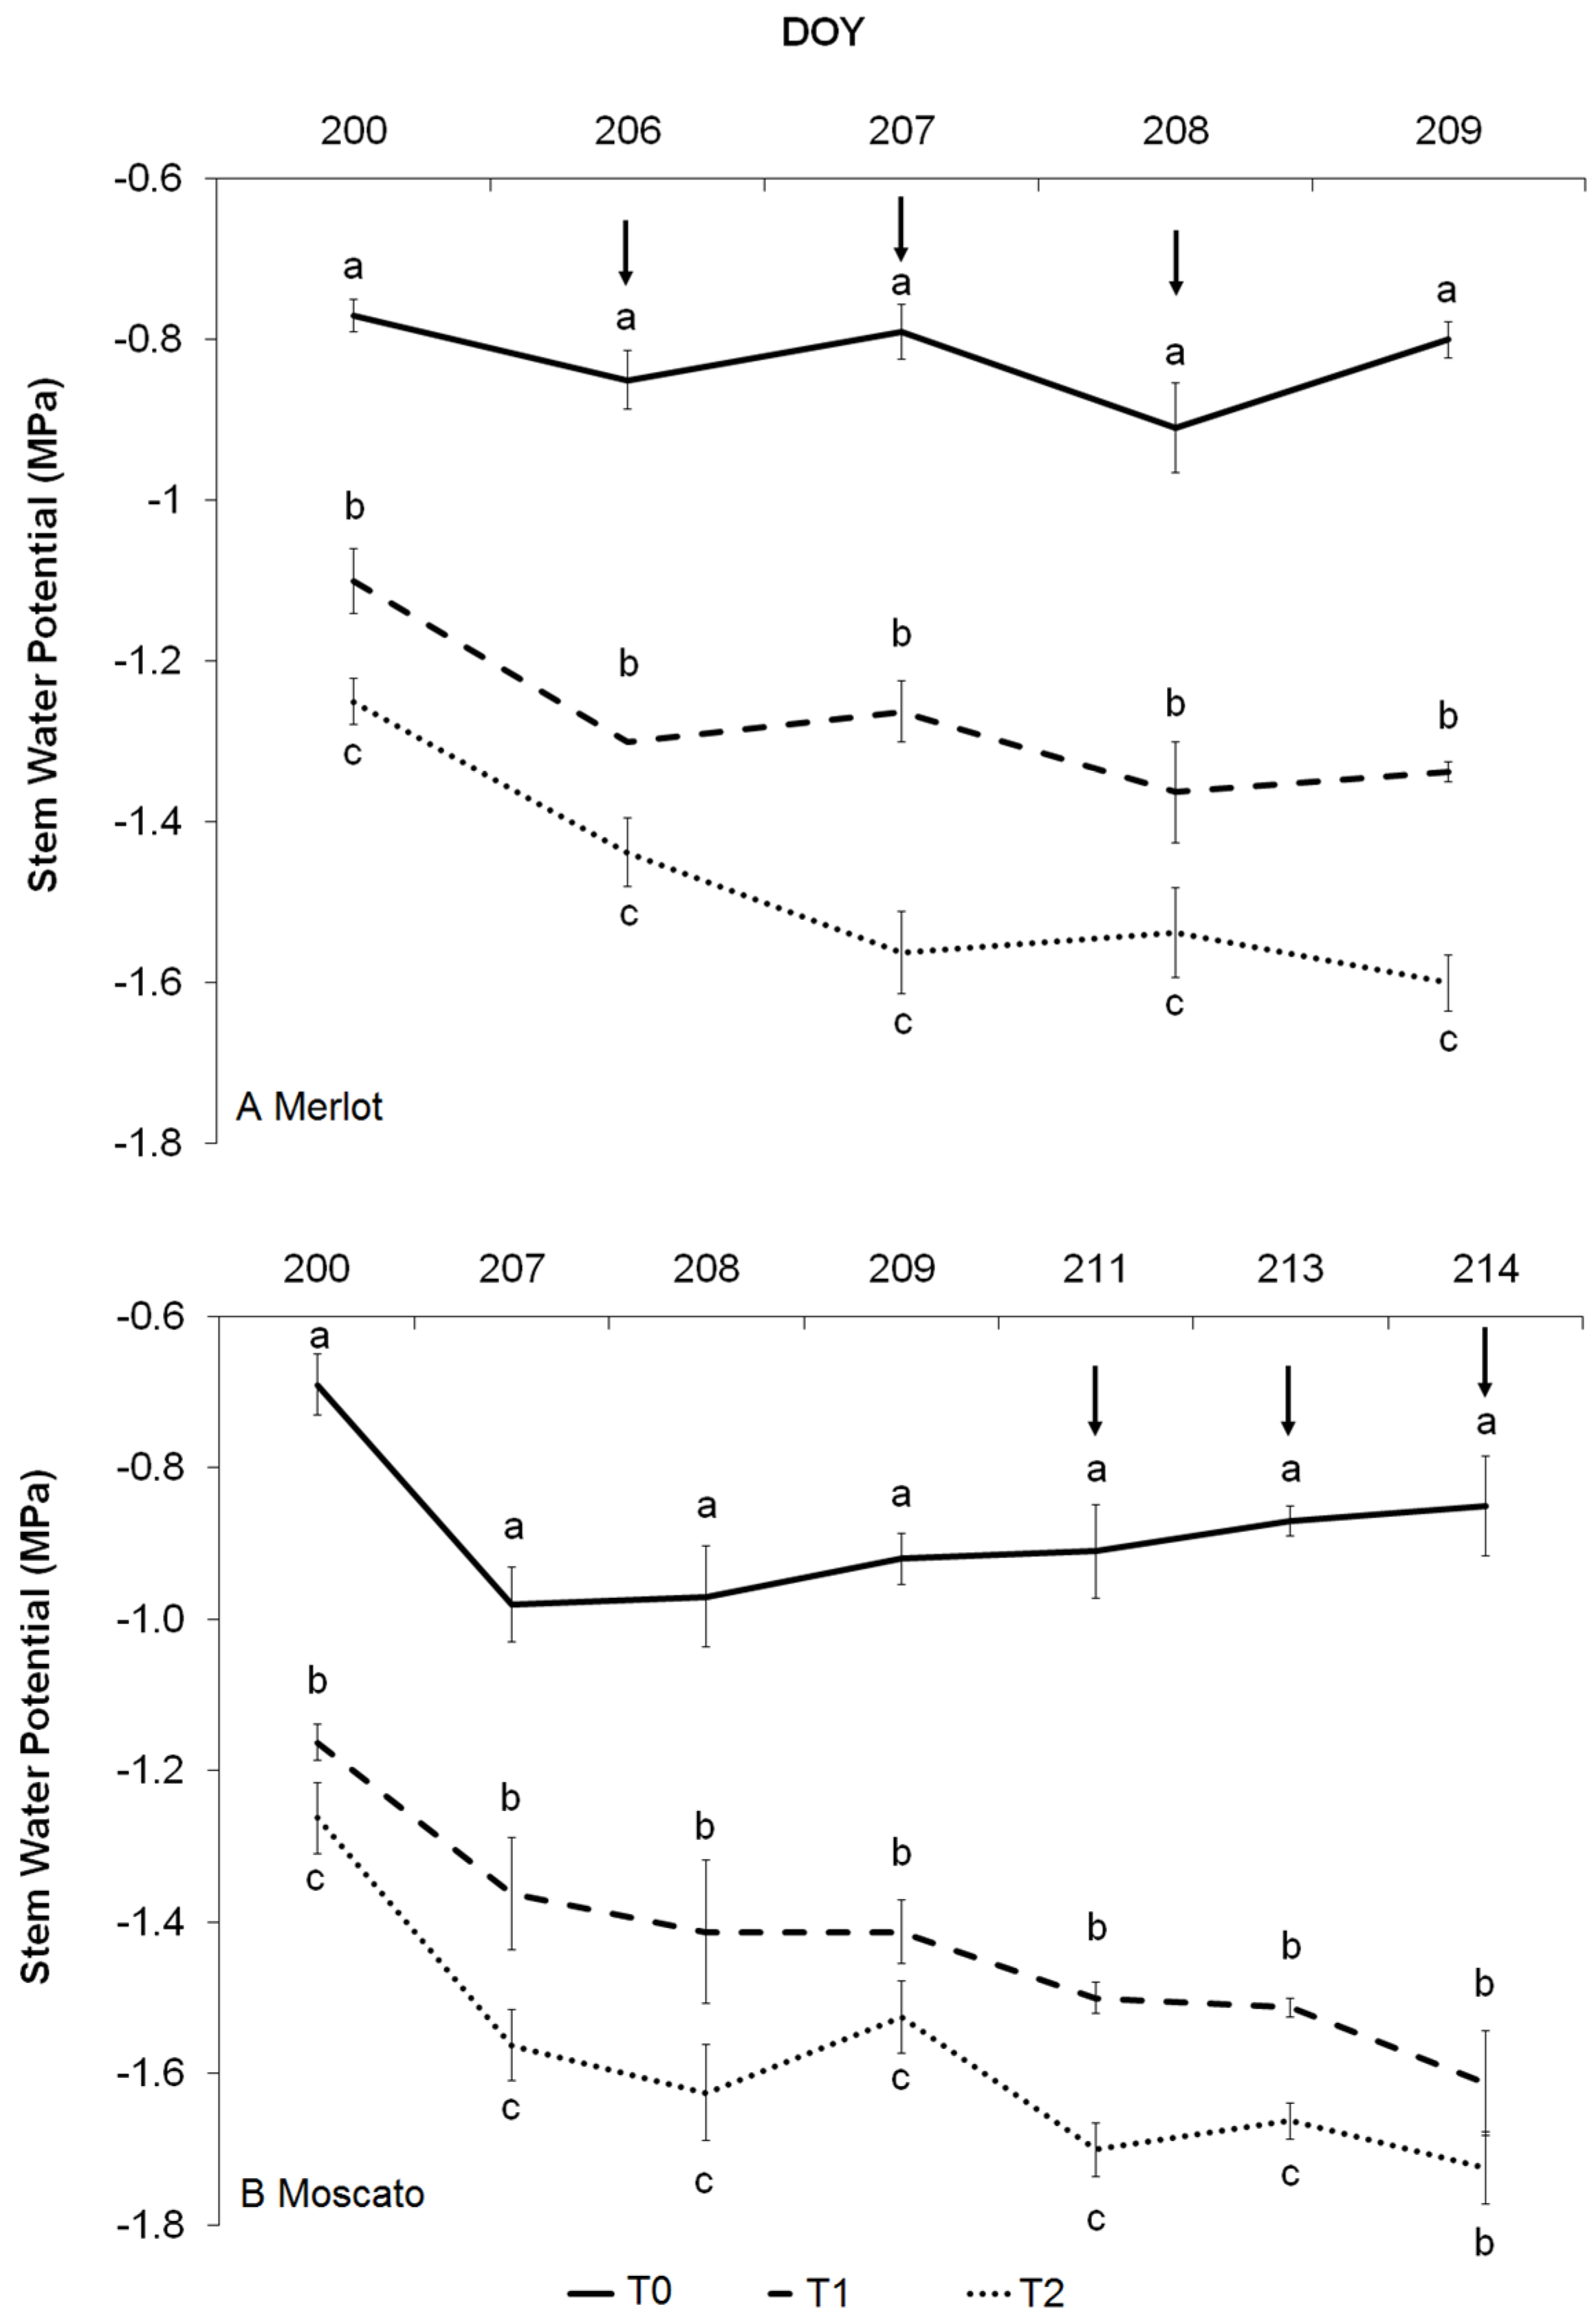
3.2. Water Potential Measurements

Water stress was induced by reducing the amount of irrigation in the T1 and T2 treatments (medium and severe water stress, respectively) a week before commencing the measurements (DOY 193). Figure 2A,B show the evolution of the water potential in Merlot and Moscato for the duration of the experiment. The SWP values of T0 vines in both Merlot and Moscato were significantly greater than those of T1 and T2. Moreover, since the first day of measurement, SWP was the lowest in T2 and always different from T0 and T1, but in Moscato on the last day of measurement (DOY 214). T1 followed a similar pattern to T2, but with higher values. SWP became more negative with the progress of the water restrictions to reach minimum values of −1.6 MPa for Merlot (DOY 209) and −1.7 MPa in Moscato (DOY 214) on the last day of measurements. Overall, the average SWP values recorded in Merlot were less negative than in Moscato.
Data recorded throughout the test period in both varieties indicate that the irrigation strategies applied to the T0, T1, and T2 treatments were effective in obtaining clear differences in water status for both varieties. T0 SWP varied between −0.7 MPa and −0.9 MPa in Merlot and between −0.7 and −0.85 in Moscato, all values indicate a non-stress situation according to the data reported by [57,58]. T1 vines displayed a SWP between −1.1 MPa and −1.2 MPa in Merlot and between −1.2 and −1.5 in Moscato, revealing a medium stress condition [57,58]. Severe water stress was measured in T2, with SWP values ranging between −1.3 MPa and −1.6 MPa in Merlot and between −1.3 and −1.7 in Moscato [57,58].

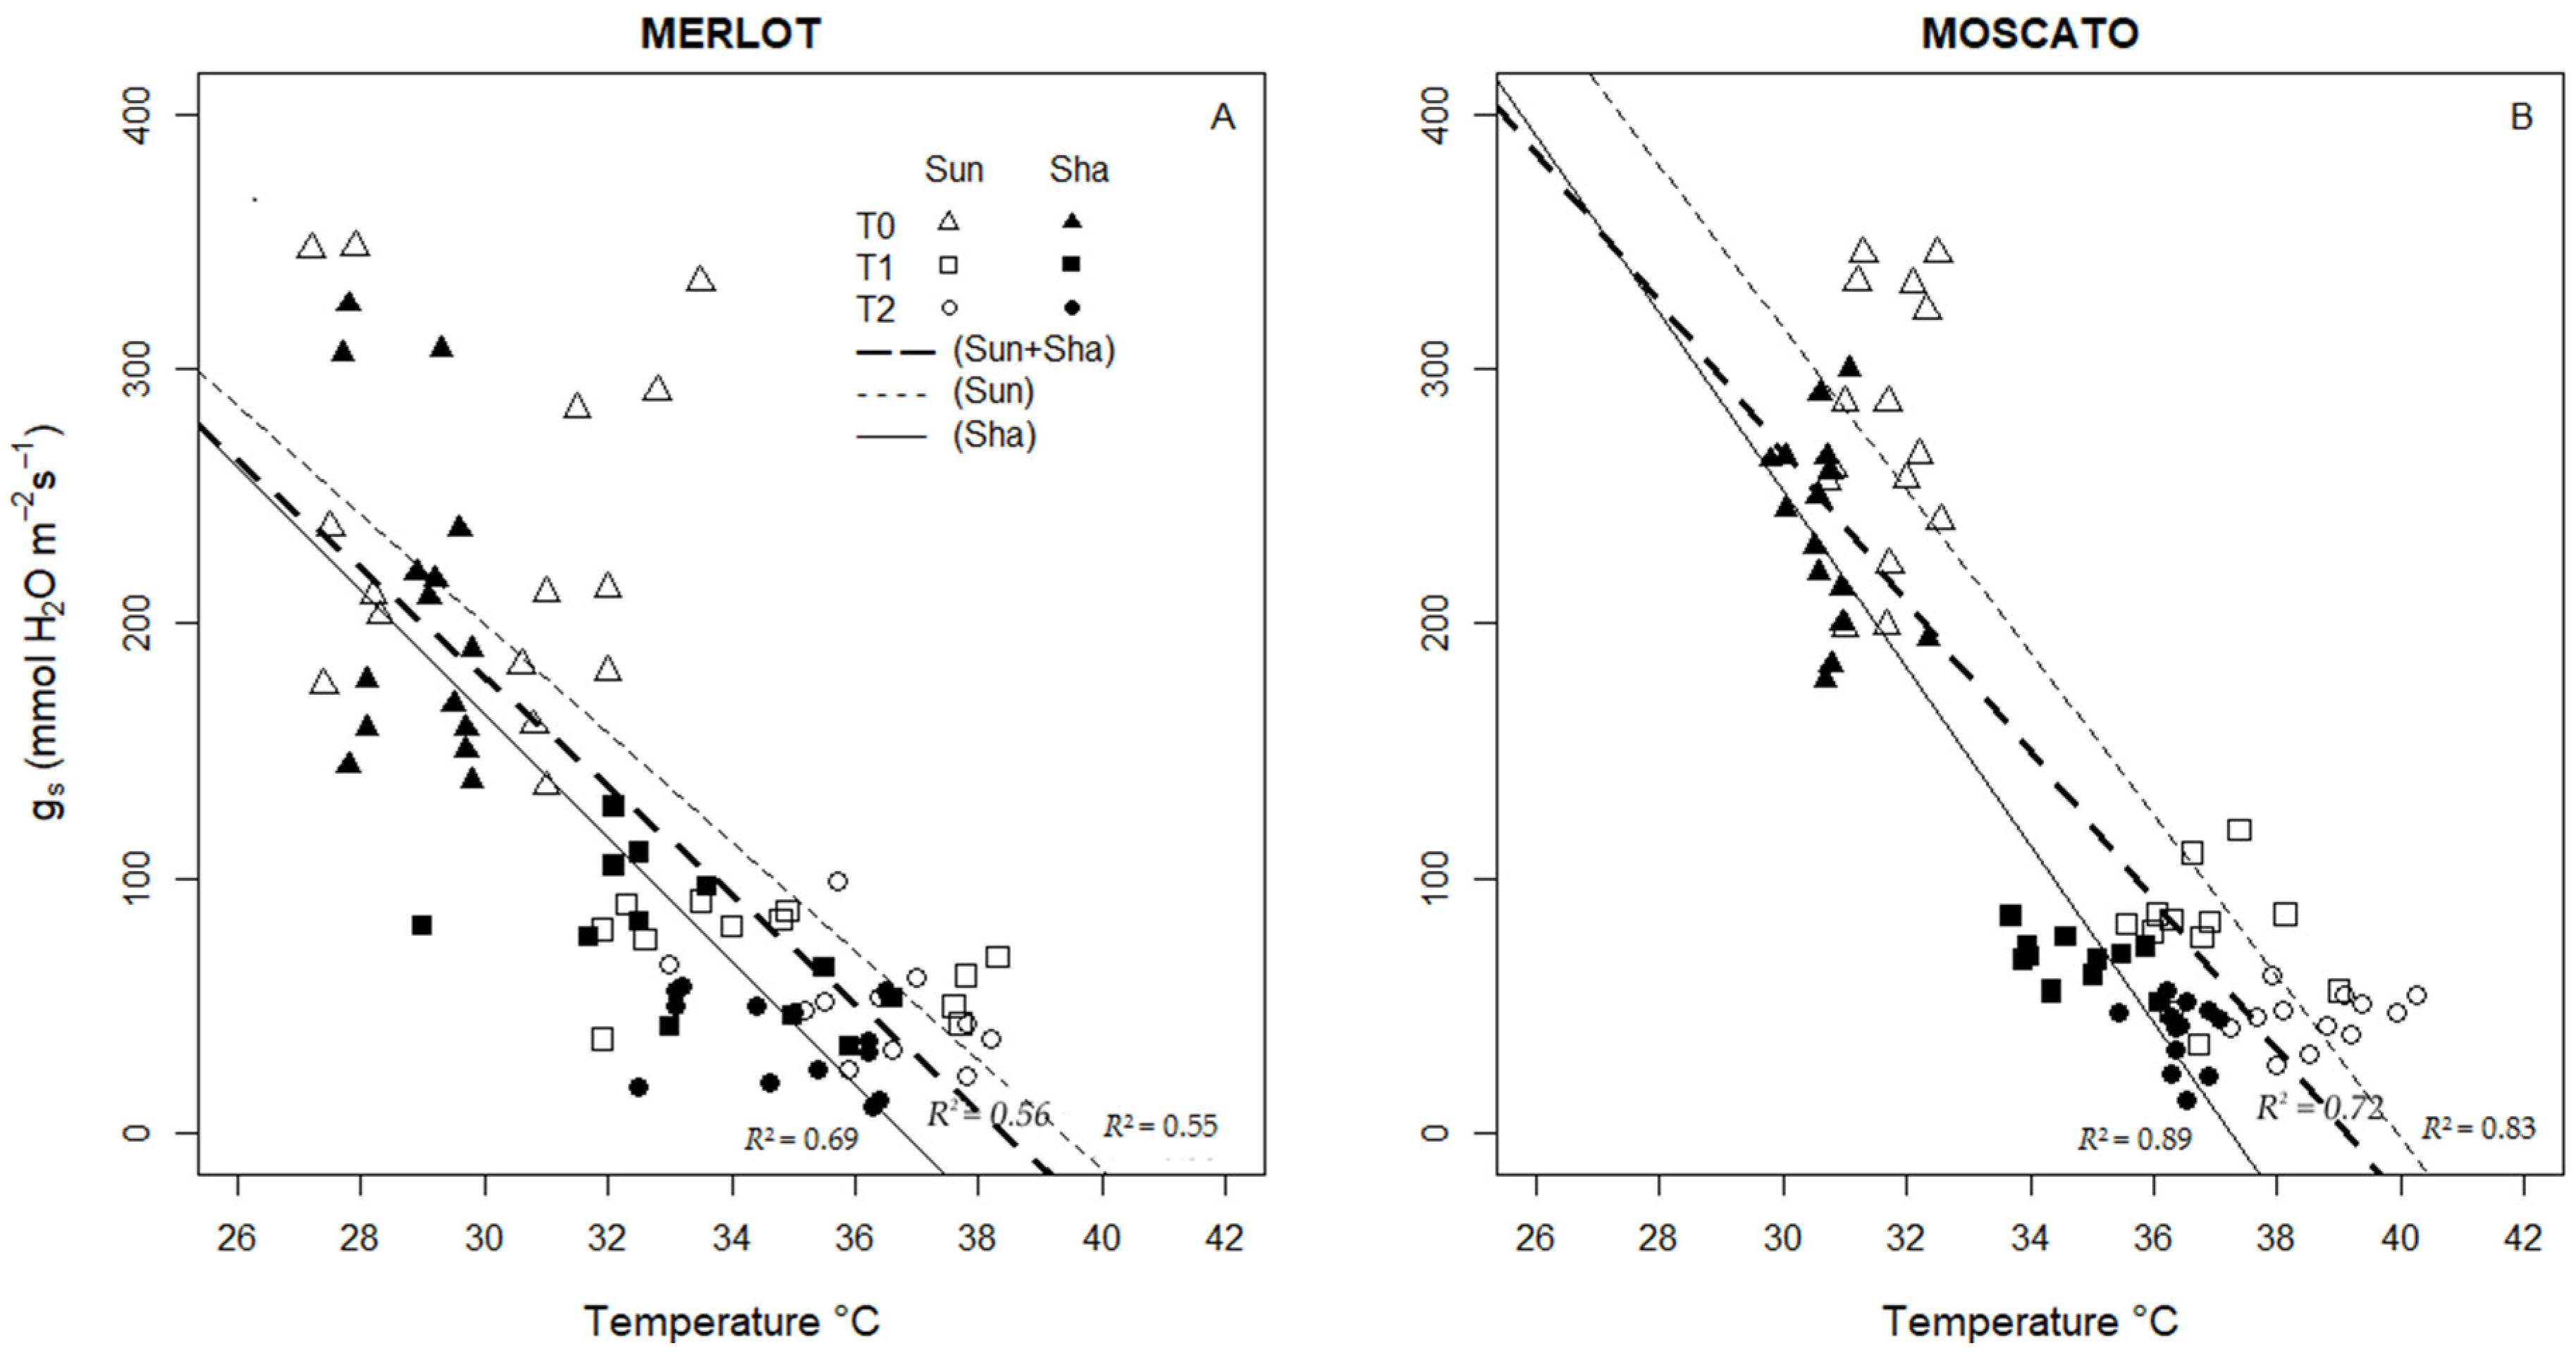
3.3. Gas Exchange Measurements

Similarly to that observed for SWP, the gs in T0 was also always higher than in T1 and T2 in both varieties (Table 2). The values measured in T0 were indicative of non-stress conditions (ranging from 200–500 mmol H2O m−2 s−1 to 150 H2O m−2 s−1). In contrast, gs values in T2, in which irrigation was reduced by 70% compared to T0, were always the lowest and symptomatic of severe stress conditions (gs < 50 mmol H2O m−2 s−1) [18,26,59].
Intermediate gs values were measured in T1 (50% less water applied when compared to T0), associated with medium levels of stress (gs values between 50 mmol and 150 mmol H2O m−2 s−1) [18,26,59]. The daily gs reported in Table S3 showed only two significant differences between the sunlit and shaded portions of the canopy in Merlot and four in Moscato. In agreement with the results reported by Pou et al. [50], these results suggest a minor influence of the sun exposure on this physiological parameter.

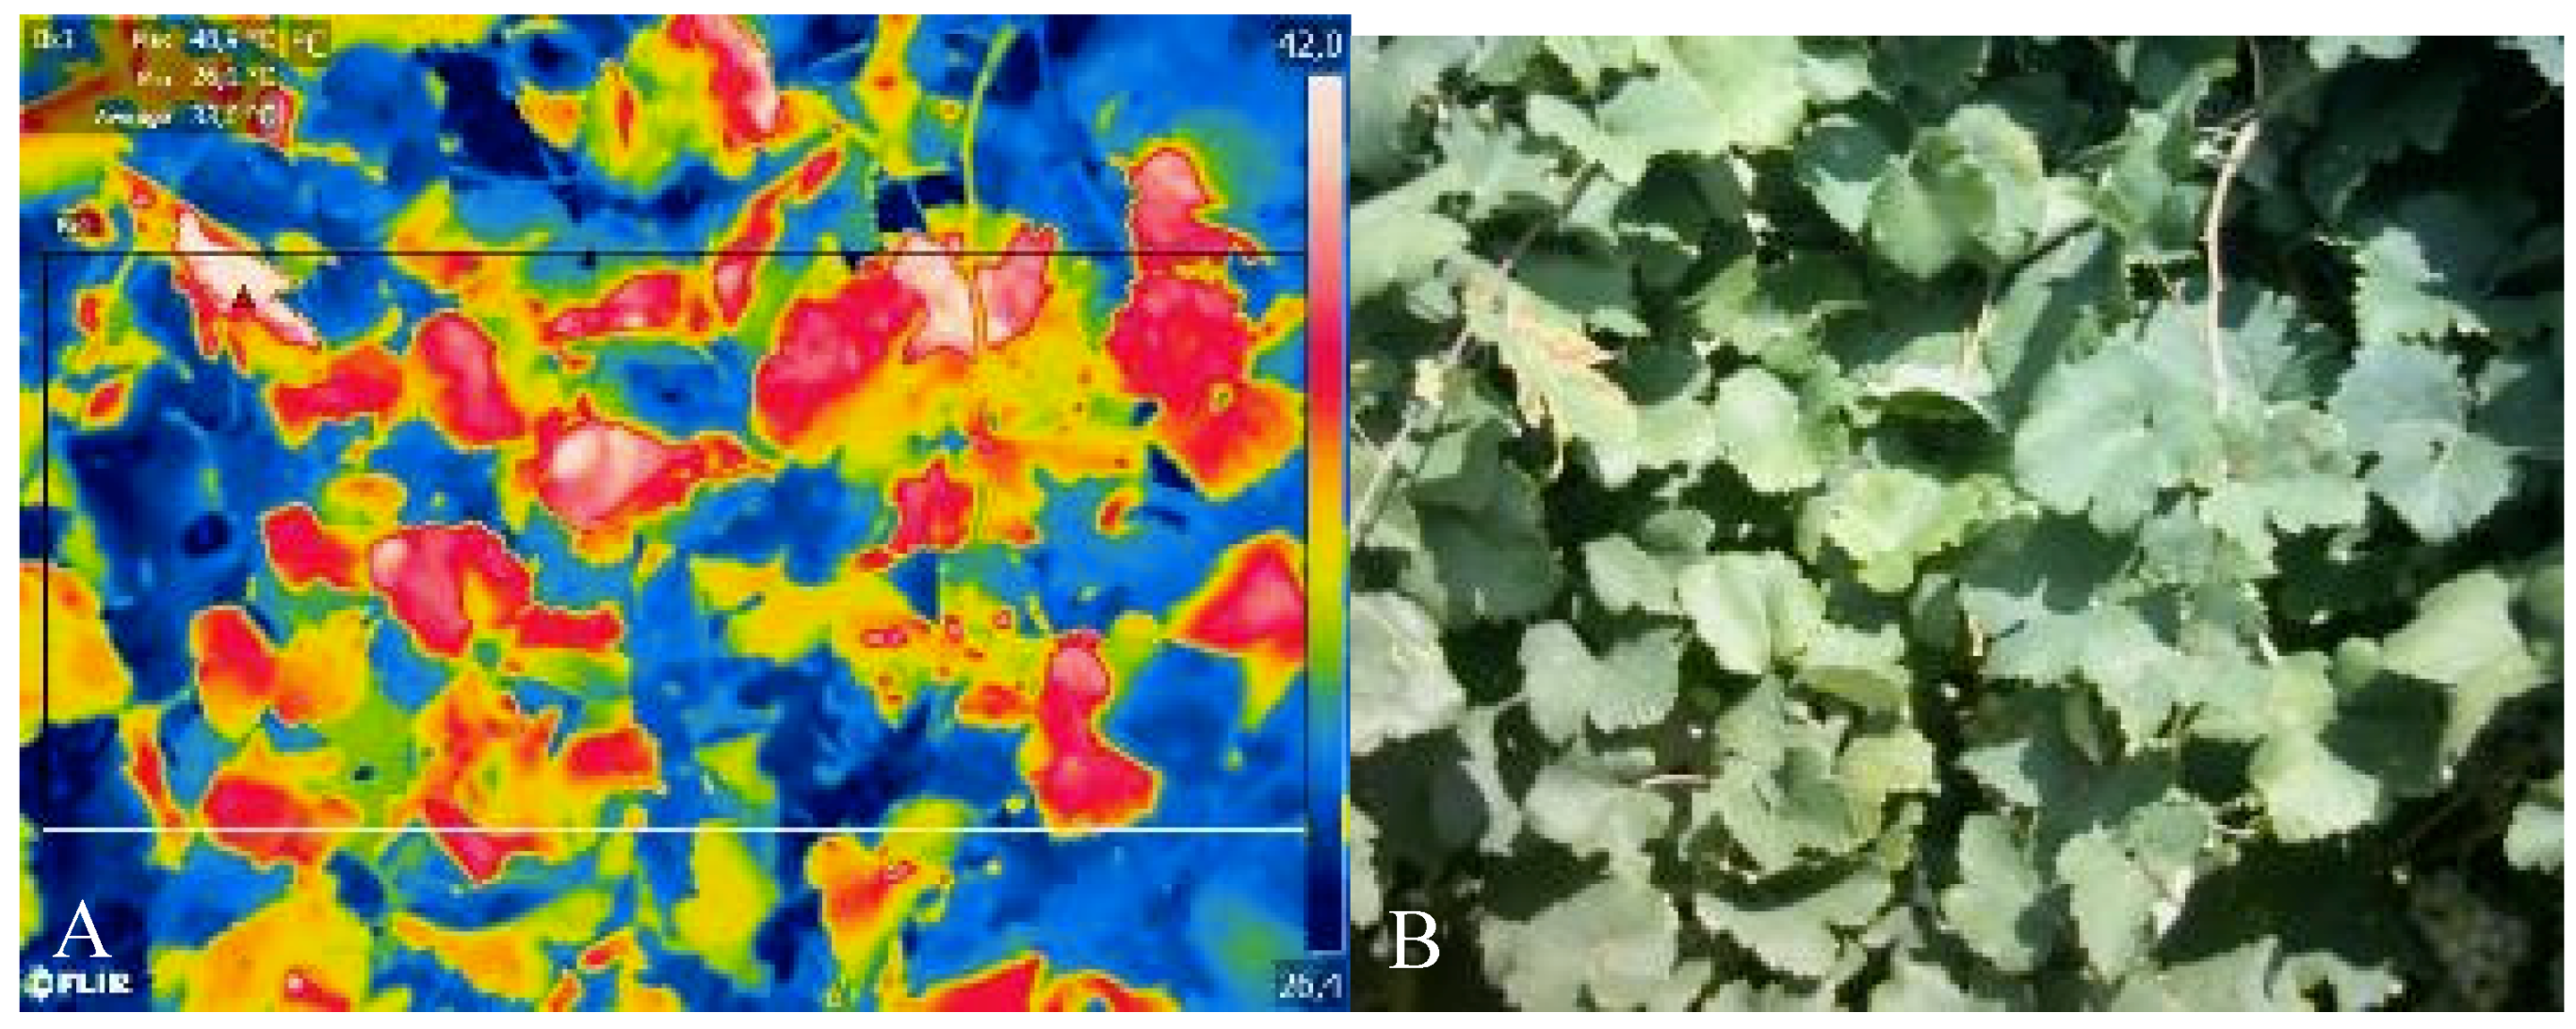
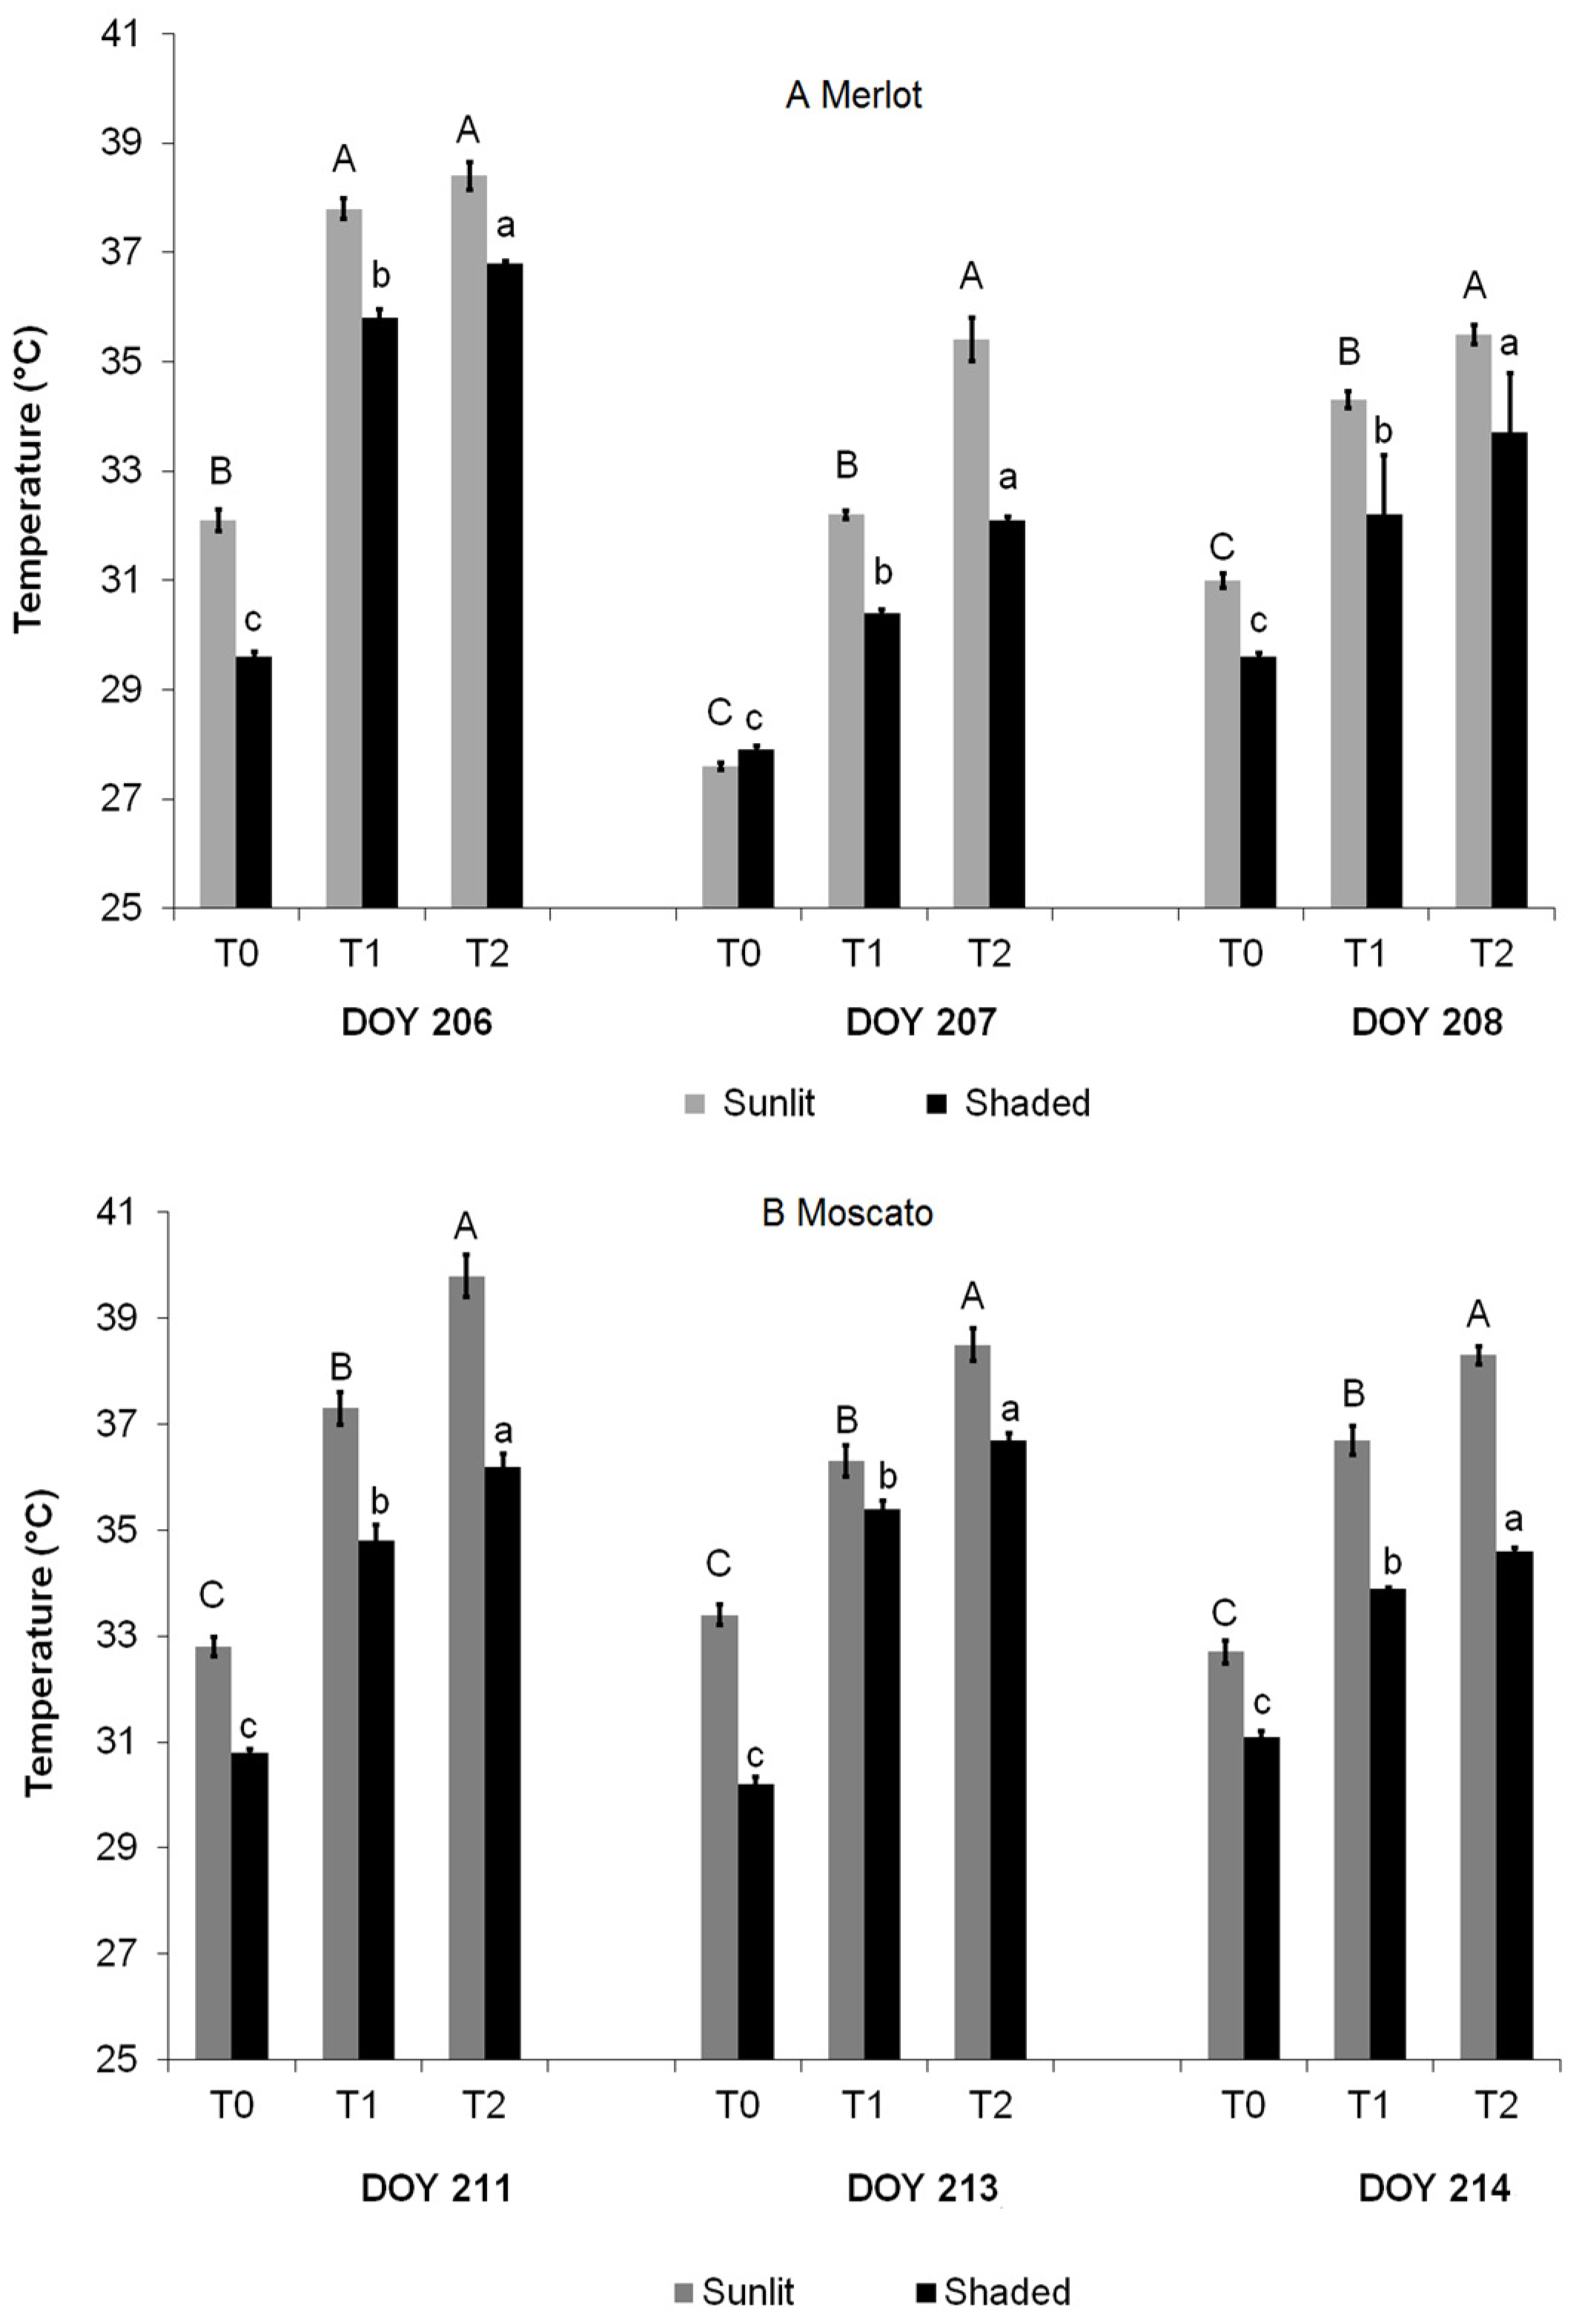
3.4. Infrared Thermography

Canopy thermal images were taken on both the sunlit and shaded portion of the canopy during the hottest part of the day (13:00–14:30), (Figure 3 and Figure S1) on the same plants where the physiological measurements were carried out.
The reference Tdry and Twet temperatures for each variety were taken on both portions of the canopy. Both the leaves painted with water and Vaseline were easy to identify on the thermal image where they appeared in very contrasting colors (red for the non-transpiring leaf and blue for the transpiring leaf) due to the different temperatures reached by the lamina. Table 3 shows that in both varieties, the Tdry was greater than Twet both in the sunlit and shaded portion. Moreover, Tdry and Twet were always higher in the sunlit portion.
When data were analyzed as a whole, without taking into account neither the portion in which the thermal images were acquired nor the day of measurement, in both varieties, the temperature of T0 was lower than that of T1 and T2, subject to water limitation. Moreover, temperatures in T1 were lower than those of T2 (Table S4). This is likely to be due to the higher transpiration measured in well-watered plants (Table 2), which favors heat dissipation, lowering foliar temperature. These results are in agreement with those obtained by Costa et al. [50] in the variety Graciano (Vitis vinifera L.) and by Grant et al. [34] in Castelao and Aragones cultivars (Vitis vinifera L.), who reported temperatures of well-watered vines to be between 3.8 °C and 2.6 °C lower than stressed ones.
Figure 4 depicts the effect of irrigation on canopy temperature during three days of measurement (DOY 206, 207, 208 for Merlot and DOY 211, 213, 214 for Moscato) by also considering the imaged portion (sunlit or shaded). A strong effect of irrigation on the canopy temperature was evident for both varieties with T0 always showing a lower temperature when compared to the other two treatments, and T2 always recording the highest values.
Regardless of the treatment, in both varieties, the sunlit portion of the canopy showed consistently higher temperatures than those of the shaded portion despite, as mentioned before, the lack of notable differences in transpiration between the two portions (Table S5). These data are consistent with those reported by Pou et al. [50] on Graciano variety (Vitis vinifera L.), however no explanation on the reason for these findings was given by the authors. We speculate that the increased leaf temperature in the sunlit portion of the canopy is related to greater absorbed radiation.
For both varieties, leaf temperature and stomatal conductance were negatively and significantly correlated (p ≤ 0.001) (Figure 5). This indicates that in the central hours of the day, when the difference in transpiration between stressed and non-stressed vines was at the maximum, the sensitivity of the thermal images to the different stress levels was very high. In both varieties, the lowest gs values (<120 mmol of H2O m−2 s−1) were associated with higher leaf temperatures, found in T2 and T1.
Canopy temperature well discriminated the irrigation treatments in Moscato, with values between 33.5 °C and 40.2 °C always corresponding to gs ≤ 120 mmol H2O m−2 s−1 in T1 and T2 treatments, and values between 30 °C and 32.5 °C corresponding to gs ≥ 178 mmol H2O m−2 s−1 in T1. In Merlot, temperatures for T1 and T2 ranged between 30 °C and 38.3 °C and corresponded to gs values ≤ 128 mmol H2O m−2 s−1. However, a partial overlap of T0, T1, and T2 treatments was observed for temperatures between 30 °C and 33.5 °C, with gs values ranging between 32 and 330 mmol H2O m−2 s−1. It was also found that the well-watered Merlot vines showed a greater variability in the temperatures of the sunlit and shaded portions when compared to Moscato grown under the same conditions. Overall, in Moscato the effect of the irrigation treatments on the canopy temperature was stronger than that found in Merlot. This was also confirmed by the stronger correlation between leaf temperature and stomatal conductance (R2 = 0.72) when compared to Merlot (R2 = 0.56). In this study Moscato showed a clear separation between T0 and T1–T2 treatments, having higher gs value up to about 32.5 °C in T0, followed by a dramatic decrease in T1 and T2 treatments, likely due to stomatal closure. The trend for Merlot was similar, but not as clear as in Moscato. These results suggest a greater control of stomatal regulation in response to water restriction in Moscato. Drought may induce stomatal closure, increasing leaf temperature due to a reduced heat dissipation through the stomata [19,39]. Such stomatal behavior has been observed in cultivars classified as isohydric, where water saving under drought stress is assured by stomatal closure.
In the light of this, we can speculate that Moscato, when subjected to water restrictions, shows greater stomatal control and its response could be classified as near-isohydric. Further investigations are required to confirm this hypothesis. Other studies [59,60,61] have shown that the iso or near-isohydric varieties respond to water limitations with a rapid stomata closure, causing the reduction of gas exchange and stomatal conductance while SWP shows minor changes. In contrast, the anisohydric varieties have a lower stomatal control and in conditions of water scarcity, they maintain higher photosynthetic rates thanks to the higher gas exchanges, however, the SWP drops to more negative values due to the greater transpiration [59,62,63]. Previous studies indicated an anisohydric behavior for Merlot [64,65], and this might explain the differences in canopy temperature observed in comparison to Moscato vines under similar stress conditions.

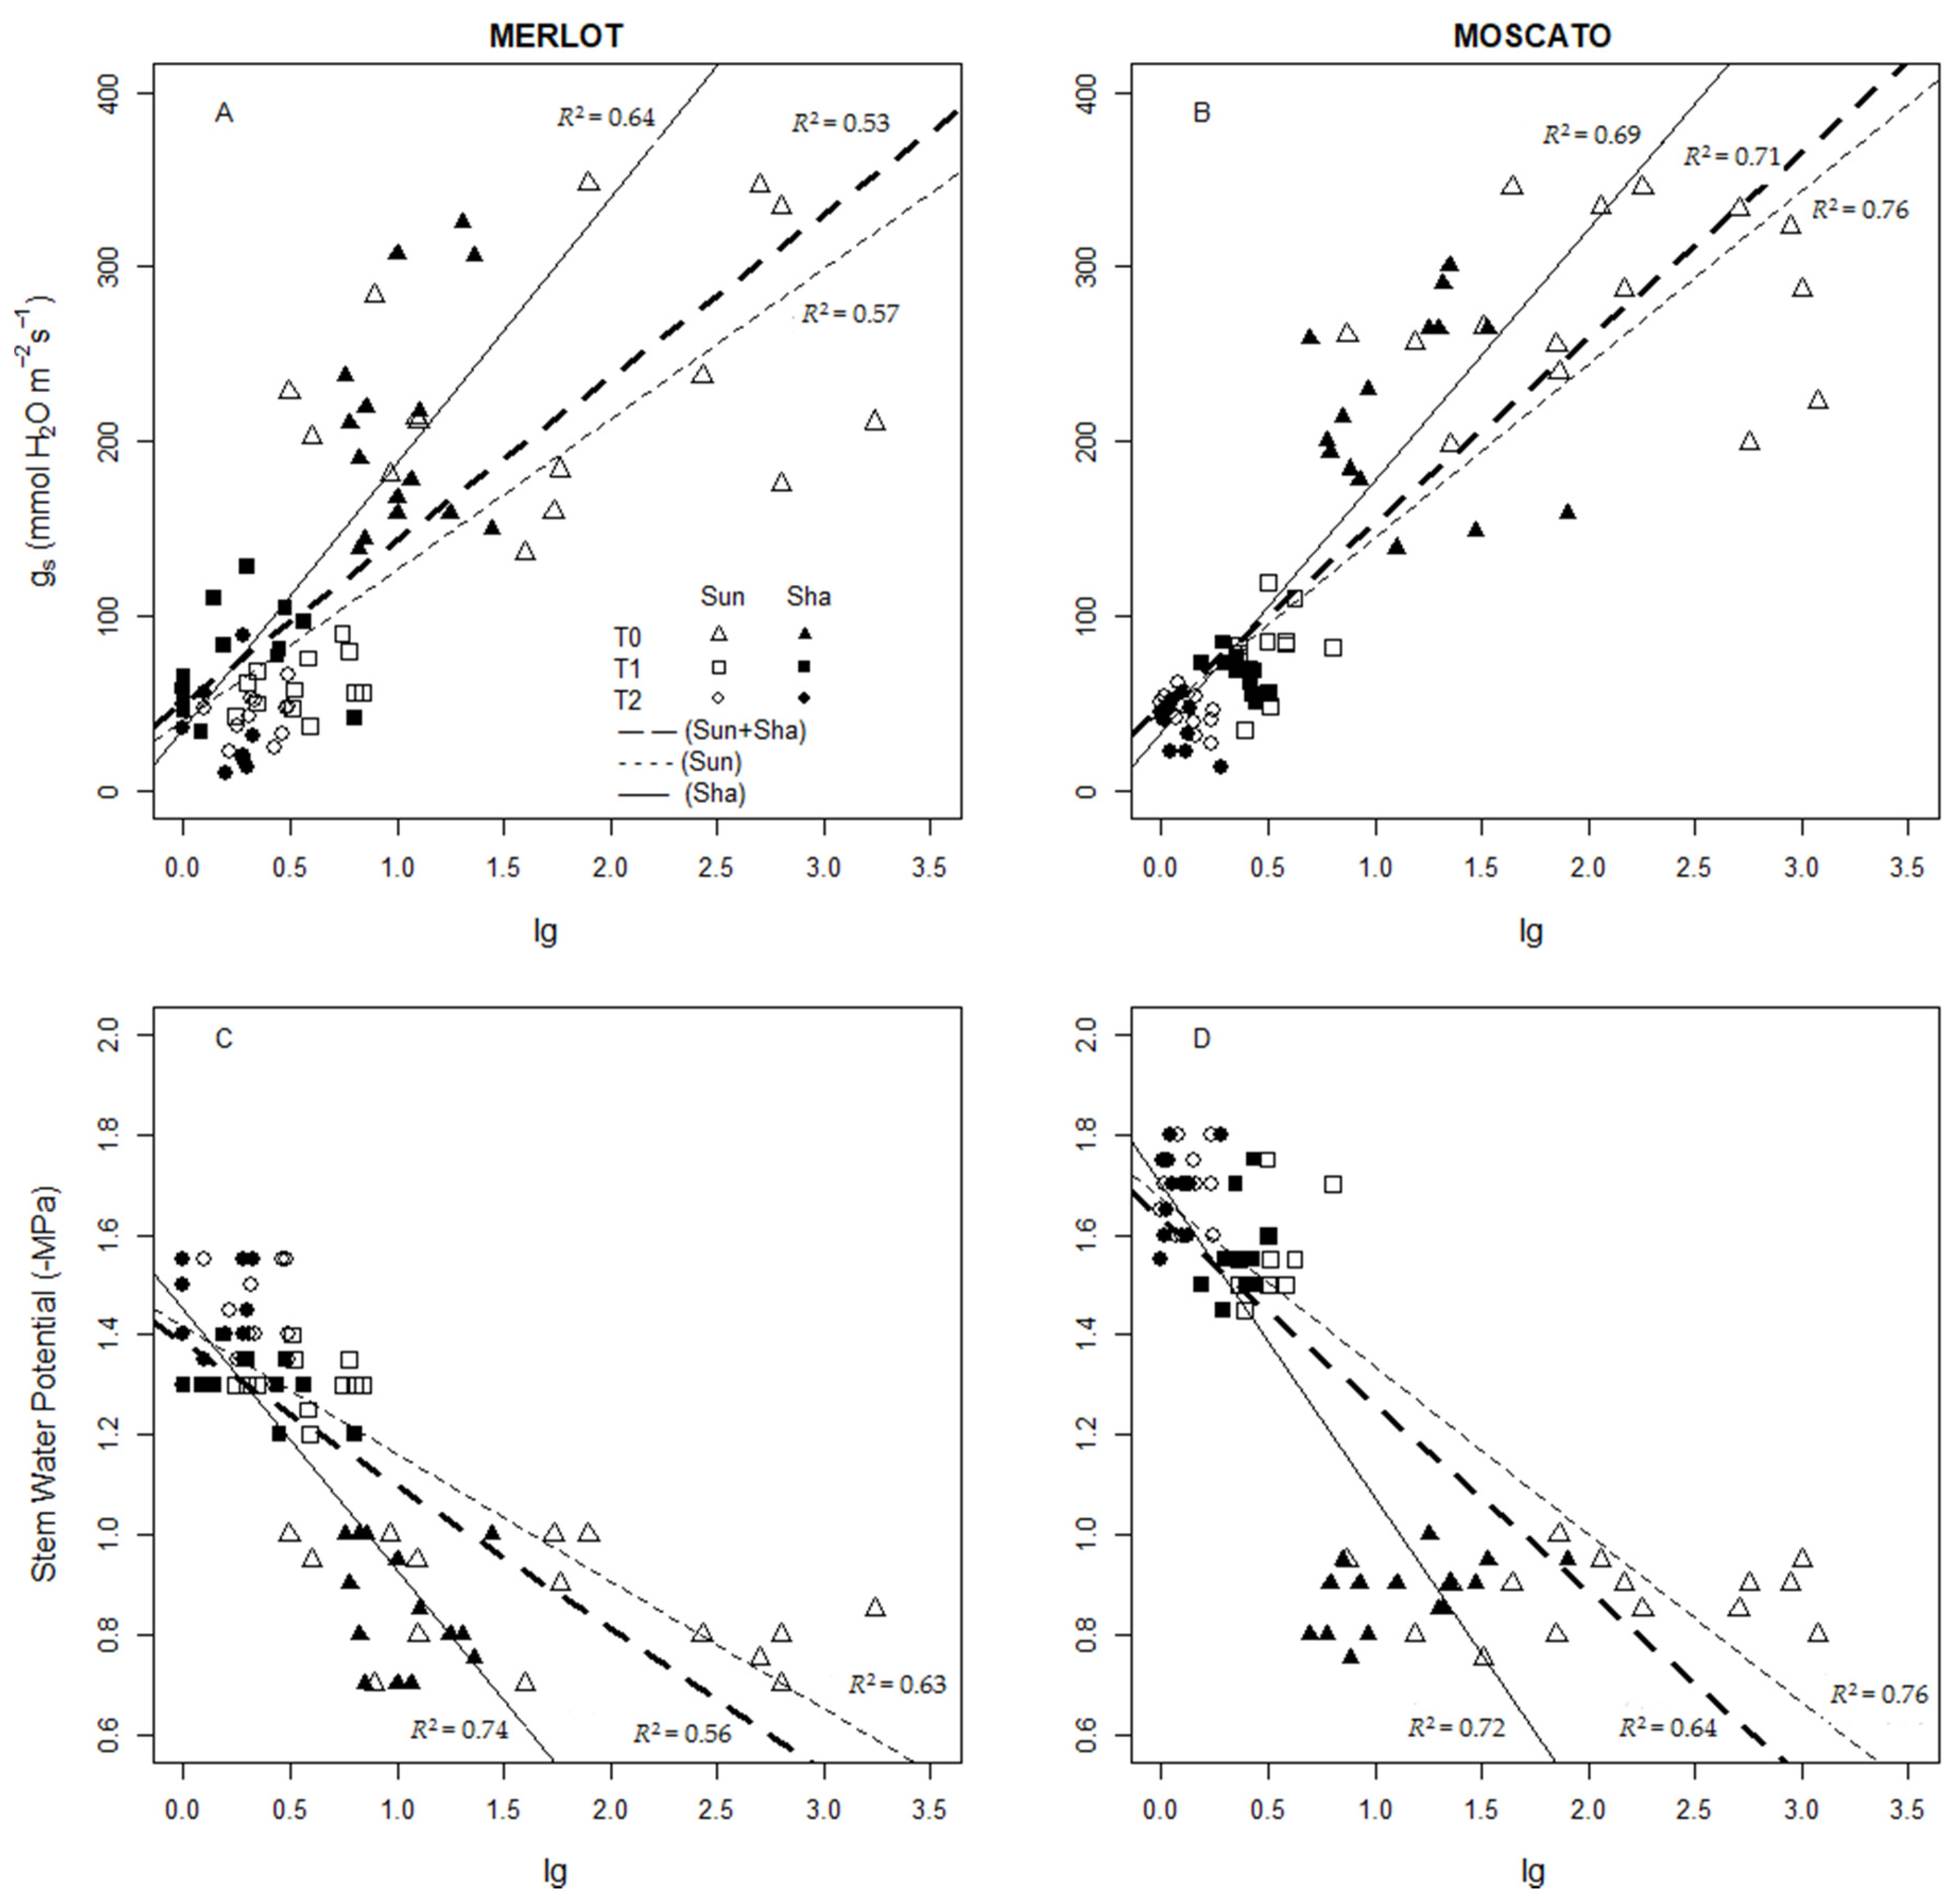
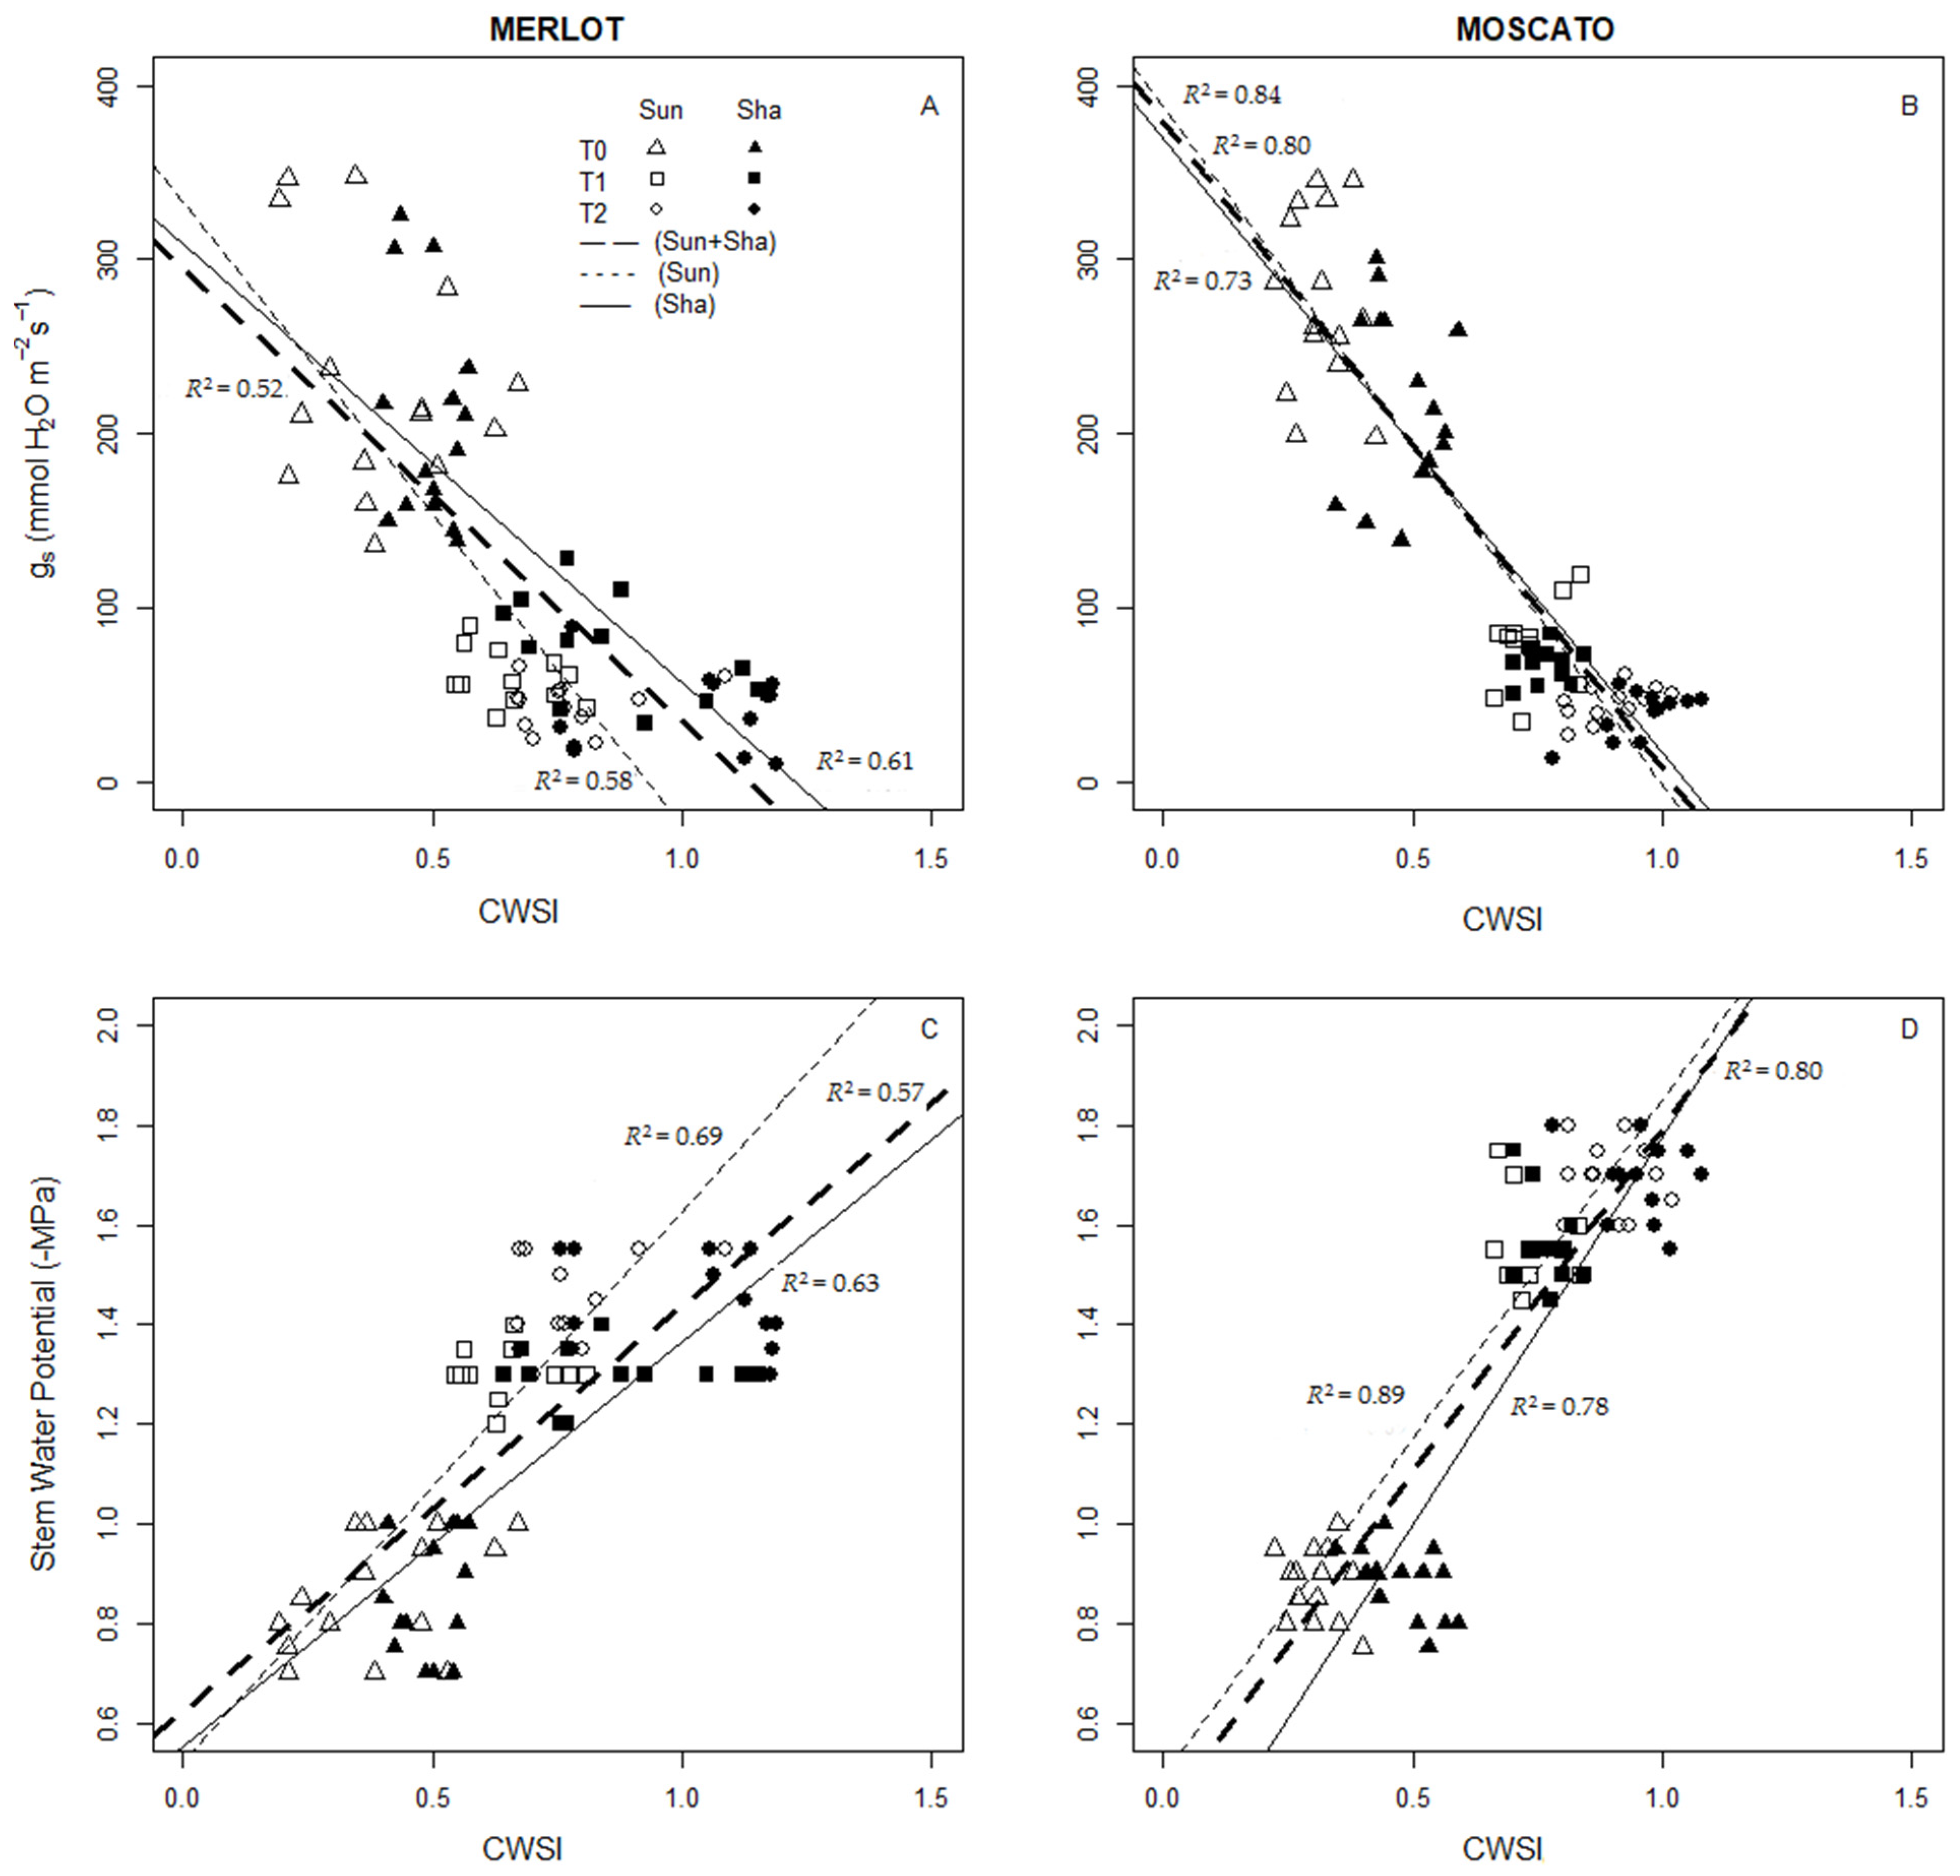
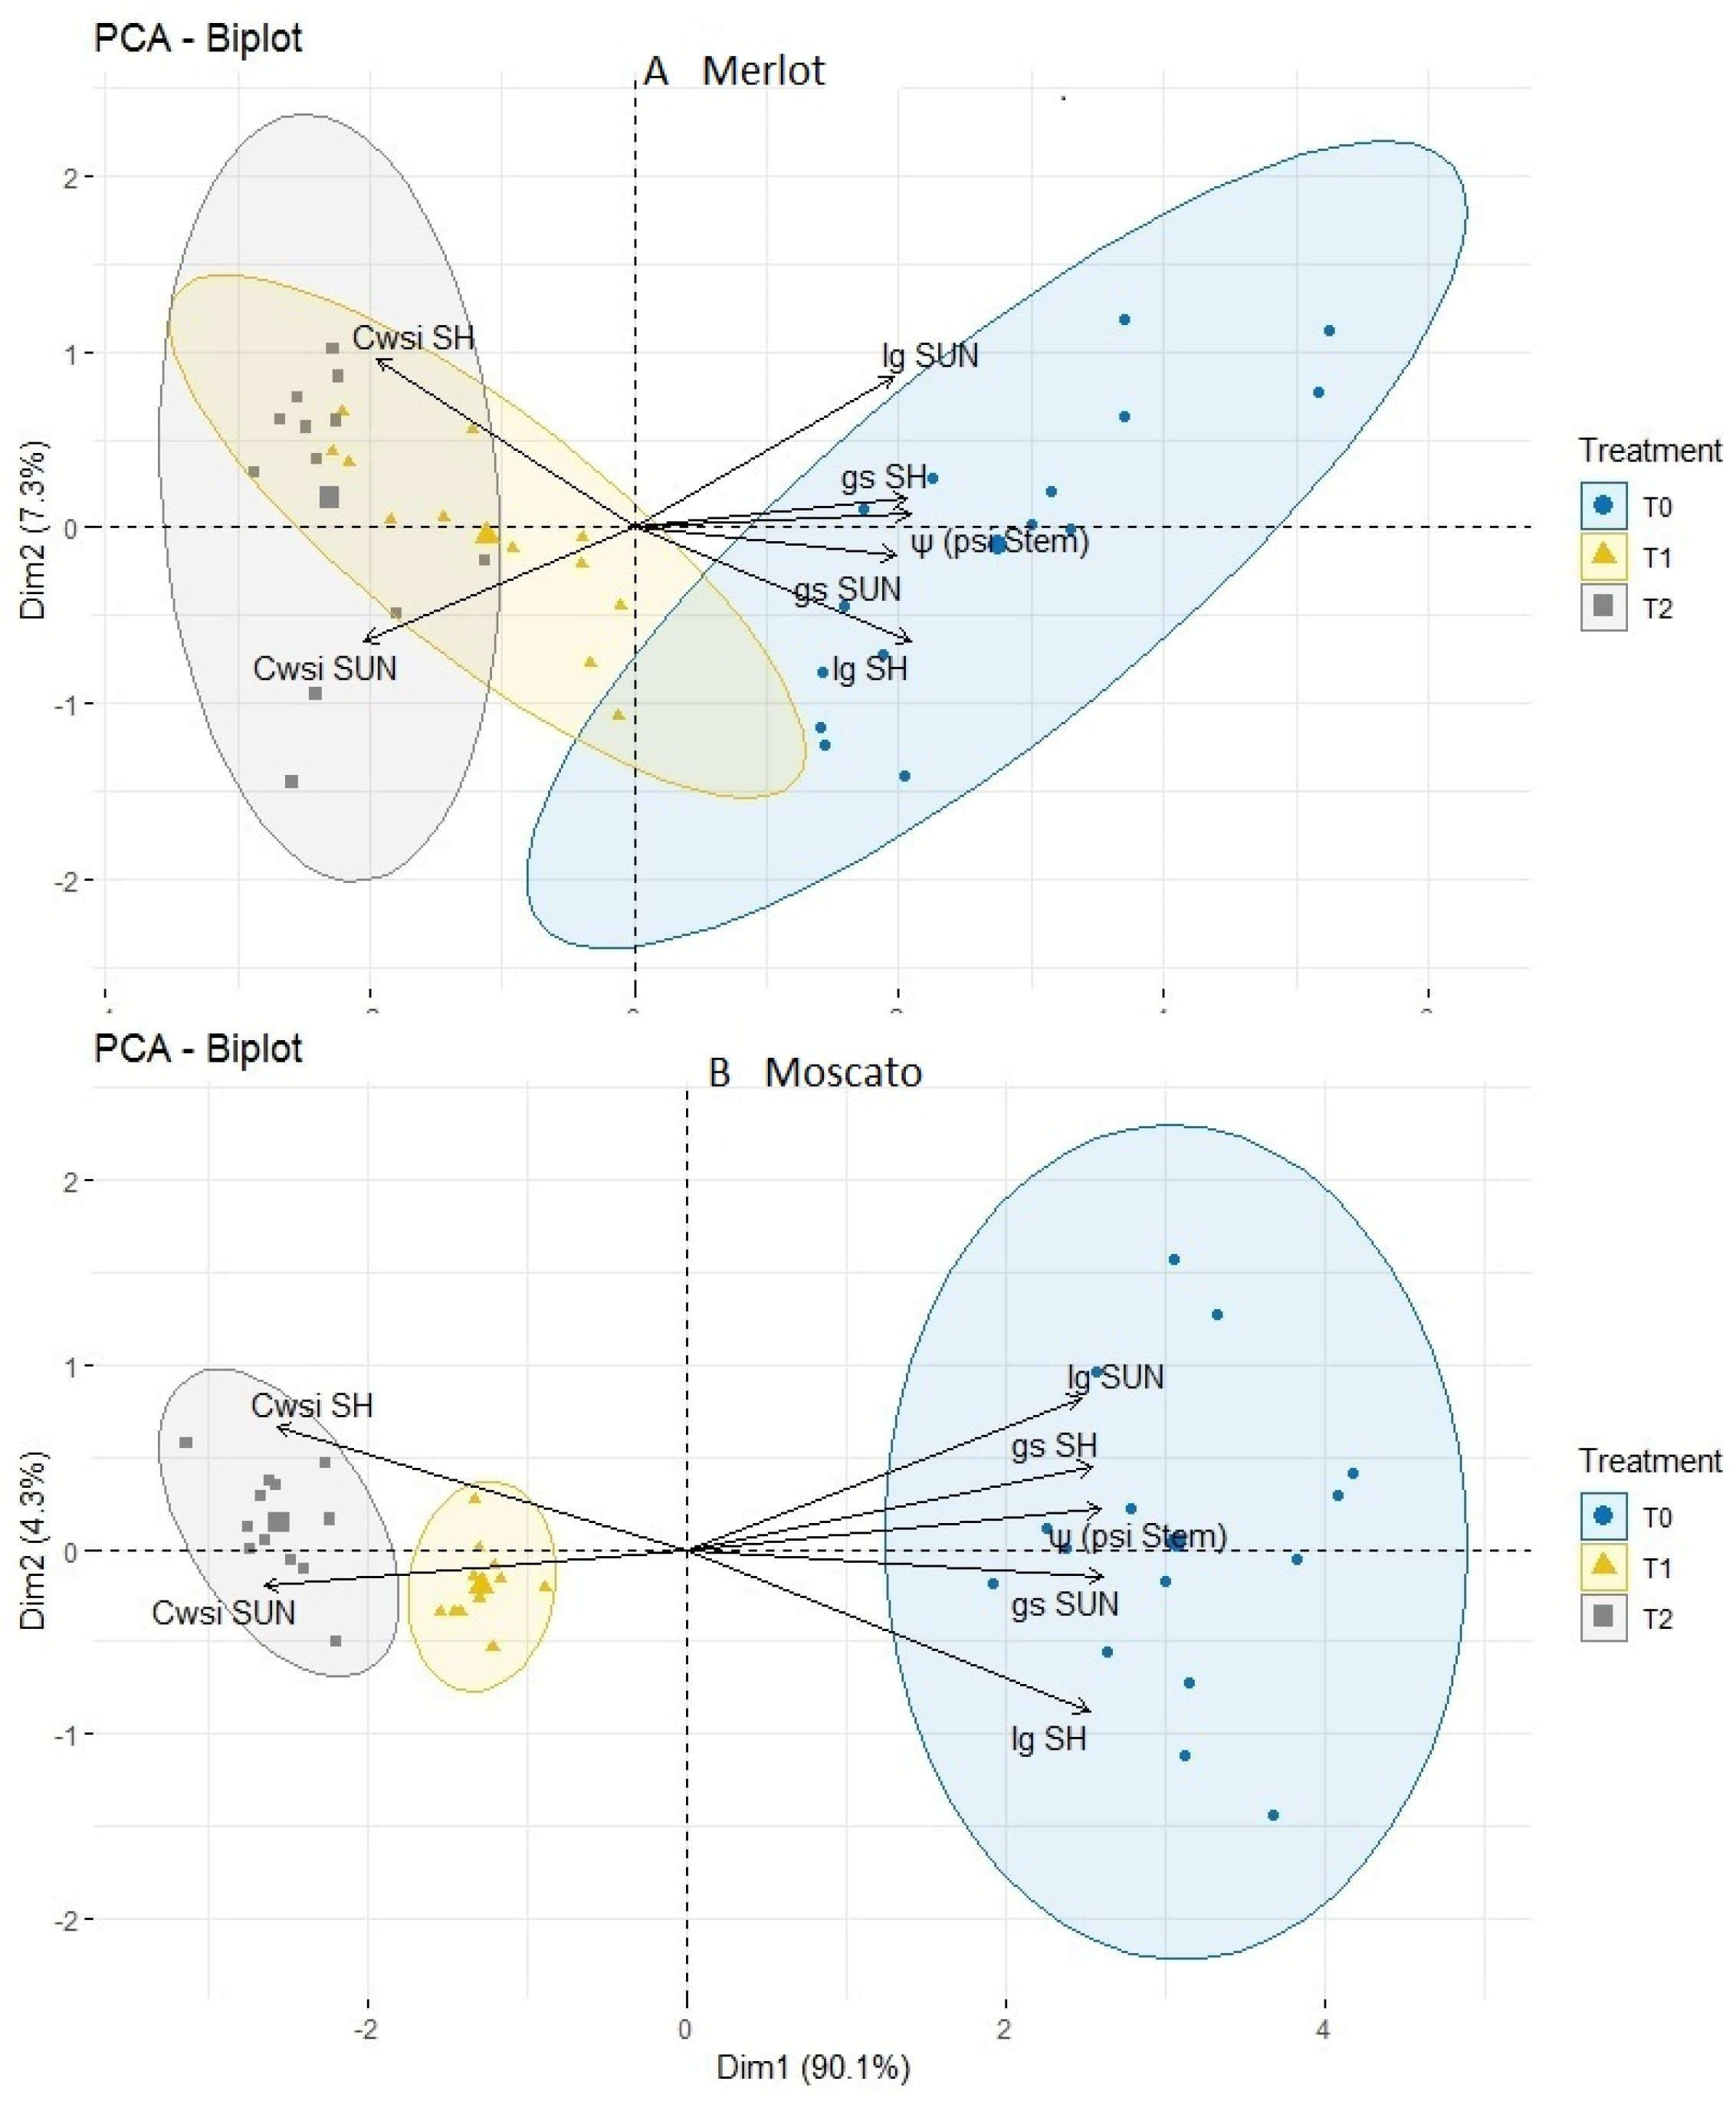
3.5. Thermal Indices: Values and Interaction with Physiological Measurements

In this work, IRT was used as a non-destructive method to assess water status in Merlot and Moscato; for the latter variety, there are no reports of this technique being used before. Previous studies on the use of IRT have used the calculation of water stress indices to measure water status of crops [29,30,31]. As described in the materials and methods, the two most used indices are CWSI, which takes into account the temperature difference of the canopy in non-stress and severe stress conditions and the IG index, which is proportional to stomatal conductance [43]. In this study, CWSI discriminated between the three treatments (T0, T1, and T2) (Table 4) and the physiological measurements confirmed differences in water status between the three treatments. For both varieties and for almost all dates, the analysis of variance returned differences between the three treatments, regardless of the portion of the canopy considered (Table 4). The CWSI for T0 was always lower (or equal) than 0.5 (no stress conditions), while the values for T1 and T2 were indicative of increasing water stress conditions (CWSI ≥ 0. 7–0.8).
The IG index discriminated well between the three irrigation treatments and the values for Merlot and Moscato are shown in Table 5.
The calculated IG values confirmed the stress levels measured through stomatal conductance: non-stress condition in T0 (IG > 0.5; gs between 211 and 254 mmol H2O m−2 s−1 in Merlot and Moscato, respectively), severe stress in T2 (IG < 0.5, gs of about 41 mmol H2O m−2 s−1 in both varieties), intermediate stress for T1 (IG = 0.5 which represents the threshold value that defines the stress classes, gs between 70 and 74 mmol H2O m−2 s−1); other authors have reported similar values for different stress conditions [18,26,58].
Both indices have confirmed the ability to discriminate different levels of water status both in Moscato and in Merlot. Moreover, their robustness has been confirmed through significant correlations with SWP and gs values (Table S6).
Figure 6 depicts the effect of the different water status and exposure on the IG index. In agreement with other studies on thermography [36], the IG index was always positively correlated with stomatal conductance, and in this study, also with SWP in both varieties. In both varieties, IG values > 0.5 were associated with values of gs > 100 mmol H2O m−2 s−1 and SWP greater than −1 MPa to indicate non-stress or low stress levels. IG values < 0.5 were associated with water potential and stomatal conductance values typically found in moderate to severely stressed plants [18,26,58].
In Moscato, the R2 of the IG vs. gs and IG vs. SWP correlations was greater for the values measured in the sunny portion of the canopy (Figure 6B,D and Table S6). In Merlot, on the other hand, higher R2 were obtained on the shaded portion (Figure 6A,C and Table S6). In all cases, R2 values were always >0.57; moreover, in Moscato, they were almost always greater than in Merlot. Furthermore, in T0, the sunny portion showed a wider range of temperatures compared to the shaded portion; this may be caused by the fact that on the shaded portion, all leaves were in the shade while on the sunlit canopy portion, some leaves were completely exposed while others were partially shaded, thus creating a greater variability of the index.
Well-watered vines (T0) showed greater variability of gs (Figure 6A,B) and SWP (Figure 6C,D) on the sunlit canopy portion when compared to the shaded portion. Moreover, IG results were very sensitive to different light conditions and therefore it was not possible to use a single linear relation to calculate either the stomatal conductance or the stem water potential. In order to accurately determine these physiological parameters, it was necessary to use different and exposure-dependent linear regressions.
Negative correlations were found between the CWSI index and gs (Figure 7A,B), in line with previous studies [28,34,66,67,68], and between CWSI and SWP (Figure 7C,D).
CWSI discriminated well between the different water status of the vines, especially in Moscato, where values ≥0.7 corresponded to SWP ≥ −1.45 MPa and gs between 20 and 100 mmol H2O m−2 s−1 (moderate to severe stress), and values between 0.3 and 0.6 corresponded to SWP of between −0.7 and −1 MPa and of gs > 150 mmol H2O m−2 s−1 (well-watered conditions).
Similar to what was observed with the IG index, in Moscato, the highest values were obtained for both physiological measurements on the sunlit portion of the canopy (Figure 7B,D) with the highest R2 obtained for the relationship with SWP (R2 = 0.89). Additionally, for Merlot, negative correlations were found between CWSI and gs (Figure 7A) and between CWSI and SWP (Figure 7C), however, the R2 values were lower than those obtained for Moscato. Previous studies have reported significant correlations between gs and SWP and thermal indices in other crops such as soybean, cotton, and green beans [35,49,69,70].
The effect of different water status (T0, T1, T2) and exposure on the CWSI index deserves further discussion. Contrary to the IG index, CWSI results were more stable in discriminating the different water conditions when applied, overall, showing better accuracy of the estimations. Moreover, this index was also less sensitive to the different exposures, in particular in Moscato. Therefore, CWSI could be used to estimate SWP and gs by applying a single linear regression for all exposures (sun or shaded) without significantly affecting the accuracy of the estimation.
Principal component analysis (PCA) (Figure 8A,B) of the normalized physiological measures and calculated thermal indices highlighted a clear separation of the three irrigation treatments in Moscato, while in Merlot, an overlap of the T1 and T2 treatments was observed. In Moscato, a clear separation of the treatments was evident along the first principal component (PC), which explains 90.1% of the variation in the dataset. This variation is driven by the low CWSI values of T2 on one side and the high values of the physiological measures associated to T0 in the other. PC2 only explains 4% of the variation and is mostly associated with differences in IG index between the sunlit and shaded portion of the canopy in T0. The PCA plot also highlights and confirms the strong negative correlations found between CWSI and gs and SWP, while IG was confirmed to be positively correlated to the same physiological measures.
For Merlot, the separation between treatments along the first PC was not as clear as in Moscato. The first PC explains 82.3% of the dataset variation and the separation is driven by differences in CWSI and physiological measurements among the treatments. PC2 explains 7.3% of the variation and in this case, explains the differences in CWSI, and IG to a lesser extent, between the sunny and shaded portion of the canopy.
Previous studies have already shown the effectiveness of IRT in monitoring grapevine water status, however little (for Merlot) to nothing (for Moscato) is so far known about the response of these two varieties to the IRT technique. The results from this study, obtained by applying the technique in the central hours of the day (between 13:00 and 14:30) demonstrate that in both varieties, thermography can be used to define vine water status and that the variation of stomatal conductance and stem water potential can be predicted through the use of thermal images. In Moscato, which showed a clearer response to the applied irrigation treatments, IRT was more efficient in discriminating vine water status compared to Merlot. In this variety, the correlations between the physiological variables and the thermal indices were, on average, higher than in Merlot. This highlights that the efficacy of the technique is variety-dependent. Moreover, it is hypothesized that infrared thermography may be more efficient in varieties with isohydric or near-isohydric behavior, as Moscato is supposed to be, rather than in aniso- or near-anisohydric varieties such as Merlot [63,65]. This study showed that both the thermal indices (CWSI and IG) were consistent with the different stress levels in both varieties since they were representative of the changes observed in stomatal conductance and stem water potential. However, given the higher correlations observed between CWSI and physiological measures, this index appears more efficient in estimating vine water status. Moreover, compared to IG, the calculated CWSI values were less dispersed around the average regression line, indicating a lower sensitivity of the index to the different light conditions (shaded portion/sunlit portion). This was more evident in Moscato.

4. Conclusions

The present work carried out on Merlot and Moscato has provided important insight on two key aspects of infrared thermography: the choice of the most appropriate thermal index and the portion of the canopy on which to acquire the images (sunlit or shaded).
This study has demonstrated that infrared images taken in the central hours of the day (13:00–14:30) allow for a good estimation of the water status for Merlot and Moscato. The crop water stress index (CWSI) and stomatal conductance index (IG) were both able to differentiate treatments subject to different irrigation and classify the water status from null to moderate and severe stress. Overall, the crop water stress index was a more reliable indicator of water status given the higher significance of the correlations with stomatal conductance and stem water potential (particularly detected in the variety Moscato). Moreover, this index was less sensitive than IG to IRT data from sunlit vs. shaded portions of the canopy. The stomatal conductance index (IG), on the other hand, was more influenced by the canopy portion in which the image was taken, and its variability increased in conditions of moderate stress, thus making it less accurate than the CWSI.
This study also demonstrated that the variety, together with the used index, influences the decision on the appropriate canopy portion to image. In Moscato, where the response to the irrigation treatments was more pronounced, the efficiency of the water state discrimination of both CWSI and IG was superior.
In conclusion, the results from this work will assist future research on infrared thermography aimed at developing the technique further. This study also showed for the first time that the effectiveness of thermography is variety-dependent.

Supplementary Materials

The following are available online at https://0-www-mdpi-com.brum.beds.ac.uk/2073-4395/9/12/821/s1, Table S1: Net photosynthesis; Table S2: Net photosynthesis by canopy portion (sunlit or shaded); Table S3: Stomatal conductance; Table S4: Leaf temperature; Table S5: Transpiration; Table S6: Thermal indices. Figure S1: Thermal images.

Author Contributions

Conceptualization, N.B., F.G., and W.C.; Data curation, R.V. and N.B.; Formal analysis, L.L. and N.B.; Investigation, N.B. and R.V.; Methodology, L.L., W.C., and F.G.; Software, L.L.; Supervision, F.G.; Writing—original draft, N.B.; Writing—review & editing, W.C., D.T., R.d.B. F.M. and F.G.

Funding

This research received no external funding.

Acknowledgments

The authors thank Massimo Gardiman for his kind support in the statistical analysis.

Conflicts of Interest

The authors declare no conflicts of interest.

References

  1. IPCC. 2013: Allegato III: Glossario. In Climate Change 2013: The Physical Science Basis; Planton, S., Ed.; Cambridge University Press: Cambridge, UK; New York, NY, USA, 2013; ISBN 978-92-9169-138-8. [Google Scholar]
  2. Maracchi, G.; Sirotenko, O.; Bindi, M. Impacts of present and future Climate Variability on Agricolture and Forestry in the Temperate Regions: Europe. Clim. Chang. 2005, 70, 117–135. [Google Scholar] [CrossRef]
  3. Luterbacher, J.; Xoplaki, E.; Casty, C.; Wanner, H.; Pauling, A.; Küttel, M.; Brönnimann, S.; Fischer, E.; Fleitmann, D.; Gonzalez-Rouco, F.J.; et al. Mediterranean climate variability over the last centuries: A review. In The Mediterranean Climate: An Overview of the Main Characteristics and Issues; Lionello, P., Malanotte-Rizzoli, B., Eds.; Elsevier: Amsterdam, The Netherlands, 2006; pp. 27–148. [Google Scholar]
  4. Petit, J.R.; Jouzel, J.; Raynaud, D.; Barkov, N.I.; Barnola, J.M.; Basile, I.; Bender, M.; Chappellaz, J.; Davis, M.; Delaygue, G.; et al. Climate and atmospheric history of the past 420,000 years from the Vostok ice core, Antarctica. Nature 1999, 399, 429–436. [Google Scholar] [CrossRef]
  5. Miranda, P.M.A.; Valente, M.A.; Tomé, A.R.; Trigo, R.; Coelho, M.F.E.S.; Aguiar, A.; Azevedo, E.B. O clima de Portugal nos se´culos XX e XXI. In Alteracxao es Clima´ticasem Portugal; Cena´rios, Impactes e Medidas de Adaptacxao; Santos, F.D., Miranda, P., Eds.; Gradiva: Lisboa, Portugal, 2006; pp. 45–113. [Google Scholar]
  6. Moriondo, M.; Jones, G.; Bois, B.; Dibari, C.; Ferrise, R.; Trombi, G.; Bindi, M. Projected shifts of wine regions in response to climate change. Clim. Chang. 2013, 119, 825–839. [Google Scholar] [CrossRef]
  7. Hannah, L.; Roehrdanz, P.; Ikegami, M.; Shepard, A.; Shaw, M.; Tabor, G.; Zhi, L.; Marquet, P.A.; Hijmans, R. Climate change, wine, and conservation. Proc. Natl. Acad. Sci. USA 2013, 110, 6907–6912. [Google Scholar] [CrossRef] [PubMed]
  8. Schultz, H.R. Climate change and viticulture: A European perspective on climatology, carbon dioxide and UV B effects. Aust. J. Grape Wine Res. 2000, 6, 2–12. [Google Scholar] [CrossRef]
  9. Schultz, H.; Jones, G. Climate Induced Historic and Future Changes in Viticulture. J. Wine Res. 2010, 21, 137–145. [Google Scholar] [CrossRef]
  10. Jones, G.V.; Davis, R.E. Climate influences on grapevine phenology, grape composition, and wine production and quality for Bordeaux, France. Am. J. Enol. Vitic. 2000, 51, 249–261. [Google Scholar]
  11. Meier, N.; Rutishauer, T.; Pfister, C.; Wanner, H.; Luterbacher, J. Grape harvest dates as a proxy for Swiss April to August temperature reconstruction back to AD 1480. Geophys. Res. Lett. 2007, 34, l20705. [Google Scholar] [CrossRef]
  12. Chuine, I.; Yiou, P.; Viovy, N.; Seguin, B.; Daux, V.; Le Roy Ladurie, E. Historical phenology: Grape ripening as a past climate indicator. Nature 2004, 432, 289–290. [Google Scholar] [CrossRef]
  13. Fila, G.; Tomasi, D.; Gaiotti, F.; Jones, G.V. The Book of Vinesprouts of Kőszeg (Hungary): A documentary source for reconstructing spring temperatures back to the eighteenth century. Int. J. Biometeorol. 2016, 60, 207–219. [Google Scholar] [CrossRef]
  14. Tomasi, D.; Jones, G.V.; Giust, M.; Lovat, L.; Gaiotti, F. Grapevine Phenology and Climate Change: Relationships and Trends in the Veneto Region of Italy for 1964–2009. Am. J. Enol. Vitic. 2011, 62, 329–339. [Google Scholar] [CrossRef]
  15. Fraga, H.; García de Cortázar Atauri, I.; Malheiro, A.; Santos, J. Modelling climate change impacts on viticultural yield, phenology and stress conditions in Europe. Glob. Chang. Biol. 2016, 22, 3774–3788. [Google Scholar] [CrossRef] [PubMed]
  16. Fraga, H.; Santos, J.A.; Moutinho–Pereira, J.; Carlos, C.; Silvestre, J.; Eiras-Dias, J.; Mota, T.; Malheiro, A.C. Statistical modelling of grapevine phenology in Portuguese wine regions: Observed trends and climate change projections. J. Agric. Sci. 2016, 154, 795–811. [Google Scholar] [CrossRef]
  17. Schultz, H.R.; Stoll, M. Some critical issues in environmental physiology of grapevines: Future challenges and current limitations. Aust. J. Grape Wine Res. 2010, 16, 4–24. [Google Scholar] [CrossRef]
  18. Medrano, H.; Escalona, J.M.; Bota, J.; Gulías, J.; Flexas, J. Regulation of photosynthesis of C3 plants in response to progressive drought: Stomatal conductance as a reference parameter. Ann. Bot. 2002, 89, 895–905. [Google Scholar] [CrossRef]
  19. Medrano, H.; Escalona, J.M.; Cifre, J.; Bota, J.; Flexas, J. A ten-year study on the physiology of two Spanish grapevine varieties under field conditions: Effects of water availability from leaf photosynthesis to grape yield and quality. Funct. Plant Biol. 2003, 30, 607–619. [Google Scholar] [CrossRef]
  20. Palliotti, A.; Tombesi, S.; Silvestroni, O.; Lanari, V.; Gatti, M.; Poni, S. Changes in vineyard establishment and canopy management urged by earlier climate-related grape ripening. Sci. Hortic. 2014, 178, 43–54. [Google Scholar] [CrossRef]
  21. Chonè, X.; Van Leeuwen, C.; Dubourdieu, D.; Gaugaudillere, J.P. Stem Water Potential is a Sensitive Indicator of Grapevine Water Status. Ann. Bot. 2001, 87, 477–483. [Google Scholar] [CrossRef]
  22. Pisciotta, A.; Di Lorenzo, R.; Santalucia, G.; Barbagallo, M. Response of grapevine (Cabernet Sauvignon cv) to above ground and subsurface drip irrigation under arid conditions. Agric. Water Manag. 2018, 197, 122–131. [Google Scholar] [CrossRef]
  23. Dry, P.R.; Loveys, B.R.; McCarthy, M.G.; Stoll, M. Strategic irrigation management in Australian vineyards. J. Int. Sci. Vigne Vin 2001, 35, 129–139. [Google Scholar] [CrossRef]
  24. Escalona, J.; Flexas, J. Stomatal and non-stomatal limitations of photosynthesis under water stress in field-grown grapevines. Aust. J. Plant Physiol. 2000, 26, 421–433. [Google Scholar] [CrossRef]
  25. Tanner, C.B. Plant Temperatures. Agron. J. 1963, 55, 210–211. [Google Scholar] [CrossRef]
  26. Cifre, J.; Bota, J.; Escalona, J.M.; Medrano, H.; Flexas, J. Physiological tools for irrigation scheduling in grapevine (Vitis vinifera L.). An open gate to improve water-use efficiency? Agric. Ecosyst. Environ. 2005, 106, 159–170. [Google Scholar] [CrossRef]
  27. Jones, H.G. Irrigation scheduling: Advantages and pitfalls of plant-based methods. J. Exp. Bot. 2004, 55, 2427–2436. [Google Scholar] [CrossRef] [PubMed]
  28. Jones, H.G.; Stoll, M.; Santos, T.; De Sousa, C.; Chaves, M.M.; Grant, O.M. Use of infrared thermography for monitoring stomatal closure in the field: Application to grapevine. J. Exp. Bot. 2002, 53, 2249–2260. [Google Scholar] [CrossRef] [PubMed]
  29. Idso, S.B.; Jackson, R.D.; Pinter, P.J.; Reginato, R.J.; Hatfield, J.L. Normalizing thestress-degree-day parameter for environmental variability. Agric. Meteorol. 1981, 24, 45–55. [Google Scholar] [CrossRef]
  30. Jackson, R.D.; Idso, S.B.; Reginato, R.J.; Pinter, P.J. Canopy Temperature as a Crop Water Stress Indicator. Water Resour. Res. 1981, 17, 1133–1138. [Google Scholar] [CrossRef]
  31. Jones, H.G. Use of thermography for quantitative studies of spatial and temporal variation of stomatal conductance over leaf surfaces. Plant Cell Environ. 1999, 22, 1043–1055. [Google Scholar] [CrossRef]
  32. Jones, H.G.; Leinonen, I. Thermal imaging for the study of plant water relations. J. Agric. Meteorol. 2003, 59, 205–217. [Google Scholar] [CrossRef]
  33. Grant, O.M.; Tronina, L.; Jones, H.G.; Chaves, M.M. Optimizing thermal imaging as a technique for detecting stomatal closure induced by drought stress under green-house conditions. Physiol. Plant 2006, 127, 507–518. [Google Scholar] [CrossRef]
  34. Grant, O.M.; Tronina, L.; Jones, H.G.; Chaves, M.M. Exploring thermal imaging variables for the detection of stress responses in grapevine under different irrigation regimes. J. Exp. Bot. 2007, 58, 815–825. [Google Scholar] [CrossRef] [PubMed]
  35. Fuentes, S.; De Bei, R.; Pech, J.; Tyerman, S. Computational water stress indices obtained from thermal image analysis of grapevine canopies. Irrig. Sci. 2012, 30, 523–536. [Google Scholar] [CrossRef]
  36. Costa, J.M.; Ortuno, M.F.; Lopes, C.M.; Chaves, M.M. Grapevine variety exhibiting differences in stomatal response to water deficit. Funct. Plant Biol. 2012, 39, 179–189. [Google Scholar] [CrossRef]
  37. Chaerle, L.; Van der Straeten, D. Imaging techniques and the early detection of plant stress. Trends Plant Sci. 2000, 5, 495–501. [Google Scholar] [CrossRef]
  38. Oerke, E.C.; Steiner, U.; Dehne, H.W.; Lindenthal, M. Thermal imaging of cucumber leaves affected by downy mildew and environmental conditions. J. Exp. Bot. 2006, 57, 2121–2132. [Google Scholar] [CrossRef] [PubMed]
  39. Winkel, T.; Rambal, S. Influence of water stress on grapevines growing in the field: From leaf to whole-plant response. Aust. J. Plant Physiol. 1993, 20, 143–157. [Google Scholar] [CrossRef]
  40. Hetherington, A.M.; Woodward, I. The role of stomata in sensing and driving environmental change. Nature 2003, 424, 901–908. [Google Scholar] [CrossRef]
  41. Gates, D.M. Transpiration and leaf temperature. Ann. Rev. Plant Physiol. 1964, 19, 211–238. [Google Scholar] [CrossRef]
  42. Downton, W.J.S.; Loveys, B.R.; Grant, W.J.R. Non-uniformstomatal closure induced by water stress causes putative non-stomatal inhibition of photosynthesis. New Phytol. 1988, 110, 503–509. [Google Scholar] [CrossRef]
  43. Jones, H.G. Use of infrared thermometry for estimation of stomatal conductance as a possible aid to irrigation scheduling. Agric. For. Meteorol. 1999, 95, 139–149. [Google Scholar] [CrossRef]
  44. Jones, H.G. Plants and Microclimate, 2th ed.; Cambridge University Press: Cambridge, UK, 1992; p. 428. [Google Scholar]
  45. Guilioni, L.; Jones, H.G.; Leinonen, I.; Lhomme, J.P. On the relationships between stomatal resistance and leaf temperatures in thermography. Agric. Meteorol. 2008, 148, 1908–1912. [Google Scholar] [CrossRef]
  46. Idso, S.B.; Roselyne, I.; Abutaleb, K.; Ahmed, F. Non-water-stressed baselines: A key to measuring and interpreting plant water stress. Agric. Meteorol. 1982, 27, 59–70. [Google Scholar] [CrossRef]
  47. Leinonen, I.; Jones, H.G. Combining thermal and visible imagery for estimating canopy temperature and identifying plant stress. J. Exp. Bot. 2004, 55, 1423–1431. [Google Scholar] [CrossRef] [PubMed] [Green Version]
  48. Zia, S.; Spohrer, K.; Merkt, N.; Wenyong, D.; Xiongkui, H.; Muller, J. Non invasive water status detection in grapevine. Int. J. Agric. Biol. Eng. 2009, 2, 46–54. [Google Scholar]
  49. Costa, J.M.; Grant, O.M.; Chaves, M.M. Use of thermal imaging in viticulture: Current application and future prospects. In Methodologies and Results in Grapevine Research; Delrot, S., Medrano, H., Or, E., Bavaresco, L., Grando, S., Eds.; Springer: Berlin, Germany, 2010; pp. 135–150. [Google Scholar]
  50. Pou, A.; Diago, M.P.; Medrano, H.; Baluja, J.; Tardaguila, J. Validation of thermal indices for water status identification in grapevine. Agric. Water Manag. 2014, 134, 60–72. [Google Scholar] [CrossRef]
  51. Schultz, H.R. Differences in hydraulic architecture account for near-isohydric and anisohydric behaviour of two field-grown Vitis vinifera L. cultivars during drought. Plant Cell Environ. 2003, 26, 1393–1405. [Google Scholar] [CrossRef]
  52. Vandeleur, R.K.; Mayo, G.; Shelden, M.C.; Gilliham, M.; Kaiser, B.N.; Tyerman, S.D. The role of plasma membrane intrinsic protein aquaporins in water transport through roots: Diurnal and drought stress responses reveal different strategies between isohydric and anisohydric cultivars of grapevine. Plant Physiol. 2009, 149, 445–460. [Google Scholar] [CrossRef] [Green Version]
  53. Scholander, P.F.; Hammel, H.T.; Hemmingsen, E.A.; Bradstreet, E.D. Hydrostschultzatic pressure and osmotic potential in leaves of mangroves and some other plants. Proc. Natl. Acad. Sci. USA 1964, 52, 119–125. [Google Scholar] [CrossRef] [Green Version]
  54. Begg, J.E.; Turner, N.C. Water potential gradients in field tobacco. Plant Physiol. 1970, 46, 343–346. [Google Scholar] [CrossRef] [Green Version]
  55. Jones, H.G. Application of thermal imaging and infrared sensing in plant physiology and ecophysiology. Adv. Bot. Res. 2004, 41, 107–163. [Google Scholar]
  56. Qiu, G.Y.; Momi, K.; Yano, T. Estimation of plant transpiration by imitation leaf temperature (I). Theoretical consideration and field verification. Trans. Jpn. Soc. Irrig. 1996, 63, 401–410. [Google Scholar]
  57. Jones, H.G.; Aikman, D.; McBurney, T.A. Improvements to infrared thermometry for irrigation scheduling in humid climates. Acta Hortic. 1997, 449, 259–266. [Google Scholar] [CrossRef]
  58. Williams, L.E.; Arujo, F.J. Correlations among predawn leaf, midday leaf, and midday stem water potential and their correlations with other measures of soil and plant water status in Vitis vinifera. J. Am. Soc. Hortic. Sci. 2002, 127, 448–454. [Google Scholar] [CrossRef] [Green Version]
  59. Deloire, A.; Heyns, D. The Leaf Water Potentials: Principles, Method and Thresholds. Available online: https://www.researchgate.net/publication/259589941 (accessed on 20 December 2011).
  60. Flexas, J.; Escalona, J.M.; Evain, S.; Gulías, J.; Moya, I.; Osmond, C.B.; Medrano, H. Steady-state chlorophyll fluorescence (Fs) measurements as a tool to follow variations of net CO2 assimilation and stomatal conductance during water-stress in C3 plants. Physiol. Plant. 2002, 114, 231–240. [Google Scholar] [CrossRef] [PubMed] [Green Version]
  61. Tardieu, F.; Simonneau, T. Variability among species of stomatal control under fluctuating soil water status and evaporative demand: Modelling isohydric and anisohydric behaviours. J. Exp. Bot. 1998, 49, 419–432. [Google Scholar] [CrossRef] [Green Version]
  62. Lovisolo, C.; Perrone, I.A.; Carra, A.; Ferrandino, A.; Flexas, J.; Medrano, H.; Schubert, A. Drought-induced changes in development and function of grapevine (Vitis spp.) organs and in their hydraulic and non-hydraulic interactions at the whole-plant level: A physiological and molecular update. Funct. Plant Biol. 2010, 37, 98–116. [Google Scholar] [CrossRef]
  63. Soar, C.J.; Speirs, J.; Maffei, S.M.; Penrose, A.B.; McCarthy, M.G.; Loveys, B.R. Grape vine arieties Shiraz and Grenache differ in their stomatal response to VPD: Apparent links with ABA physiology and gene expression in leaf tissue. Aust. J. Grape Wine Res. 2006, 12, 2–12. [Google Scholar] [CrossRef]
  64. Williams, L.E.; Baeza, P. Relationships among ambient temperature and vapor pressure deficit and leaf and stem water potentials of fully irrigated, field-grown grapevines. Am. J. Enol. Vitic. 2007, 58, 173–181. [Google Scholar]
  65. Shellie, K.; Glenn, D.M. Wine grape response to kaolin particle film under deficit and well-watered conditions. Acta Hortic. 2008, 792, 587–591. [Google Scholar] [CrossRef]
  66. Zia, S.; Wenyong, D.; Spreer, W.; Spohrer, K.; Xiongkui, H.; Müller, J. Assessing crop water stress of winter wheat by thermography under different irrigation regimes in North China Plain. Int. J. Agric. Biol. Eng. 2012, 5, 24–34. [Google Scholar]
  67. Leinonen, I.; Grant, O.M.; Tagliavia, C.P.P.; Chaves, M.M.; Jones, H.G. Estimating stomatal conductance with thermal imagery. Plant Cell Environ. 2006, 29, 1508–1518. [Google Scholar] [CrossRef] [PubMed]
  68. Moller, M.; Alchanatis, V.; Cohen, Y.; Meron, M.; Tsipris, J.; Naor, A.; Ostrovsky, V.; Sprintsin, M.; Cohen, S. Use of thermal and visible imagery for estimating crop water status of irrigated grapevine. J. Exp. Bot. 2006, 58, 827–838. [Google Scholar] [CrossRef] [PubMed] [Green Version]
  69. Inoue, Y.; Kimball, B.A.; Jackson, R.D.; Pinter, P.J.; Reginato, R.J. Remote estimation of leaf transpiration rate and stomatal resistance based on infrared thermometry. Agric. For. Meteorol. 1990, 51, 21–33. [Google Scholar] [CrossRef]
  70. Inoue, Y.; Sakuratani, T.; Shibayama, M.; Morinaga, S. Remote and real-time sensing of canopy transpiration and conductance-comparison of remote and stem flow gauge methods in soybean canopies as affected by soil water status. Jpn. J. Crop Sci. 1994, 63, 664–670. [Google Scholar] [CrossRef] [Green Version]
Figure 1. Average monthly rainfall (histograms) and temperature (lines) calculated for the growing season 2018 (black histogram and continuous line) and for the long-term average (LTA, 1959–2017) (black and white histogram and dashed line). Data from the weather station of the CREA-VE Conegliano, Italy.
Agronomy 09 00821 g001
Figure 2. Midday stem water potential (SWP) measured on the varieties Merlot (A) and Moscato (B) subjected to three irrigation treatments: well-irrigated, 100% water usage replenished daily (T0) (continuous line); 50% of the water usage replenished daily (T1) (dashed line); and 30% of water usage replenished daily (T2) (dotted line). Arrows indicate the days when the thermal images were acquired. Different letters correspond to significant differences in water potential between treatments within each date (NKS test p ≤ 0.05).
Agronomy 09 00821 g002
Figure 3. Canopy thermal image (A) and corresponding RGB image (B). The images were taken on the Moscato variety from a distance of 1 m using a FLIR infrared camera (resolution 640 × 480 pixels). Different colors in the image on the (left) correspond to different temperatures.
Agronomy 09 00821 g003
Figure 4. Leaf temperature in Merlot (A) and Moscato (B) measured on the sunlit (in grey) and shaded (in black) portions of the canopy in the three irrigation treatments (T0 = well-irrigated, 100% water usage replenished daily; T1 = medium water stress, 50% of the water usage replenished daily; and T2 = severe water stress, 30% of water usage replenished daily). Statistical analysis was done by date, variety, and portion of the canopy. Capital letters correspond to differences between treatments within the sunlit portion of the canopy and lower case letters correspond to differences between treatments within the shaded ones (NKS test p ≤ 0.05).
Agronomy 09 00821 g004
Figure 5. Relationship between canopy temperature and stomatal conductance (gs) measured between 13:00 and 14:30 h during the trial carried out between July and August 2018. Each point corresponds to a single measure. R2 values and significance (p < 0.001), n = 90.
Agronomy 09 00821 g005
Figure 6. Relationship between stomatal conductance index (IG) and stomatal conductance in Merlot (A) and Moscato (B) and between stomatal conductance index (IG) and stem water potential in Merlot (C) and Moscato (D) for the sunlit portion of the canopy (open symbols) and in the shade (full symbols). Each point corresponds to a single vine. R2 values and significance (p < 0.001). n = 45. The bold dashed line represents the average linear regression, considering the entire dataset.
Agronomy 09 00821 g006
Figure 7. Relationship between CWSI and stomatal conductance in Merlot (A) and Moscato (B) and between CWSI and stem water potential in Merlot (C) and Moscato (D) for the sunlit portion of the canopy (open symbols) and in the shade (full symbols). Each point corresponds to a single vine. R2 values and significance (p < 0.001). n = 45. The bold dashed line represents the average linear regression, considering the entire dataset.
Agronomy 09 00821 g007
Figure 8. Principal component analysis (PCA) of the normalized physiological measures (stomatal conductance, gs, and midday stem water potential, SWP) and the calculated thermal indices crop water stress index (CWSI) and IG for the two varieties studied: Merlot (A) and Moscato (B). CSWI, IG, and gs were also separated according to the portion of the canopy they were measured: sunlit (SUN) and shaded (SH). Different colors separate data from the three irrigation treatments (T0 = well-irrigated, 100% water usage replenished daily (blue); T1 = average water stress, 50% of the water usage replenished daily (Yellow); and T2 = severe water stress, 30% of water usage replenished daily (grey).
Agronomy 09 00821 g008
Table 1. Weather conditions (solar radiation, relative humidity, wind speed, average daily temperature, and vapor pressure deficit (VPD)) measured at the weather station of the CREA-VE, (Conegliano, Italy) during the trial period (DOY (Day of Year) 200 to 214).
CultivarDOYSolar Radiation (W m−2)Relative Humidity (%)Wind Speed (km h−1)Average Air Temperature (°C)VPD (KPa)
Merlot206831314.527.52.5
Merlot207731294.524.61.3
Merlot208851425.026.82.1
Moscato211772334.929.02.5
Moscato213820347.029.92.8
Moscato214795325.027.72.7
Table 2. Stomatal conductance (gs) measured in the three irrigation treatments.
Merlot (gs) (mmol H2O m−2 s−1)Moscato (gs) (mmol H2O m−2 s−1)
TreatmentDOY 206DOY 207DOY 208DOY 211DOY 213DOY 214
T0198.1 a232.2 a204.6 a286.7 a258.6 a219.2 a
T152.7 b81.3 b76.8 b77.8 b71.1 b73.8 b
T231.3 c48.1 c48.3 c47.6 c49.3 c31.6 c
T0 = well-irrigated, 100% water usage replenished daily; T1 = average water stress, 50% of the water usage replenished daily; T2 = severe water stress, 30% of water usage replenished daily in the varieties Merlot and Moscato. Averages combine both sunlit and shaded foliage. Statistical analysis was carried out on a per date basis (n = 30), and in each column, means followed by different letters are significantly different at p ≤ 0.05 (NKS test).
Table 3. Reference maximum (Tdry) and minimum (Twet) temperatures for Merlot and Moscato for each day of measurement and in both portions of the canopy (sunlit and shaded).
MerlotMoscato
Canopy PortionTargetDOY 206DOY 207DOY 208DOY 211DOY 213DOY 214
SunlitTdry40.5 a36.3 a38.7 a39.7 a40.3 a40.3 a
Twet26.8 b25.6 b26.8 b29.2 b29.7 b29.4 b
ShadedTdry34.1 a33.9 a33.6 a36.1 a36.1 a34.7 a
Twet25.9 b24.4 b23.9 b28.3 b28.3 b27.8 b
In each column (date) and for each canopy portion, the averages followed by different letters are significantly different at p ≤ 0.05 (NKS test).
Table 4. Daily values of the crop water stress index (CWSI) calculated for the sunlit and shaded portions of the canopy.
MerlotDOY 206DOY 207DOY 208
TreatmentSunlitShadedSunlitShadedSunlitShaded
T00.5 b0.5 b0.2 c0.4 c0.4 c0.5 c
T10.8 a1.0 a0.6 b0.6 b0.6 b0.7 b
T20.8 a1.1 a0.9 a0.8 a0.8 a1.0 a
MoscatoDOY 211DOY 213DOY 214
TreatmentSunlitShadedSunlitShadedSunlitShaded
T00.3 b0.4 c0.3 c0.5 c0.3 c0.5 c
T10.8 a0.8 b0.7 b0.7 b0.7 b0.7 b
T20.9 a1.1 a0.9 a1.0 a0.9 a0.9 a
Data is the average of the indices calculated on five plants per treatment. The statistical analysis was carried out by date and by canopy portion. In each column, the averages followed by different letters are significantly different at p ≤ 0.05 (NKS test).
Table 5. Daily values of the stomatal conductance index (IG) calculated for the sunlit and shaded portions of the canopy.
MerlotDOY 206DOY 207DOY 208
TreatmentSunlitShadedSunlitShadedSunlitShaded
T00.8 a1.0 a3.5 a1.2 a1.6 a0.9 a
T10.3 b0.4 b0.7 b0.6 b0.5 b0.3 b
T20.3 b0.01 c0.2 c0.3 c0.4 b0.01 c
MoscatoDOY 211DOY 213DOY 214
TreatmentSunlitShadedSunlitShadedSunlitShaded
T02.7 a1.3 a1.6 a1.2 a2.0 a0.9 a
T10.5 b0.4 b0.5 b0.4 b0.5 b0.4 b
T20.2 c0.04 c0.08 c0.04 c0.1 c0.1 c
Data are the average of the indices calculated on five plants per treatment. The statistical analysis was carried out by date and by canopy portion. In each column, the averages followed by different letters are significantly different at p ≤ 0.05 (NKS test).

