
Spectral Visualization of Alloy Reactions during Laser Melting

1
Department of Engineering Sciences and Mathematics, Luleå University of Technology, 971 87 Luleå, Sweden
2
Department of Engineering Sciences, Jade University of Applied Sciences, Friedrich-Paffrath-Str. 101, 26389 Wilhelmshaven, Germany
*
Author to whom correspondence should be addressed.
Alloys 2023, 2(3), 140-147; https://0-doi-org.brum.beds.ac.uk/10.3390/alloys2030010
Submission received: 23 May 2023
/
Revised: 20 June 2023
/
Accepted: 23 June 2023
/
Published: 4 July 2023
(This article belongs to the Special Issue Design of New Metallic Alloys for AM)
Abstract
:Laser materials processing includes rapid heating to possibly high temperatures and rapid cooling of the illuminated materials. The material reactions can show significant deviations from equilibrium processing. During processing of complex materials and material combinations, it is mainly unknown how the materials react and mix. However, it is important to know which chemical elements or compounds are present in the material to define the alloy. In addition, their distribution after rapid cooling needs to be better understood. Therefore, such alloy changes at rapid heating induced by laser illumination were created as pre-placed and pre-mixed powder nuggets. The energy input and the material ratio between the powder components were varied to identify characteristic responses. For the detection of reaction durations and mixing characteristics, the vapor plume content was assumed to contain the necessary information. Spectral measurements of the plume were used to identify indicators about process behaviors. It was seen that the spectral data give indications about the chemical reactions in the melt pool. The reactions of iron ore components with aluminum seem to require laser illumination to finish completely, although the thermite reaction should maintain the chemical reaction, likely due to the required melt mixing that enables the interaction of the reacting partners at all.
1. Introduction
Laser materials processing became an industrial manufacturing technology that gained importance and has for many tasks no competitive solution. Laser processing is nowadays a regular production method enabling many unique effects. Highly precise local surface treatments to alter surface topologies [1] or properties [2] are possible, including inducing microstructural changes [3]. Furthermore, the possible high intensity of laser beams enables laser cutting (e.g., [4]) and welding (e.g., [5]) where even a vapor channel is created that enables high processing depth at low total energy input into the material [6]. This helps to limit the distortion of parts [7]. In recent years, the laser beam has been used in many additive manufacturing technologies. Powder bed fusion was shown to be efficiently possible using laser beams to produce a very local melting and create 3D structures (e.g., [8]). Furthermore, directed energy deposition processes using comparably large laser beams in combination with blown powder were seen to be highly efficient to produce larger additively manufactured parts at high build-up rates (e.g., [9]). Since the laser treatment shows different characteristics compared to conventional heating methods, e.g., rapid heating, rapid cooling and very short process times, those aspects need to be analyzed and considered during material processing. In particular, the alloy changes that can be induced during the short laser treatments are barely understood.
Laser processes show extreme conditions. Heating and cooling rates of the material can exceed >1000 K/s [10], which is comparably high (e.g., arc welding 8–20 K/s [11]). Often, microstructural developments are well explained for slow heating and cooling, but there is a lack of understanding during such rapid processes, e.g., Dewi et al. [12] showed that rapid cooling after laser hardening can interrupt the formation of martensite and ‘freeze’ the microstructure to form martensitic ferrite instead.
Chemical reactions of alloy components are also well described in the literature. The thermite reaction steps follow the route Fe2O3 to Fe3O4 to FeO and finally to Fe [13], while the presence of FeO can lead to the formation of FeAl2O4 [14]. Multiple effects were explained, such as the melt reaction with surrounding gases, e.g., oxygen [15] or nitrogen [16]. However, in addition, alloy components can react in the melt pool when certain conditions are met. Reactions to reduce iron ore were shown to be feasible using laser melting [17,18]. Aluminum shows a high reactivity with oxygen and is able to reduce iron ore initiating the thermite reaction, which offers the possibility to use this system for analyzing such reactions. Chmielewska et al. [19] describe in situ alloying during a laser powder bed fusion process of NiTi alloys. They found that the Ni content affects the martensite and austenite temperatures, whereby both phases can occur simultaneously. They described that the partial evaporation of Ni leads to the transition temperature change. In addition, they found that solidification and liquidation cracks occur due to the different melting temperatures of Ti and Ni and the different phases present. Mosallanejad et al. [20] discuss in situ alloying, including criteria on the powder and the process, and describe the influence of enthalpy of mixing and the Marangoni effect.
An additional factor to consider during laser treatment is the dynamic character of the process. Reacting components will move within the melt pool, and phase separation will occur. The main driving force is the temperature-dependent surface tension-based Marangoni flow (e.g., [21]). On the one hand, melt flow is necessary to enable the contact between the reacting partners. On the other hand, it is possible that phases accumulate and separate, which can reduce the interaction area between the reacting partners and limit the reaction time. However, the relation between chemical reactions and melt behavior is barely understood.
Therefore, the aim of this work was to better understand aspects of the alloy changes during reactions at laser illumination. It is still unclear how the element vaporization at laser illumination affects the vapor content and what information about the melt can be found in the vapor characteristics. On the one hand, it is suspected that the reaction products of a chemical reaction happening in the melt can be seen in the vapor, which might give the possibility to control chemical processes. On the other hand, the resulting element composition and thereby the microstructural development can be predicted when knowing about the element losses. The main focus was on the detection of reaction characteristics in the vapor from the process in spectral data.
2. Materials and Methods
2.1. Experimental Setup
In order to investigate the chemical reactions during laser illumination, an experimental setup was designed at Jade University to observe the spectral response from vapor produced on melt pools illuminated by a laser beam. The material used was iron ore, which was collected at different processing steps of mining at the company LKAB. Two different ore types were used, namely hematite and magnetite.
As a reaction agent, pure aluminum was used. Powders were sufficiently mixed using a tubular mixer (3D shaker mixer—TURBULA Typ T 2 F, Willy A. Bachofen GmbH, Nidderau, Germany) to form a homogeneous distribution for each tested ratio.
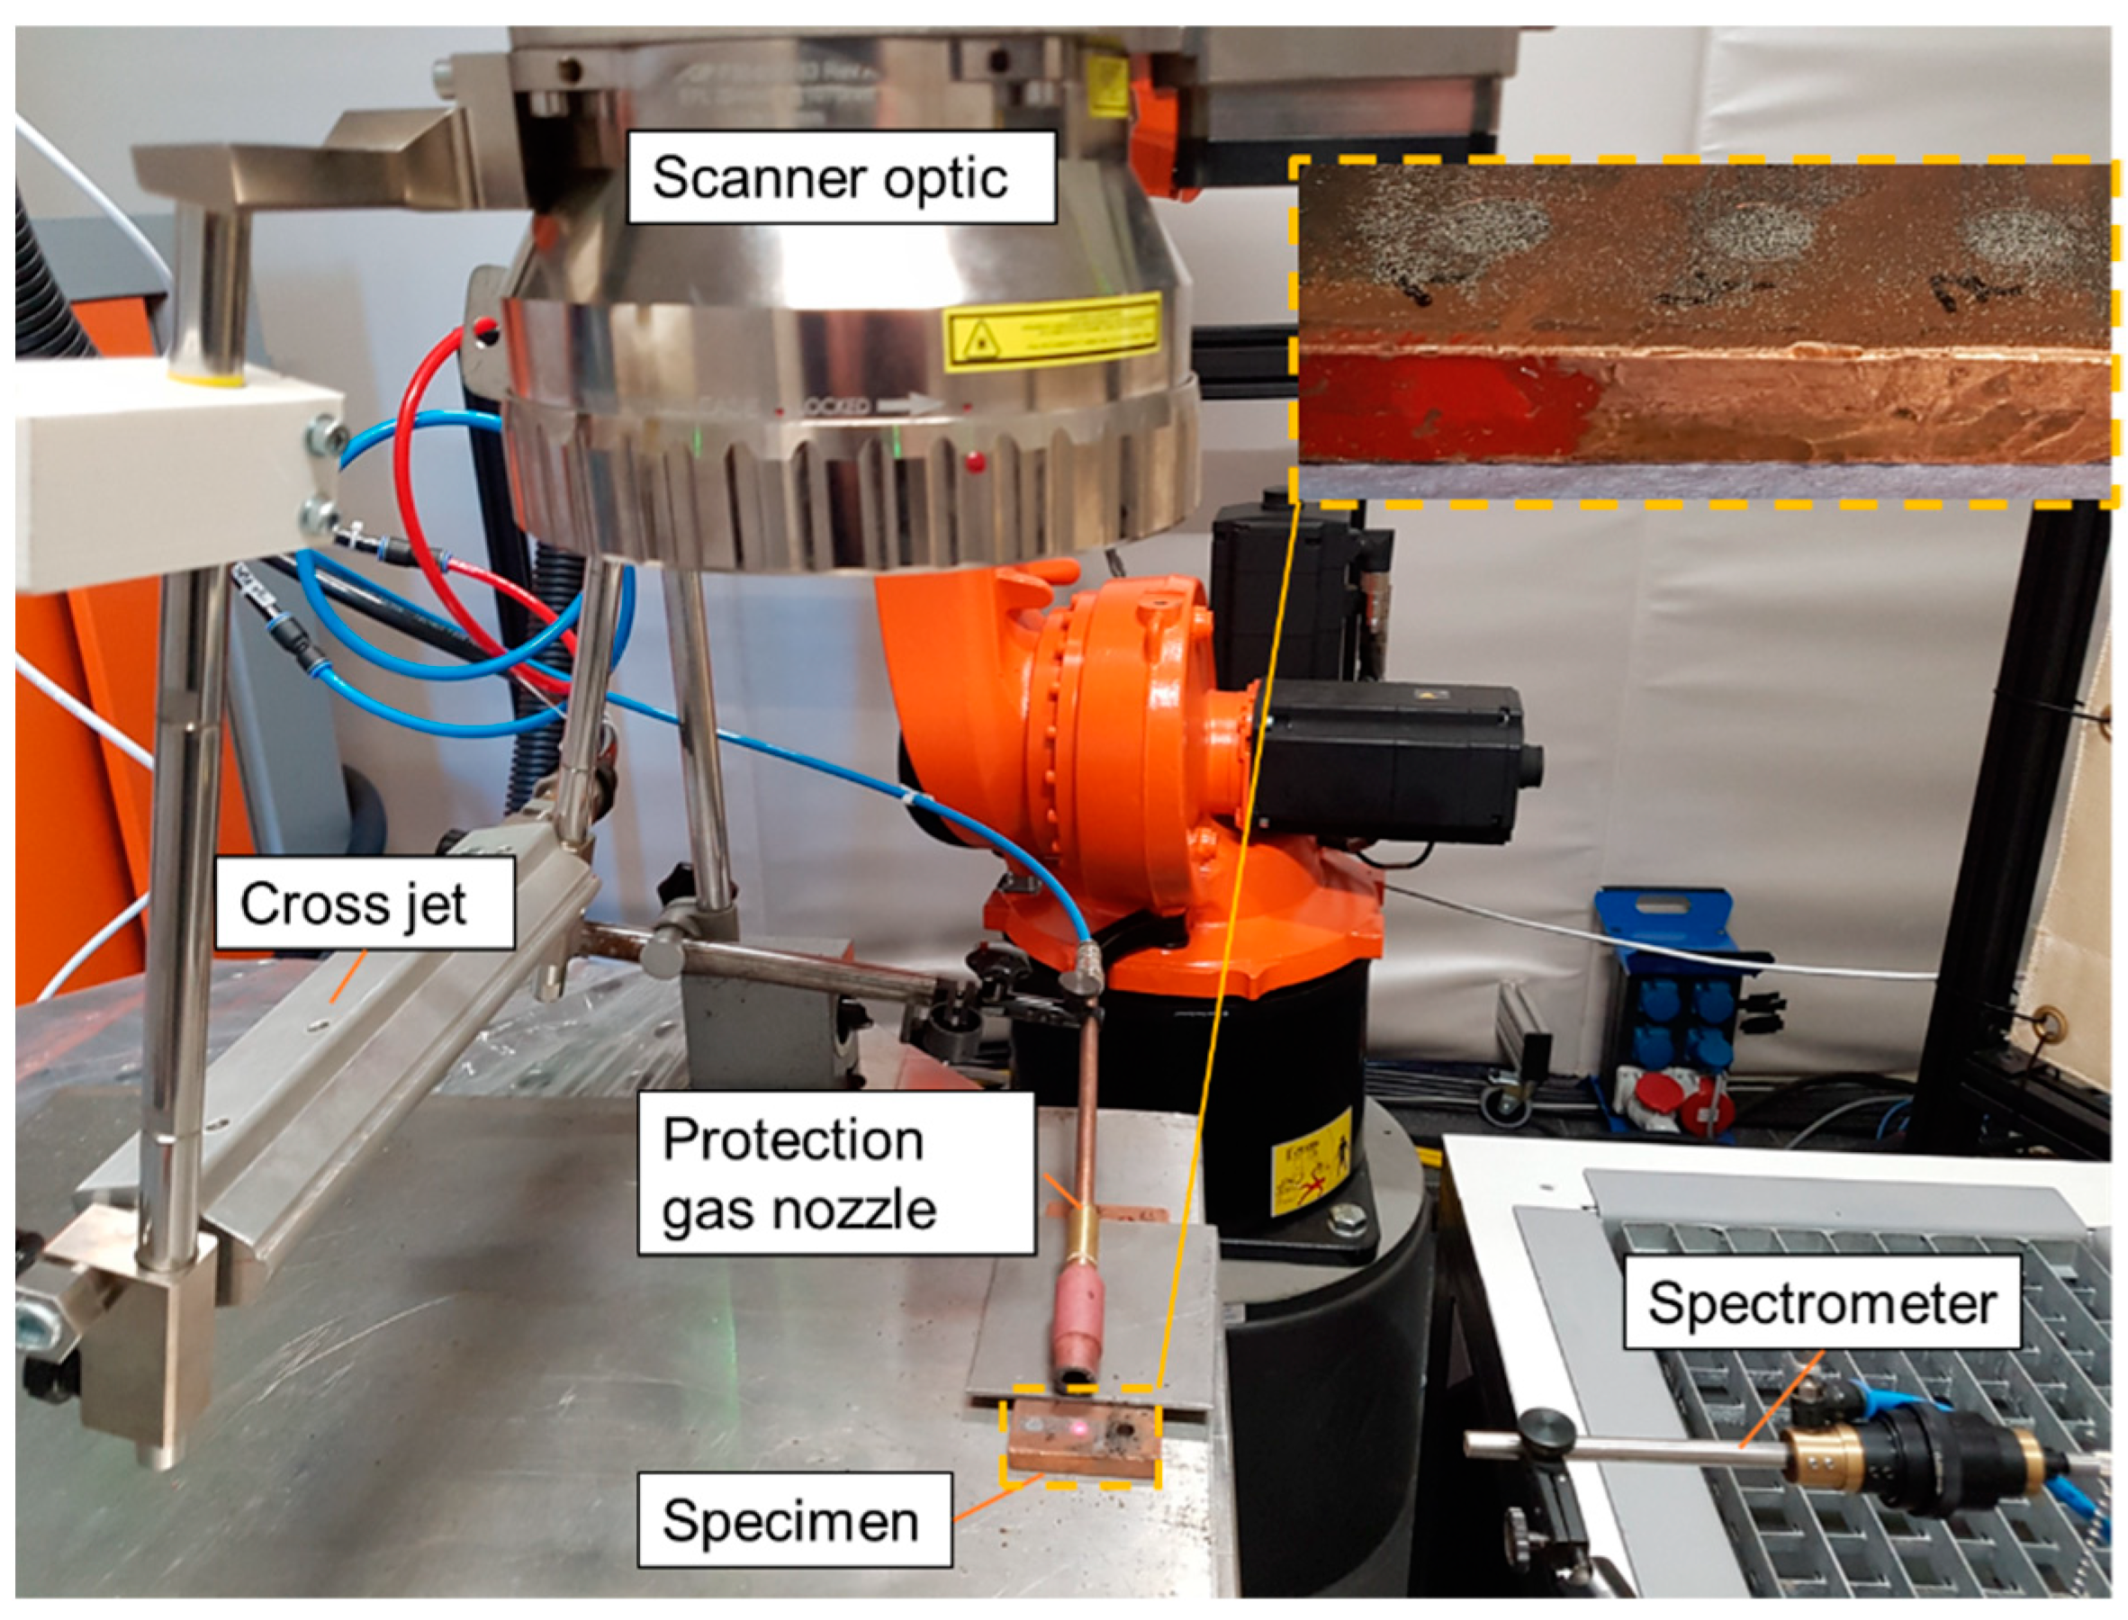
For testing small amounts of material volumes, the so-called ‘snapshot’ method [22] was used. Small and defined amount/volume fractions of material in form of powder, chopped material flakes or similar can be pre-mixed or applied in multiple layers to evaluate the material mixing behavior of new alloys very rapidly. In addition, complex thermal cycles can be applied by controlling the laser energy input [22]. Therefore, holes were milled into a copper base plate with 6 mm diameter and 5 mm depth. The holes were filled with the pre-mixed powder (Figure 1). A laser beam, provided by a fiber laser (YLS-8000, IPG Laser GmbH), was used to heat and melt the powder material in the hole. The laser source had a wavelength of 1070 nm and was coupled to a 2D high power scanner with a 400 µm diameter optical fiber. The scanner optic was equipped with a 140 mm collimating and a 254 mm focusing lens. The interaction zone around the filled holes were covered with argon 4.6 as a shielding gas. Due to the dynamic nature of the process and reactions, some material was lost in the form of blown away powder or spattering. The resulting material nugget was visually analyzed.
During the laser illumination, the vapor escaping from the hole was analyzed using a spectrometer positioned to record the volume approx. 1 mm above the material surface. Optical emissions were captured with a collimating lens coupled to a 115 µm optical fiber. The fiber was connected to a high-bandwidth spectrometer (OCEAN HDX-UV-VIS, Ocean Insight, Orlando, FL, USA) with a wavelength range of 200–800 nm and a spectral resolution at FWHM of 0.73 nm. In order to investigate the temporal behavior of the ejected vapor content, spectral signals were recorded with a 6 ms integration time back-to-back, resulting in a rate of 166.7 Hz. The signal to noise ratio of the used spectrometer is specified with 400:1. Thus, measured intensity values have a relative error of 0.25%.
Variations of the laser illumination time were performed using hematite at a fixed ratio with aluminum in order to identify correlations between the reaction and the ejected vapor composition. Both the iron ore material and reaction agent concentration were varied. The amounts of aluminum in the material mixture were varied in three steps.
2.2. Spectral Analysis
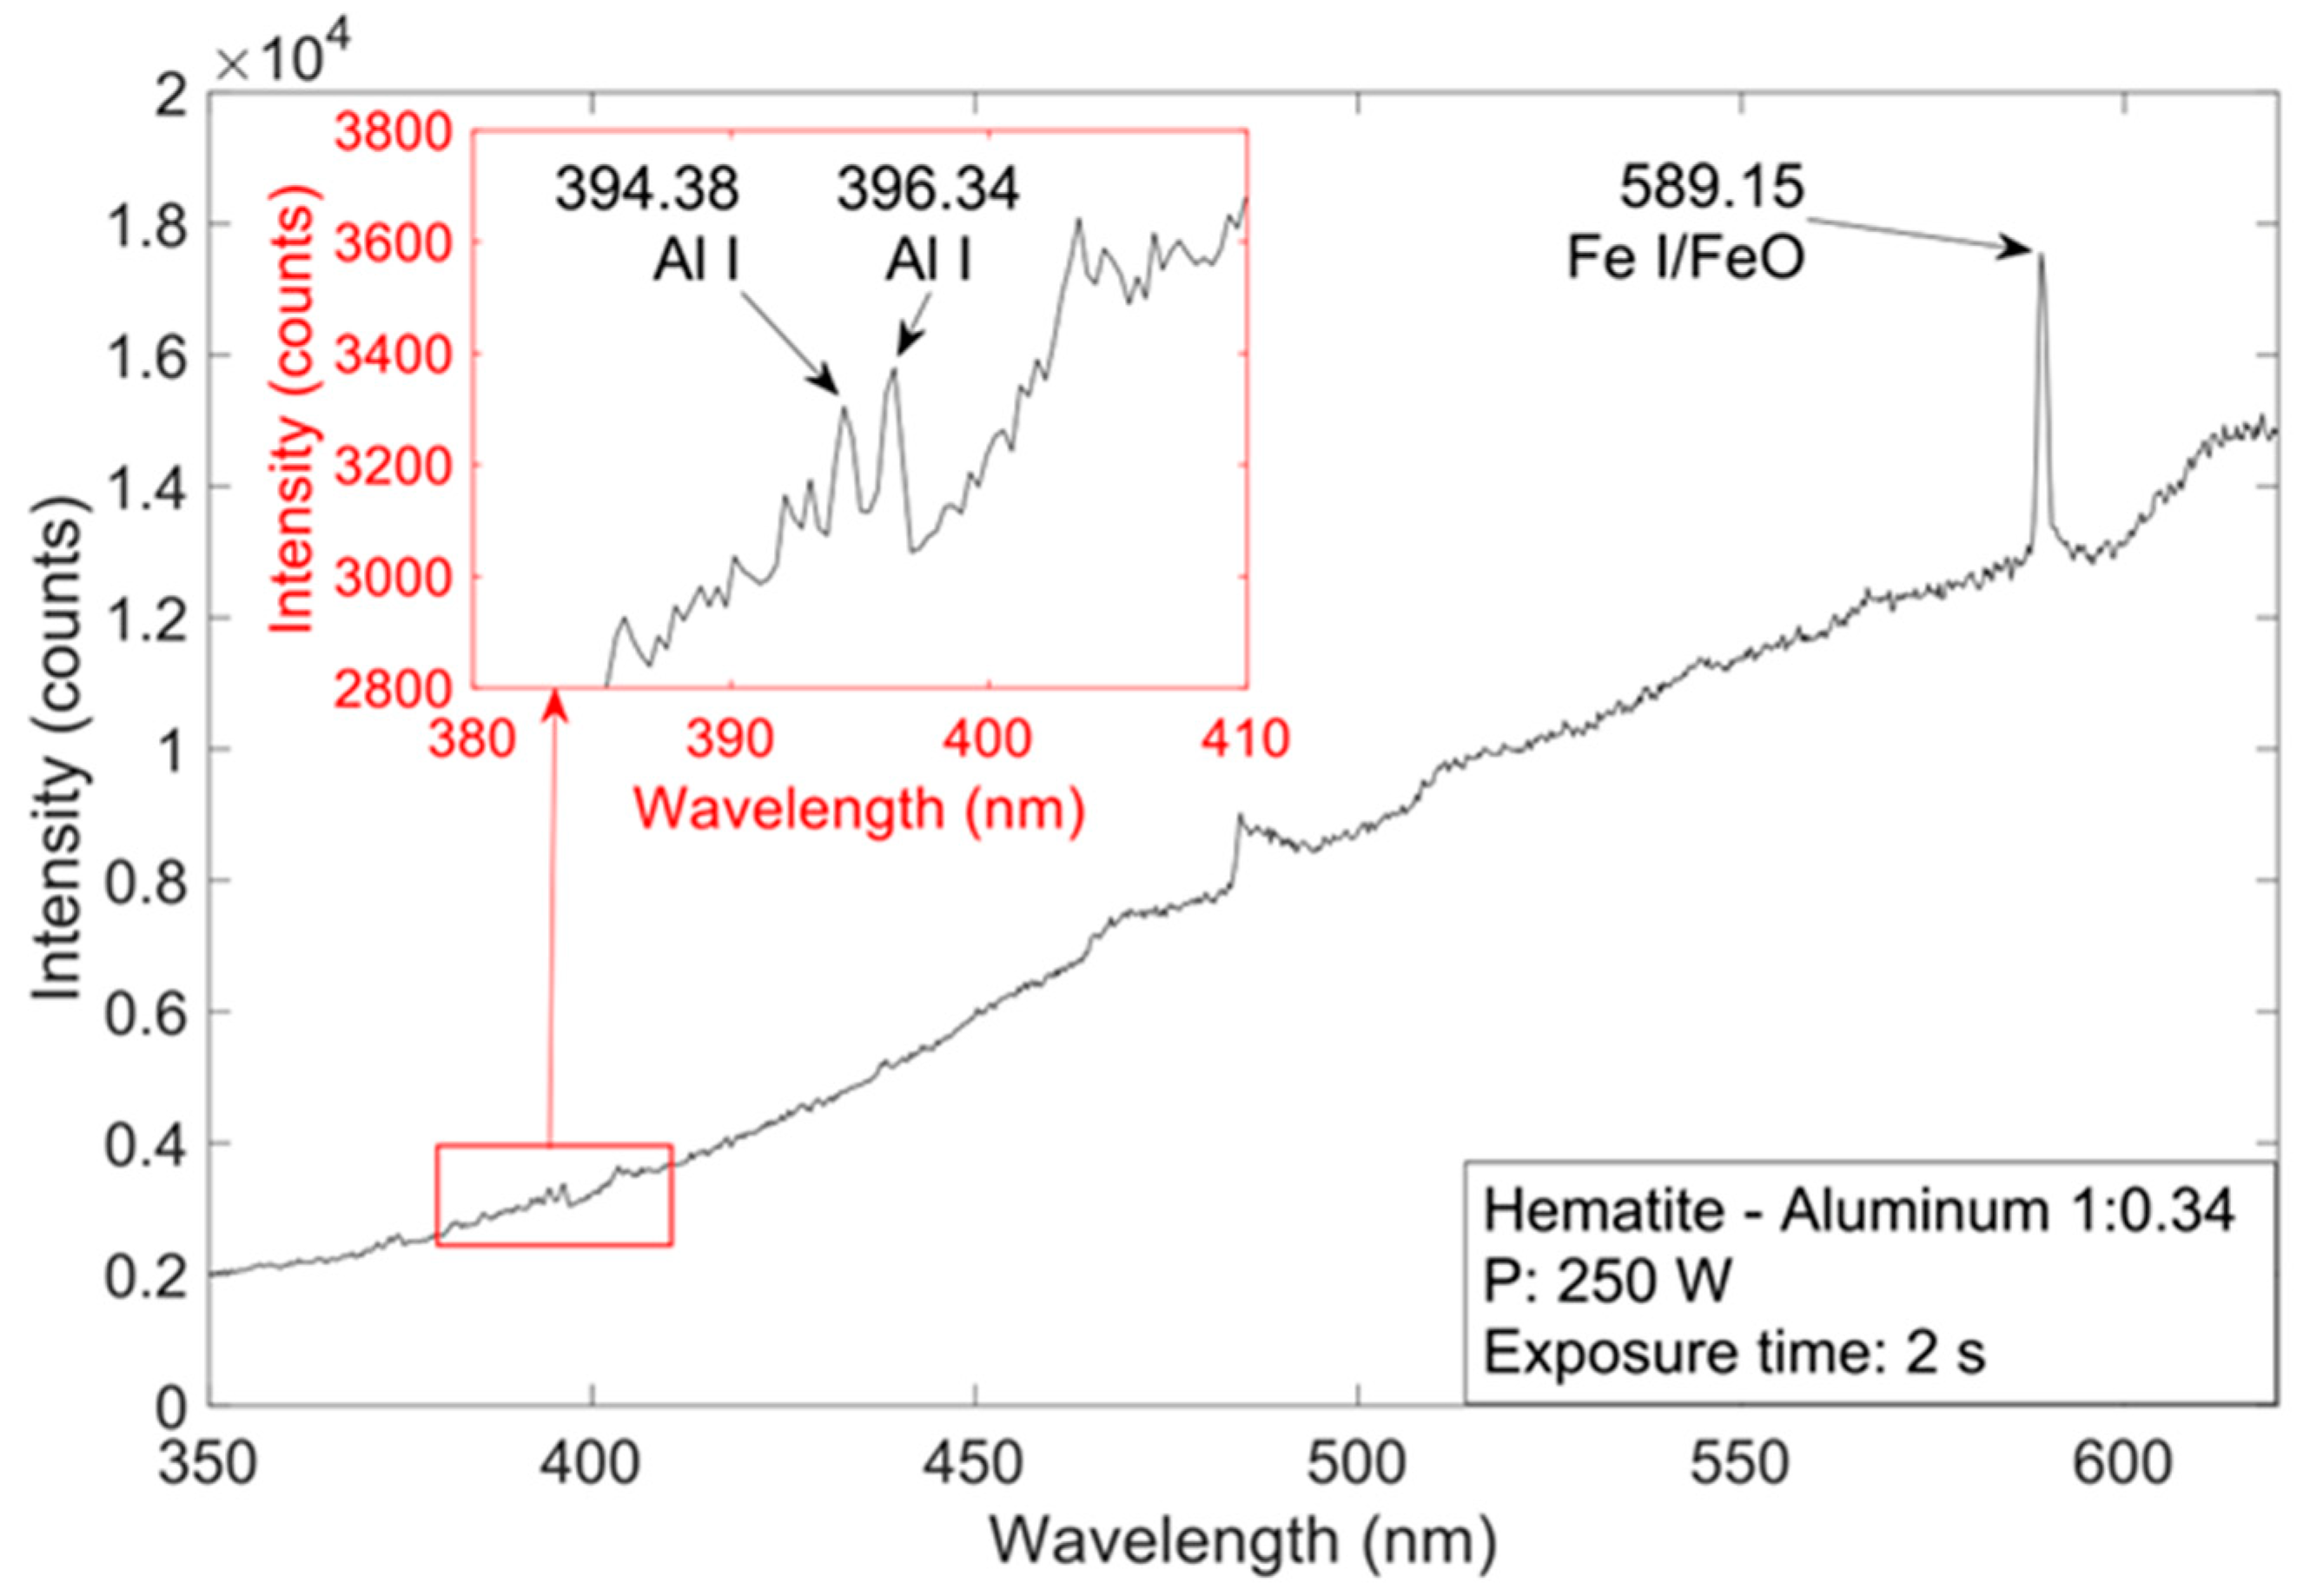
Single spectra were recorded and stored consecutively for each experiment. Within each single spectrum, peak signals were detected that probably originated from element emissions lines. Based on the wavelength of the peak, it was assigned to a single or multiple specific element emission lines by the aid of the NIST Atomic Spectra Database [23]. Thus, the chemical composition as well as the vaporization behavior can be estimated. Figure 2 shows an exemplary spectrum recorded using hematite–aluminum mixtures. Three major peaks could be found and assigned to element emission lines. At 394.38 nm and 396.34 nm, emission lines of non-ionized aluminum (Al I) can be found. At 589.12 nm, several non-ionized iron (Fe I) emission lines as well as iron oxide molecule (FeO) emissions can be found [24,25,26].
Concerning the temporal behavior of the process, the amount of emitted light throughout the process was analyzed. Therefore, the intensity curve of each spectrum was numerically integrated using the trapezoidal method. Errors caused by the numerical integration method were assumed to be negligible, since the resolution of the spectrometers allows sufficient sampling of the curve. This integrated intensity value of each spectrum in an experiment was plotted over the process time. Since each experiment is repeated at least twice (most experiments were done three times, some even five times) the repeatability of the process was ensured.
3. Results and Discussion
3.1. Variation of Laser Illumination Duration
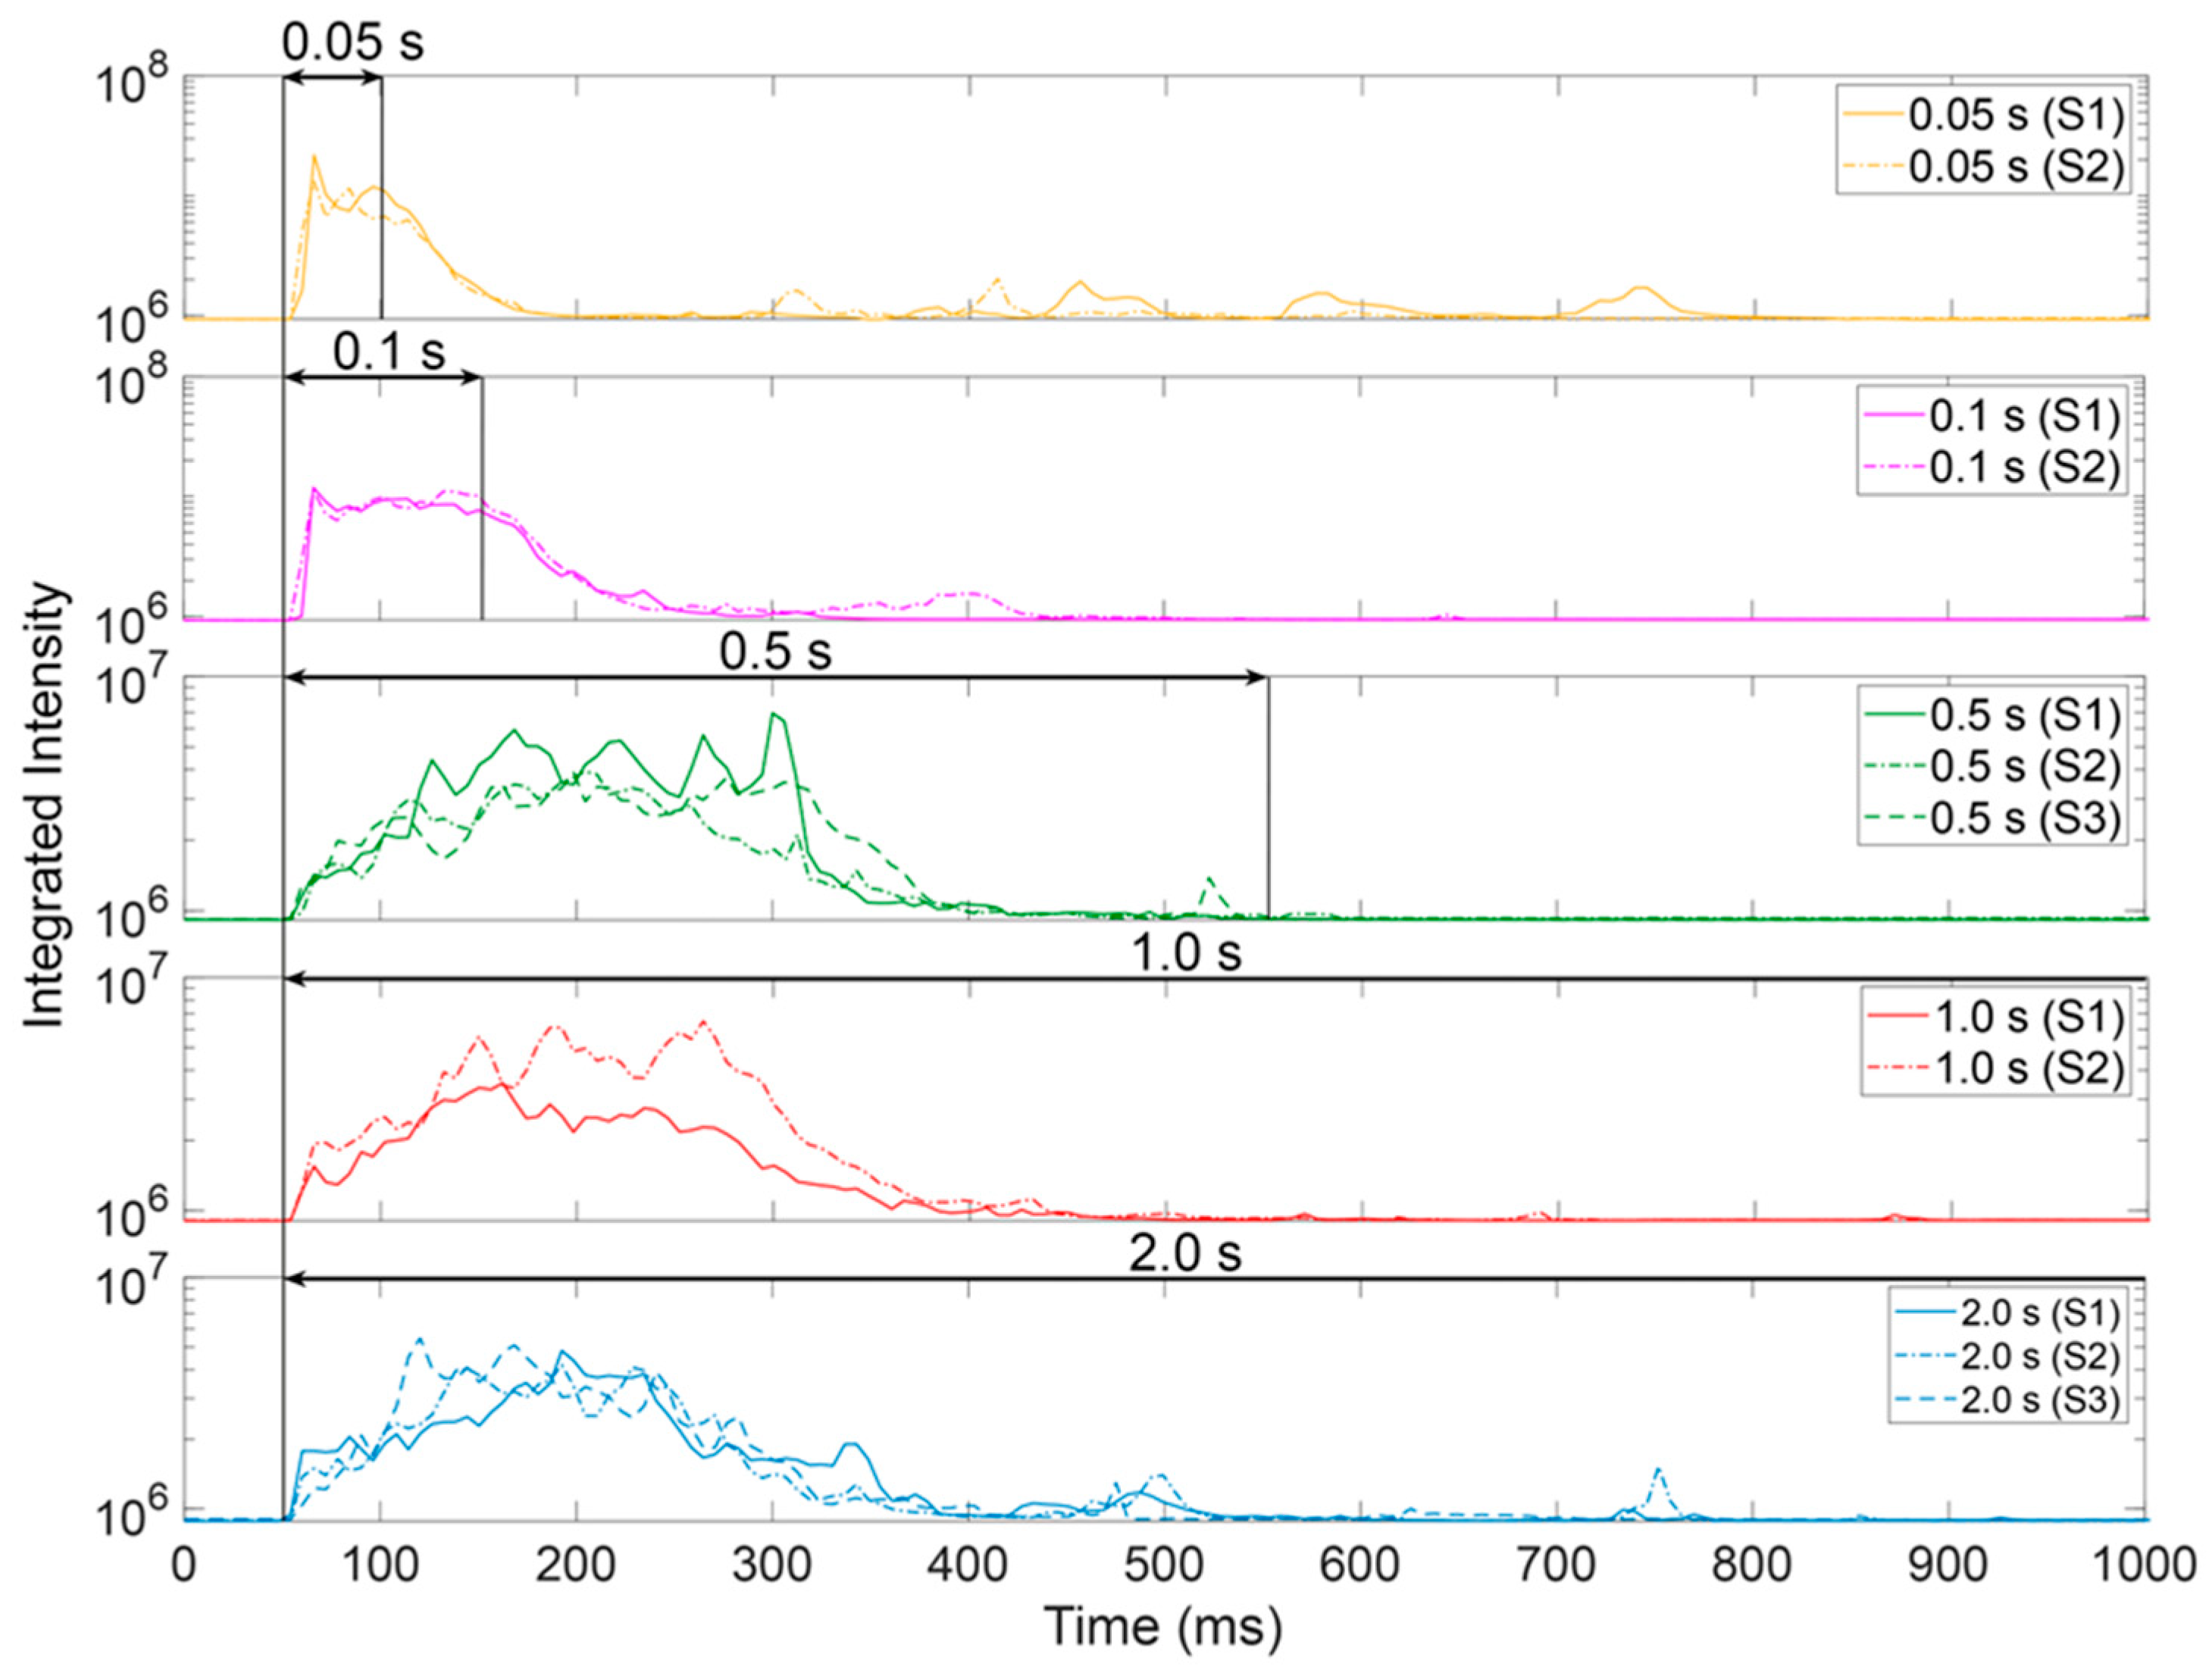
The temporal characteristics of the spectral response were visualized in Figure 3 using the fixed ratio of 1:0.34 (hematite–aluminum) at 250 W laser illumination. Illumination durations were varied. At 0.05 s and 0.1 s illumination time, it was visible that the integrated intensity shows high values during the illumination but reduces to low values. However, there were a few intensity peaks even long after the laser was turned off. This indicates that the chemical reaction is mainly ongoing during laser illumination, where the melt mixing happens, but during cooling the exothermal thermite reaction might still occur and lead to optical emissions in the ejected vapor.
At illumination times longer than 0.5 s, the high intensity curves show similar temporal trends. After ~400 ms, the intensities drop to low values and only a few peaks occur in later stages, although the laser beam was still illuminating. This indicates that the chemical reaction in the nugget is completed to the possible extent and even further heating and mixing of the melt pool does not enable further reactions.
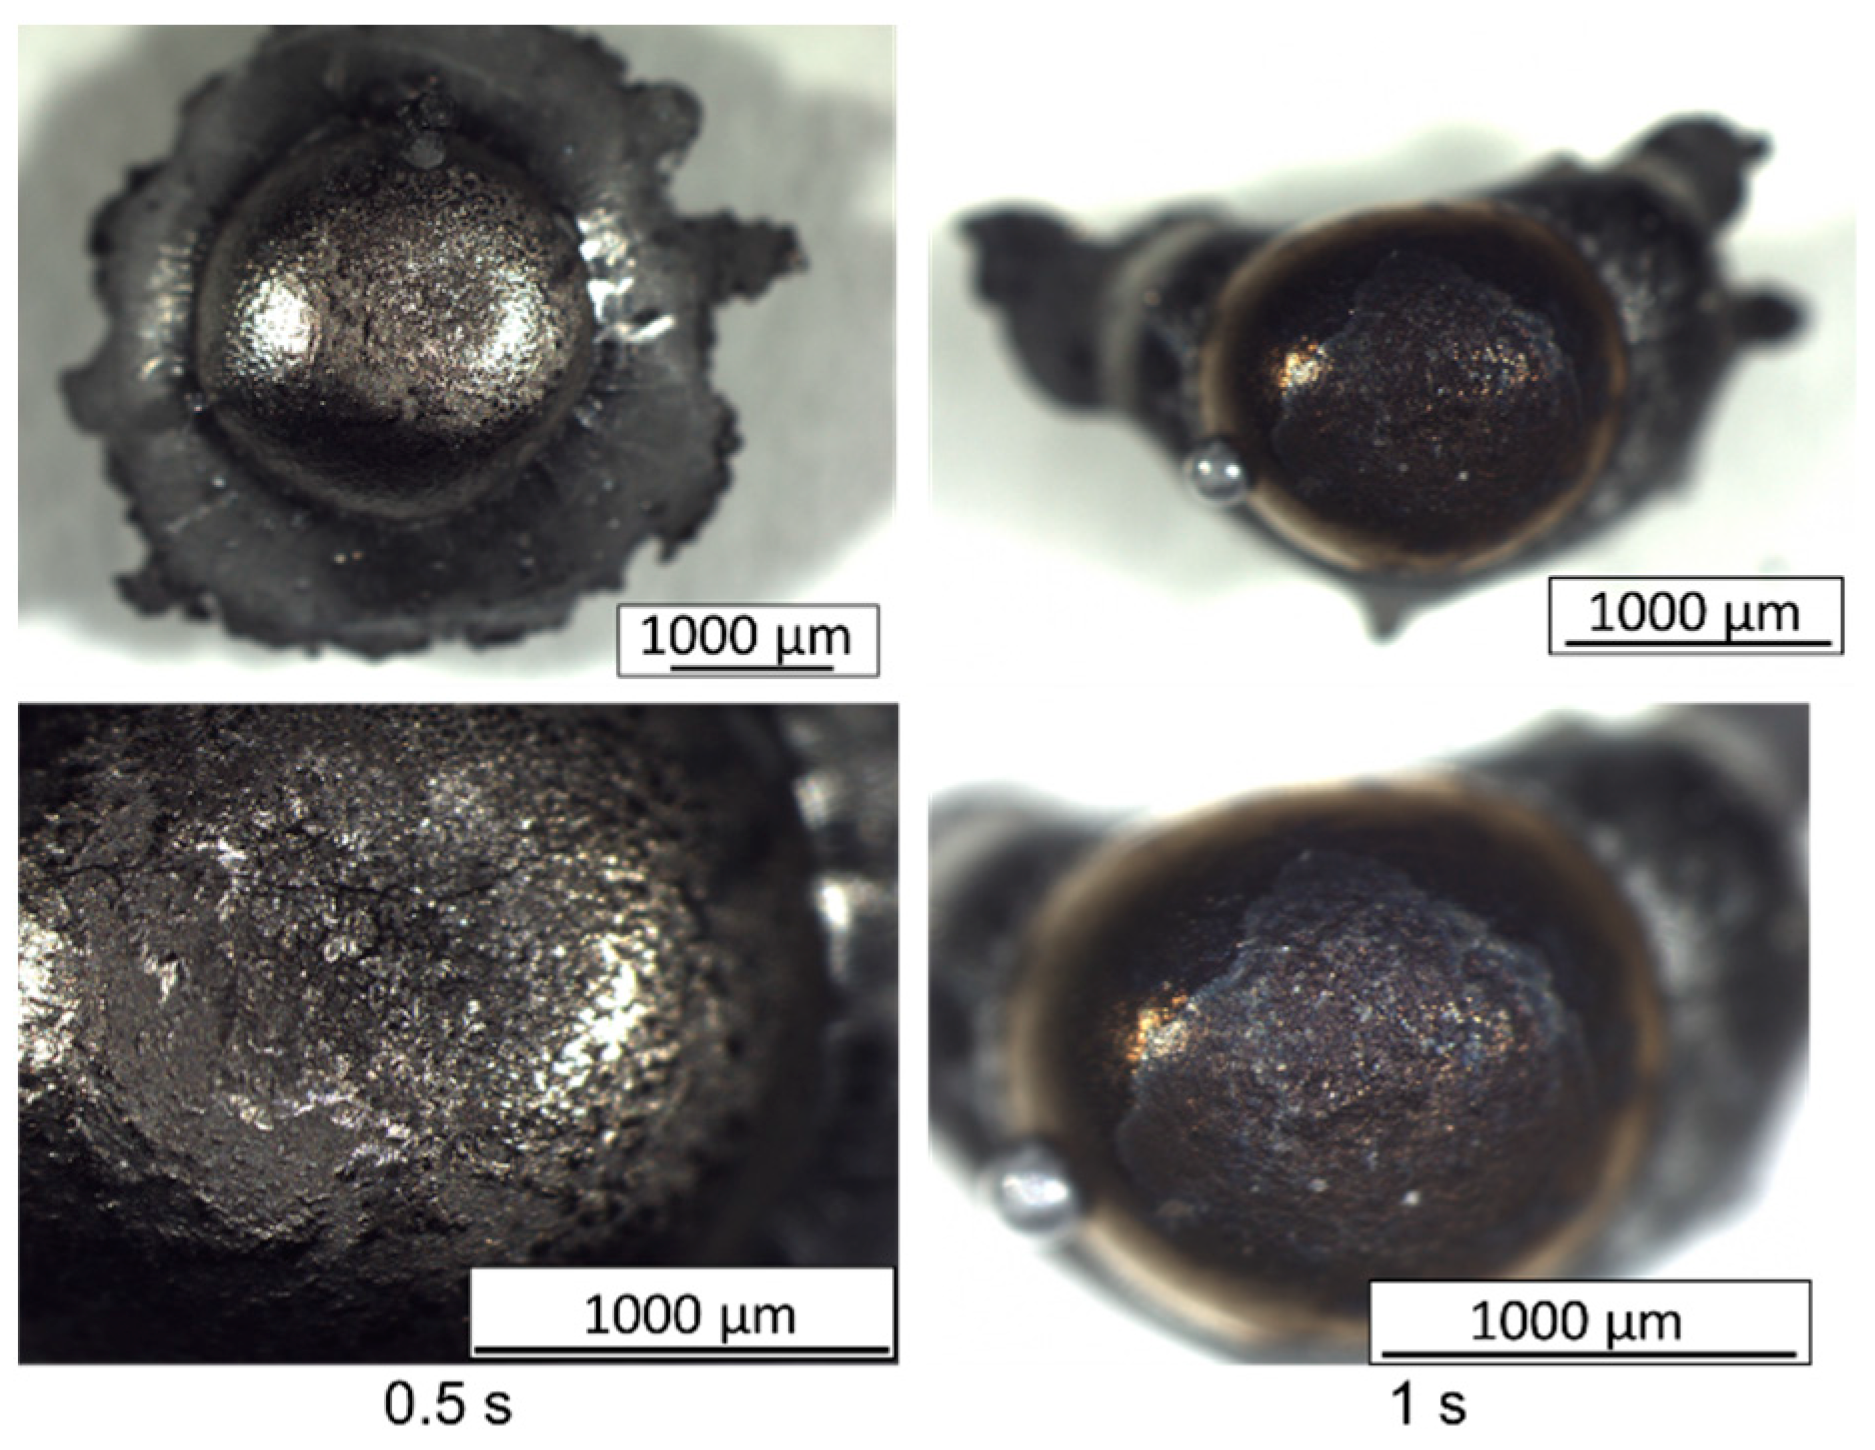
The resulting nuggets removed from the copper hole (Figure 4) show that phase separation occurred during the process. A bright phase was attached on top of a darker phase for most specimens. This indicates that after the reaction, the phases separated. Due to the phase separations, it is possible that melt components cannot be well mixed anymore and cannot sufficiently reach the reacting partner to further react. The small peaks at increased time indicate that there might be phases meeting and initiating further reaction occasionally.
Since the thermite reaction is exothermal, it was assumed that once initiated, the reaction should finalize (in case the melt mixing is sufficient to provide the contact between the reacting partners). However, it seems that the reaction cannot maintain completely. E.g., at 0.05 s illumination time, the intensity decreased after the laser was turned off. Apparently, there is some further reaction, but not to a high extent. This indicates that the laser heating is necessary to maintain the reaction.
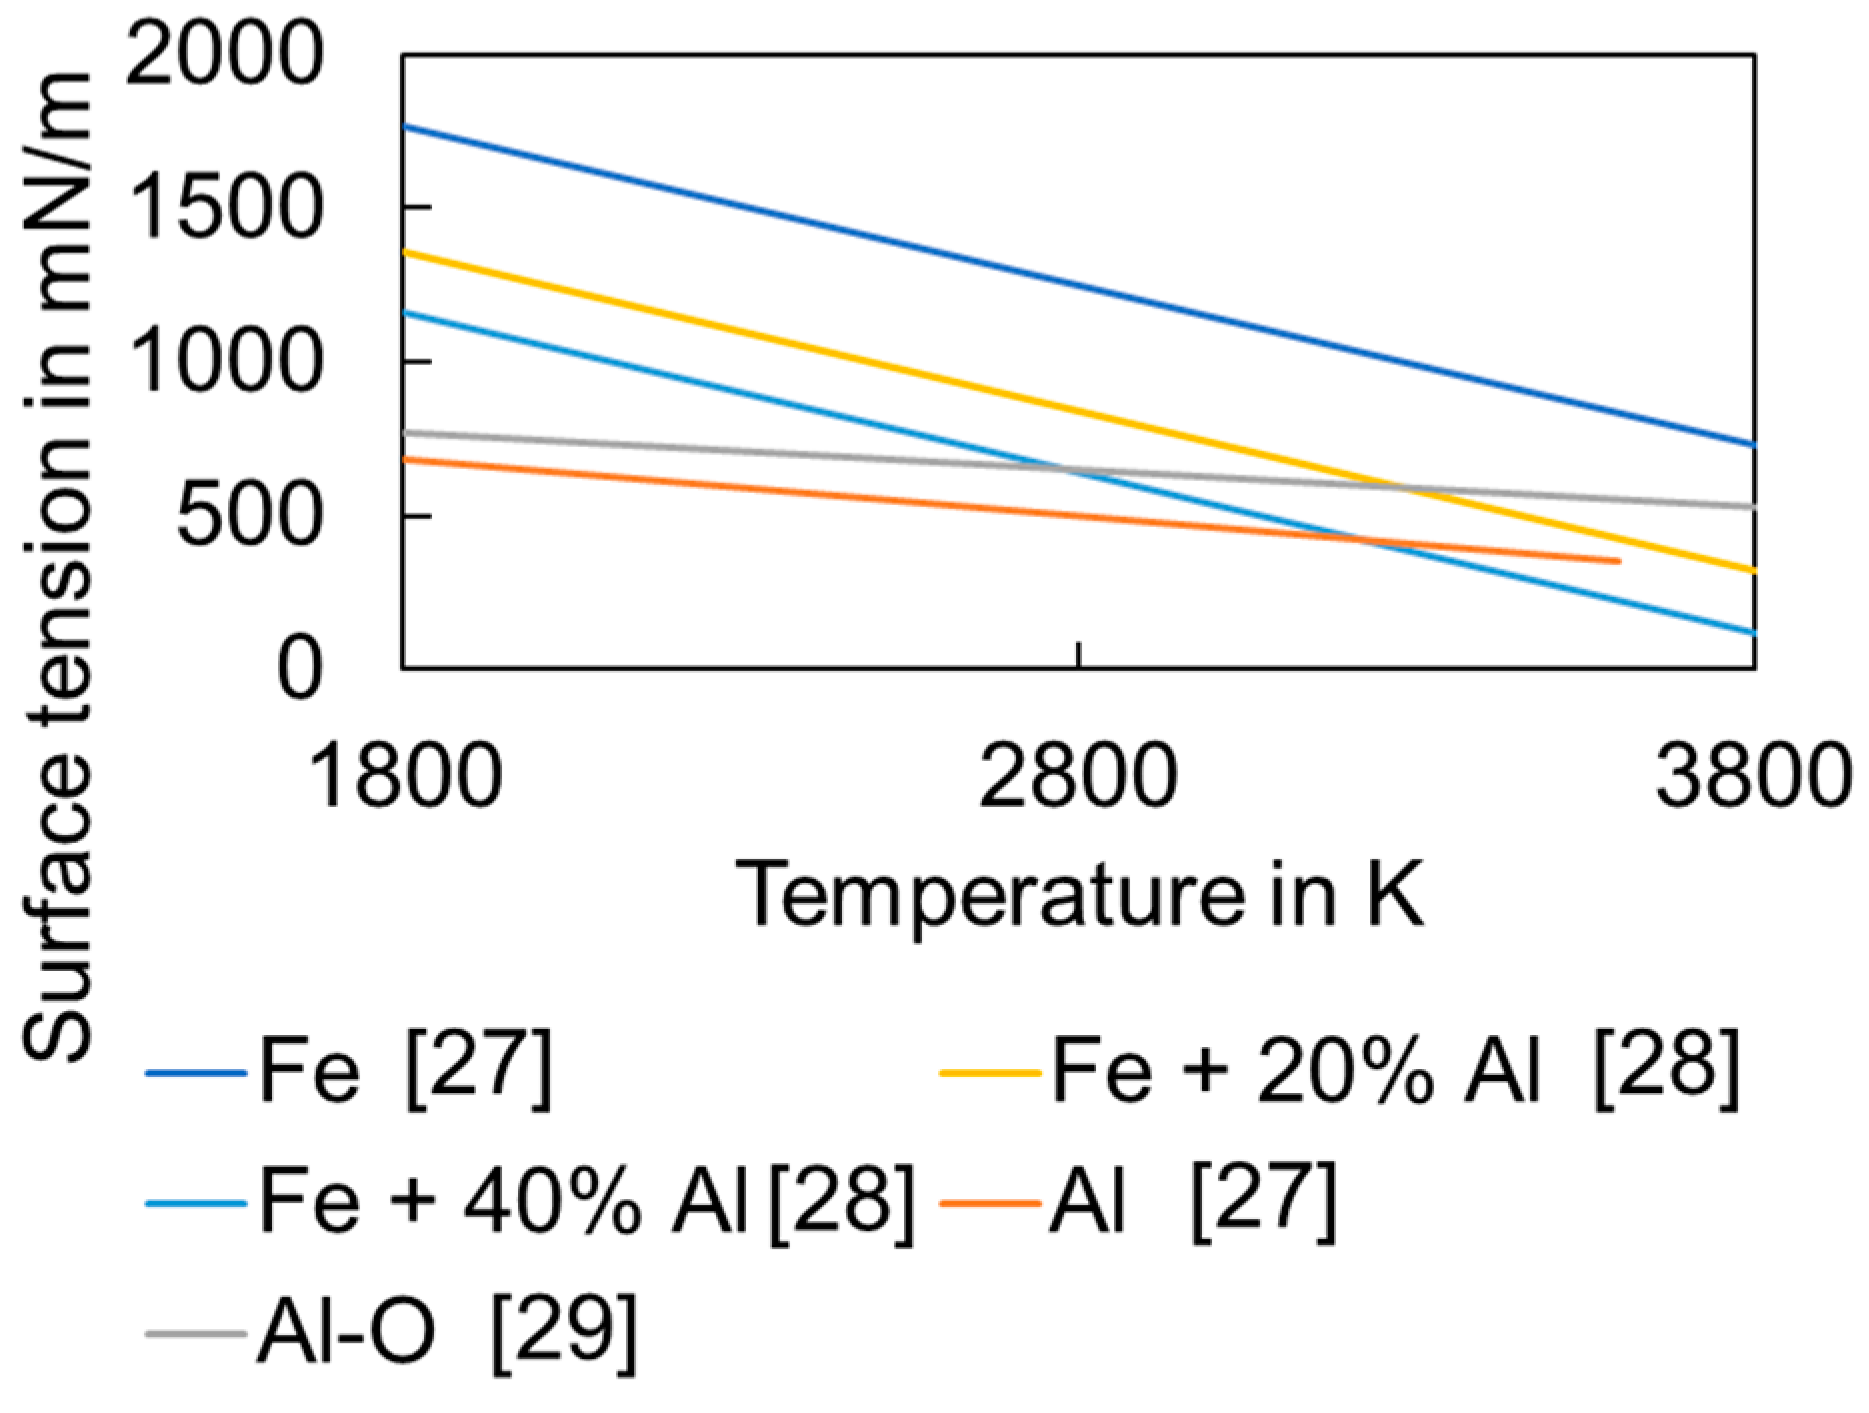
Based on the shape after solidification, the bright drop shows a smaller radius compared to the darker material below. Therefore, the surface tension of the bright drop must have been comparably higher to be formed in the liquid state.
Figure 5 shows the main tendencies of surface tension values known from the literature.
3.2. Material Impact
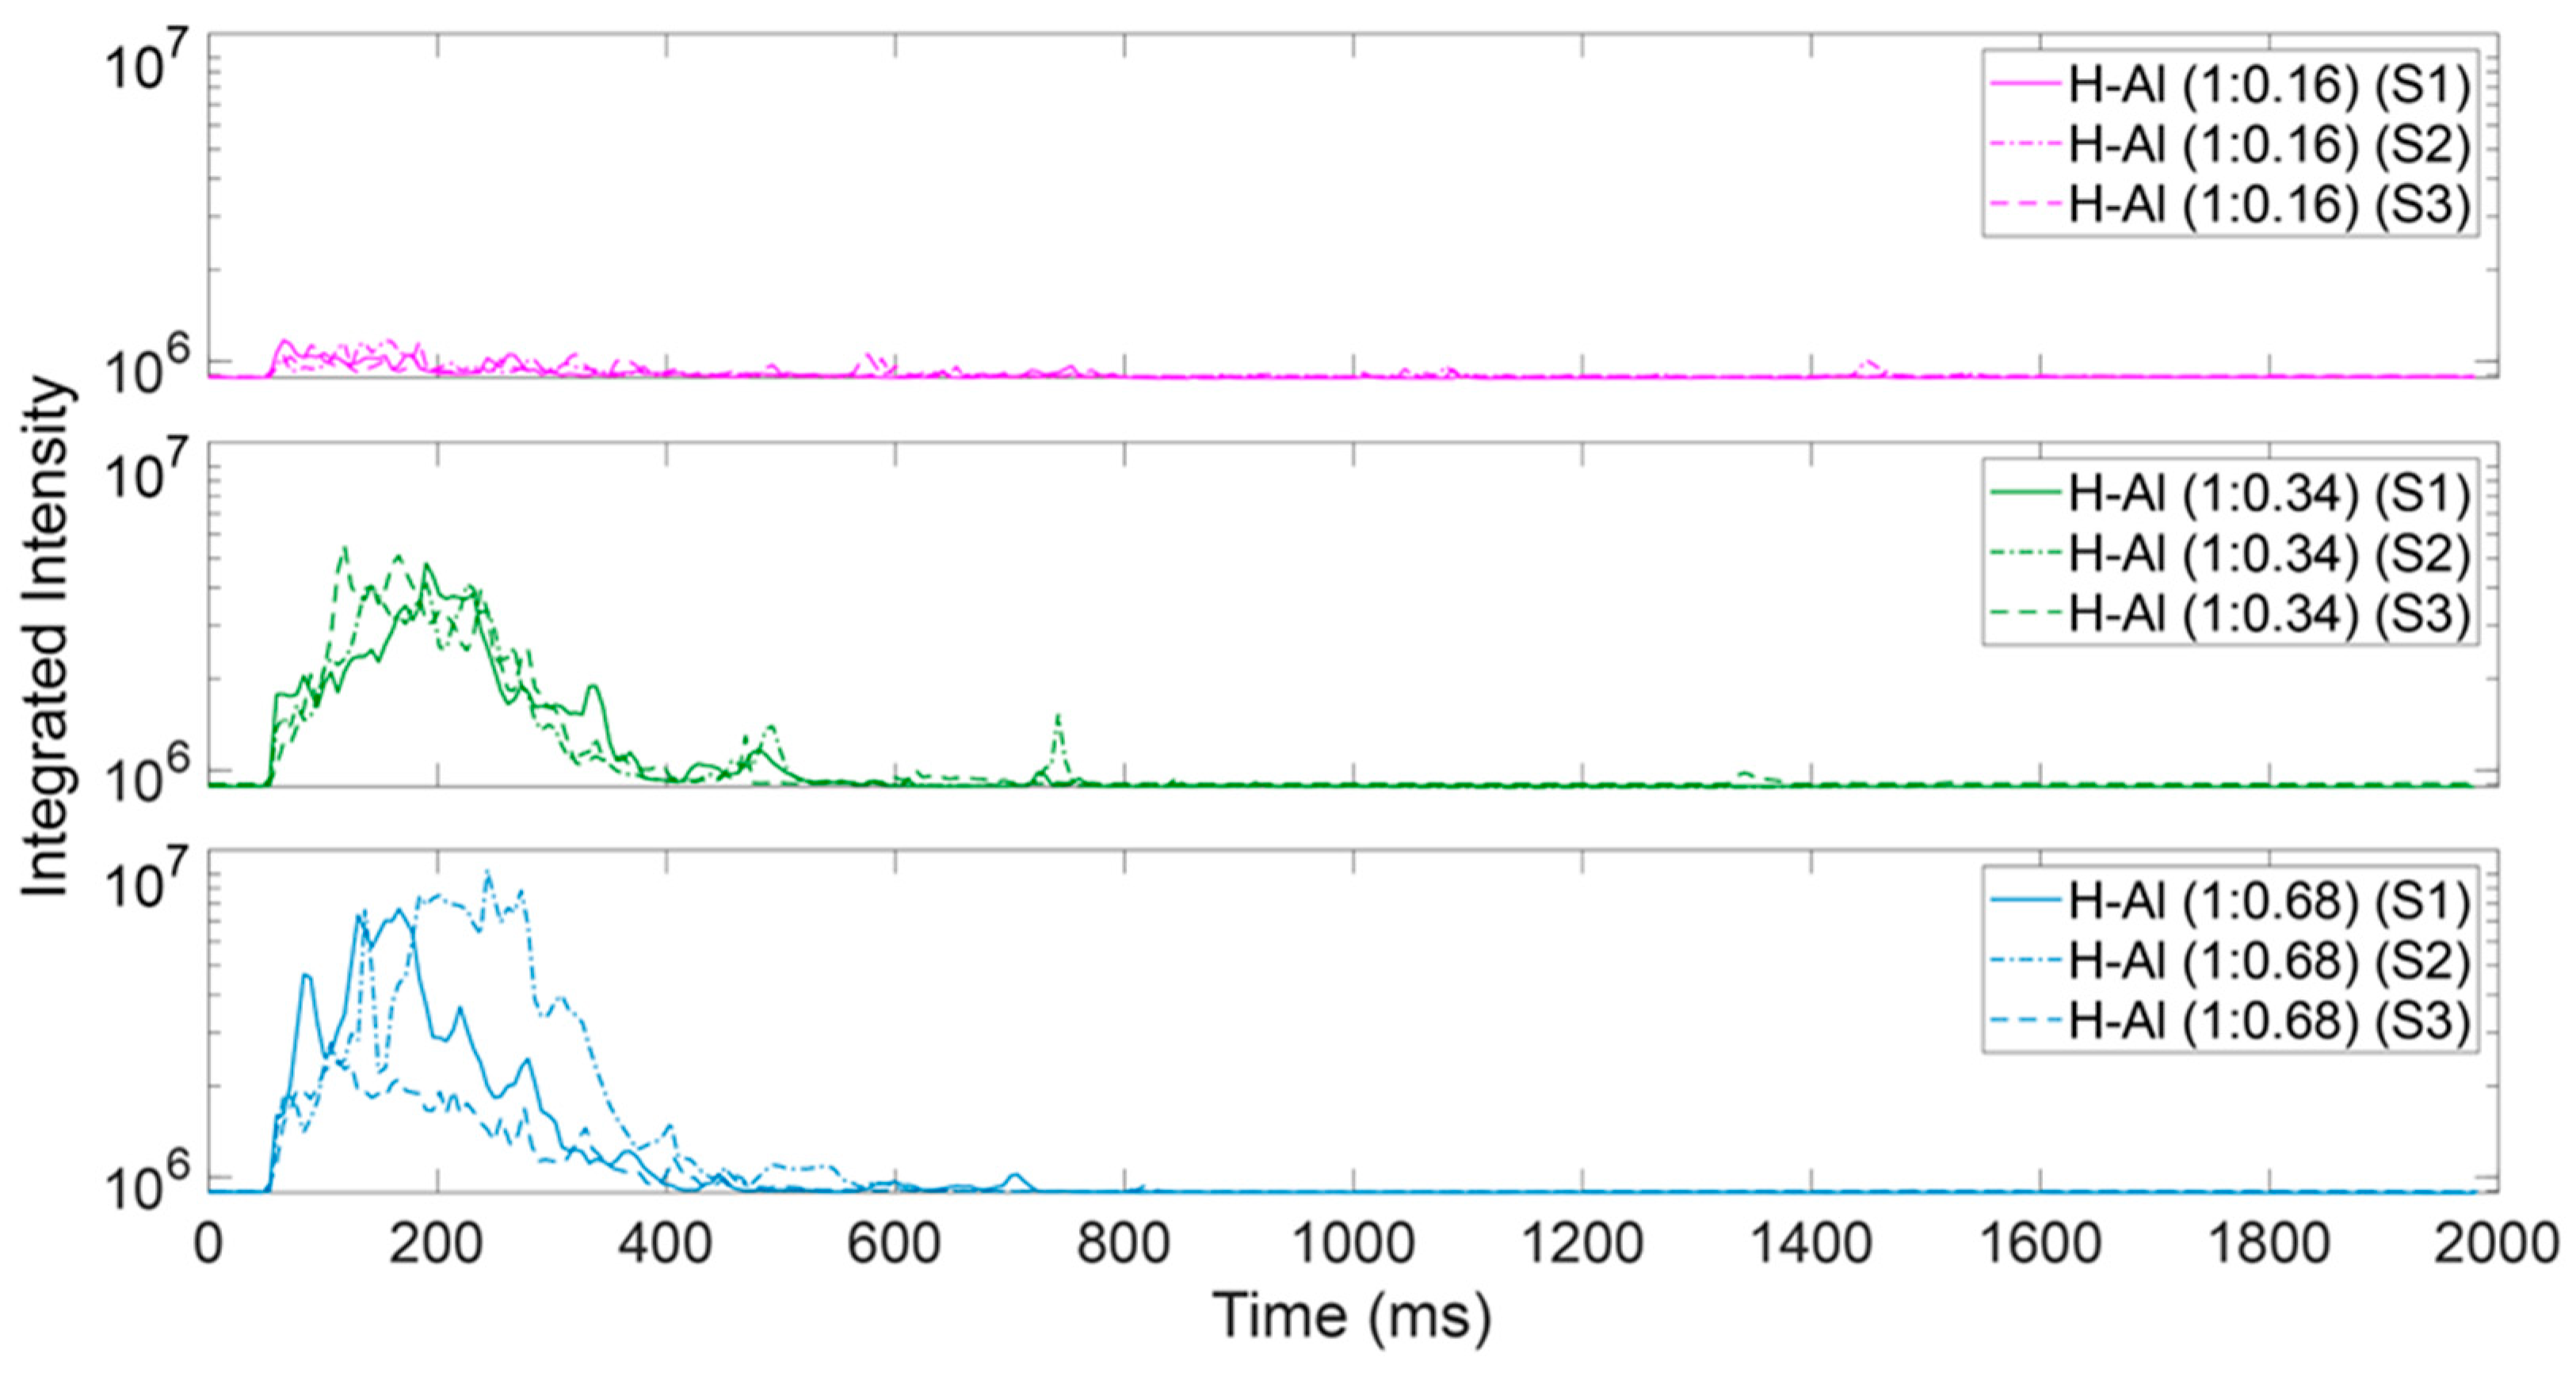
Different material ratios were tested (Figure 6). At very low aluminum content (1:0.15 ratio), little spectral response was observed. As soon as the ratio provides sufficient reacting aluminum, the reaction is visible in the integrated intensity curve. Higher aluminum contents than the stochiometric preferred amount to theoretically fully react (1:0.34) do not lead to visible increased reactions.
4. Conclusions
This work provides suggestions on how to initiate the desired chemical reactions for in-process alloy design and what conditions need to be provided to maintain and finalize those reactions.
- The spectral data of metal vapor melt ejections are an indicator of chemical reactions in the melt. The emitted vapor during laser processing of reacting alloy components contains information about the reaction time and intensity.
- The chemical reaction between hematite and aluminum seems to require the illumination of the laser to maintain, which is likely to provide the mixing for enabling the reaction partner connection.
Author Contributions
Conceptualization, J.V., K.P. and H.N.; methodology, M.S., H.N. and L.W.; validation, M.S., H.N., L.W. and J.V.; formal analysis, M.S., J.V. and H.N.; investigation, H.N., L.W. and M.S.; writing—original draft preparation, J.V.; writing—review and editing, K.P. and H.N.; visualization, M.S., H.N. and L.W.; project administration, H.N.; funding acquisition, J.V. and K.P. All authors have read and agreed to the published version of the manuscript.
Funding
The authors kindly acknowledge the funding of the project AMORF (No. P2022-00202) funded by Energimyndigheten—the Swedish Energy Agency and SMART—Surface tension of Metals Above vapoRization Temperature (Vetenskapsrådet, 2020-04250).
Data Availability Statement
The data presented in this study are available on request from the corresponding author. The data are not publicly available due to privacy reasons.
Acknowledgments
The authors acknowledge the financial support of the Jade2Pro Ph.D. scholarship and the internal research funding provided by the Jade University of Applied Sciences. Mobility support by Erasmus+ Staff Mobility for Training is kindly acknowledged.
Conflicts of Interest
The authors declare no conflict of interest. The funders had no role in the design of the study; in the collection, analyses, or interpretation of data; in the writing of the manuscript; or in the decision to publish the results.
References
- Frerichs, F.; Lu, Y.; Lübben, T.; Radel, T. Process Signature for Laser Hardening. Metals 2021, 11, 465. [Google Scholar] [CrossRef]
- Dausinger, F.; Shen, J. Energy Coupling Efficiency in Laser Surface Treatment. ISIJ Int. 1993, 33, 925–933. [Google Scholar] [CrossRef] [Green Version]
- Watkins, K.; McMahon, M.; Steen, W. Microstructure and corrosion properties of laser surface processed aluminium alloys: A review. Mater. Sci. Eng. A 1997, 231, 55–61. [Google Scholar] [CrossRef]
- Powell, J.; Kaplan, A. Laser cutting: From first principles to the state of the art. In Proceedings of the 1st Pacific International Conference on Application of Lasers and Optics 2004, Melbourne, Australia, 19–21 April 2004; Laser Institute of America: Scottsdale, AZ, USA; Volume 1, p. 101. [Google Scholar]
- Volpp, J. Keyhole stability during laser welding—Part II: Process pores and spatters. Prod. Eng. 2017, 11, 9–18. [Google Scholar] [CrossRef]
- Tsukamoto, S.; Kawaguchi, I.; Arakane, G.; Honda, H. Keyhole behavior in high power laser welding. In Proceedings of the International Congress on Laser Advanced Materials Processing (LAMP), Kharagpur, India, 29–31 August 2022; International Society for Optics and Photonics: Bellingham, WA, USA, 2022. [Google Scholar]
- Koch, H.; Gómez Vázquez, R.; Otto, A. Analysis of Distortion Effects on Weld Pool Dynamics in Laser Beam Welding. In Proceedings of the IWOTE 2014: International Workshop on Thermal Forming and Welding Distortion, Bremen, Germany, 9–10 April 2014; Strahltechnik/BIAS Verlag: Bremen, Germany; pp. 165–172. [Google Scholar]
- Sing, S.L.; Yeong, W.Y. Laser powder bed fusion for metal additive manufacturing: Perspectives on recent de-velopments. Virtual Phys. Prototyp. 2020, 15, 359–370. [Google Scholar] [CrossRef]
- Li, Z.; Sui, S.; Ma, X.; Tan, H.; Zhong, C.; Bi, G.; Clare, A.T.; Gasser, A.; Chen, J. High deposition rate powder- and wire-based laser directed energy deposition of metallic materials: A review. Int. J. Mach. Tools Manuf. 2022, 181, 103942. [Google Scholar] [CrossRef]
- Kumar, K.S. Analytical Modeling of Temperature Distribution, Peak Temperature, Cooling Rate and Thermal Cycles in a Solid Work Piece Welded by Laser Welding Process. Procedia Mater. Sci. 2014, 6, 821–834. [Google Scholar] [CrossRef] [Green Version]
- Poorhaydari, K.; Patchett, B.M.; Ivey, D.G. Estimation of cooling rate in the welding of plates with intermediate thickness. Weld. J. 2005, 84, 149s–155s. [Google Scholar]
- Dewi, H.S.; Volpp, J.; Kaplan, A.F. Short thermal cycle treatment with laser of vanadium microalloyed steels. J. Manuf. Process. 2020, 57, 543–551. [Google Scholar] [CrossRef]
- LDurães, í.; Costa, B.F.; Santos, R.; Correia, A.; Campos, J.; Portugal, A. Fe2O3/aluminum thermite reaction intermediate and final products characterization. Mater. Sci. Eng. A 2007, 465, 199–210. [Google Scholar] [CrossRef] [Green Version]
- Wang, L.L.; Munir, Z.; Maximov, Y. Thermite reactions: Their utilization in the synthesis and processing of materials; Department of Mechanical Aeronautical, and Materials Engineering, University of Cafifornia. J. Mater. Sci. 1993, 28, 3693–3708. [Google Scholar] [CrossRef]
- Xie, J.; Kar, A. Laser welding of thin sheet steel with surface oxidation. Weld. J. 1999, 78, 343-s. [Google Scholar]
- Saravanan, R.; Molina, J.; Narciso, J.; García-Cordovilla, C.; Louis, E. Effects of nitrogen on the surface tension of pure aluminium at high temperatures. Scr. Mater. 2001, 44, 965–970. [Google Scholar] [CrossRef]
- Fedina, T.; Brueckner, F.; Kaplan, A.F.H.; Wilsnack, C. Laser-assisted reduction of iron ore using aluminum powder. J. Laser Appl. 2023, 35, 022007. [Google Scholar] [CrossRef]
- Kaplan, A.F.; Fedina, T.; Brueckner, F. Study of Si-domains enabling local reduction of laser-melted iron ore for iron-making during 3D-printing. Procedia CIRP 2022, 111, 377–380. [Google Scholar] [CrossRef]
- Chmielewska, A.; Wysocki, B.; Buhagiar, J.; Michalski, B.; Adamczyk-Cieślak, B.; Gloc, M.; Święszkowski, W. In situ alloying of NiTi: Influence of laser powder bed fusion (LPBF) scanning strategy on chemical composition. Mater. Today Commun. 2022, 30, 103007. [Google Scholar] [CrossRef]
- Mosallanejad, M.H.; Niroumand, B.; Aversa, A.; Saboori, A. In-situ alloying in laser-based additive manufacturing processes: A critical review. J. Alloy. Compd. 2021, 872, 159567. [Google Scholar] [CrossRef]
- Fuhrich, T.; Berger, P.; Hügel, H. Marangoni effect in laser deep penetration welding of steel. J. Laser Appl. 2001, 13, 178–186. [Google Scholar] [CrossRef]
- Robertson, S.M.; Frostevarg, J.; Kaplan, A.F.H.; Hong, S.M.; Kim, J.-H.; Bang, H.-S. Tailored laser pulse method to manipulate filler wire melt metallurgy from thermal cycles. J. Laser Appl. 2019, 31, 022605. [Google Scholar] [CrossRef]
- Kramida, A.; Ralchenko, Y.; Reader, J.; NIST ASD Team. NIST Atomic Spectra Database, Version 5.10; National Institute of Standards and Technology: Gaithersburg, MD, USA. Available online: https://physics.nist.gov/asd (accessed on 15 May 2023).
- West, J.B.; Broida, H.P. Chemiluminescence and photoluminescence of diatomic iron oxide. J. Chem. Phys. 1975, 62, 2566–2574. [Google Scholar] [CrossRef]
- Toro, C.; Torres, S.; Parra, V.; Fuentes, R.; Castillo, R.; Díaz, W.; Reyes, G.; Balladares, E.; Parra, R. On the Detection of Spectral Emissions of Iron Oxides in Combustion Experiments of Pyrite Concentrates. Sensors 2020, 20, 1284. [Google Scholar] [CrossRef] [PubMed] [Green Version]
- Li, S.; Sanned, D.; Huang, J.; Berrocal, E.; Cai, W.; Aldén, M.; Richter, M.; Li, Z. Stereoscopic high-speed imaging of iron microexplosions and nanoparticle-release. Opt. Express 2021, 29, 34465. [Google Scholar] [CrossRef] [PubMed]
- Keene, B.J. Review of data for the surface tension of pure metals. Int. Mater. Rev. 1993, 38, 157–192. [Google Scholar] [CrossRef]
- Keene, B.J. Review of data for the surface tension of iron and its binary alloys. Int. Mater. Rev. 1988, 33, 1–37. [Google Scholar] [CrossRef]
- Yousefi, E.; Sun, Y.; Kunwar, A.; Guo, M.; Moelans, N.; Seveno, D. Surface Tension of Aluminum Oxide: A Molecular Dynamics Study. AMI Acta Materialia 2021. [Google Scholar] [CrossRef]
- Fiori, L.; Ricci, E.; Arato, E. Dynamic surface tension measurements on molten metal-oxygen systems: Model validation on molten tin. Acta Mater. 2003, 51, 2873–2890. [Google Scholar] [CrossRef]
- Ricci, E.; Arato, E.; Passerone, A.; Costa, P. Oxygen tensioactivity on liquid-metal drops. Adv. Colloid Interface Sci. 2005, 117, 15–32. [Google Scholar] [CrossRef] [Green Version]
Figure 1.
Experimental setup.

Figure 2.
Sample spectrum using a hematite–aluminum mixture (1:0.34) at a laser power of 250 W and 2 s exposure time.
Figure 2.
Sample spectrum using a hematite–aluminum mixture (1:0.34) at a laser power of 250 W and 2 s exposure time.

Figure 3.
Temporally resolved integrated intensity values at different laser exposure times at a fixed laser power of 250 W and a hematite–aluminum (H–Al) ratio of 1:0.34.
Figure 3.
Temporally resolved integrated intensity values at different laser exposure times at a fixed laser power of 250 W and a hematite–aluminum (H–Al) ratio of 1:0.34.

Figure 4.
Resulting nuggets after laser illumination at different exposure times (pictures done with the Stereo Microscope Nikon SMZ1270).
Figure 4.
Resulting nuggets after laser illumination at different exposure times (pictures done with the Stereo Microscope Nikon SMZ1270).

Figure 5.
Temperature-dependent surface tension of iron and aluminum for pure materials and selected alloys based on literature data [27,28,29].

Figure 6.
Integrated intensities over time at different hematite–aluminum ratios.

Disclaimer/Publisher’s Note: The statements, opinions and data contained in all publications are solely those of the individual author(s) and contributor(s) and not of MDPI and/or the editor(s). MDPI and/or the editor(s) disclaim responsibility for any injury to people or property resulting from any ideas, methods, instructions or products referred to in the content. |
© 2023 by the authors. Licensee MDPI, Basel, Switzerland. This article is an open access article distributed under the terms and conditions of the Creative Commons Attribution (CC BY) license (https://creativecommons.org/licenses/by/4.0/).
Share and Cite
MDPI and ACS Style
Volpp, J.; Naesstroem, H.; Wockenfuss, L.; Schmidt, M.; Partes, K. Spectral Visualization of Alloy Reactions during Laser Melting. Alloys 2023, 2, 140-147. https://0-doi-org.brum.beds.ac.uk/10.3390/alloys2030010
AMA Style
Volpp J, Naesstroem H, Wockenfuss L, Schmidt M, Partes K. Spectral Visualization of Alloy Reactions during Laser Melting. Alloys. 2023; 2(3):140-147. https://0-doi-org.brum.beds.ac.uk/10.3390/alloys2030010
Chicago/Turabian StyleVolpp, Joerg, Himani Naesstroem, Lisanne Wockenfuss, Malte Schmidt, and Knut Partes. 2023. "Spectral Visualization of Alloy Reactions during Laser Melting" Alloys 2, no. 3: 140-147. https://0-doi-org.brum.beds.ac.uk/10.3390/alloys2030010