

The Research on Ultrasonic Vibration Amplitudes in Ti6Al4V DED Additive Manufacturing
1
Intelligent Manufacturing College, Shaanxi Institute of Technology, Xi’an 710300, China
2
School of Mechanical Engineering, Xi’an University of Science and Technology, Xi’an 710054, China
*
Author to whom correspondence should be addressed.
Alloys 2023, 2(4), 256-270; https://0-doi-org.brum.beds.ac.uk/10.3390/alloys2040018
Submission received: 3 September 2023
/
Revised: 11 October 2023
/
Accepted: 11 October 2023
/
Published: 19 October 2023
(This article belongs to the Topic Laser Welding of Metallic Materials)
Abstract
:Ultrasonic-assisted Ti6Al4V Directed Energy Deposition (DED) additive manufacturing technology can improve the problem of uneven microstructure caused by laser heating and sudden cooling of the molten pool. In this paper, the numerical analysis and experimental verification methods were adopted. The influencing factors, such as the cavitations’ effect, sound flow enhancement effect, and sound flow thermal effect related to the ultrasonic assistance in the molten pool, were analyzed. After equating the energy of the ultrasound, the model of additive manufacturing was introduced in the form of a heat source. The temperature gradient changes during the solidification process of the molten pool with the addition of ultrasound assistance and the effect of ultrasonic vibration during the manufacturing process on its deposited state and microstructure of solution-aged formed parts were studied. The results showed that when the wire feeding rate is 5 mm/s and the laser scanning speed is 5 mm/s, the optimal laser power is 1000 W~1100 W, corresponding to the optimal ultrasonic amplitude of 120 μm. Then, by comparing the temperature field with the same amplitude of 0 μm (i.e., no ultrasonic vibration) and the microstructure of the formed parts, it was verified that ultrasonic vibration facilitates fluid flow in the molten pool, which could lead to a more uniform temperature distribution. This optimized approach not only enhances the understanding of the process but also contributes significantly to the advancement of related research endeavors.
1. Introduction
Ultrasonic-assisted Directed Energy Deposition (DED) additive manufacturing technology is an advanced approach that incorporates an additional acoustic field to influence the distribution of the temperature field, building upon traditional laser technology [1,2,3].
In 2017, Li et al. [4], from the Donghua University of Traffic Engineering, conducted modeling and simulation analysis on laser-clad SiC/316L composite coatings. They summarized the effects of the ultrasonic field on the temperature distribution and stress distribution within the molten pool in laser additive manufacturing. Shen et al. [5] researched the influence of ultrasonic power on the microstructure and properties of WC-reinforced Fe-based composite coatings. However, when the ultrasonic power exceeded 1000 W, the grain refinement within the molten pool weakened, decreasing the wear resistance of the corresponding cladding layer. Zhang et al. [6] from Xi’an Jiaotong University investigated the effects of ultrasonic vibration assistance on the microstructure distribution and mechanical properties of laser-clad Ti6Al4V deposits in both as-deposited and solution heat-treated conditions. Their research revealed that ultrasonic vibrations impact crystals’ crystallization process and morphology. Wang et al. [7] from Qingdao University of Technology conducted a study on the effects of the application mode and angle of ultrasonic vibration on the macroscopic mechanical properties, microstructure, and metallic phases of laser-clad layers. Todaro et al. [8] reported on the use of high-intensity ultrasound to control the solidification process in additive manufacturing of 316L stainless steel. Using ultrasound promotes the transition from columnar to equiaxed growth, forming fine equiaxed grains with a random crystallographic texture.
Ultrasonic treatment can be carried out during or after deposition, and ultrasonic impact can be applied between laser additive manufacturing gaps to significantly reduce residual stress, eliminate structural defects, suppress the growth of columnar crystals, and ultimately obtain fine grains. In this paper, the characteristic cross-section and axial temperature gradient distribution were analyzed by the parameters of DED additive manufacturing, the different ultrasonic vibration amplitudes were studied, and the optimal ultrasonic amplitudes were determined.
2. Methods and Materials
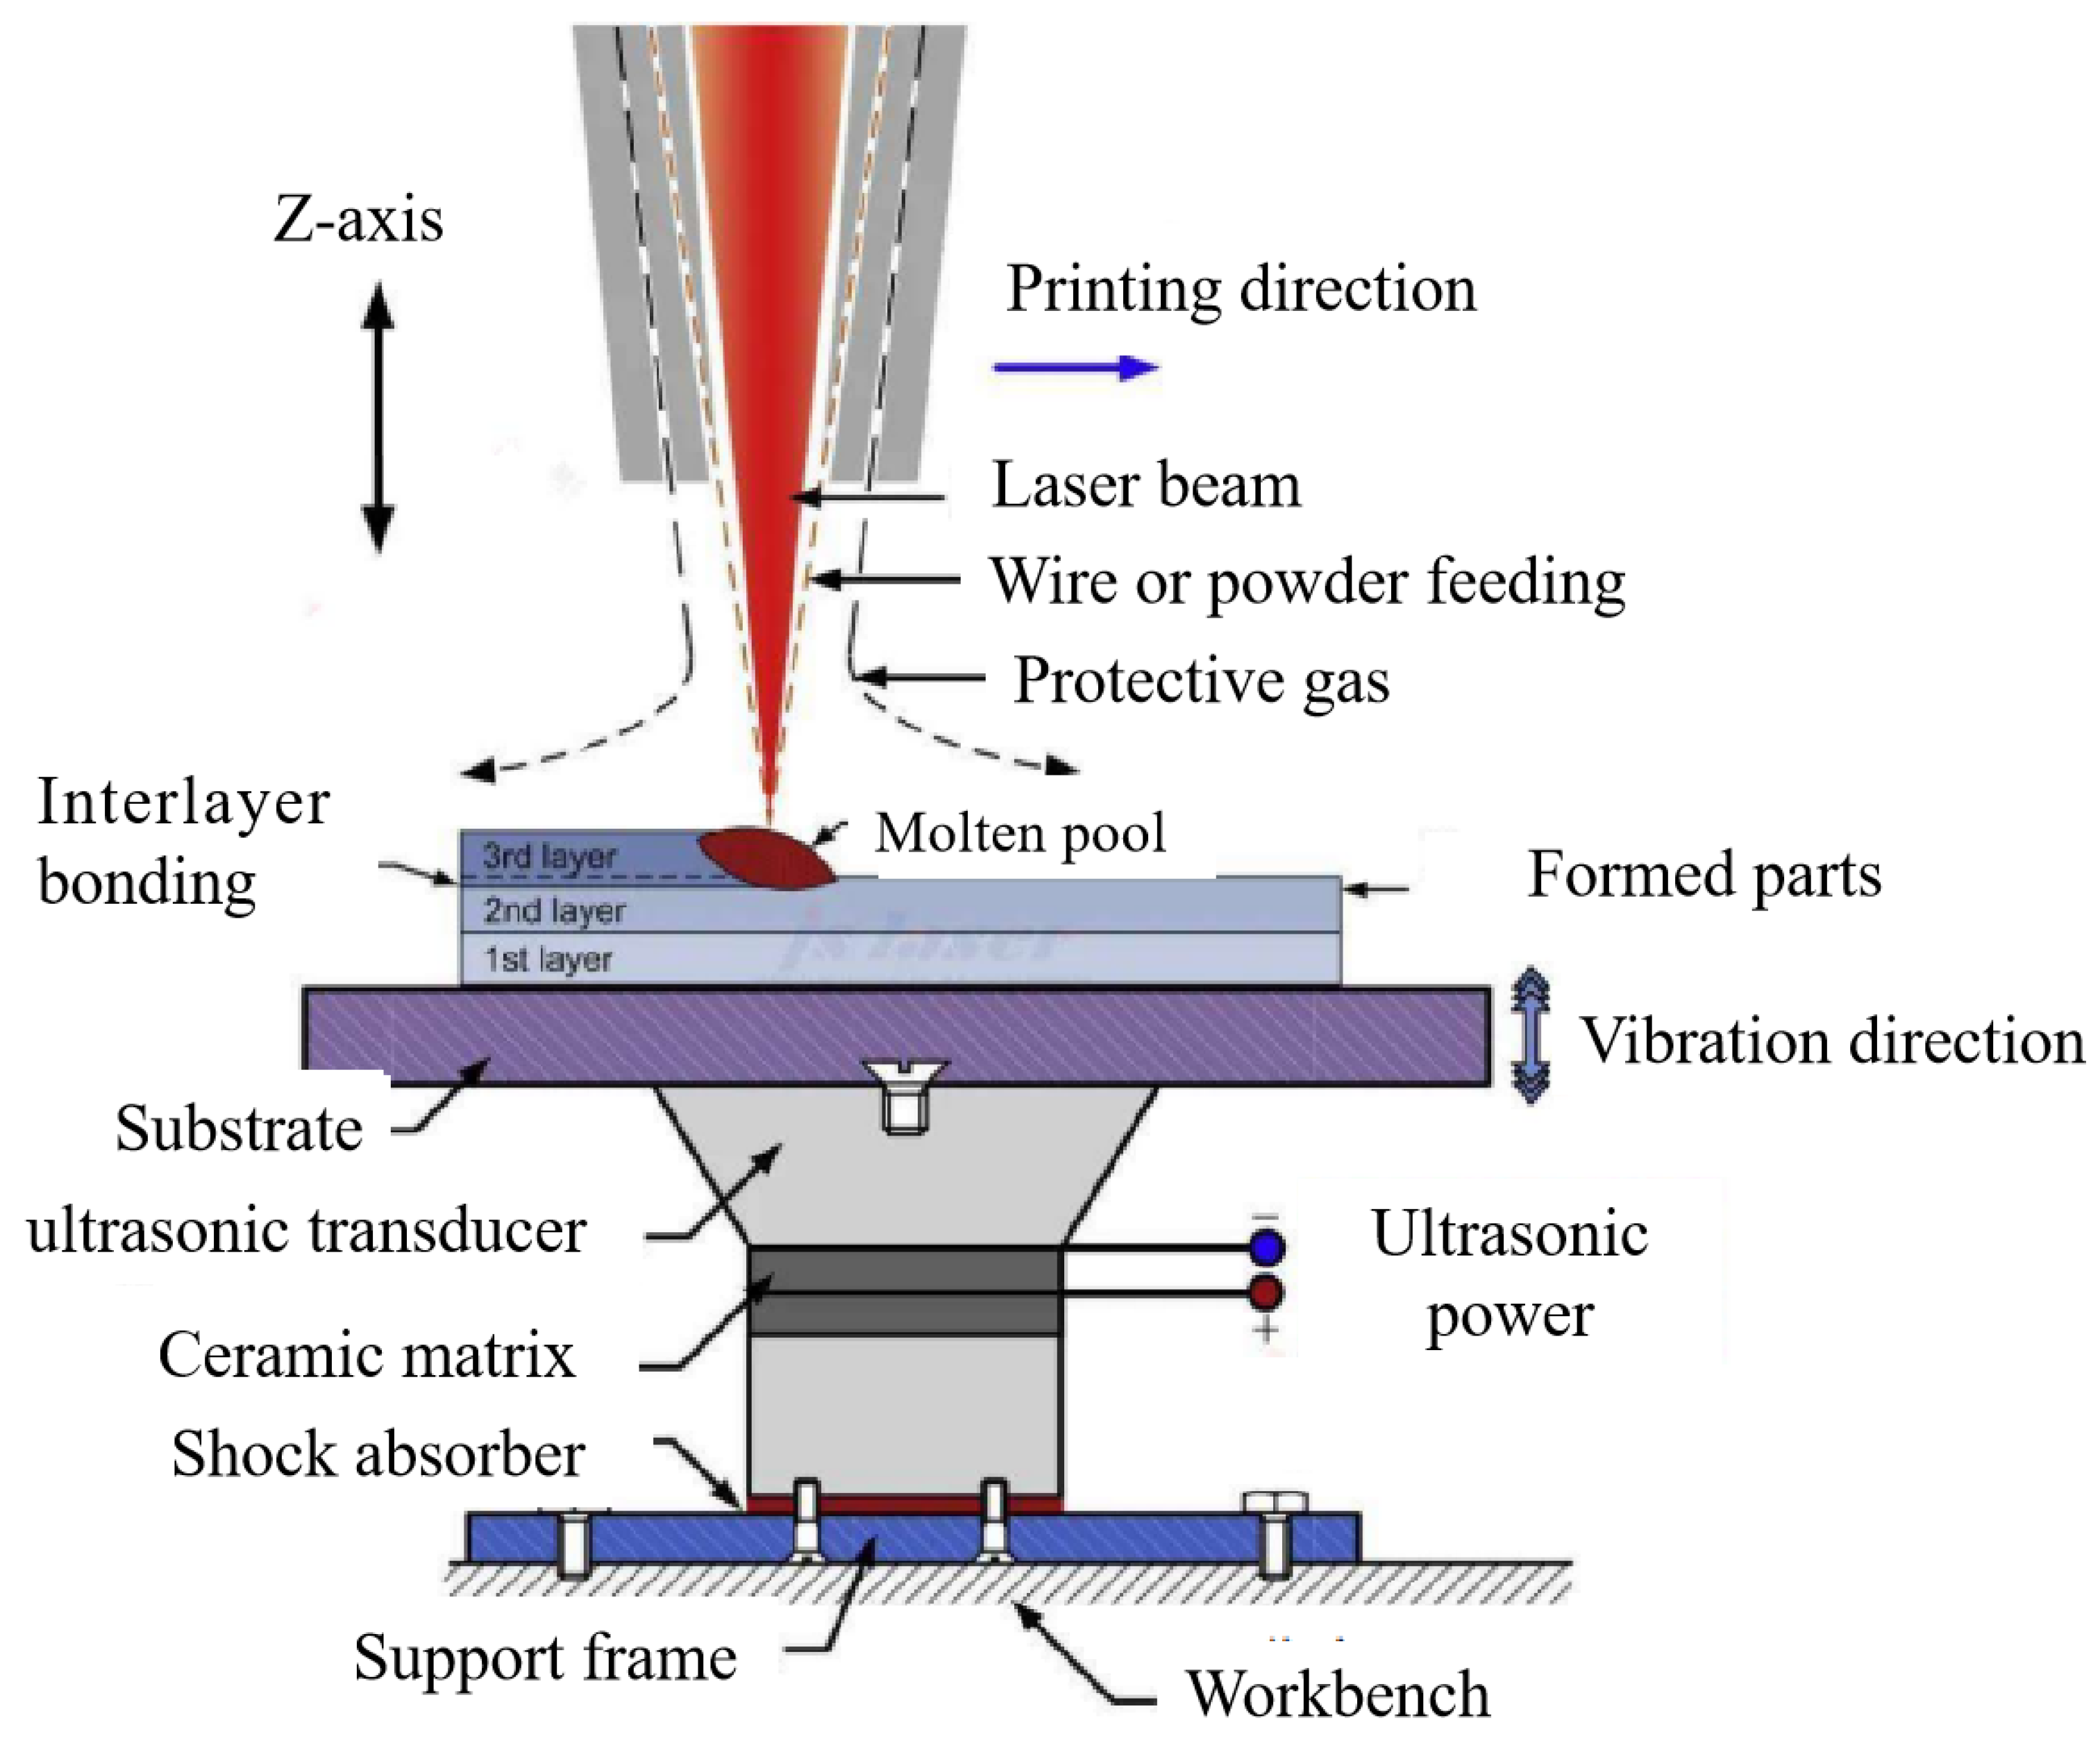
On the basis of no ultrasonic vibration, this paper applied high-frequency vibration to the bottom of the substrate and added ultrasonic vibration of different amplitudes based on the optimal laser power, as shown in Figure 1 [6,7,8,9,10]. It explored the impact of vibration on the flow field, temperature field, and deposition behavior in the molten pool during additive manufacturing, as well as the temperature and flow field changes during additive manufacturing under different ultrasonic vibration amplitudes. The optimal process parameters for ultrasonic-assisted additive manufacturing technology were selected. By studying this technology, it can be applied to other metal AM technologies, such as PBF and WAAM.
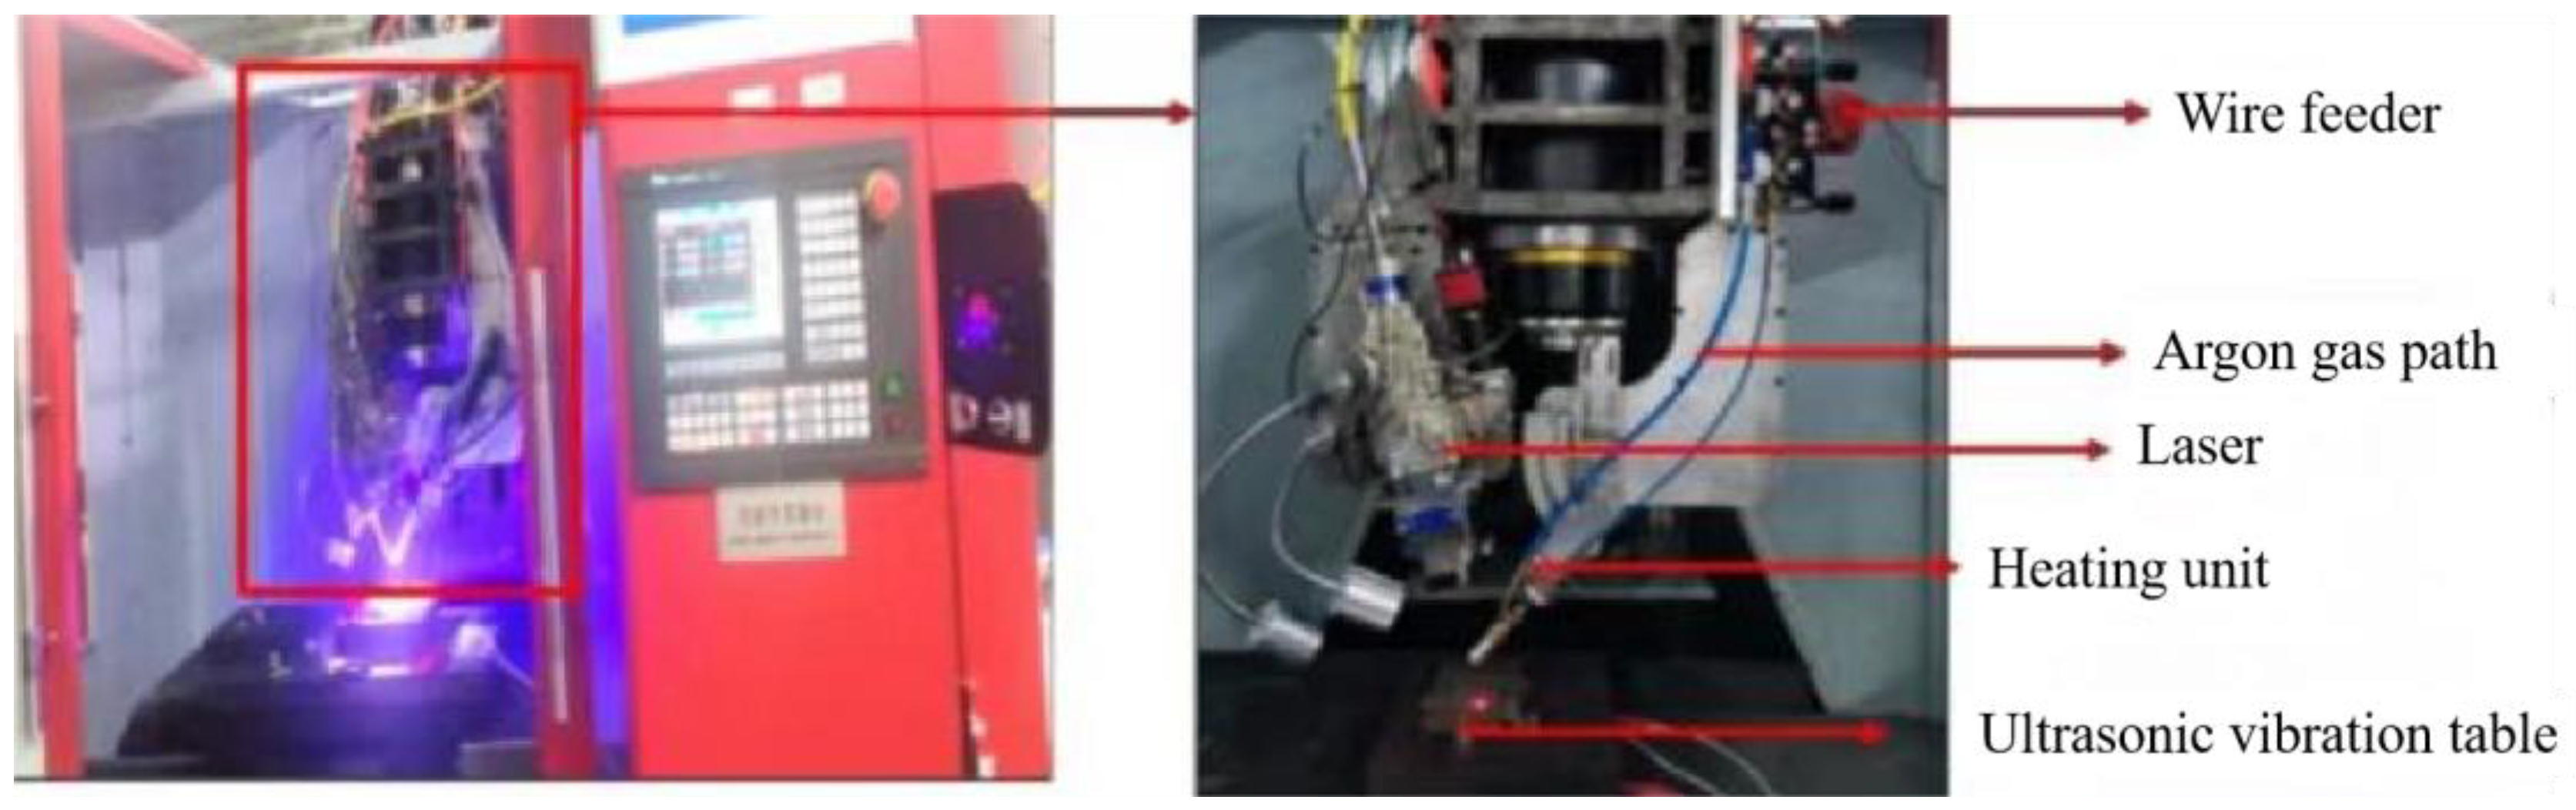
Figure 2 depicts the experimental setup for the ultrasonic-assisted additive manufacturing system. The experimental workbench was modified from a BCH850 high-speed CNC milling machine. In an argon gas environment, a pulsating wire-feeding mechanism is utilized to melt the metal wire through laser heating and deposit it onto the test platform equipped with the ultrasonic device.
In this paper, Ti-6Al-4V titanium alloy was selected as the melting material. The substrate was a Ti-6Al-4V titanium alloy plate with a thickness of 4 mm.
3. The Cavitations’ Effect of Ultrasound
Due to the relatively high structural strength of molten metal, the cavitations’ effect within the molten pool under the influence of ultrasonic vibration requires that the structural strength of the molten metal (P) satisfies Equation (1) [9].
where ε is the surface tension coefficient of the molten metal (N/m), r is the initial radius of cavitations’ bubbles in the molten pool (m), Ps is the initial pressure value of the molten metal (Pa), and PV is the saturation vapor pressure (Pa).
As the temperature increases, the saturation vapor pressure of cavitation bubbles within the molten pool also rises continuously; additionally, the cavitation bubbles absorb energy from the acoustic field, causing an increase in their radius and consequently leading to a decrease in the value of P. Furthermore, combined with Equation (2), the cavitations’ effect also depends on the intensity of the acoustic field. When the acoustic field intensity exceeds a certain threshold, it aids in generating cavitations’ nuclei. Due to the presence of metal vapor and its approximation to an ideal gas within cavitations’ nuclei, the pressure inside is inevitably related to temperature field variations and the molten metal’s viscosity characteristics, as shown in Equation (3) [10].
where is the ambient temperature (°C), and is the boiling point of the corresponding molten metal (°C).
Due to cavitation nuclei within the molten pool, they continuously expand under the influence of ultrasonic vibration and eventually experience instantaneous collapse due to exceeding the structural strength of the metal. High temperatures and pressures are generated around the cavitation bubble, and the energy released due to the rapid collapse of the air bubble acts on the surrounding molten metal, resulting in an extremely energetic microjet. This phenomenon is known as the transient cavitation effect. The pressure generated during the collapse of the cavitation bubble can be represented by Equation (4) [10].
where represents the pressure inside the cavitation bubble in the molten metal (Pa), denotes the sum of external pressures acting on the cavitation bubble (Pa), and μ is a dimensionless coefficient.
4. Numerical Simulations
Due to the cavitation effect, sound flow strengthening effect, and sound flow heat effect of ultrasound, the flow of the metal solution in the molten pool is promoted. The rapid fragmentation of cavitation nuclei will generate local high-temperature and high-pressure micro jets, breaking dendrites, promoting grain refinement and uniform distribution of grains, making the micro-structure of materials more uniform during the solidification process, and improving the overall performance of additive manufacturing parts.
4.1. Ultrasonic Energy Equivalence
The acoustic streaming effect promotes the flow of molten metal within the melt pool, and the thermal effect also influences the temperature field of the melt pool. This constitutes a complex multi-physics system. Furthermore, due to the high frequency of ultrasonic vibration (around 20 kHz), the load on the substrate undergoes rapid changes in the time domain. Performing transient analysis directly would result in a significant computational burden. The energy calculation of ultrasonic waves can be expressed as Equations (5)–(7). The energy is influenced by factors such as the ultrasonic attenuation coefficient of the substrate, the density of the substrate, and the speed of sound within the substrate.
In the equation, represents the equivalent energy of ultrasonic vibration, which is the energy absorbed per unit volume of molten material (J/m3); represents the acoustic intensity of the ultrasonic waves; and represents the ultrasonic attenuation coefficient of the substrate, which can be calculated using Equation (13), where N is a number not greater than 10 [11].
It can be concluded that ultrasonic vibration slightly increases the temperature of the melt during additive manufacturing. Different ultrasonic amplitudes result in different temperature field distributions. By comparing the temperature gradients at different amplitudes, selecting a smoother gradient is more favorable for crystallizing the crystals within the melt pool and reduces residual stress caused by rapid heating and cooling. This equivalent method resolves the issue of excessive computational burden due to the rapid changes in load caused by ultrasonic vibration over time. It also reflects, to some extent, the impact of different ultrasonic amplitudes on the temperature variation within the melt pool, facilitating the selection of optimal process parameters for the ultrasonic amplitude.
4.2. Optimal Ultrasonic Amplitude
The basic parameter settings for simulating ultrasonic-assisted additive manufacturing are presented in Table 1. Except for the addition of ultrasonic vibration assistance, all other parameters are set according to the simulation parameters without ultrasonic vibration. The laser power is selected as the previously determined optimal value of 1100 W.
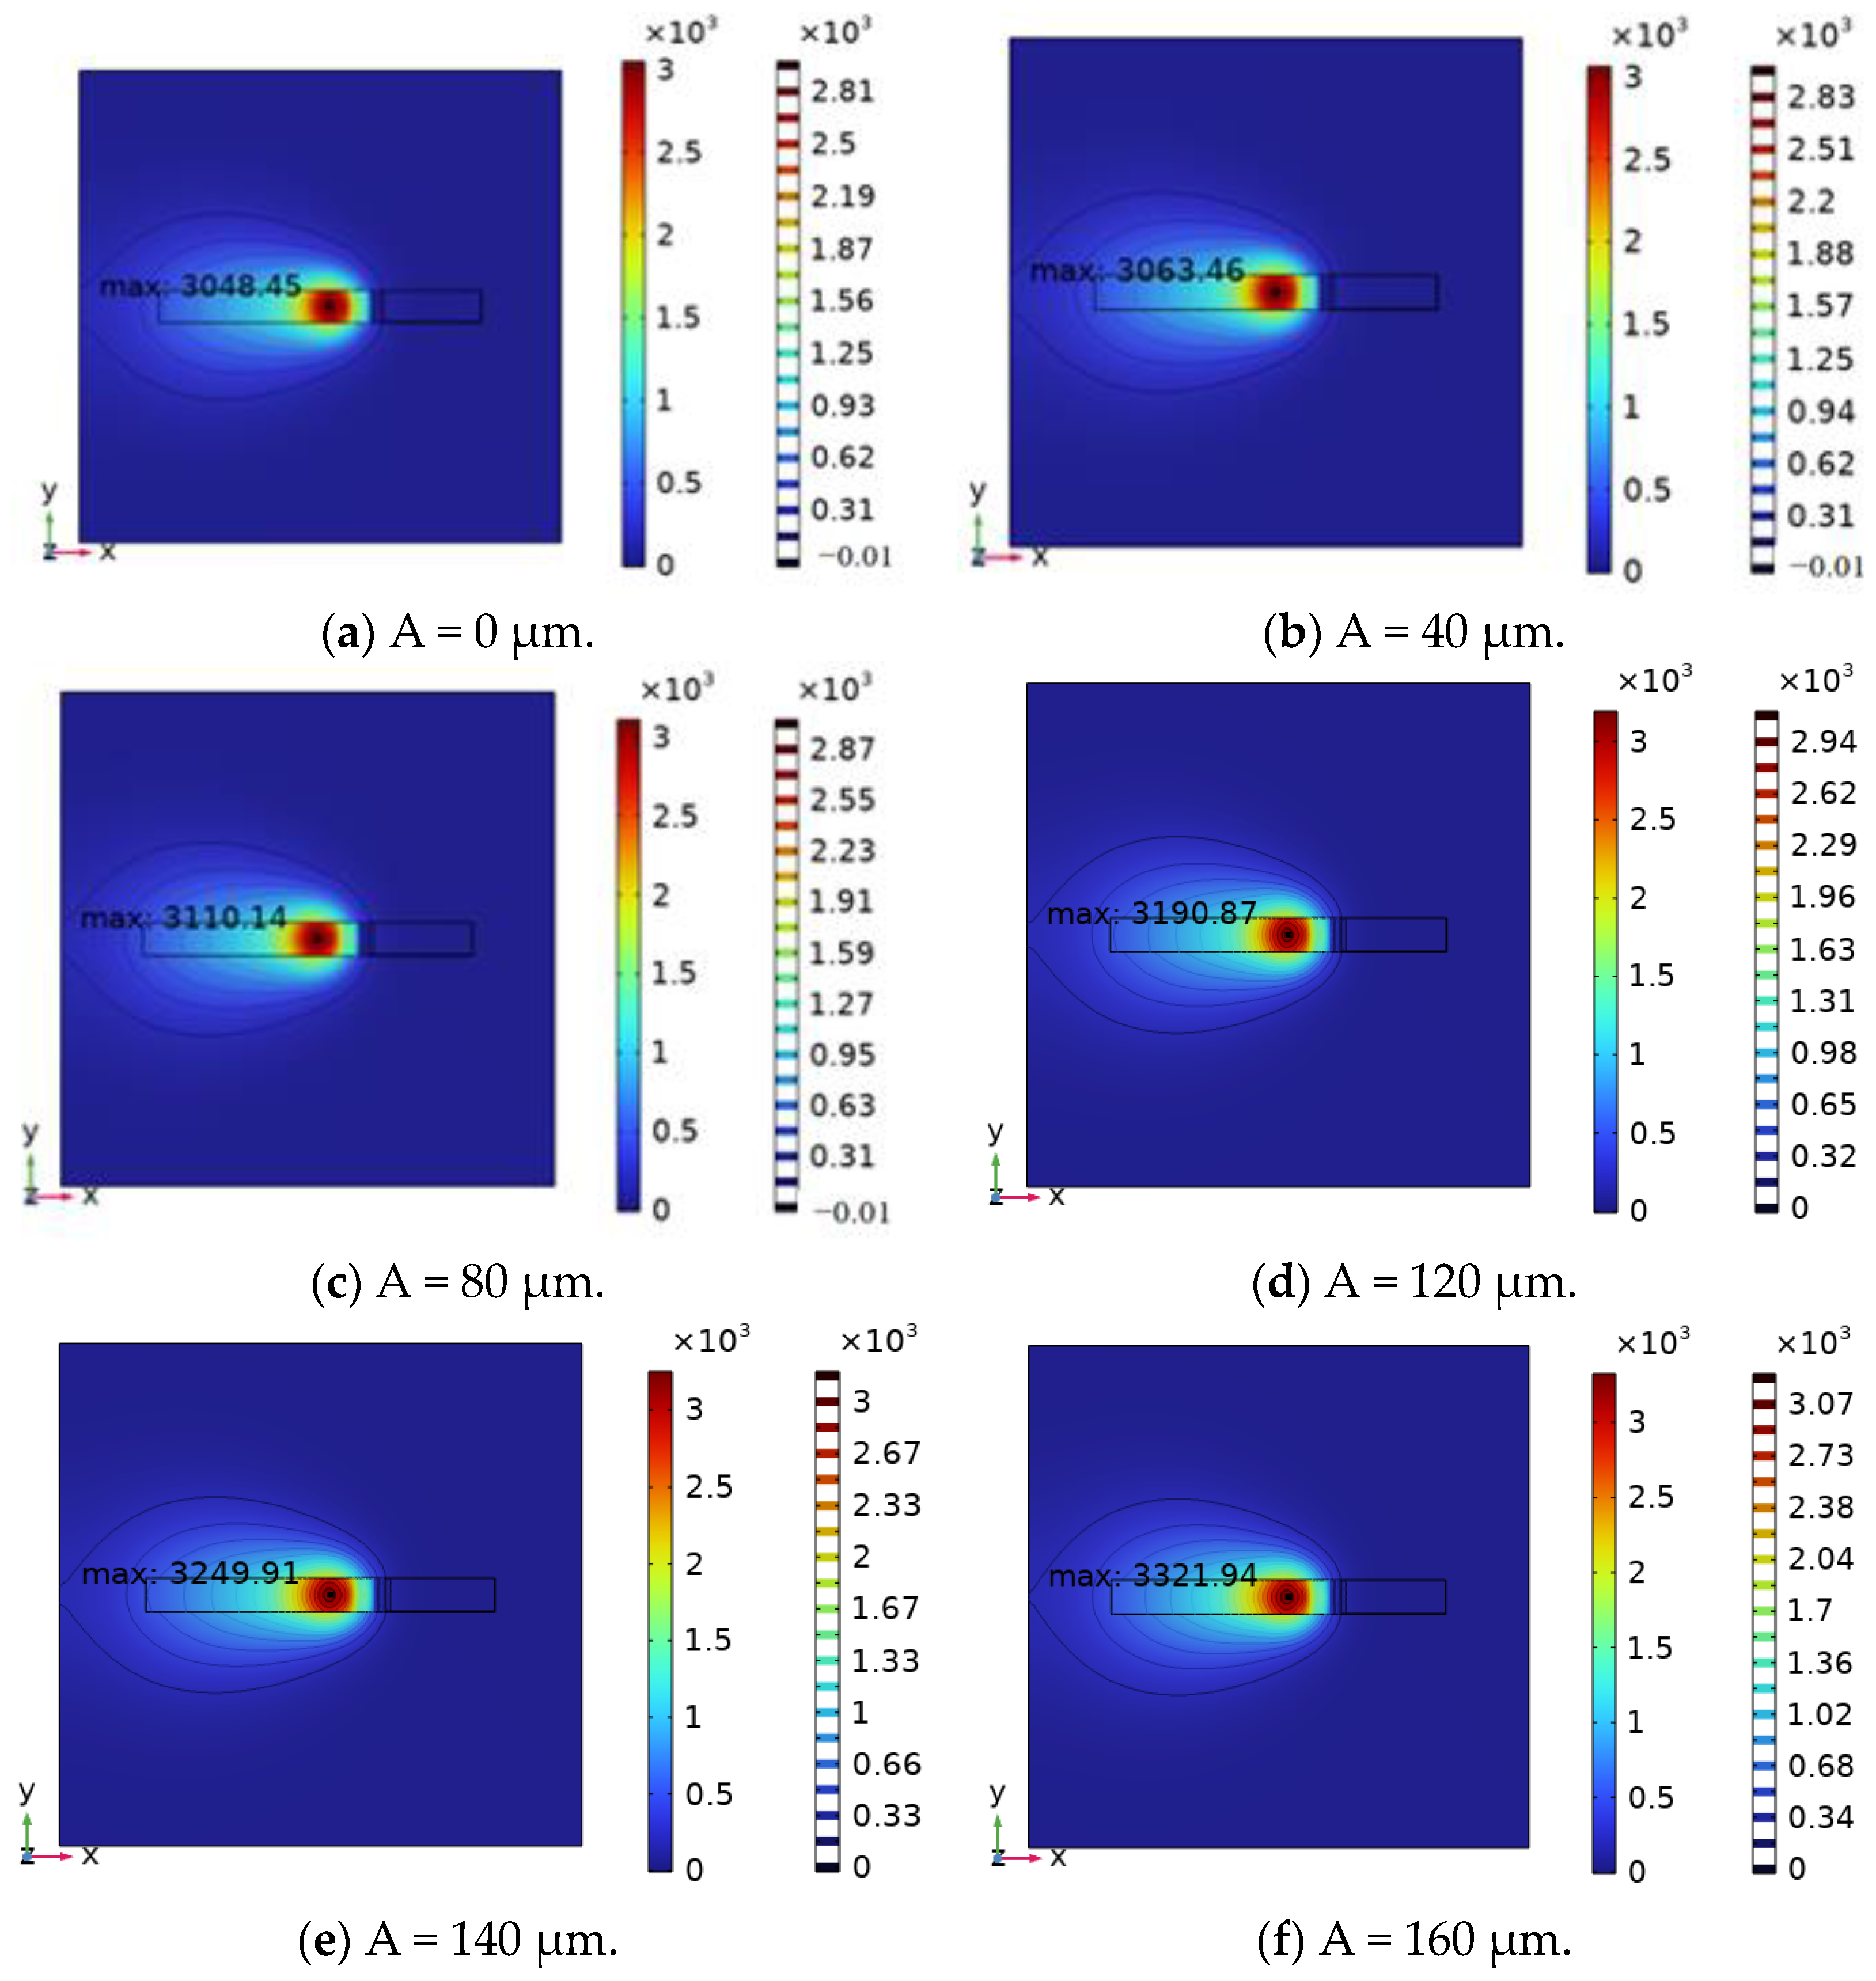
The temperature field distribution of the substrate under different ultrasonic amplitudes is shown in Figure 3.
As the ultrasonic amplitude increases, the maximum temperature of the melt pool during additive manufacturing also increases to a certain extent, which is conducive to the melting of printing materials. The impact of ultrasonic vibration on the performance of additive manufacturing parts was mainly reflected in the effect of ultrasonic vibration on the precipitation and deposition behavior of grains in the molten pool during the solidification process as the laser light source gradually moved away after metal melting. The rapid and slow change in temperature had become the key to the uniformity of metal particle crystallization deposition and tissue distribution. Therefore, analyzing the temperature gradient in the molten pool during solidification under different ultrasonic amplitudes was crucial for selecting the optimal ultrasonic amplitude.
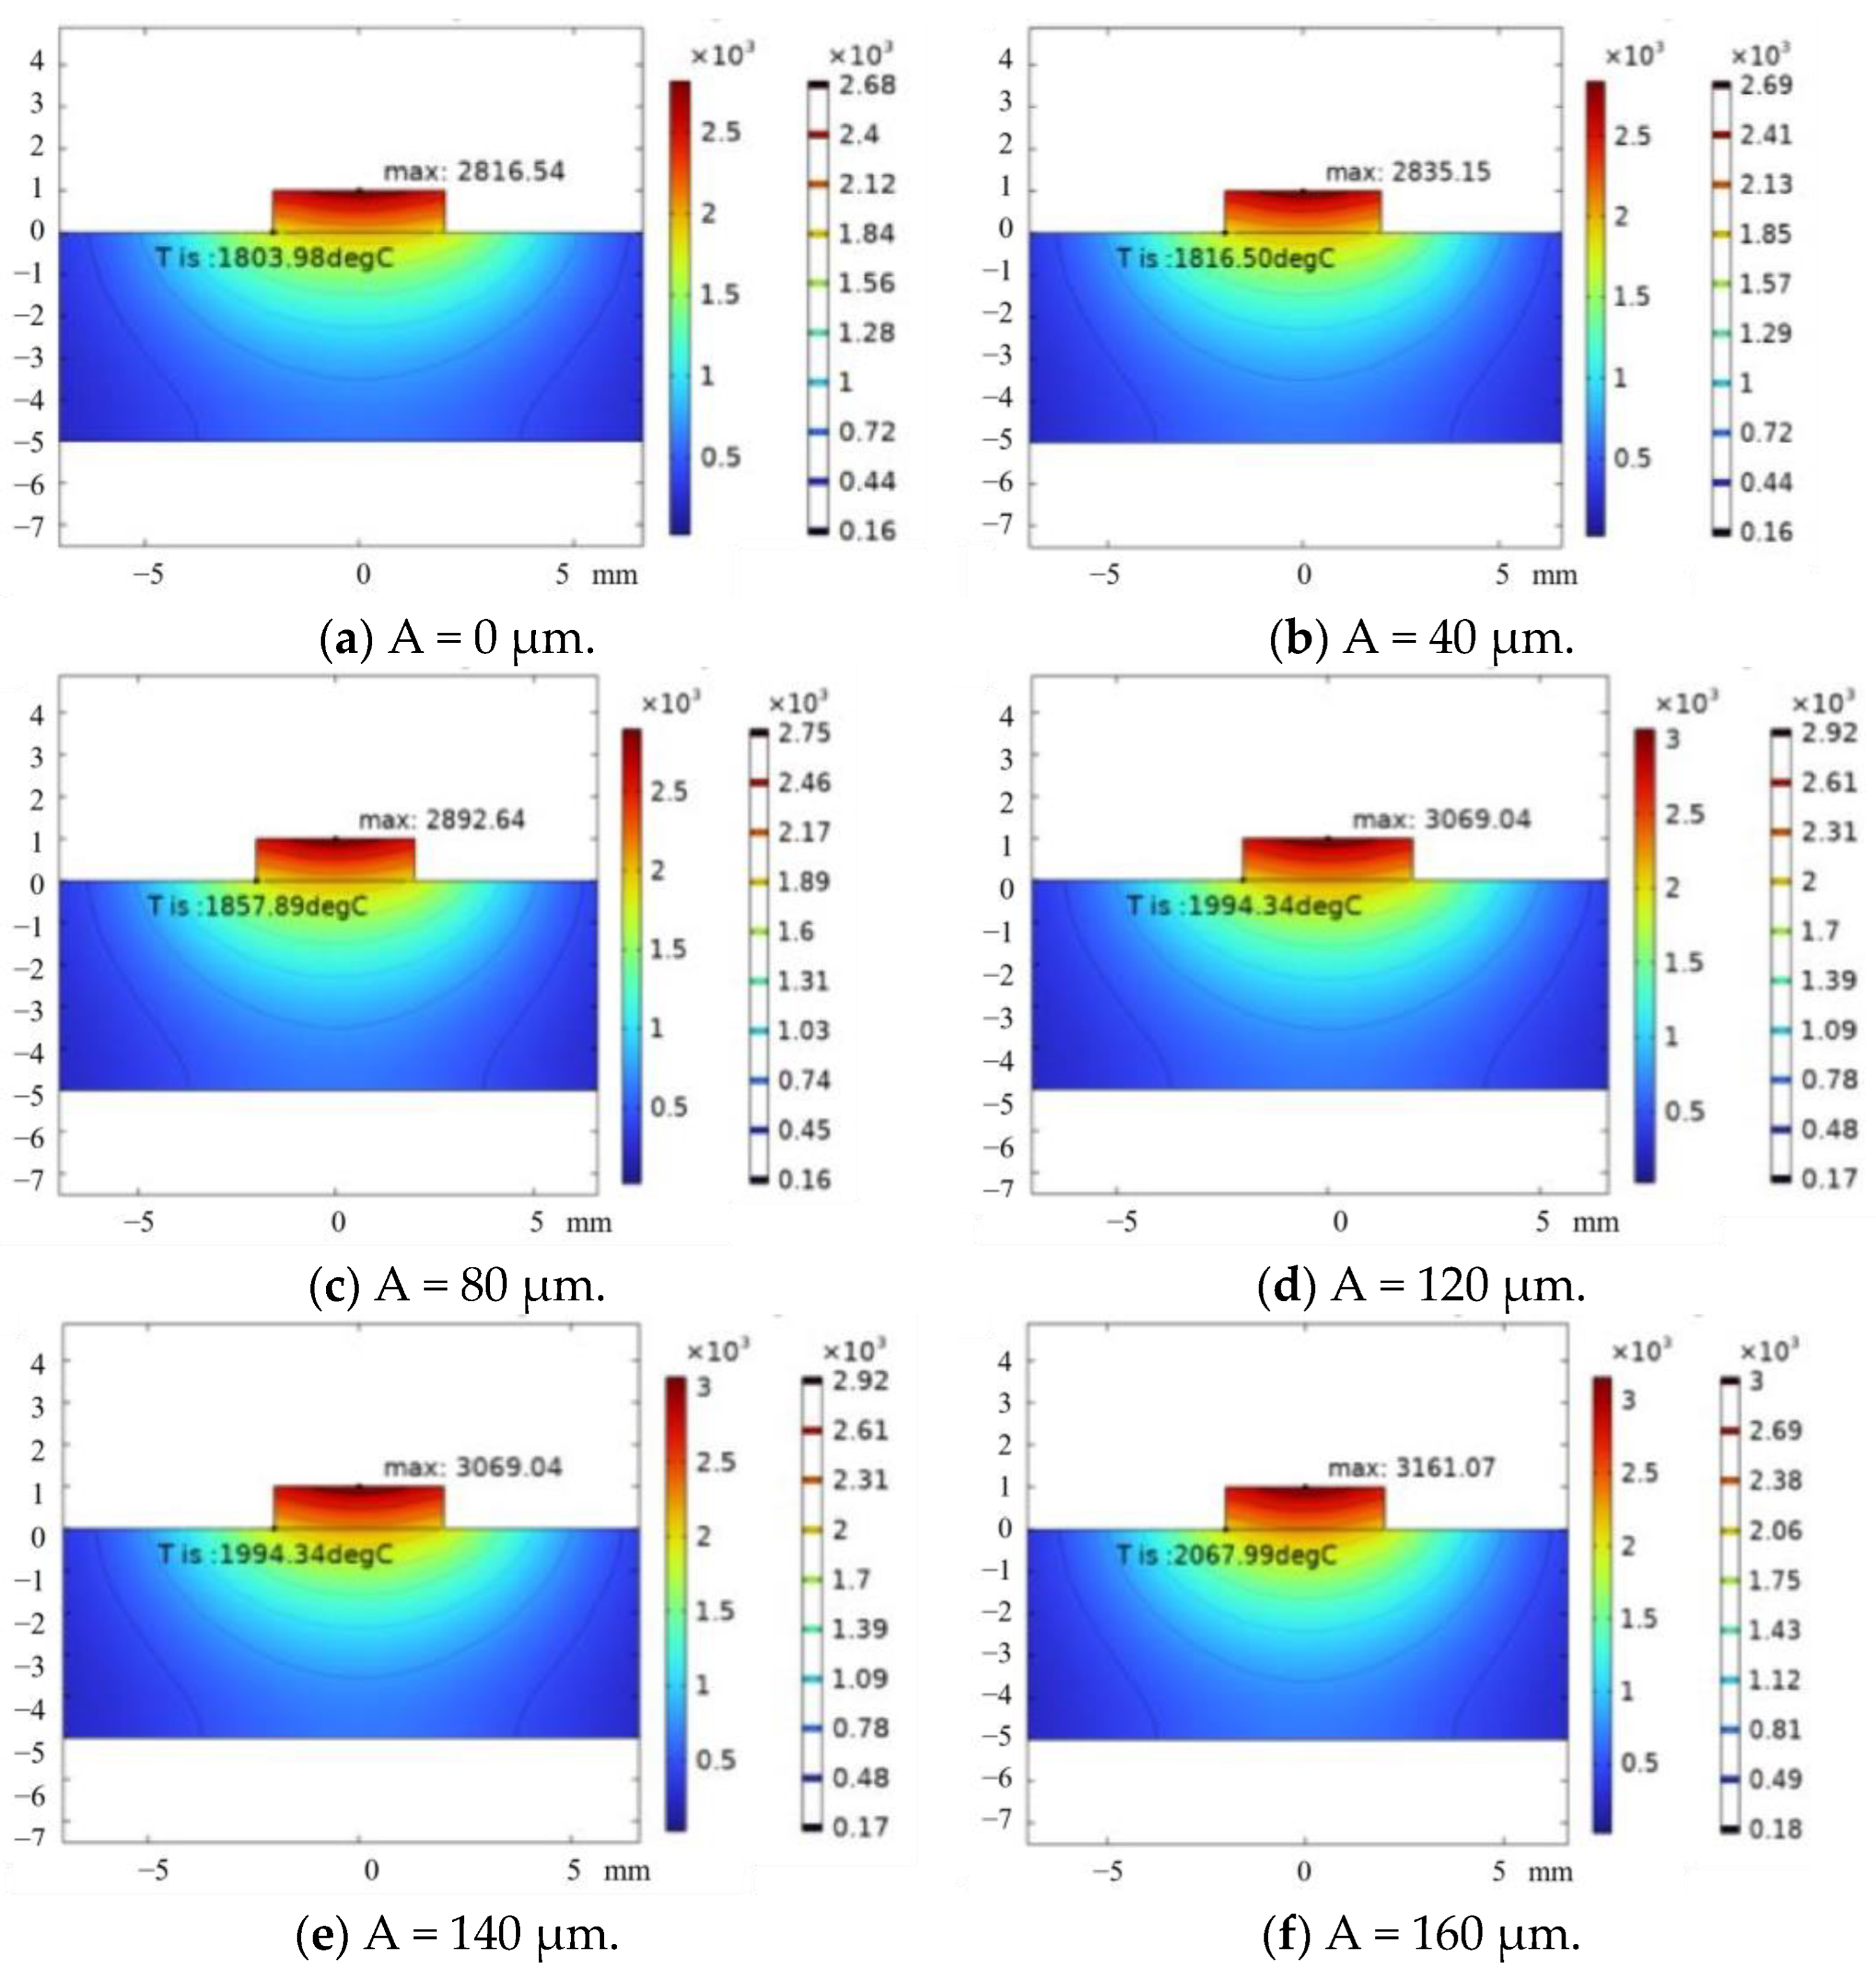
Figure 4 shows the temperature distribution of the middle section under different ultrasonic amplitudes. In the figure, it can be seen that the temperature distribution did not change significantly after applying ultrasonic vibration, and the position of the lowest point of interlayer temperature did not change. Its temperature slightly increased with the increase in ultrasonic amplitude. Compared to the absence of ultrasonic vibration assistance, the lowest point temperature between the lower layers increased by 12.52 °C under the condition of an amplitude of 40 μm and by 53.91 °C under the condition of an amplitude of 80 μm.
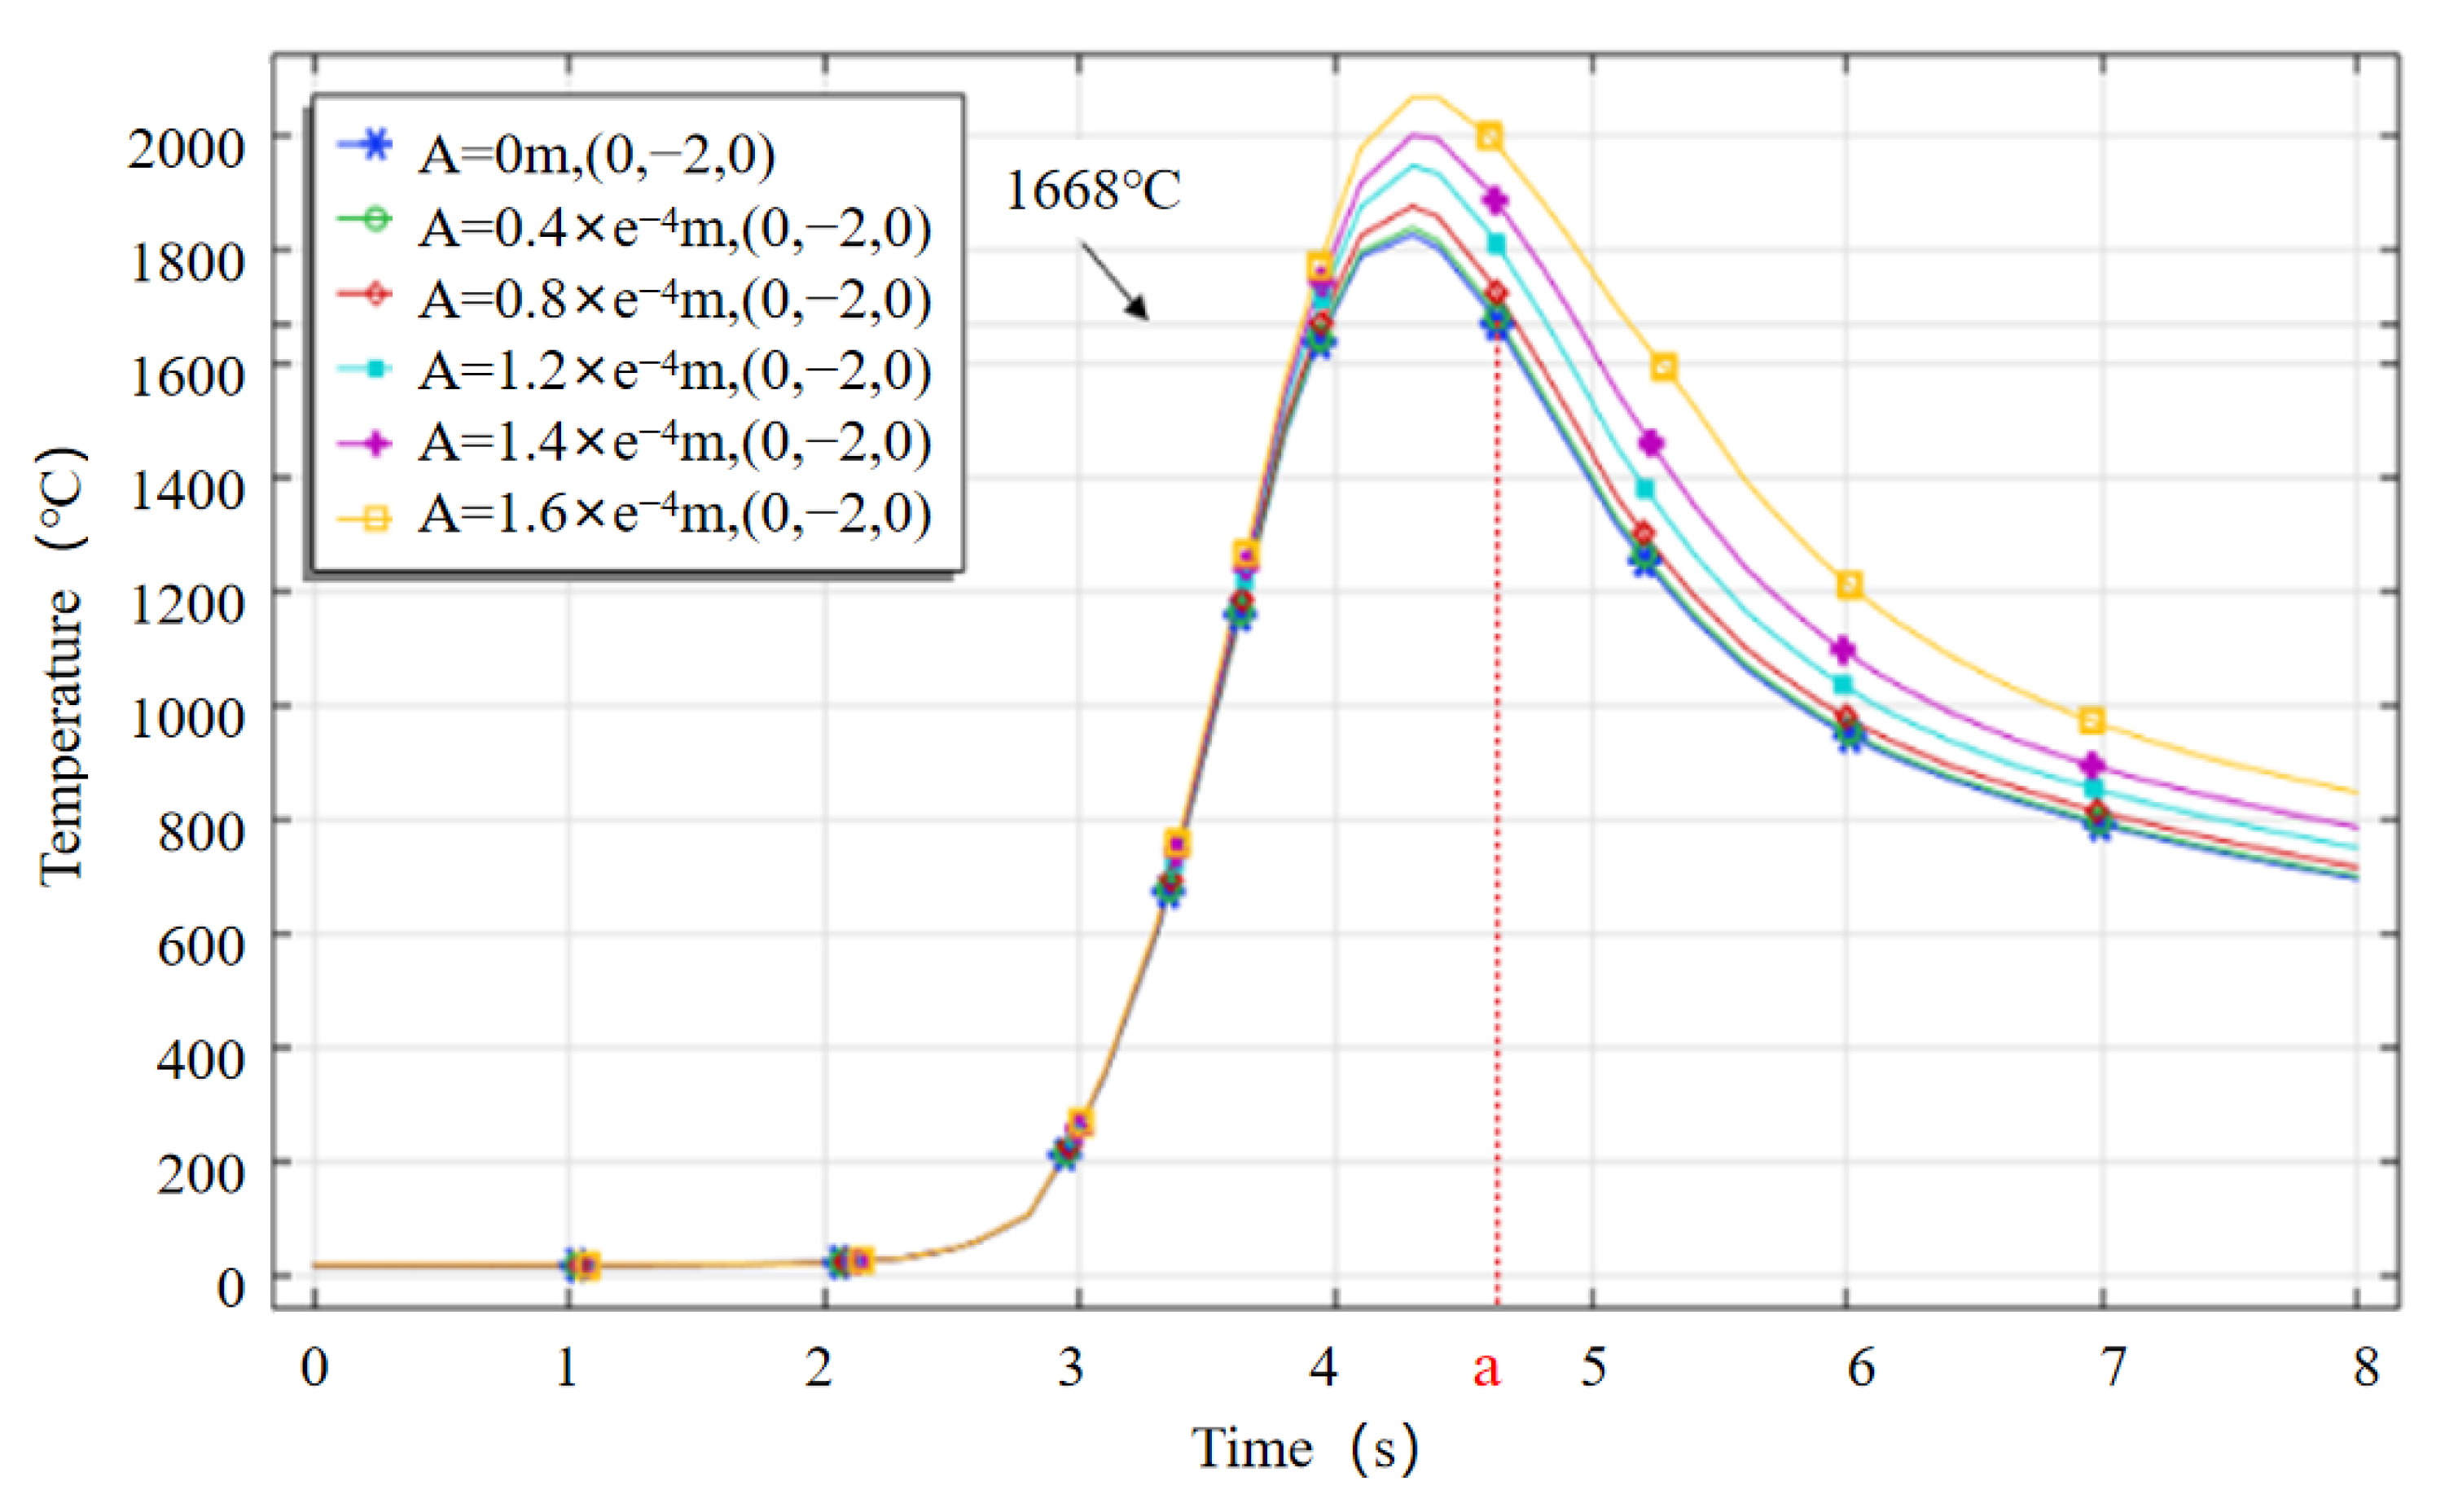
Figure 5 shows the temperature variation curve of the lowest point of interlayer temperature during additive manufacturing under different ultrasonic amplitudes over time. It can be seen that the printed materials at different amplitudes have completely melted at t = 4 s, and the temperature further increases. The highest temperature is reached around t = 4.4 s, and solidification begins after t = 4.6 s (point a in Figure 5).
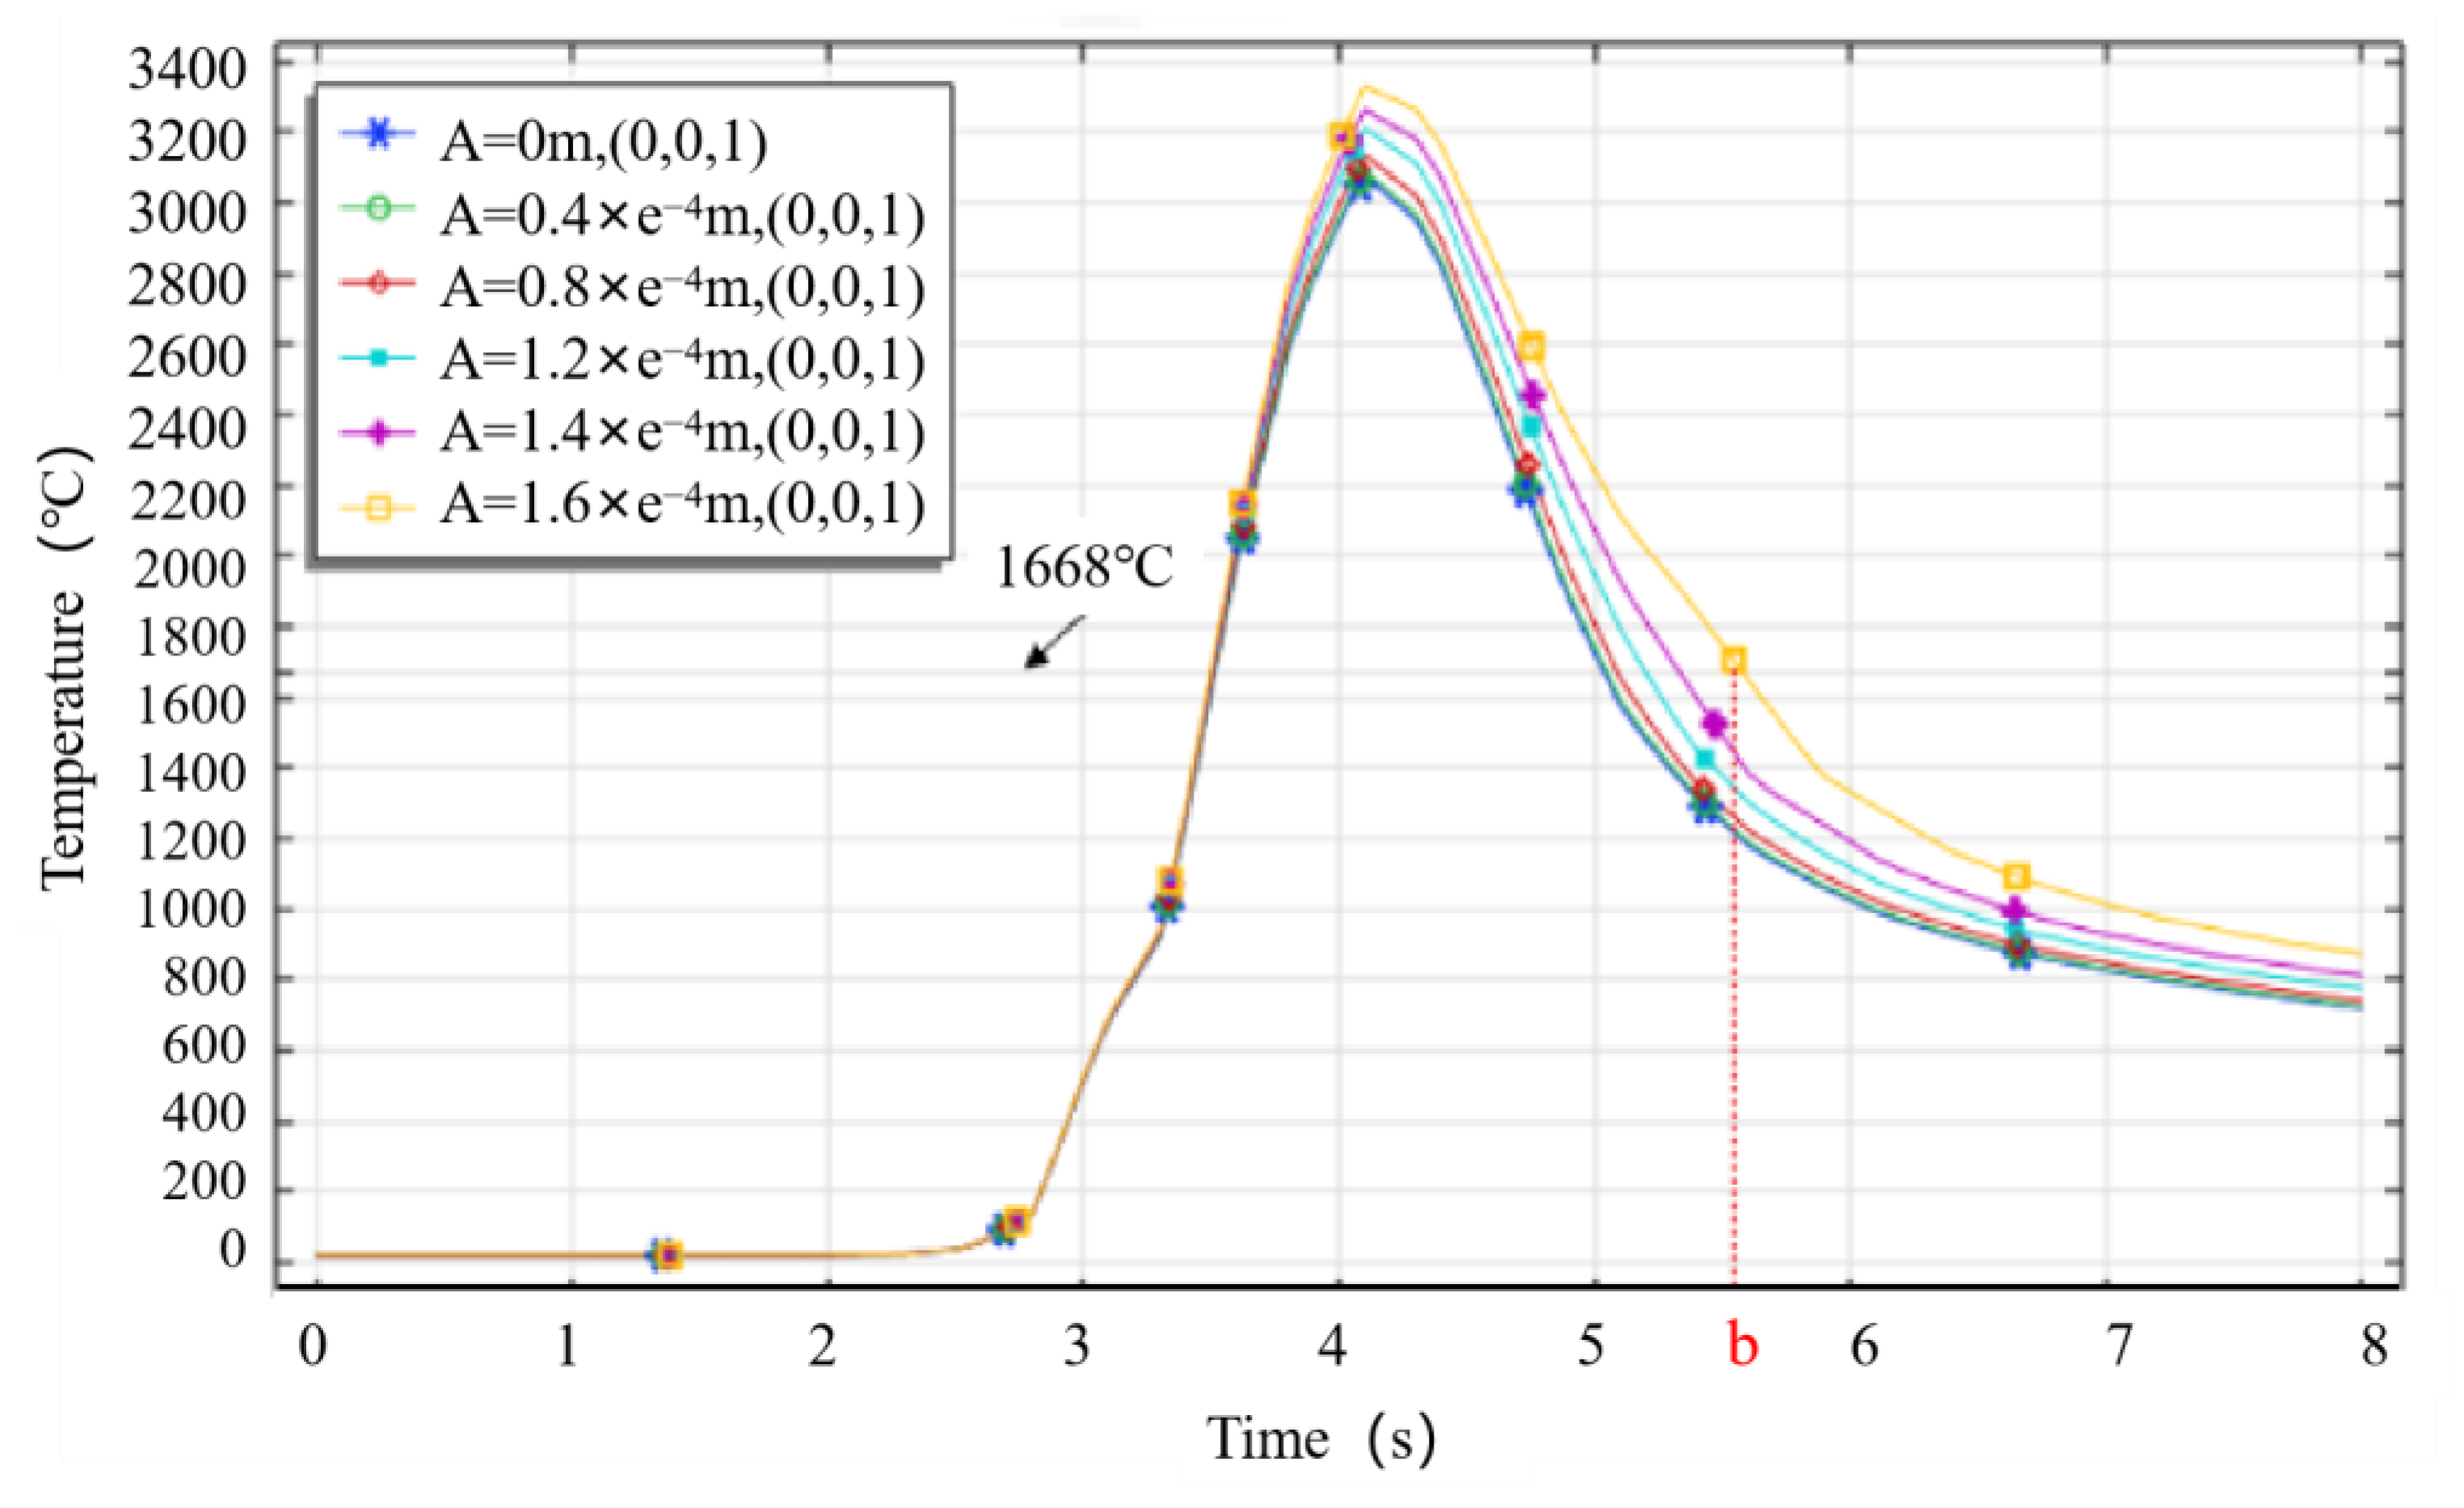
Figure 6 displays the temperature variation curves of the highest point within the volume during the additive manufacturing process under different ultrasonic amplitudes. The highest temperature point is approximately located near the coordinates (0,0,1). In the graph, it can be deduced that even with the maximum ultrasonic amplitude (A = 160 μm), the material is completely solidified at around t = 5.6 s (point b in Figure 6). Therefore, the temperature gradient analysis for different ultrasonic amplitudes can be conducted from t = 4.6 s to t = 5.6 s.
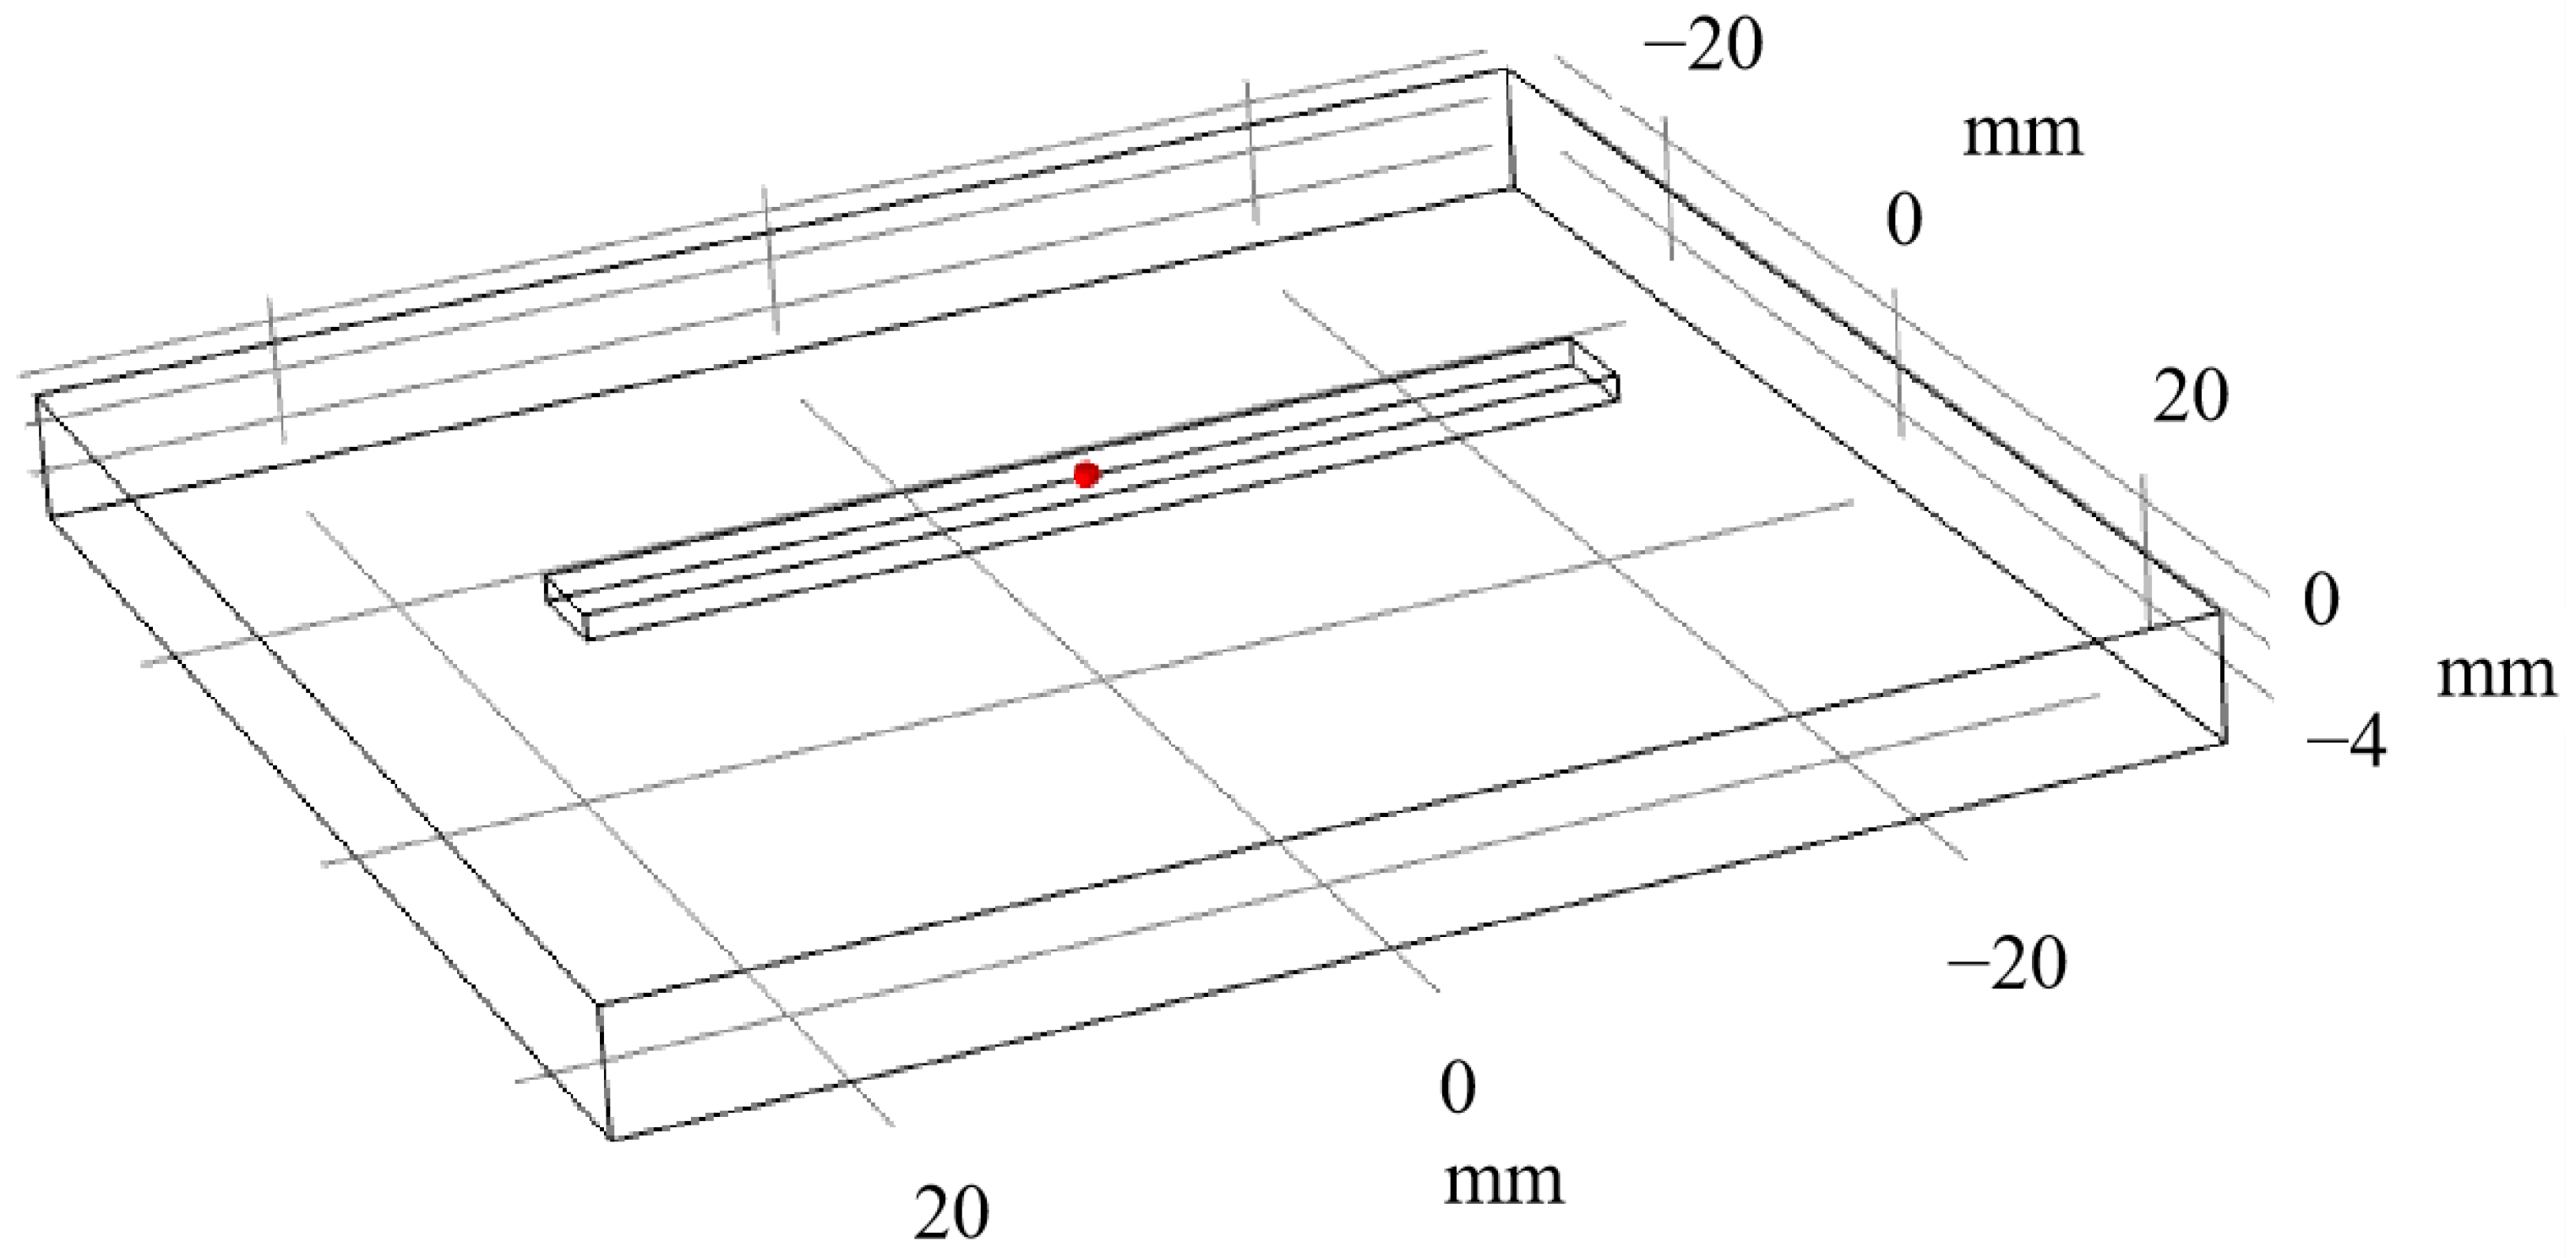
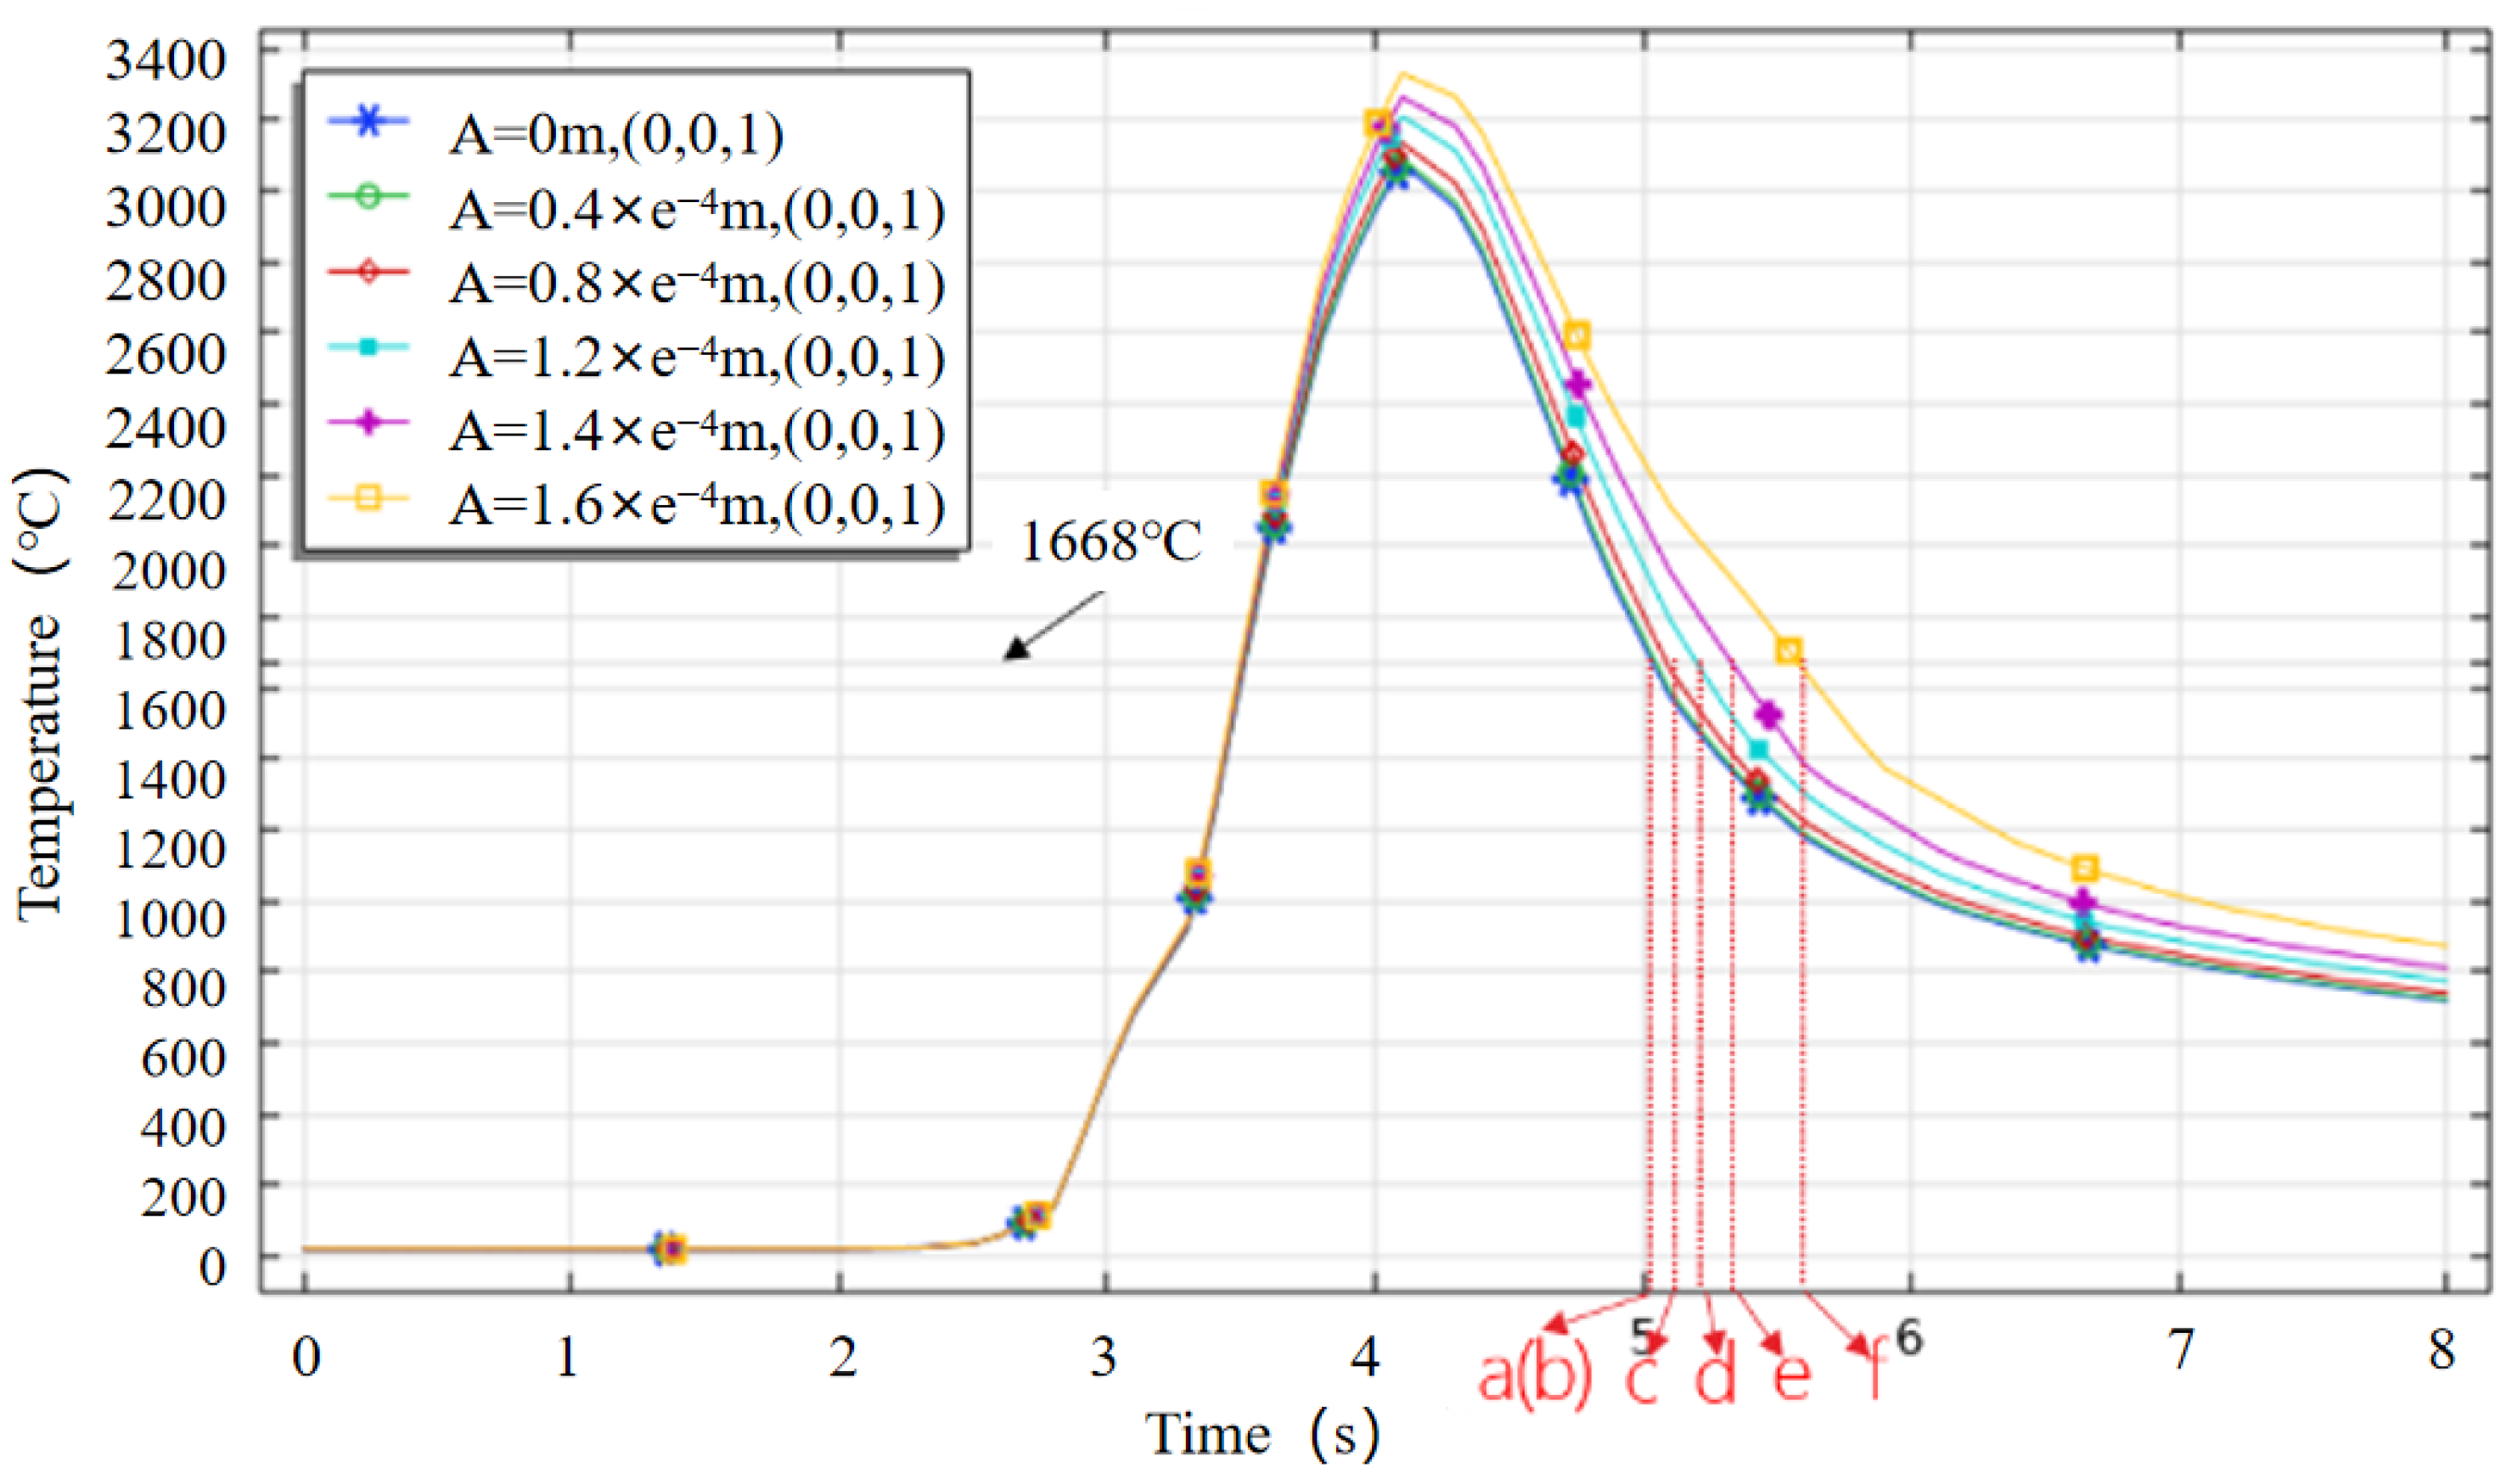
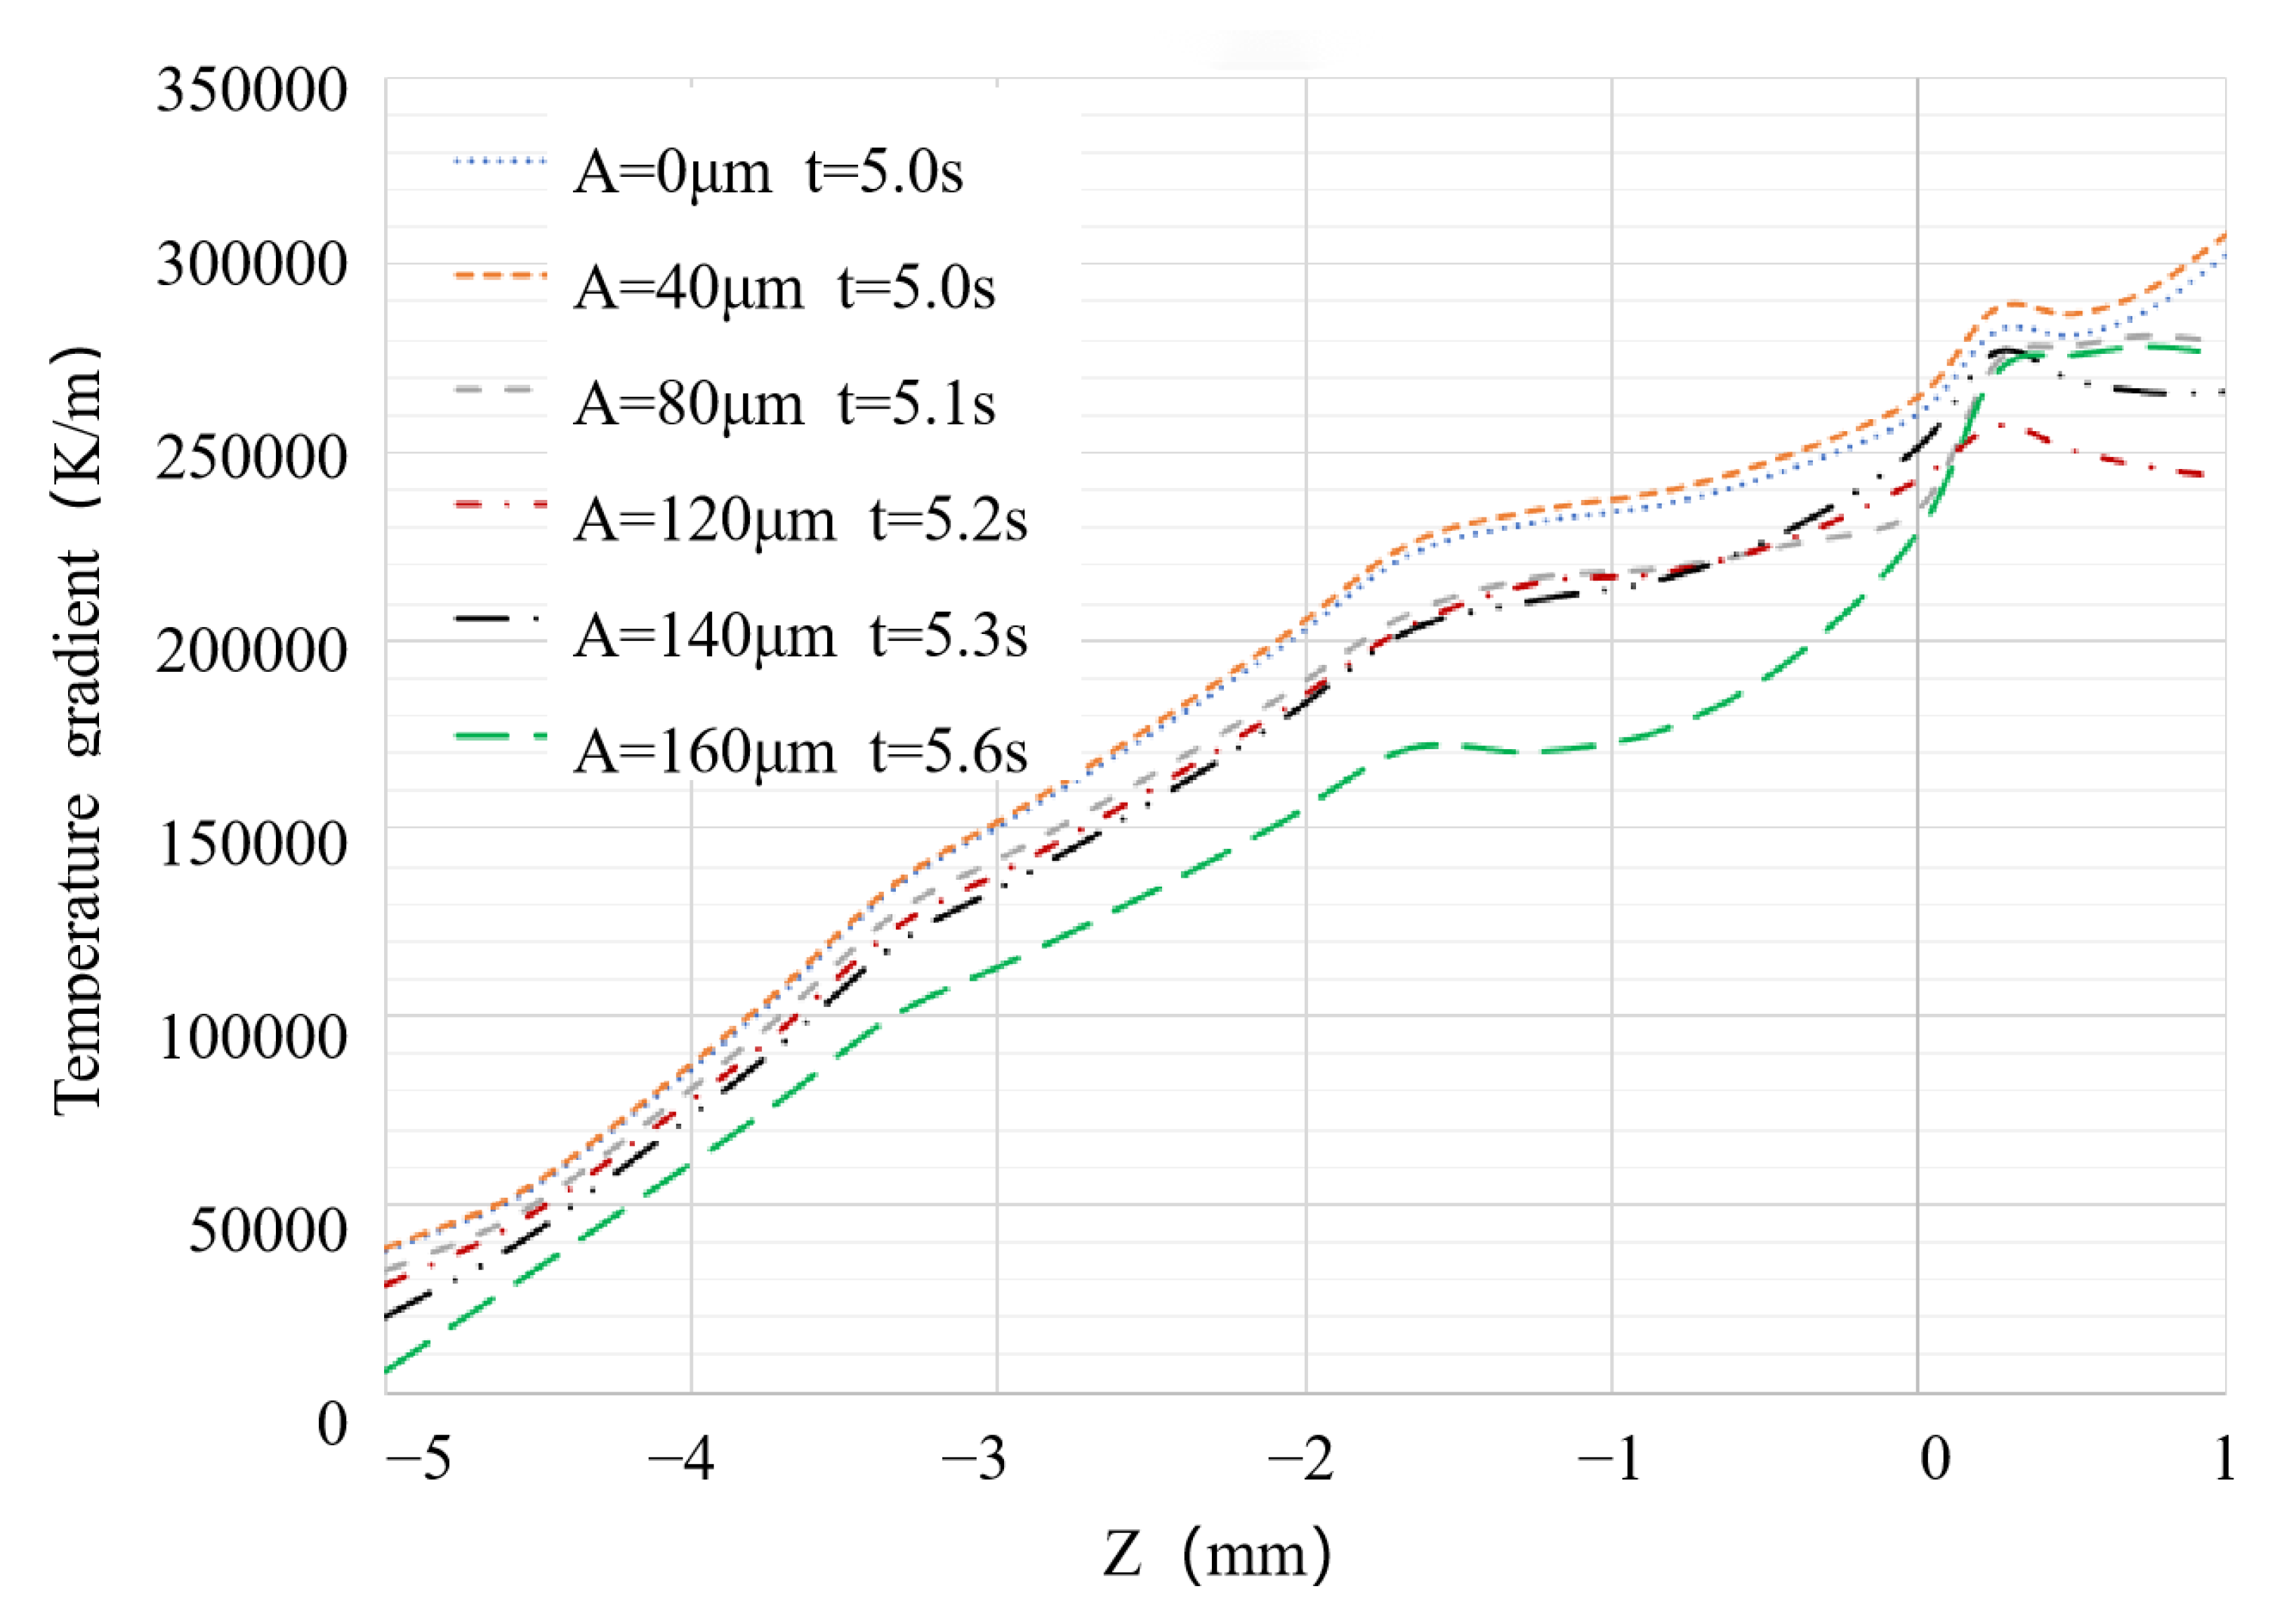
In order to more clearly compare the temperature gradients of the molten pool when it has just fully solidified under different ultrasonic amplitudes, the temperature distribution of the highest temperature point in the middle section (coordinates (0,0,1) are used, as shown in Figure 7) at different ultrasonic amplitudes and times is shown in Figure 8. The time interval for analyzing the temperature gradients is further reduced, and the time node for complete solidification of the molten pool in the middle section is determined. When the ultrasonic amplitude A = 0 and A = 40 μm, it completely solidifies at approximately t = 5.0 s, as shown in point ab in Figure 8; when A = 80 μm, it completely solidifies at t = 5.1 s, as shown in point c in Figure 8; when A = 120 μm, it completely solidifies at t = 5.2 s, as shown at point d in Figure 8; when A = 140 μm, it completely solidifies at t = 5.3 s, as shown in point e in Figure 8; when A = 160 μm, it completely solidifies at t = 5.6 s, as shown in point f in Figure 8.
The analysis of the temperature gradient of the molten pool when it has just fully solidified under different amplitudes is shown in Figure 9. It can be seen that when the ultrasonic amplitude A = 120 μm, the temperature gradient of additive manufacturing was smaller, which means that the temperature distribution was more uniform, which was more conducive to the uniform precipitation and deposition of crystals and the production of formed parts with better comprehensive performance. Therefore, the optimal ultrasonic vibration amplitude for this study was 120 μm.
4.3. Comparative Analysis of with and without Ultrasonic Assistance
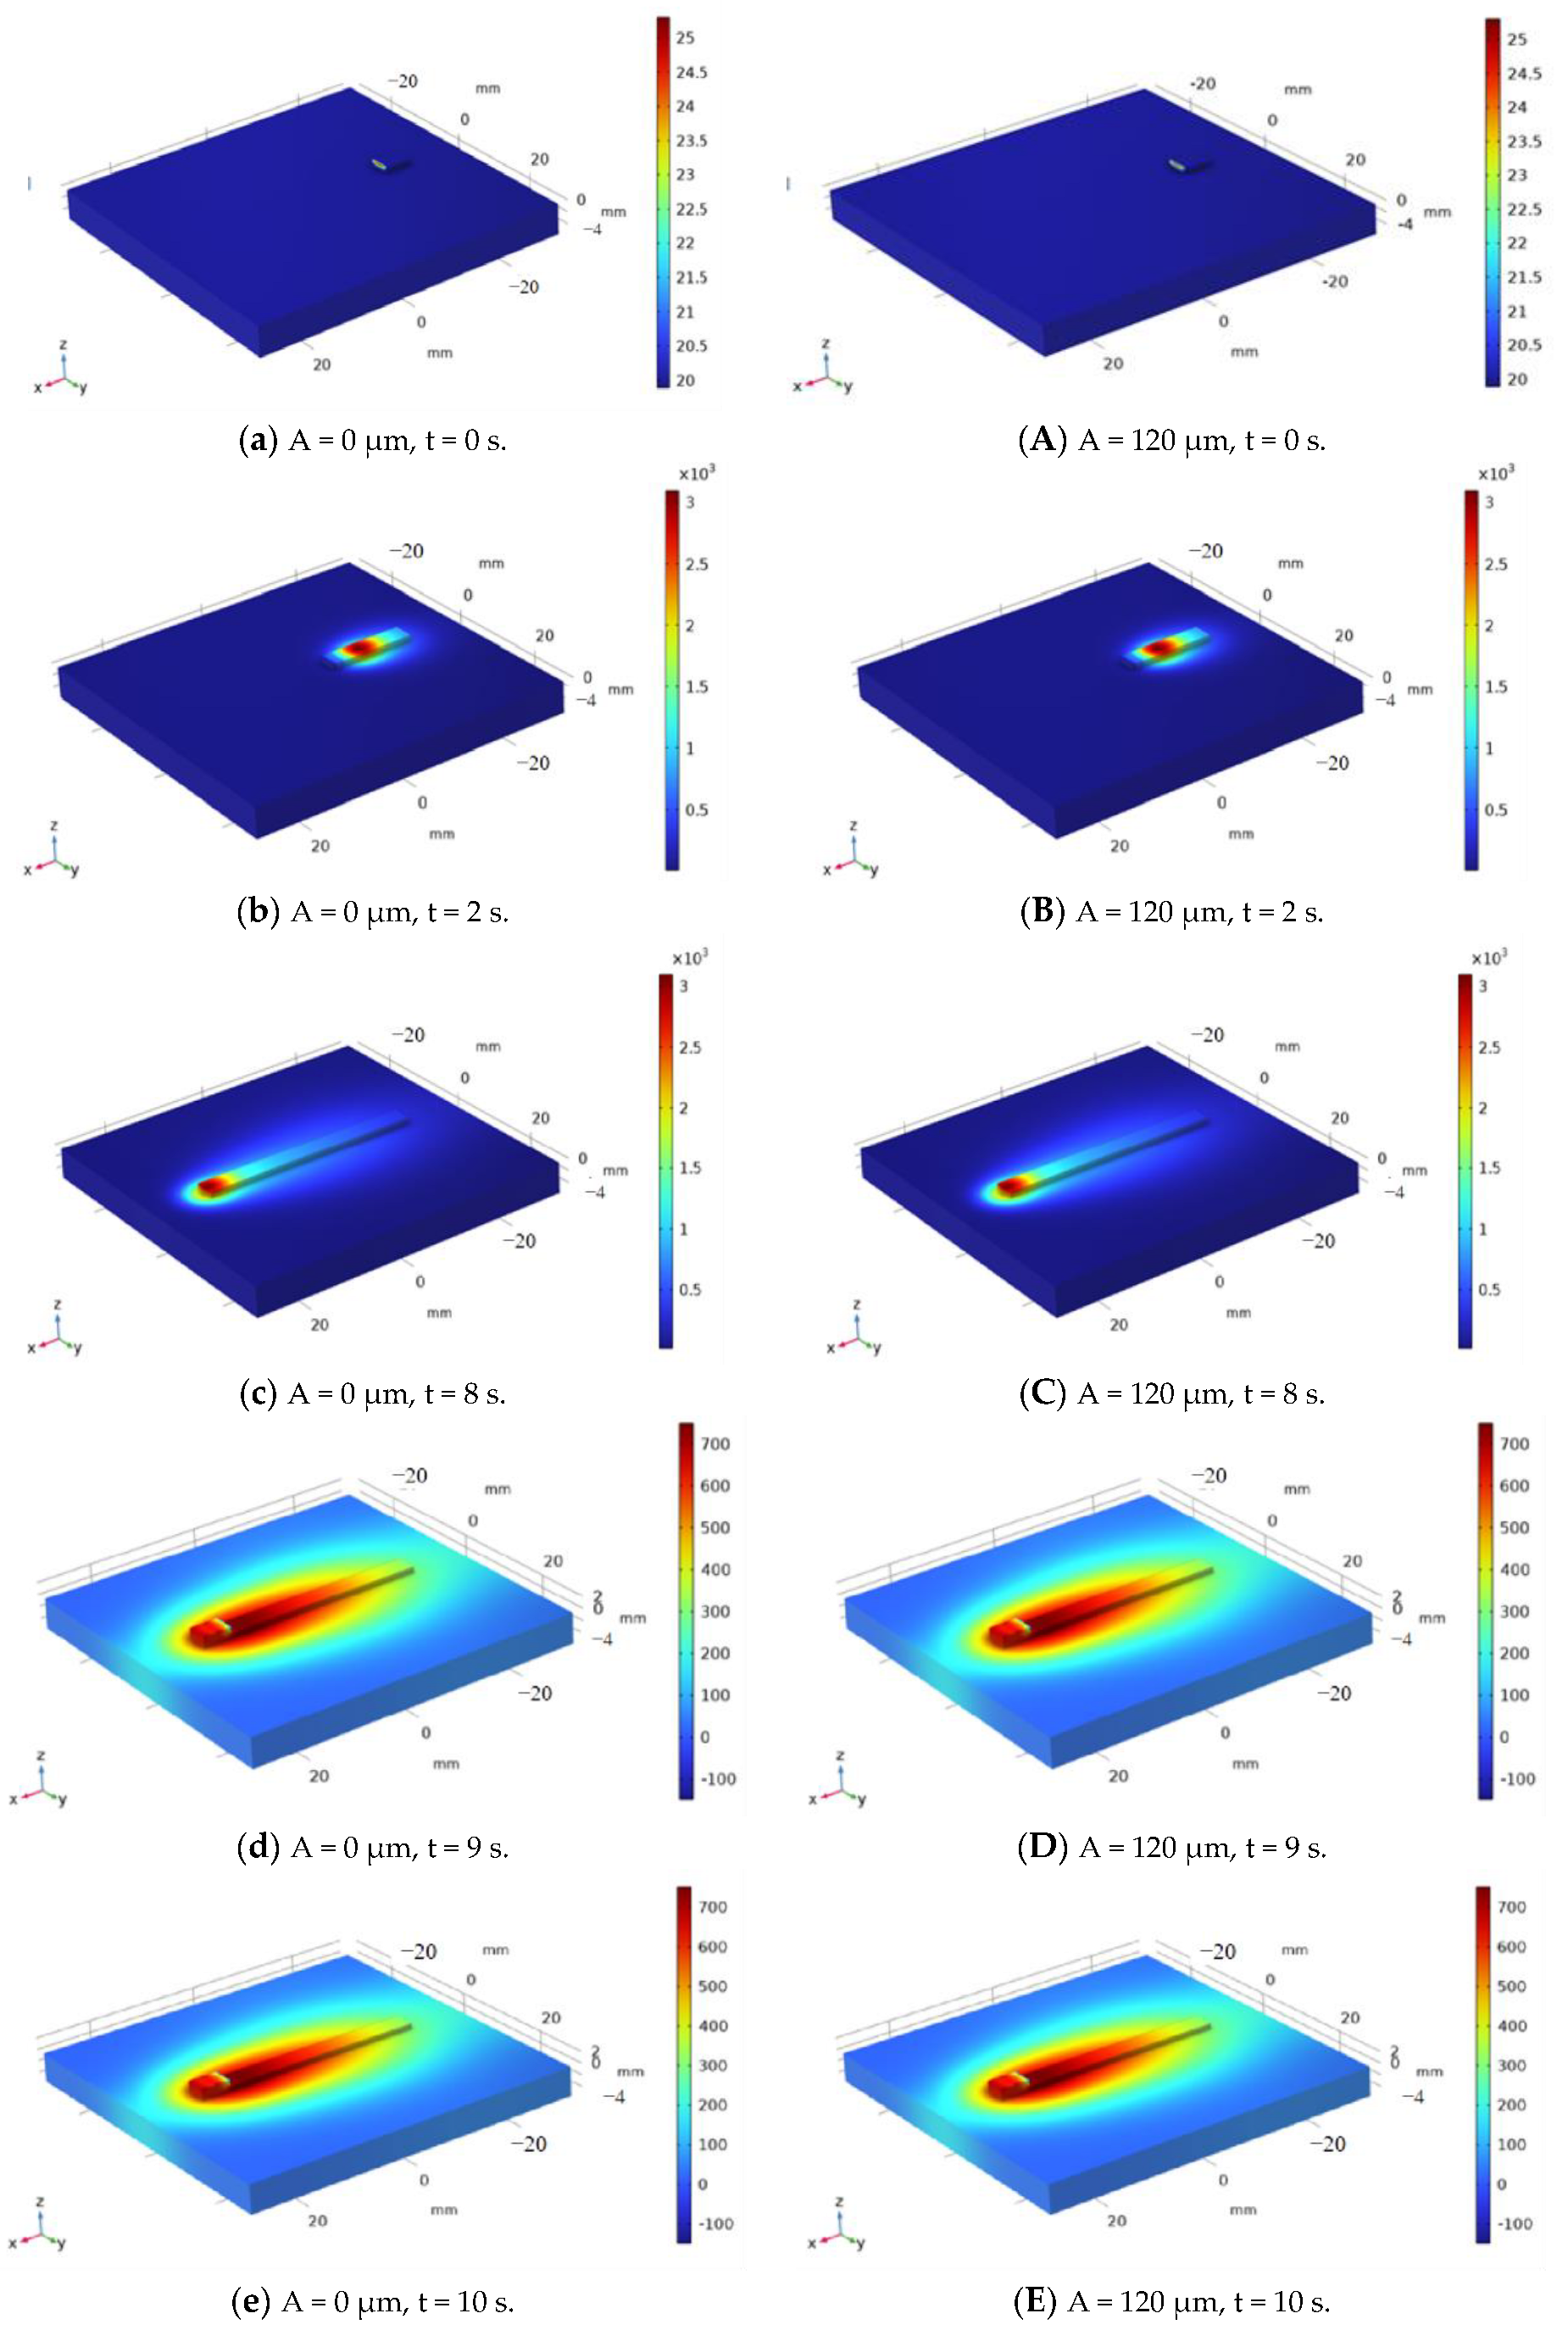
Figure 10 presents a comparative temperature distribution of different moments during the multi-layer printing process without ultrasonic vibration assistance (Figure 10a–i) and with an ultrasonic amplitude of 120 μm (Figure 10A–I). Figure 10a,A depict the initial state, where a 10 mm additive manufacturing material is pre-deposited in the simulation. Figure 10b,B show the gradual melting and deposition of the material as the laser source moves along the deposited filament after 2 s. It can be observed that the overall temperature distribution appears similar regardless of the presence or absence of ultrasonic vibration assistance. In Figure 10c,C, at t = 8 s, the first layer printing is completed, and the laser source temporarily stops heating. After 2 s, it resumes printing the second layer with a pre-deposited 10 mm filament, and the laser starts functioning at 10 s, as shown in Figure 10e,f,E,F. During this period, due to the pause in laser heating, the temperature in the printing area rapidly cools down, causing the first layer to solidify quickly, with most of the heat dissipating through the substrate, as depicted in Figure 10d,D. This process is repeated for layer-by-layer printing. Figure 10g–i and G–I present temperature contour maps for the second, third, and fourth layers when the ultrasonic amplitudes are 0 and 120 μm, respectively.
As the ultrasonic amplitude increases, the maximum temperature of the melt pool during the additive manufacturing process also increases to some extent, which is advantageous for material melting. The impact of ultrasonic vibration on the performance of additive manufactured components is mainly reflected after the metal is melted. During the solidification process, the influence of ultrasonic vibration on the precipitation and deposition behavior of grains within the melt pool becomes significant as the laser source moves away gradually.
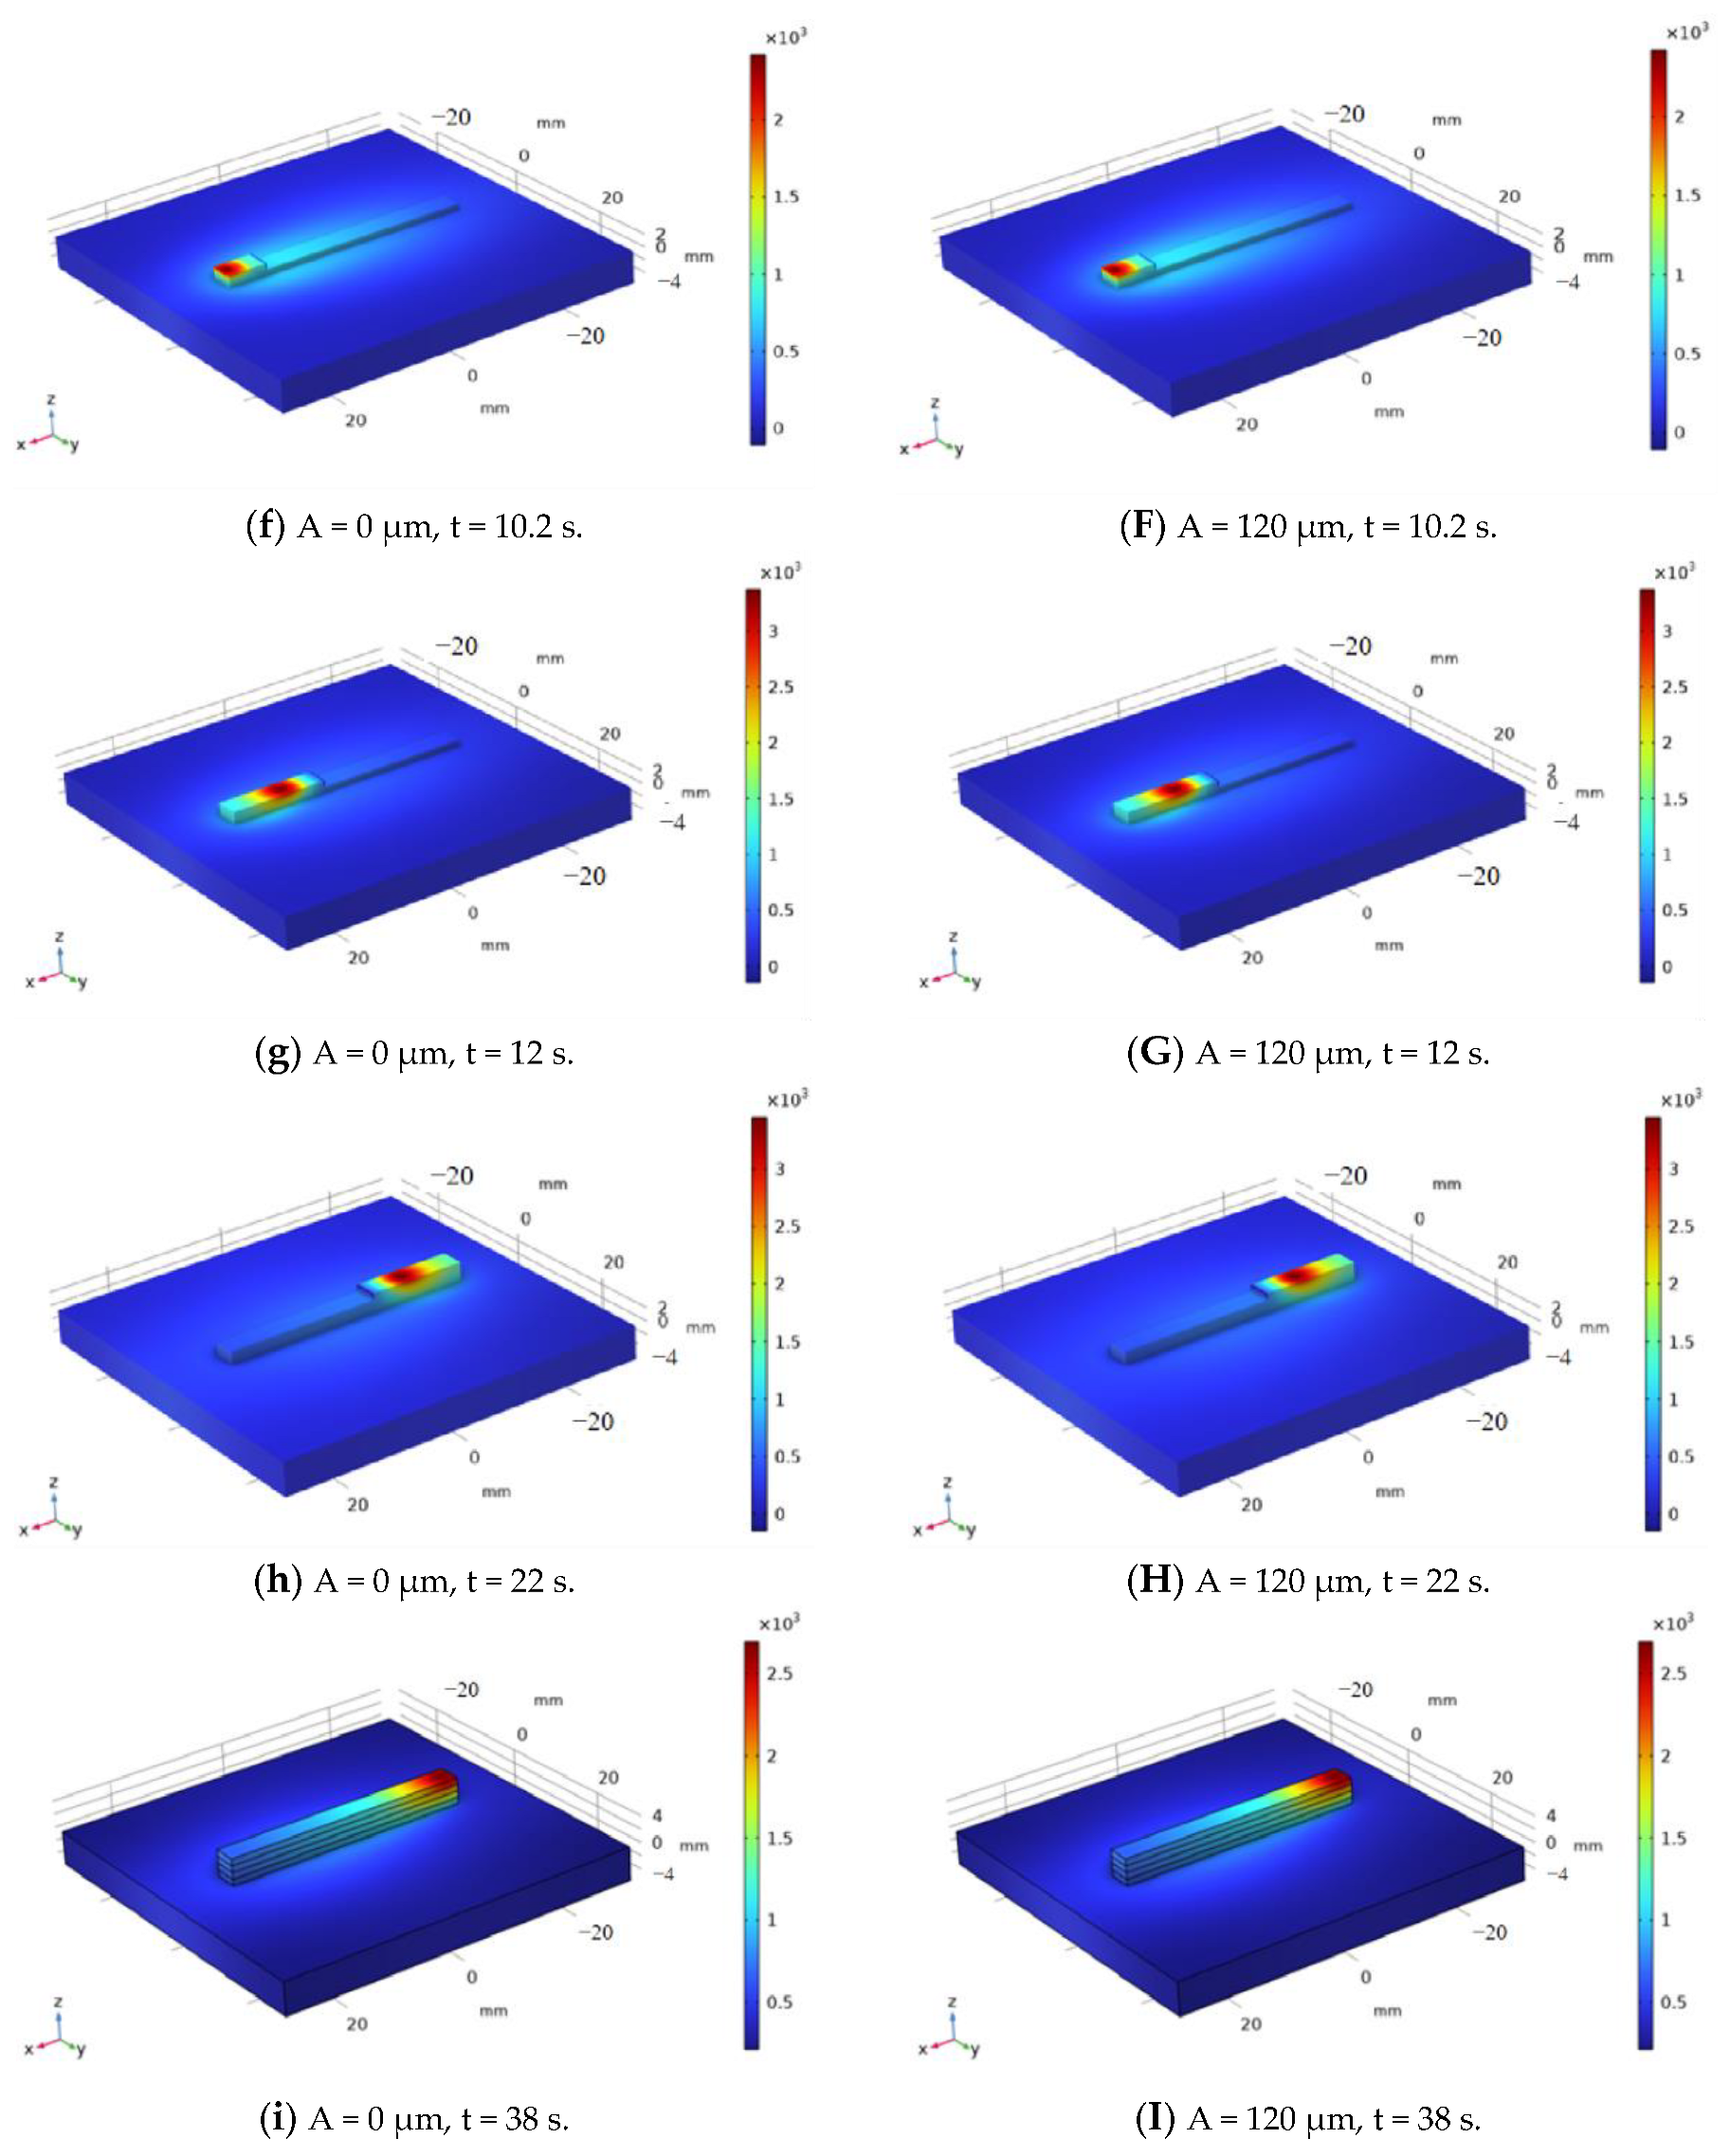
Figure 11 shows an isothermal surface plot at a specific moment during the printing of the third layer. It can be observed that, with the assistance of optimal ultrasonic vibration, the distribution of the isothermal surfaces becomes sparser, while the temperature is higher. This indicates that ultrasonic assistance reduces the temperature gradient within the melt pool and promotes a more uniform temperature distribution, which is beneficial for the stable crystallization of the metal and results in a more homogeneous microstructure.
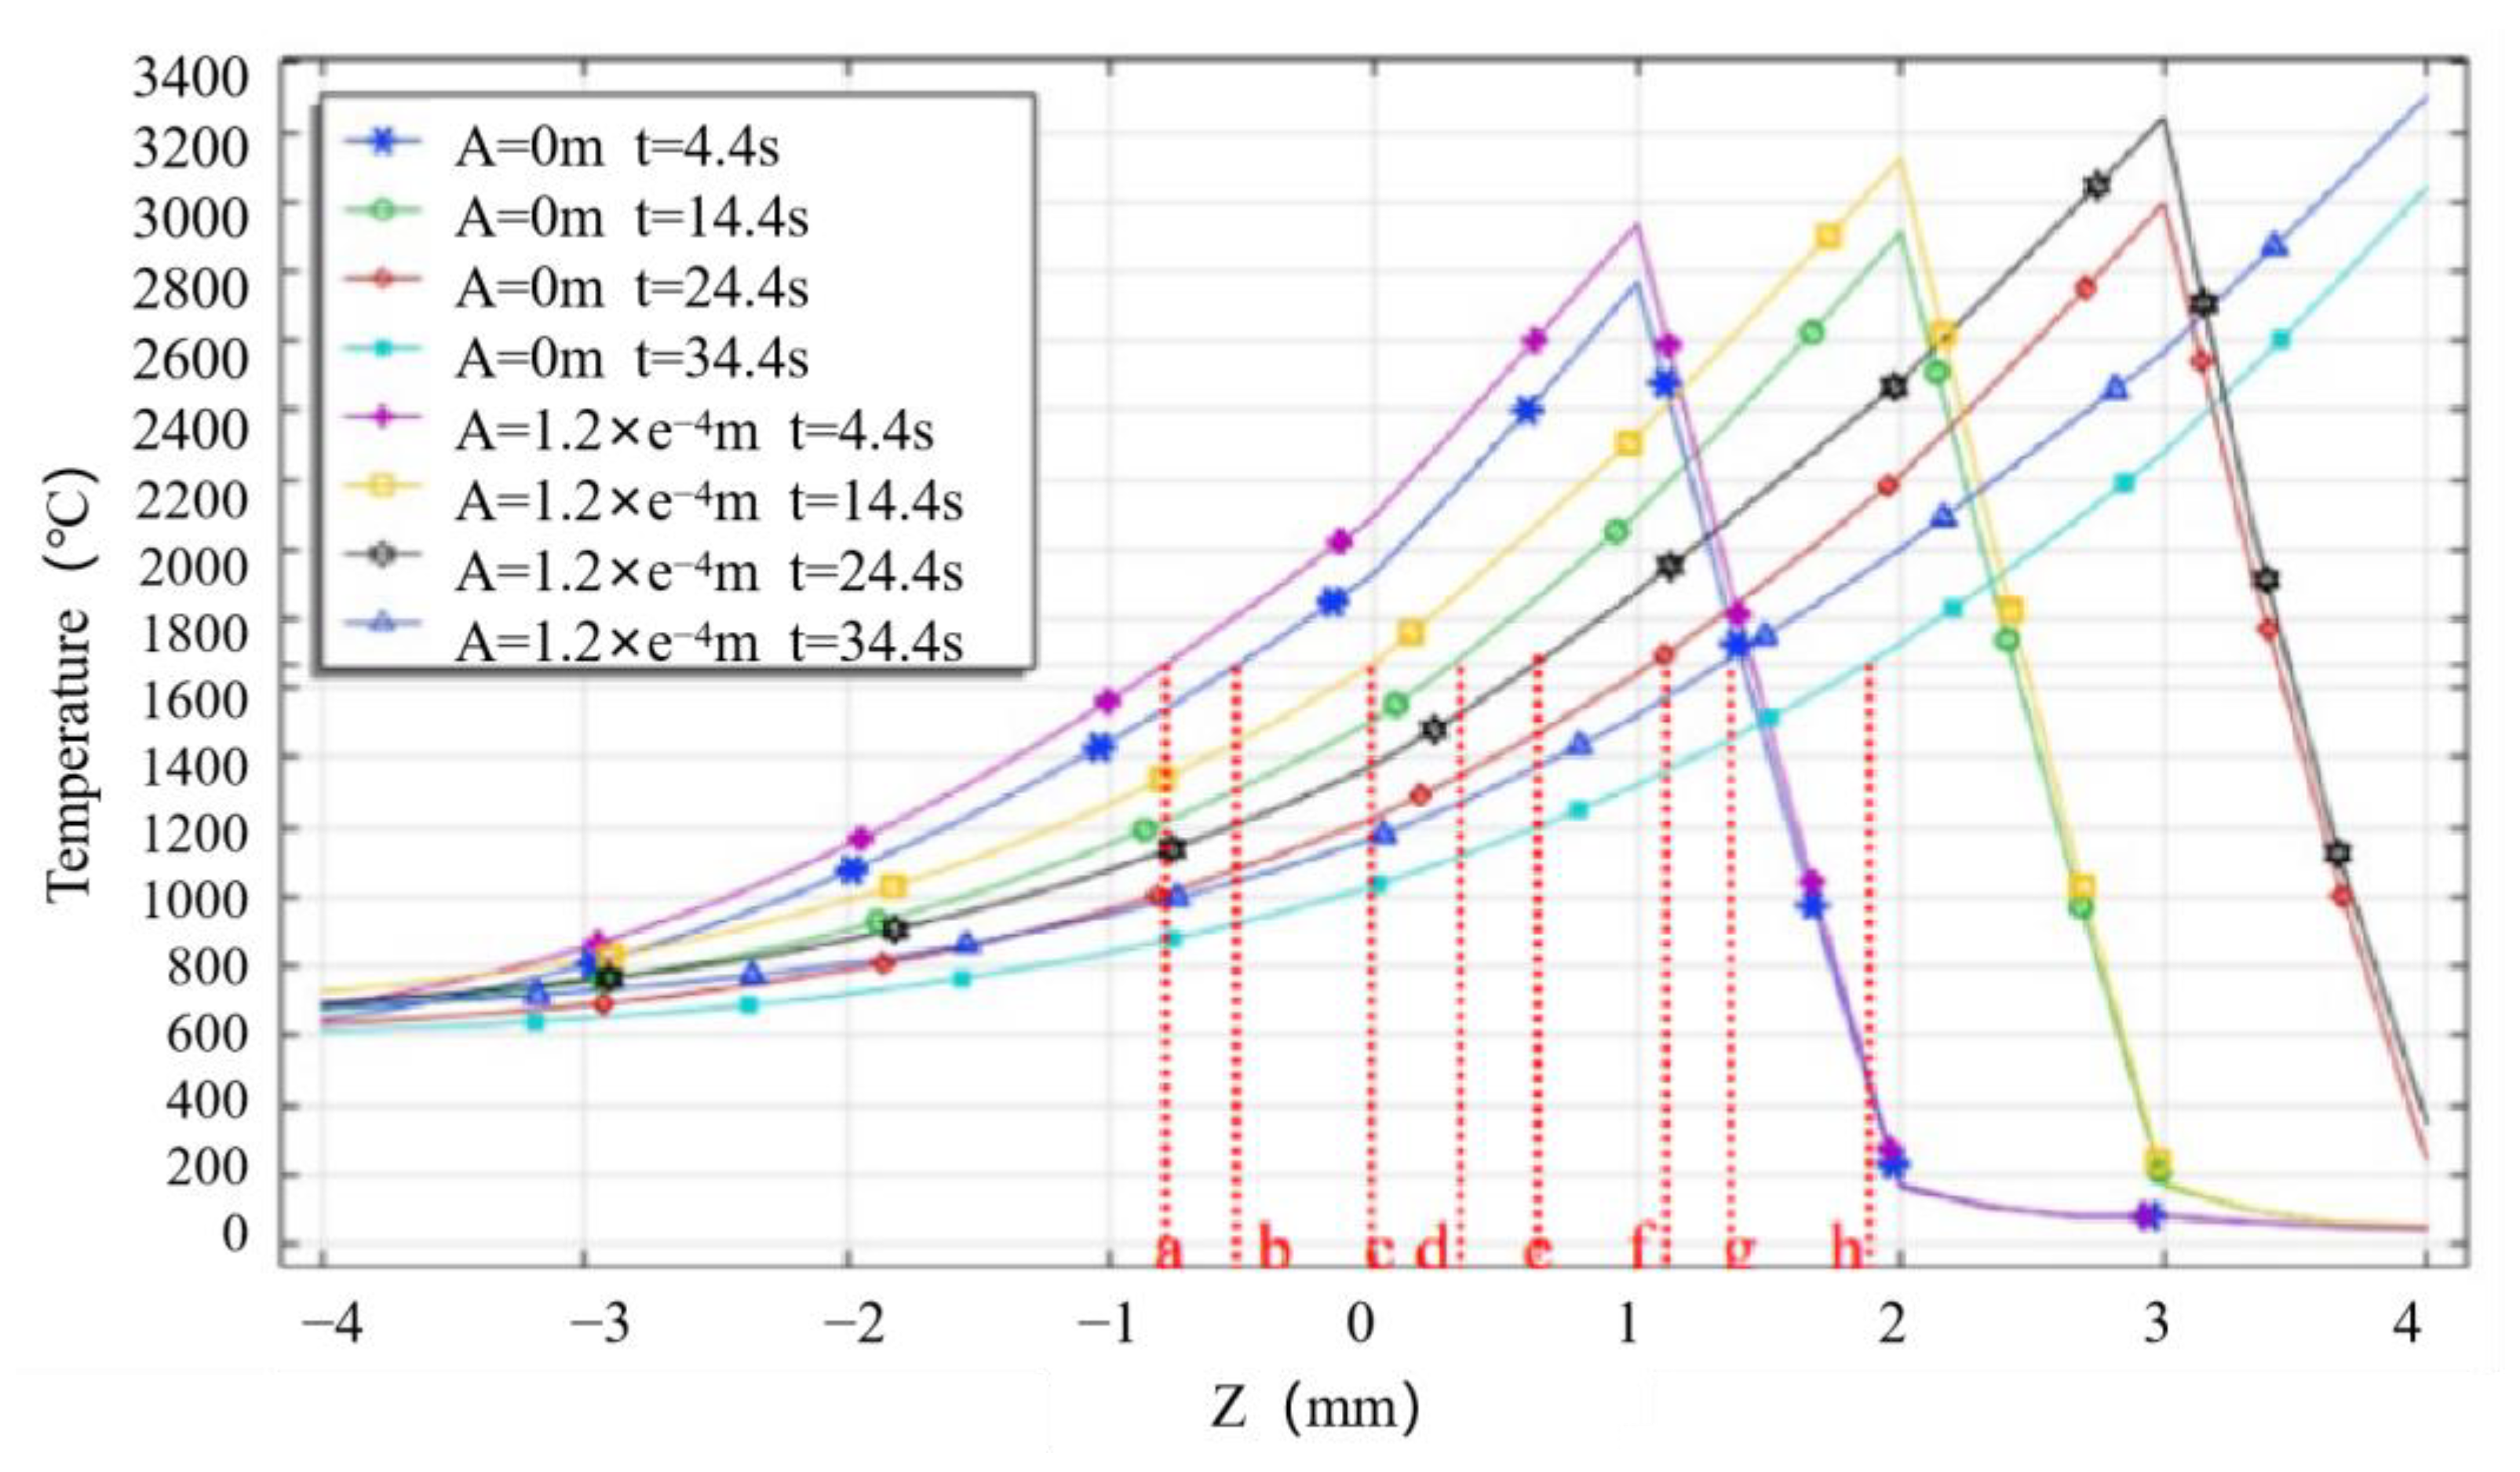
To further quantify the effect of ultrasonic vibration on temperature, the temperature variation along the Z-coordinate for different layers during printing was selected along the central axis, as shown in Figure 12. It is shown that the addition of ultrasonic assistance increases temperature during the printing of each layer. This effect is influenced by acoustic streaming heat and cavitations’ effects. The ultrasonic action deepens the fusion between layers during printing, leading to stronger bonding and improved quality of the formed component. The temperature distribution shown in Figure 12 demonstrates a cumulative effect causing temperatures to increase with the number of printed layers.
Consequently, when there are a higher number of layers, the temperature can become elevated, resulting in further deepening of the melt pool. This phenomenon can potentially hurt already solidified layers, thus compromising print quality, as observed at points e, h, and g in the figure. Therefore, it is advisable to reduce the laser power accordingly, with the optimal printing parameter being when the laser power is slightly below 1100 W.
Keeping the optimal laser power and feed rate parameters unchanged, without ultrasonic vibration, a parameter scan was conducted for different amplitudes of auxiliary ultrasonic vibration. The melt pool’s temperature field and temperature gradient distribution were calculated under each amplitude. Based on this analysis, the best parameters for ultrasonic-assisted additive manufacturing were selected, with the optimal ultrasound amplitude of approximately 120 μm. The analysis of multi-layer printing helped narrow down the range for the optimal processing parameters. Specifically, the ideal laser power for ultrasonic-assisted additive manufacturing should be distributed around 1100 W but should not exceed it.
The selection of the optimal ultrasonic amplitude was determined by equivalently introducing the energy of ultrasound as a heat source into the additive manufacturing model. The analysis focused on studying the temperature gradient changes during the solidification process of the melt pool with the addition of ultrasonic assistance, leading to the identification of the best ultrasonic amplitude. Under the optimal ultrasonic amplitude, the temperature gradient within the melt pool is minimized, and there are no sharp fluctuations in temperature. This advantageous condition helps reduce residual stresses in the additive manufactured components.
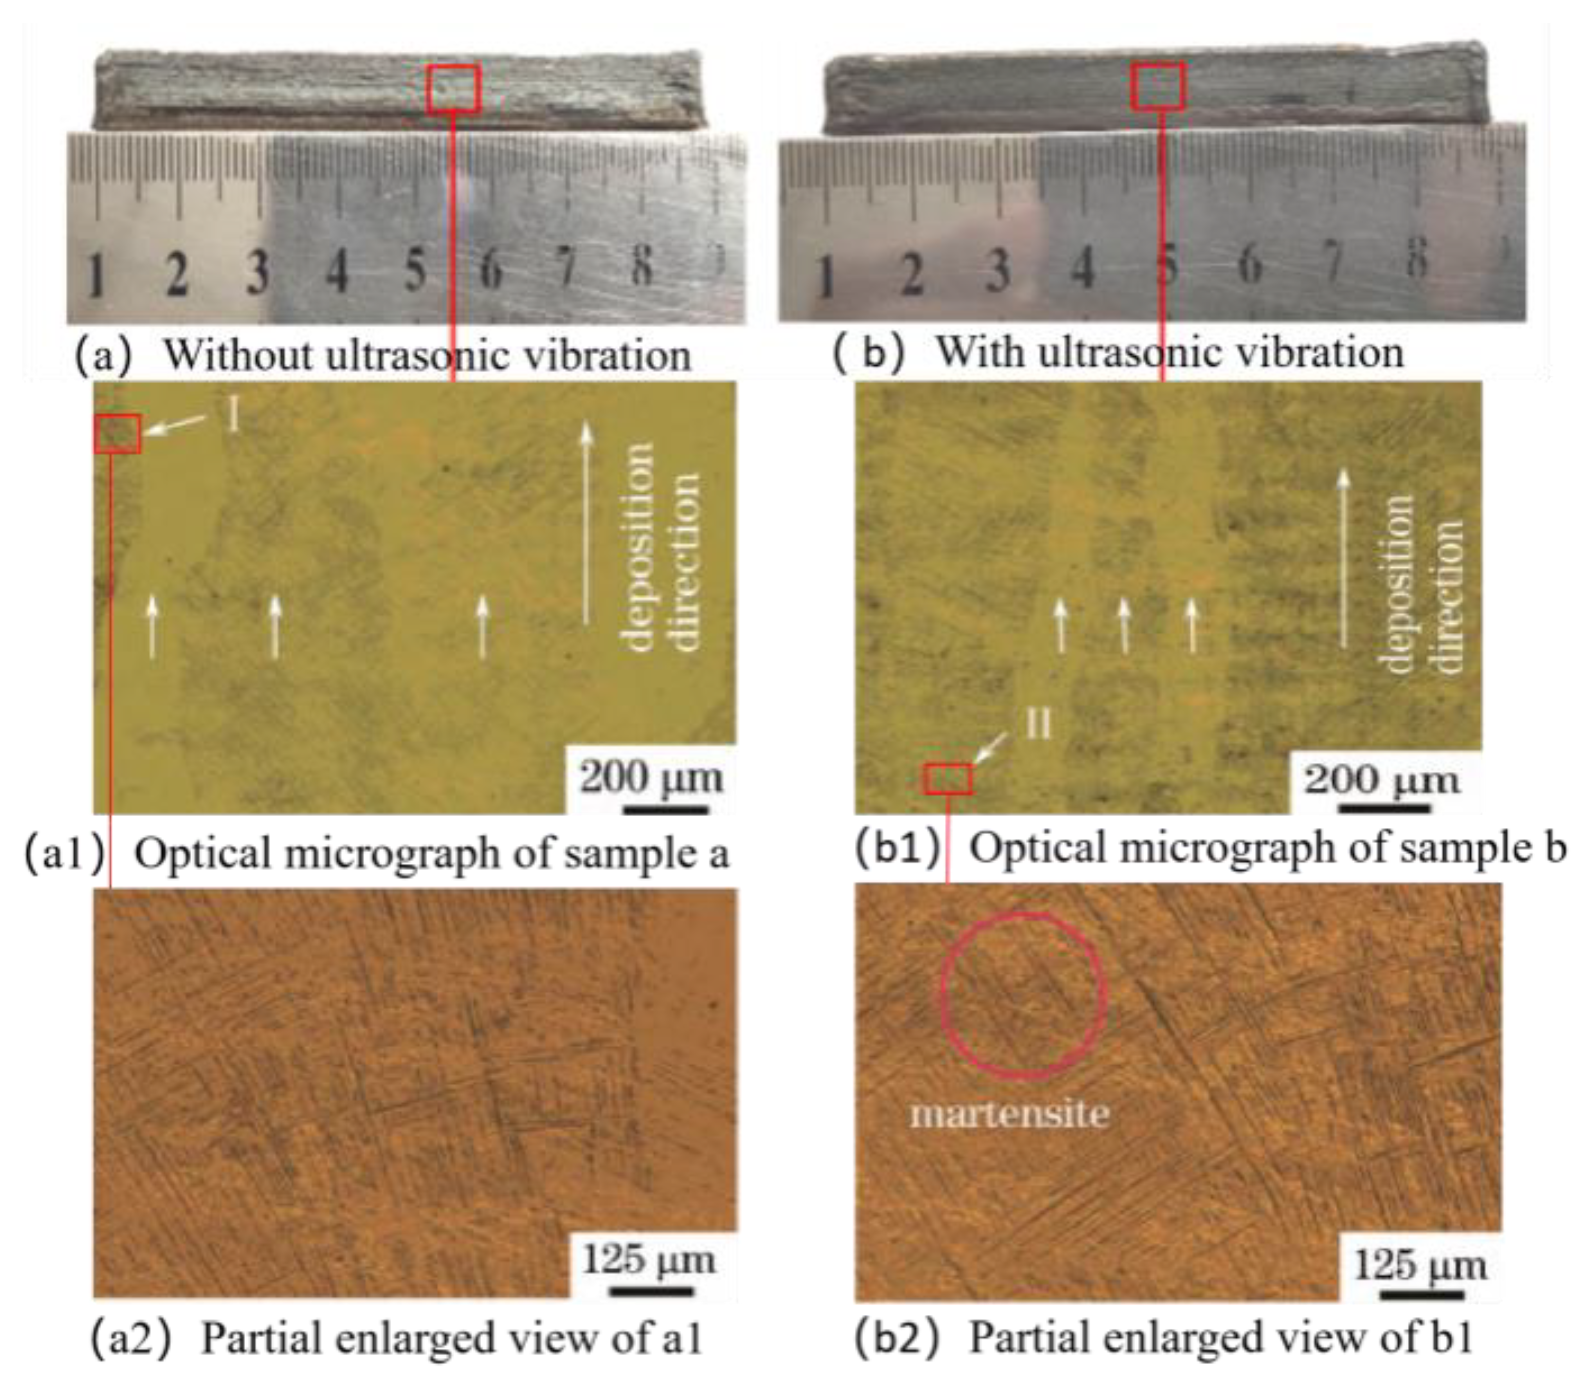
Figure 13 displays the micrograph of a single-pass component with and without ultrasonic-assisted additive manufacturing (as shown in Figure 13a,b). Comparing the parts without ultrasonic assistance, it can be observed that when the ultrasonic amplitude is set to 120 μm, the assisted-formed part exhibits smaller, more numerous, and relatively dispersed microstructures.
Figure 13a1,b1 show the β and the average width of columnar crystals, which is about 300 μm. After applying ultrasonic vibration, the average width of columnar crystals in formed part b decreases. This is because ultrasonic cavitation produces bubbles in the molten pool, and when cavitation bubbles collapse, high-pressure shock waves are generated in the melt, causing a significant increase in the solidification temperature of the local melt, effective under cooling, and nucleation rate, β. The columnar crystals are also refined.
During the solidification process of the molten pool, high temperatures will create a significant increase in the solidification temperature of the local melt, effective because the ultrasound actively dispersed the microstructure α′ phase. Under a high-power microscope, it can be seen that the β grains contain a large number of parallel or cross-distributed fine needle-like martensite α′ phase, as shown in Figure 13a2,b2 [6].
5. Conclusions
- (1)
- Under the conditions of the wire feeding rate of 5 mm/s, the laser scanning rate of 5 mm/s, and the ultrasonic frequency of 20 KHz, the optimal laser power for titanium alloy laser additive manufacturing with ultrasonic vibration assistance was around 1100 W, and the best ultrasonic amplitude was 120 μm.
- (2)
- Comparing the parts without ultrasonic assistance, it can be observed that when the ultrasonic amplitude is set to 120 μm, the ultrasound-assisted-formed part exhibits smaller, more numerous, and relatively dispersed microstructures. Under a high-power microscope, it can be seen that when the ultrasonic amplitude is set to 120 μm, there is a needle-like martensite α′ phase.
Author Contributions
Conceptualization, Z.Z. and C.X.; methodology, S.L.; software, Z.Z.; validation, W.L., Z.Z. and S.L.; formal analysis, Z.Z.; investigation, W.L.; resources, S.L.; data curation, C.X.; writing—original draft preparation, W.L.; writing—review and editing, C.X.; visualization, W.L.; supervision, C.X.; project administration, W.L.; funding acquisition, W.L. All authors have read and agreed to the published version of the manuscript.
Funding
Shaanxi Provincial Education Science “14th Five-Year Plan” 2022 project (SGH22Y1301); Shaanxi Province Qin Chuangyuan “scientist + Engineer” team construction project (2022KXJ-071); 2022 Qin Chuangyuan Achievement Transformation Incubation Capacity Improvement Project (2022JH-ZHFHTS-0012); Shaanxi Vocational Education Rural Revitalization Research Institute 2022 Annual Research project (22YB020); 2023 Scientific Research Project of Shaanxi National Defense Industry Vocational and Technical College (Gfy23-10); Shaanxi Province key research and Development Plan—“Two chains” integration key project—Qin Chuangyuan General Window Industrial Cluster project (2023QCY-LL-02).
Data Availability Statement
Not applicable.
Acknowledgments
Suli Li would like to thank Kaiyue Ma, Jie Xiong, Zhuang Gao, Cong Wang and Jingsheng Zhao for providing materials used for experiments and academic guidance.
Conflicts of Interest
The authors declare no conflict of interest.
References
- Gu, B. Application and Development Trends of Additive Manufacturing Technology at Home and Abroad. Met. Process. 2022, 3, 1–16. [Google Scholar]
- Lu, B.; Li, D.C. Development of Additive Manufacturing (3D Printing) Technology. Mach. Manuf. Autom. 2013, 42, 1–4. [Google Scholar]
- Li, Q.Q. Microstructure and Mechanical Properties of GH3039 Alloy Fabricated by Ultrasonic Micro Forging Assisted Laser Additive Manufacturing. Ph.D. Thesis, Nanchang University, Nanchang, China, 2021. [Google Scholar]
- Li, D.Y.; Zhang, J.; Zhao, L.Z.; Li, Y. Influence of Ultrasonic Frequency on Microstructure of Laser Cladding Solidified Organization Studied by Cellular Automata Method. Ordnance Mater. Sci. Eng. 2018, 41, 93–96. [Google Scholar] [CrossRef]
- Shen, Y.J.; Li, X.F.; Tang, L.P. Effect of Ultrasonic Power on Microstructure and Properties of Laser Cladding WC Reinforced Fe-Based Composite Coating. Heat Treat. Met. 2018, 43, 168–172. [Google Scholar]
- Zhang, A.F.; Fu, T.; Wang, T.; Liang, C.Y. Influence of Ultrasonic Vibration on Microstructure and Properties of Ti6Al4V Alloy during Laser Cladding and Solution Aging. China Laser 2018, 45, 85–90. [Google Scholar]
- Wang, Y.L.; Liu, S.Y.; Zhang, X.Y.; Liu, Y.W.; Li, R.C. Experimental and Analytical Study on Laser Cladding 3540Fe/CeO_2 Coating Assisted by Ultrasonic Vibration. China Mech. Eng. 2018, 29, 2600–2605. [Google Scholar]
- Todaro, C.J.; Easton, M.A.; Qiu, D.; Brandt, M.; StJohn, D.H.; Qian, M. Grain refinement of stainless steel in ultrasound-assisted additive manufacturing. Addit. Manuf. 2021, 37, 101632. [Google Scholar] [CrossRef]
- Li, C.; Wang, Y.; Jiang, F.; An, X.; Zhang, J. Effect of ultrasonic assistance on mechanical properties of laser cladding Al2O3-ZrO2 ceramic coatings. Surf. Technol. 2019, 49, 309–319. (In Chinese) [Google Scholar]
- Yan, Z.; Trofimov, V.; Song, C.; Han, C.; Yang, Y.; Yang, C.; Xiao, Y.; Deng, Z.; Chen, J. Microstructure and mechanical properties of GH5188 superalloy additively manufactured via ultrasonic-assisted laser powder bed fusion. J. Alloys Compd. 2023, 939, 168771. [Google Scholar] [CrossRef]
- Thiemann, A.; Nowak, T.; Mettin, R.; Holsteyns, F.; Lippert, A. Characterization of an acoustic cavitation bubble structure at 230 kHz. Ultrason. Sonochemistry 2016, 18, 595–600. [Google Scholar] [CrossRef] [PubMed]
- Ji, F.; Hu, Z.; Qin, X.; Ni, M.; Xiong, X.; Liu, G. Improving microstructure and mechanical properties of thin-wall part fabricated by wire arc additive manufacturing assisted with high-intensity ultrasound. J. Mater. Sci. 2023, 58, 2381–2395. [Google Scholar] [CrossRef]
- Alan, F.; Bart, R. Ultrasound directed self-assembly of filler in continuous flow of a viscous medium through an extruder nozzle for additive manufacturing. Addit. Manuf. Lett. 2023, 5, 100120. [Google Scholar]
- Zhou, Y.; Jiang, F.; Wang, Z.; Chen, J. Microstructure characteristics and mechanical properties of Cu/Al laminated metal composites fabricated by electropulsing assisted ultrasonic additive manufacturing. J. Mater. Process. Technol. 2023, 313, 117884. [Google Scholar] [CrossRef]
Figure 1.
Principle of additive manufacturing and actual vibration load application method.

Figure 2.
Experimental device.

Figure 3.
Temperature distribution cloud map during additive manufacturing assisted by different ultrasonic amplitudes.
Figure 3.
Temperature distribution cloud map during additive manufacturing assisted by different ultrasonic amplitudes.

Figure 4.
Temperature distribution in the middle section under different amplitudes.

Figure 5.
Temperature variation curve of the lowest temperature point between lower layers with different amplitudes over time.
Figure 5.
Temperature variation curve of the lowest temperature point between lower layers with different amplitudes over time.

Figure 6.
Temperature variation curve of the highest point of body temperature with time under different amplitudes.
Figure 6.
Temperature variation curve of the highest point of body temperature with time under different amplitudes.

Figure 7.
The position of the highest temperature point in the middle section of Figure 7, coordinates (0,0,1).
Figure 7.
The position of the highest temperature point in the middle section of Figure 7, coordinates (0,0,1).

Figure 8.
Temperature variation of the highest point of body temperature with time under different ultrasonic amplitudes (Picture a = b = 5.0; c = 5.1 s; d = 5.2 s; e = 5.3 s; f = 5.6 s).
Figure 8.
Temperature variation of the highest point of body temperature with time under different ultrasonic amplitudes (Picture a = b = 5.0; c = 5.1 s; d = 5.2 s; e = 5.3 s; f = 5.6 s).

Figure 9.
Temperature gradient of molten pool at exactly complete solidification under different ultrasonic amplitudes.
Figure 9.
Temperature gradient of molten pool at exactly complete solidification under different ultrasonic amplitudes.

Figure 10.
Comparison of simulated temperature distribution for multi-layer printed ultrasound with amplitudes of 0 and 120 μm.
Figure 10.
Comparison of simulated temperature distribution for multi-layer printed ultrasound with amplitudes of 0 and 120 μm.


Figure 11.
Comparison diagram of temperature contour distribution.

Figure 12.
Comparison of axis temperature of additive manufacturing center with and without ultrasonic vibration at different times.
Figure 12.
Comparison of axis temperature of additive manufacturing center with and without ultrasonic vibration at different times.

Figure 13.
Comparative analysis of microstructure in additive manufacturing with or without ultrasound assistance.
Figure 13.
Comparative analysis of microstructure in additive manufacturing with or without ultrasound assistance.


| Name | Expression | Value | Sign |
|---|---|---|---|
| Laser scanning speed | 5 [mm/s] | 0.005 m/s | v0 |
| Wire feeding rate | 5 [mm/s] | 0.005 m/s | v |
| Time to print one layer × 1/2 | 16 s | period | |
| Emissivity (material-dependent) | 0.8 | 0.8 | emissivity |
| Heat-transfer coefficient | 10 [W/(m2K)] | 10 W/(m2K) | h |
| Laser power | 1100 [W] | 1100 W | p0 |
| Ultrasonic frequency | 20 [KHz] | 20,000 Hz | f |
| The Propagation speed of ultrasound in the substrate | 5400 [m/s] | 5400 m/s | c |
| Ultrasonic amplitude | 0 [μm] 40 [μm] 80 [μm] 120 [μm] 140 [μm] 160 [μm] | 0 μm 40 μm 80 μm 120 μm 140 μm 160 μm | A |
Disclaimer/Publisher’s Note: The statements, opinions and data contained in all publications are solely those of the individual author(s) and contributor(s) and not of MDPI and/or the editor(s). MDPI and/or the editor(s) disclaim responsibility for any injury to people or property resulting from any ideas, methods, instructions or products referred to in the content. |
© 2023 by the authors. Licensee MDPI, Basel, Switzerland. This article is an open access article distributed under the terms and conditions of the Creative Commons Attribution (CC BY) license (https://creativecommons.org/licenses/by/4.0/).
Share and Cite
MDPI and ACS Style
Liu, W.; Zhang, Z.; Li, S.; Xu, C. The Research on Ultrasonic Vibration Amplitudes in Ti6Al4V DED Additive Manufacturing. Alloys 2023, 2, 256-270. https://0-doi-org.brum.beds.ac.uk/10.3390/alloys2040018
AMA Style
Liu W, Zhang Z, Li S, Xu C. The Research on Ultrasonic Vibration Amplitudes in Ti6Al4V DED Additive Manufacturing. Alloys. 2023; 2(4):256-270. https://0-doi-org.brum.beds.ac.uk/10.3390/alloys2040018
Chicago/Turabian StyleLiu, Wei, Zhenchao Zhang, Suli Li, and Chao Xu. 2023. "The Research on Ultrasonic Vibration Amplitudes in Ti6Al4V DED Additive Manufacturing" Alloys 2, no. 4: 256-270. https://0-doi-org.brum.beds.ac.uk/10.3390/alloys2040018